Study of Road Holding and Ride Comfort of Half Car Model ...
11
ISSN: 2455-2631 © November 2020 IJSDR | Volume 5 Issue 11 IJSDR2011035 International Journal of Scientific Development and Research (IJSDR) www.ijsdr.org 231 Study of Road Holding and Ride Comfort of Half Car Model using Mathematical Modelling 1 Akanksha Tiwari, 2 Shivnanda Bhavikatti 1 Student – Masters of Technology, 2 Associate Professor 1 Department of Mechanical Engineering – Automotive Technology, 1,2 College of Engineering Pune, Pune, India Abstract: Suspension systems are provided in an automobile with the purpose of isolating the vibrations that occur due to road disturbances, which in turn improves the road holding and ride comfort. A half car model which consists of half of vehicle mass, front as well as rear suspension system modeled as spring and damper combination, is a useful tool in studying the road holding and ride comfort of a vehicle. Effect of various parameters such as front spring stiffness, rear spring stiffness, front damping co-efficient, rear damping co-efficient and tire stiffness values are analyzed on road holding and ride comfort of half car model using Matlab SIMULINK and mathematically modeled as state-space equation. Index Terms: road holding, ride comfort, half car model, matlab, matlab simulink, state-space equation. I. INTRODUCTION A suspension system separates the car body from the wheels of the car. It consists of tires, tire air, springs, shock absorbers and linkages that connects a vehicle to its wheels and allows relative motion between the two. Every automobile suspension system is designed with the purpose of providing passenger comfort and vehicle control. Numerous types of suspension system types such as passive suspension, semi-active suspension and active suspension are used. Usually dynamic response of a car is carried out with the help of full car model, half-car-model and quarter car model. Considering a full car model for study of behavior response of car under motion to various road irregularities is tedious and difficult. Half -car models are extensively used in automotive engineering due to their simplicity and provide the qualitatively correct information, better than the quarter car model. The half car model of 4 DOF consists of front and rear wheel and its attachments, the tires, springs and dampers, half portion of the chassis and rigidly connected part. A simple measure for ride comfort is the root mean square (rms) value of the vertical chassis acceleration. The road holding is measured by the difference in the wheel displacement and the input profile amplitude. The effect of changing the values of various suspension system parameters states better or deteriorated performance in terms of road holding and ride comfort [1-8]. II. LITERATURE SURVEY In the paper “Parameters Affecting Vehicle Ride Comfort using Half Vehicle Model” by A. M. A. Soliman, S. M. Moustafa and A. O. M. Shogae, an investigation of ride behavior is done with the help of half car model for active and passive suspension system. The influence of spring stiffness, damping coefficient and tire stiffness on ride comfort is studied. A speed of 20m/s or 72kmph was considered and spectral road profile was considered. It was observed that on increasing the damping the ride comfort decreases, on increasing the front and rear suspension values the ride comfort deteriorates. On the other hand, on increasing the tire stiffness, the ride comfort deteriorates. Also when, the body mass is increased, the ride comfort improves. Also the comparison and active and passive suspension system is done it is observed that the active suspension system gives worthwhile improvement in terms of ride comfort compared with the conventional passive one. This paper also studies the effect of antiroll bar on the overall ride comfort level which is found to be increasing. Using the suitable anti-roll stiffness, spring stiffness, tire stiffness and damping coefficient are required for improving ride comfort. [1]. In the paper “Mathematical Modeling in Vehicle Ride Dynamics” by Saurav Talukdar, Anupam Mazumdar, Murukesh Mullasseril, Karuna Kalita and Aditya Ujjwal, mathematical modelling of quarter car model and half car model is done in order to study the effect of ride quality of a vehicle using passive and semi-active suspension system. Also ‘the flexible ring tire model’ is discussed to encounter the spring and damper properties of tire appropriately. A random excitation is provided to these mathematical models developed and the ride comfort is studied. The semi-active suspension system tries to avoid the tradeoff between the three performance parameters - transmissibility, suspension travel and road-holding simultaneously by introducing an adjustable damping and stiffness value. It was observed that the settling time of the acceleration and displacement is reduced by 50% with the use of semi-active PI controller based suspension system. The flexible 2 DoF half car model shows significant differences in the impulse response as compared to the 2 DoF rigid half car model. The peak values predicted by the rigid model are about 60% higher than the flexible model. The effect of tire flexibility is at high frequencies. The paper presents 6 the variation of various vehicle body parameters like DDI variation, spring, damper, tire stiffness, unsprung and sprung mass variation on road holding and ride comfort. [2] In the paper “Vehicle Ride Comfort and Stability Performance Evaluation” by Shawky Hegazy and Corina Sandu, the author does a comprehensive study of 3 passives and one readjust able shock absorber to study their performance on vehicle ride and stability. The study was carried with the help of quarter and half car model in ADAMS and MATLAB. The paper studies the effect of various parameters such as stiffness ratio and mass ratio. The input given is a step and sinusoidal profile 40mm in amplitude and frequency of 1Hz and 6Hz. Mass ratio is defined as the ratio of sprung mass to unsprung mass. It was found that lighter mass ratio, gives more ride comfortable. On the other hand, the control value is decreased, so road holding becomes worse. Similarly, stiffness ratio is
Transcript of Study of Road Holding and Ride Comfort of Half Car Model ...

ISSN: 2455-2631 © November 2020 IJSDR | Volume 5 Issue 11
IJSDR2011035 International Journal of Scientific Development and Research (IJSDR) www.ijsdr.org 231
Study of Road Holding and Ride Comfort of Half Car
Model using Mathematical Modelling
1Akanksha Tiwari, 2Shivnanda Bhavikatti
1Student – Masters of Technology, 2Associate Professor 1Department of Mechanical Engineering – Automotive Technology,
1,2College of Engineering Pune, Pune, India
Abstract: Suspension systems are provided in an automobile with the purpose of isolating the vibrations that occur due to
road disturbances, which in turn improves the road holding and ride comfort. A half car model which consists of half of
vehicle mass, front as well as rear suspension system modeled as spring and damper combination, is a useful tool in studying
the road holding and ride comfort of a vehicle. Effect of various parameters such as front spring stiffness, rear spring
stiffness, front damping co-efficient, rear damping co-efficient and tire stiffness values are analyzed on road holding and
ride comfort of half car model using Matlab SIMULINK and mathematically modeled as state-space equation.
Index Terms: road holding, ride comfort, half car model, matlab, matlab simulink, state-space equation.
I. INTRODUCTION
A suspension system separates the car body from the wheels of the car. It consists of tires, tire air, springs, shock absorbers and
linkages that connects a vehicle to its wheels and allows relative motion between the two. Every automobile suspension system is
designed with the purpose of providing passenger comfort and vehicle control. Numerous types of suspension system types such as
passive suspension, semi-active suspension and active suspension are used. Usually dynamic response of a car is carried out with the
help of full car model, half-car-model and quarter car model. Considering a full car model for study of behavior response of car under
motion to various road irregularities is tedious and difficult. Half -car models are extensively used in automotive engineering due to
their simplicity and provide the qualitatively correct information, better than the quarter car model. The half car model of 4 DOF
consists of front and rear wheel and its attachments, the tires, springs and dampers, half portion of the chassis and rigidly connected
part. A simple measure for ride comfort is the root mean square (rms) value of the vertical chassis acceleration. The road holding is
measured by the difference in the wheel displacement and the input profile amplitude. The effect of changing the values of various
suspension system parameters states better or deteriorated performance in terms of road holding and ride comfort [1-8].
II. LITERATURE SURVEY
In the paper “Parameters Affecting Vehicle Ride Comfort using Half Vehicle Model” by A. M. A. Soliman, S. M. Moustafa and
A. O. M. Shogae, an investigation of ride behavior is done with the help of half car model for active and passive suspension system.
The influence of spring stiffness, damping coefficient and tire stiffness on ride comfort is studied. A speed of 20m/s or 72kmph was
considered and spectral road profile was considered. It was observed that on increasing the damping the ride comfort decreases, on
increasing the front and rear suspension values the ride comfort deteriorates. On the other hand, on increasing the tire stiffness, the
ride comfort deteriorates. Also when, the body mass is increased, the ride comfort improves. Also the comparison and active and
passive suspension system is done it is observed that the active suspension system gives worthwhile improvement in terms of ride
comfort compared with the conventional passive one. This paper also studies the effect of antiroll bar on the overall ride comfort
level which is found to be increasing. Using the suitable anti-roll stiffness, spring stiffness, tire stiffness and damping coefficient are
required for improving ride comfort. [1].
In the paper “Mathematical Modeling in Vehicle Ride Dynamics” by Saurav Talukdar, Anupam Mazumdar, Murukesh
Mullasseril, Karuna Kalita and Aditya Ujjwal, mathematical modelling of quarter car model and half car model is done in order to
study the effect of ride quality of a vehicle using passive and semi-active suspension system. Also ‘the flexible ring tire model’ is
discussed to encounter the spring and damper properties of tire appropriately. A random excitation is provided to these mathematical
models developed and the ride comfort is studied. The semi-active suspension system tries to avoid the tradeoff between the three
performance parameters - transmissibility, suspension travel and road-holding simultaneously by introducing an adjustable damping
and stiffness value. It was observed that the settling time of the acceleration and displacement is reduced by 50% with the use of
semi-active PI controller based suspension system. The flexible 2 DoF half car model shows significant differences in the impulse
response as compared to the 2 DoF rigid half car model. The peak values predicted by the rigid model are about 60% higher than the
flexible model. The effect of tire flexibility is at high frequencies. The paper presents 6 the variation of various vehicle body
parameters like DDI variation, spring, damper, tire stiffness, unsprung and sprung mass variation on road holding and ride comfort.
[2]
In the paper “Vehicle Ride Comfort and Stability Performance Evaluation” by Shawky Hegazy and Corina Sandu, the author
does a comprehensive study of 3 passives and one readjust able shock absorber to study their performance on vehicle ride and stability.
The study was carried with the help of quarter and half car model in ADAMS and MATLAB. The paper studies the effect of various
parameters such as stiffness ratio and mass ratio. The input given is a step and sinusoidal profile 40mm in amplitude and frequency
of 1Hz and 6Hz. Mass ratio is defined as the ratio of sprung mass to unsprung mass. It was found that lighter mass ratio, gives more
ride comfortable. On the other hand, the control value is decreased, so road holding becomes worse. Similarly, stiffness ratio is

ISSN: 2455-2631 © November 2020 IJSDR | Volume 5 Issue 11
IJSDR2011035 International Journal of Scientific Development and Research (IJSDR) www.ijsdr.org 232
defined as the ratio of tire stiffness to suspension spring stiffness. From the observations it can be concluded that using a higher
stiffness ratio yields a more comfortable ride. On the other hand, the control value is decreased, so the road holding becomes worse.
Also, the use of actual shock absorber characteristics improves the ride comfort by 58% and also improves the vehicle stability by
4.25% in comparison to when the shock absorber properties are assumed as linear characteristics. [3]
In the paper “Analysis and Validation of Linear Half Car Passive Suspension System with Different Road Profiles” by G. D.
Shelke and A. C. Mitra, the authors have modelled a half-car model and studied its output response for various kind of inputs such
as step, sinusoidal, random source and uniform random source. The state space approach of modelling the half car is done. The rms
acceleration for various input signals is studied and also the validation of analytical solution i.e. state space equation and MATLAB
SIMULINK is done. The rms acceleration is found to be minimum for half sine bump. [4]
In the paper “Comfort Parameters Tuning Analysis for Vehicle Suspension Pitch Performance” by Ahmed Esmael Mohan, Mohd
Azman Abdullah, Muhammad Aliff Isyraq Azmi and 4 others, the authors have studied the pitch and bounce parameters with the
help of half car model. The modelling of a SUV is done for half car with the data being taken from CarSim software. The road bump
with 0.1m amplitude is considered. In this paper, only overshoot is analyzed for the comfort performance since 7 it affects the instant
response of the suspension. It is observed that the lower the value of damping the lower the value of the overshoot pitch. Similarly,
on increasing the value of spring stiffness the pitch overshoot goes on increasing. the lowest overshoot value that experienced on
vertical body acceleration on the SUV is at spring stiffness about 130 kN/s and damping value about 10 kNs/m. Thus, it is observed
that since smaller value of overshoot is considered as good in term of suspension response, the tuned parameters for both pitch and
vertical vibration performance is in the range of 130 to 153 kN/m and 10 to 20 kNs/m. These values can be used later for actual
vehicle tuning and comfort performance. [5]
In the paper “A half-car model for dynamic analysis of vehicles with random parameters” by W. Gao, N. Zhang and H. P. Du a
half-car model is used to investigate the dynamic response of cars with uncertainty under random road input excitations. The mass
of the vehicle body, mass moment of inertia of the vehicle body, masses of the front/rear wheels, damping coefficients and spring
stiffness of front/rear suspensions, distances of the front/rear suspension locations to the center of gravity of the vehicle body and the
stiffness of front/rear tires are considered as random variables. It is obtained that the uncertainty of the vehicles natural frequencies
is dependent on the uncertainty of vehicles parameters. [8]
III. MATHEMATICAL MODELLING
Fig. 1. Half Car model of Passive Suspension
Considering the FBD of the half car model we can get the equations of front and rear unsprung mass as:
𝑚1𝑦1 − 𝑘𝑠𝑓(𝑦2 − 𝑦1) − 𝑐𝑓(𝑦2 − 𝑦1) + 𝑘𝑡𝑓(𝑦1 − 𝑎) = 0 (1)
𝑚2𝑦3 − 𝑘𝑠𝑟(𝑦4 − 𝑦3) − 𝑐𝑟(𝑦4 − 𝑦3) + 𝑘𝑡𝑟(𝑦3 − 𝑏) = 0 (2)
where,
m1 - Unsprung mass of front wheel.
m2 - unsprung mass of rear wheel.
ksf - spring stiffness of front suspension.
ksr - spring stiffness of rear suspension.
ktf - spring stiffness of front tire.
ktr - spring stiffness of rear tire.
cf - damping coefficient of front damper.
cr - damping coefficient of rear damper.
y1 - displacement of front unsprung mass.
y2 - displacement of front part of sprung mass.
y3 - displacement of rear unsprung mass.
y4 - displacement of rear part of sprung mass.
1y - velocity of front unsprung mass.
2y - velocity of front part of sprung mass.

ISSN: 2455-2631 © November 2020 IJSDR | Volume 5 Issue 11
IJSDR2011035 International Journal of Scientific Development and Research (IJSDR) www.ijsdr.org 233
3y - velocity of rear unsprung mass.
4y - velocity of rear part of sprung mass.
1y - acceleration of front unsprung mass.
3y - acceleration of rear unsprung mass.
a - Road excitation to front wheel.
b - Road excitation to rear wheel.
Due to the relative motion of the spring-damper of front and rear assembly angular motion known as pitch of the sprung mass
about the C.G and vertical motion of the sprung mass known as bounce will take place about the C.G. These equations are
formulated as follows:
𝑚𝑠𝑥�� + 𝑘𝑠𝑓(𝑦2 − 𝑦1) + 𝑐𝑓(𝑦2 − 𝑦1) + 𝑘𝑠𝑟(𝑦4 − 𝑦3) + 𝑐𝑟(𝑦4 − 𝑦3) = 0 (3)
𝐼�� + 𝐿1(𝑘𝑠𝑓(𝑦2 − 𝑦1) + 𝑐𝑓(𝑦2 − 𝑦1)) − 𝐿2(𝑘𝑠𝑟(𝑦4 − 𝑦3) + 𝑐𝑟(𝑦4 − 𝑦3)) = 0 (4)
where,
ms - mass of sprung mass.
I - moment of inertia about y-y axis (pitch axis)
θ - pitch angle of the sprung mass.
θ - pitch angular acceleration of sprung mass.
xb - vertical displacement of sprung mass about center
of gravity.
bx - vertical acceleration of sprung mass about center of
gravity.
L1 - distance of front suspension system from center of
gravity.
L2 - distance of rear suspension system from center of
gravity.
The value 𝑦2 and 𝑦4 can be expressed in terms of pitch angle 𝜃 and vertical displacement (bounce) 𝑥𝑏 of the sprung mass as
follows:
𝑦2 = 𝑥𝑏 + 𝐿1𝜃 (5)
𝑦4 = 𝑥𝑏 − 𝐿2𝜃 (6)
Also the mass distribution of the half car on the front and rear wheel can be found as:
𝑚𝑓 = 𝑚𝑠(𝐿2
𝐿)
(7)
𝑚𝑟 = 𝑚𝑠(𝐿1
𝐿)
(8)
where,
mf - sprung mass distributed to front wheel
mr - sprung mass distributed to rear wheel
L - wheelbase of the vehicle
The above are the basic mathematical equations of motion of a half car model of 4 DOF which can be solved by State-space
equation approach and Matlab SIMULINK discussed as follows:
1. State-space equation approach
A state-space representation is a mathematical model of a physical system as a set of input, output and state variables related by
first-order differential equations or difference equations.
The general representation of State-space equation is as follows:
x = Ax + Bu (9)
y = Cx + Du (10)
The state variables are formed as follows:
𝑥1 = 𝑦1 𝑥1 = 𝑦1 = 𝑥2 𝑥2 = 𝑦1 𝑥2 = 𝑦1
𝑥3 = 𝜃 𝑥3 = �� = 𝑥4 𝑥4 = �� 𝑥4 = 𝜃
𝑥5 = 𝑥𝑏 𝑥5 = 𝑥�� = 𝑥6 𝑥6 = 𝑥�� 𝑥6 = 𝑥��
𝑥7 = 𝑦3 𝑥7 = 𝑦3 = 𝑥8 𝑥8 = 𝑦3 𝑥8 = 𝑦3
Substituting equation 5 and 6 in equation 1 to 4 and then substituting the State-space variables in the equation 9 and 10 we get,

ISSN: 2455-2631 © November 2020 IJSDR | Volume 5 Issue 11
IJSDR2011035 International Journal of Scientific Development and Research (IJSDR) www.ijsdr.org 234
𝐴 =
[
0 1 0 0 0 0 0 0𝑂21 𝑂22 𝑂23 𝑂24 𝑂25 𝑂26 0 00 0 0 1 0 0 0 0
𝑂41 𝑂42 𝑂43 𝑂44 𝑂45 𝑂46 𝑂47 𝑂48
0 0 0 0 0 1 0 0𝑂61 𝑂62 𝑂63 𝑂64 𝑂65 𝑂66 𝑂67 𝑂68
0 0 0 0 0 0 0 10 0 𝑂83 𝑂84 𝑂85 𝑂86 𝑂87 𝑂88]
𝐵 =
[
0 0𝑘𝑡𝑓/𝑚1 0
0 00 00 00 00 00 𝑘𝑡𝑟/𝑚2]
𝐶 =
[ 1 0 0 0 0 0 0 00 1 0 0 0 0 0 00 0 1 0 0 0 0 00 0 0 1 0 0 0 00 0 0 0 1 0 0 00 0 0 0 0 1 0 00 0 0 0 0 0 1 00 0 0 0 0 0 0 1]
𝐷 =
[ 0 00 00 00 00 00 00 00 0]
The State-space equation modelled in MATLAB is as shown below:
Fig. 2. State – space equation model in Matlab
where,
𝑂21 = −(𝑘𝑠𝑓 + 𝑘𝑠𝑟)/𝑚1 𝑂22 = −𝑐𝑓/𝑚1
𝑂23 = 𝑘𝑠𝑓 ∗ 𝐿1/𝑚1 𝑂24 = 𝑐𝑓 ∗ 𝐿1/𝑚1
𝑂25 = 𝑘𝑠𝑓/𝑚1 𝑂26 = 𝑐𝑓/𝑚1
𝑂41 = 𝑘𝑠𝑓 ∗ 𝐿1/𝐼 𝑂42 = 𝑐𝑓 ∗ 𝐿1/𝐼
𝑂43 =−((𝑘𝑠𝑟 ∗ 𝐿2
2) + (𝑘𝑠𝑓 ∗ 𝐿12))
𝐼 𝑂44 =
−((𝑐𝑟 ∗ 𝐿22) + (𝑐𝑓 ∗ 𝐿1
2))
𝐼
𝑂45 =(𝑘𝑠𝑟 ∗ 𝐿2) − (𝑘𝑠𝑓 ∗ 𝐿1)
𝐼 𝑂46 =
(𝑐𝑟 ∗ 𝐿2) − (𝑐𝑓 ∗ 𝐿1)
𝐼
𝑂47 = −𝑘𝑠𝑟 ∗ 𝐿2/𝐼 𝑂48 = −𝑐𝑟 ∗ 𝐿2/𝐼 𝑂61 = 𝑘𝑠𝑓/𝑚𝑠 𝑂62 = 𝑐𝑓/𝑚𝑠
𝑂63 =(𝑘𝑠𝑟 ∗ 𝐿2) − (𝑘𝑠𝑓 ∗ 𝐿1)
𝑚𝑠
𝑂64 =(𝑐𝑟 ∗ 𝐿2) − (𝑐𝑓 ∗ 𝐿1)
𝑚𝑠
𝑂65 = −(𝑘𝑠𝑓 + 𝑘𝑠𝑟)/𝑚𝑠 𝑂66 = −(𝑐𝑓 + 𝑐𝑟)/𝑚𝑠
𝑂67 = 𝑘𝑠𝑟/𝑚𝑠 𝑂68 = 𝑐𝑟/𝑚𝑠
𝑂83 = −𝑘𝑠𝑟 ∗ 𝐿2/𝑚2 𝑂84 = −𝑐𝑟 ∗ 𝐿2/𝑚2
𝑂85 = 𝑘𝑠𝑟/𝑚2 𝑂86 = 𝑐𝑟/𝑚2
𝑂87 = −(𝑘𝑠𝑓 + 𝑘𝑠𝑟)/𝑚2 𝑂88 = −𝑐𝑟/𝑚2

ISSN: 2455-2631 © November 2020 IJSDR | Volume 5 Issue 11
IJSDR2011035 International Journal of Scientific Development and Research (IJSDR) www.ijsdr.org 235
2. Matlab SIMULINK Approach
Fig. 3. Matlab SIMULINK model of half-car
3. Bump Design
Speed breaker is the hump surface across the roadway having rounded shape with width greater than wheelbase of most of the
vehicles using road Speed breakers are formed basically by providing a rounded hump of 3.7-meter width and 0.10-meter height
for preferred advisory crossing speed of 25 km/hr. [11]
Fig. 4. Standard bump profile. [9]

ISSN: 2455-2631 © November 2020 IJSDR | Volume 5 Issue 11
IJSDR2011035 International Journal of Scientific Development and Research (IJSDR) www.ijsdr.org 236
The amplitude distance relation then converted to amplitude time domain for simulation in SIMULINK. For simulation time of
10 seconds speed bump is given after 4.5 seconds.
Fig. 5. Input signal to front wheel in SIMULINK
Fig. 6. Input signal to front wheel and rear wheel in SIMULINK
Thus, above are the inputs to the signal builder block of the front wheel and rear wheel of half car model. The input signal to the
rear axle is the same speed breaker just with the time lag of the wheelbase/velocity at which the vehicle is crossing the bump. The
phase lag in seconds between the front and the rear wheel is: wheelbase = 2.91 m, velocity = 25kmph = 6.9444 m/s, time lag between
the front and rear = 2.91/6.9444=0.41904 seconds.
IV. RESULTS AND DISCUSSION
The vehicle data taken are from CarSim of a standard hatchback 2017 model is a follows.
Fig. 7. Hatchback dimensions from CarSim software

ISSN: 2455-2631 © November 2020 IJSDR | Volume 5 Issue 11
IJSDR2011035 International Journal of Scientific Development and Research (IJSDR) www.ijsdr.org 237
Fig. 8. Damping characteristics of damper from CarSim software.
The non-linear damping co-efficient is converted to linear damping co-efficient using straight line curve fitting method y = ax+b
where a denotes the damping co-efficient. We get, the compression damping co-efficient value as 3206.486539 Ns/m and rebound
damping co-efficient as 1933.12466 Ns/m. Thus taking the average of the above two we get the average damping co-efficient value
as 2569.80 Ns/m which is approximated to 2570 Ns/m.
Table 1. Values of various parameters of hatchback vehicle from CarSim software
Sprung mass (Ms) 635 kg
Unsprung mass front (m1) 35.5 kg
Unsprung mass rear (m2) 35.5kg
Front suspension length from CG(L1) 1.015m
Rear suspension length from CG(L1) 1.895m
Wheel Base(L) 2.91m
Moment of Inertia about pitch axis(Iyy) 768.35 kg/m2
Front suspension spring stiffness (ksf) 27000N/m
Rear suspension spring stiffness(ksr) 30000N/m
Front suspension damping co-efficient(cf) 2570 Ns/m
Rear suspension damping co-efficient(cr) 2570 Ns/m
Front tire stiffness(ktf) 268000N/m
Rear tire stiffness(ktr) 268000N/m
The standard vehicle data obtained is run with the help of MATLAB SIMULINK model represented on the left side below and
State-space equation Model represented on the right and their results obtained are discussed as below:
Fig. 9. Front unsprung mass displacement
Maximum displacement = 0.1034 m
Fig. 10. Front unsprung mass displacement.
Maximum displacement = 0.1035m.

ISSN: 2455-2631 © November 2020 IJSDR | Volume 5 Issue 11
IJSDR2011035 International Journal of Scientific Development and Research (IJSDR) www.ijsdr.org 238
Fig. 11. Rear unsprung mass displacement.
Maximum displacement = 0.1039 m.
Fig. 12. Rear unsprung mass displacement.
Maximum displacement = 0.1015 m.
Fig. 13. Pitch angle of the sprung mass.
Maximum value = -0.0894 radian.
Fig. 14. Pitch angle of sprung mass.
Maximum pitch angle = -0.0507 radian.
Fig. 15. Bounce of the sprung mass.
Maximum displacement = 0.08 m.
Fig. 16. Bounce of the sprung mass.
Maximum displacement = 0.0814 m.
Note that fig.9, fig.11, fig.13 and fig.15 are Matlab SIMULINK model that is developed while fig.10, fig.12, fig.14 and fig.16
are obtained from State-space equation model. From the above figures it can be observed that the Matlab SIMULINK model as
well as the State-space equations model results are in line with each other. From fig.9, fig.10, fig.11 & fig.12 it is observed that as
the stiffness of tire is much larger than spring and damping is also very low, unsprung mass i.e. front wheel & rear wheel
approximately follows the input signal or speed breaker displacement. In fig.13 & fig.14 it is observed that due to the presence of
spring and damper system the sprung mass oscillations fade out smoothly. In fig.15 & fig.16, the bounce motion of the sprung mass
fades out smoothly due to the presence of spring and damper system. Also the maximum value of bounce is less than that of the
front or rear sprung mass considered since here the combined effect of the front as well as rear suspension system control the overall
vertical motion of the sprung mass which helps in obtaining a more realistic idea of the car body displacement.
The vehicle data parameters are now modified and run with the help of Matlab SIMULINK and their effect on road holding
and ride comfort are studied as follows:
ISSN: 2455-2631 © November 2020 IJSDR | Volume 5 Issue 11
IJSDR2011035 International Journal of Scientific Development and Research (IJSDR) www.ijsdr.org 239
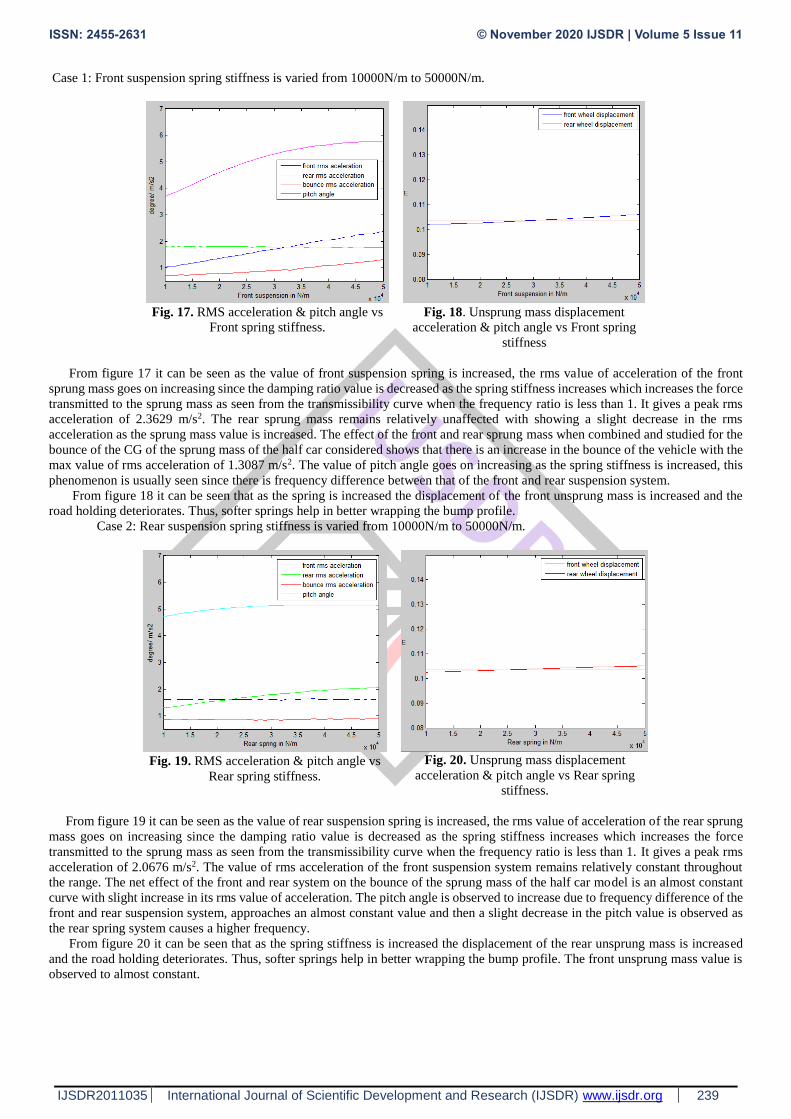
Case 1: Front suspension spring stiffness is varied from 10000N/m to 50000N/m.
Fig. 17. RMS acceleration & pitch angle vs
Front spring stiffness.
Fig. 18. Unsprung mass displacement
acceleration & pitch angle vs Front spring
stiffness
From figure 17 it can be seen as the value of front suspension spring is increased, the rms value of acceleration of the front
sprung mass goes on increasing since the damping ratio value is decreased as the spring stiffness increases which increases the force
transmitted to the sprung mass as seen from the transmissibility curve when the frequency ratio is less than 1. It gives a peak rms
acceleration of 2.3629 m/s2. The rear sprung mass remains relatively unaffected with showing a slight decrease in the rms
acceleration as the sprung mass value is increased. The effect of the front and rear sprung mass when combined and studied for the
bounce of the CG of the sprung mass of the half car considered shows that there is an increase in the bounce of the vehicle with the
max value of rms acceleration of 1.3087 m/s2. The value of pitch angle goes on increasing as the spring stiffness is increased, this
phenomenon is usually seen since there is frequency difference between that of the front and rear suspension system.
From figure 18 it can be seen that as the spring is increased the displacement of the front unsprung mass is increased and the
road holding deteriorates. Thus, softer springs help in better wrapping the bump profile.
Case 2: Rear suspension spring stiffness is varied from 10000N/m to 50000N/m.
Fig. 19. RMS acceleration & pitch angle vs
Rear spring stiffness.
Fig. 20. Unsprung mass displacement
acceleration & pitch angle vs Rear spring
stiffness.
From figure 19 it can be seen as the value of rear suspension spring is increased, the rms value of acceleration of the rear sprung
mass goes on increasing since the damping ratio value is decreased as the spring stiffness increases which increases the force
transmitted to the sprung mass as seen from the transmissibility curve when the frequency ratio is less than 1. It gives a peak rms
acceleration of 2.0676 m/s2. The value of rms acceleration of the front suspension system remains relatively constant throughout
the range. The net effect of the front and rear system on the bounce of the sprung mass of the half car model is an almost constant
curve with slight increase in its rms value of acceleration. The pitch angle is observed to increase due to frequency difference of the
front and rear suspension system, approaches an almost constant value and then a slight decrease in the pitch value is observed as
the rear spring system causes a higher frequency.
From figure 20 it can be seen that as the spring stiffness is increased the displacement of the rear unsprung mass is increased
and the road holding deteriorates. Thus, softer springs help in better wrapping the bump profile. The front unsprung mass value is
observed to almost constant.

ISSN: 2455-2631 © November 2020 IJSDR | Volume 5 Issue 11
IJSDR2011035 International Journal of Scientific Development and Research (IJSDR) www.ijsdr.org 240
Case 3: The front damper values from 1400 Ns/m to 5000Ns/m
Fig. 21. RMS acceleration & pitch angle vs
front damping co-efficient.
Fig. 22. Unsprung mass displacement
acceleration & pitch angle vs front damping
co-efficient.
From figure 21 it can be seen as the value of front suspension damper is increased, the rms value of acceleration of the front
sprung mass goes on decreasing since the damping ratio value is increased as the damping coefficient increases which decreases
the force transmitted to the sprung mass as seen from the transmissibility curve when the frequency ratio is less than 1. It gives a
rms acceleration of 1.5078 m/s2 at damping co-efficient value of 5000 Ns/m. The rear sprung mass rms acceleration value remains
relatively constant with slight increase in rms acceleration value with change in the front damping co-efficient. The bouncing effect
see a slightly bathtub curve profile as the damping co-efficient goes on increasing with peak bouncing rms acceleration value of
0.9752 m/s2 at damping co-efficient value of 5000 Ns/m. The peak pitch angle is also observed to decrease as the damping co-
efficient value is increased, thus stabilizing the system faster.
From figure 22 it can be seen that as the damping co-efficient is increased the displacement of the front unsprung mass is
increased since the weight distributed at the front in greater than that at rear, thus inertia factor affects the road holding. The rear
unsprung mass value is observed to almost constant.
Case 4: The rear damper values from 1400 Ns/m to 5000Ns/m
Fig. 23. RMS acceleration & pitch angle vs
rear damping co-efficient.
Fig. 24. Unsprung mass displacement
acceleration & pitch angle vs front damping
co-efficient.
From figure 23 below it can be seen as the value of rear suspension damper is increased, the rms value of acceleration of the rear
sprung mass goes on decreasing since the damping ratio value is increased as the damping coefficient increases which decreases
the force transmitted to the sprung mass as seen from the transmissibility curve when the frequency ratio is less than 1. It gives a
rms acceleration of 1.7677 m/s2 at damping co-efficient value of 5000 Ns/m. The front sprung mass rms acceleration value remains
relatively constant. The bouncing effect see a slightly bathtub curve profile as the damping co-efficient goes on increasing with
peak bouncing rms acceleration value of 0.9282 m/s2 at damping co-efficient value of 5000 Ns/m. The peak pitch angle is also
observed to decrease as the damping co-efficient value is increased, thus stabilizing the system faster.
From figure 24 it can be seen that as the damping co-efficient is increased the displacement of the rear unsprung mass is decreased
since the weight distributed at the rear is less than that at front, thus inertia factor affects the road holding. The front unsprung mass
value is observed to almost constant.

ISSN: 2455-2631 © November 2020 IJSDR | Volume 5 Issue 11
IJSDR2011035 International Journal of Scientific Development and Research (IJSDR) www.ijsdr.org 241
Case 5: The tire stiffness values from 100000 N/m to 500000 N/m
Fig. 25. RMS acceleration & pitch angle vs
front -rear tire stiffness.
Fig. 26. Unsprung mass displacement
acceleration & pitch angle vs front-rear tire
stiffness value.
From figure 25 it can be seen as the value of front and rear tire stiffness is increased, the rms value of acceleration of the front
sprung mass as well as rear sprung mass goes on decreasing. The effect of the front and rear sprung mass rms acceleration when
combined and studied for the bounce of the CG of the sprung mass of the half car considered shows that there is a decrease in the
bounce of the vehicle. The value of pitch angle goes on decreasing as the front and rear tire stiffness is increased, this phenomenon
is usually seen since there is frequency difference between that of the front and rear suspension system remains constant. Due to
the high stiffness of the tire, it damps out most of the vibration thus assisting in a better ride comfort.
Figure 26 shows that as the tire stiffness of the tire is increased, the road holding capacity of both the front and rear wheels
goes on increasing since they tend to almost follow the input profile due to increased tire stiffness.
V. CONCLUSION
Thus from the above it can be concluded the Matlab SIMULINK and State – space equation can be used to study the half car
model for various parameters. Also, according to ISO 2631-1: 1997, the RMS value of vertical acceleration of the vehicle for human
comfort should be less than 0.315 m/s2 to not feel uncomfortable. The rms value of acceleration for the standard vehicle data over
a standard profile for front and rear sprung mass statement is in the range of 1.6 m/s2 to 1.9 m/s2, thus the passenger is in a state of
uncomfortable zone over the bump. But single it is for a very short duration, no major consequences are observed. Also while
studying the effect of various parameters of the vehicle on the road hold and ride comfort it can be concluded, the front and rear
spring stiffness increase causes the rms acceleration values of front and rear sprung mass, half-car sprung mass bounce acceleration
and pitch angle to increase. The increase in the damping co-efficient of the front and rear suspension system causes the respective
front and rear rms value to decrease, the pitch angle too decreases whereas the bounce acceleration value follows a bathtub curve
and the change in tire stiffness causes an increase in ride comfort. The road holding deteriorates on increasing the front and rear
suspension stiffness values, it also deteriorates in case of front damping but shows better damping when the rear suspension damping
values increase.
REFERENCES
[1] A. O. M. Shogae Parameters Affecting Vehicle Ride Comfort using Half Vehicle Model. SAE Technical Paper Series, ISBN
No:978-0-7680-1634-5.
[2] Saurav T., Anupam M., Murukesh M., Karuna K., Aditya U. Mathematical Modeling in Vehicle Ride Dynamics. SAE
International, ISSN 0148-7191.
[3] Shawky H., Corina S., Vehicle Ride Comfort and Stability Performance Evaluation. SAE International, ISSN 0148-7191.
[4] G. D. Shelke, A. C. Mitra Analysis and Validation of Linear Half Car Passive Suspension System with Different Road
Profiles, IOSR Journal of Engineering, ISSN (e): 2250-3021.
[5] Ahmed Esmael Mohan, Mohd Azman Abdullah, Muhammad Aliff Isyraq Azmi Comfort Parameters Tuning Analysis for
Vehicle Suspension Pitch Performance. International Journal of Engineering and Technology, ISSN No:0975-4024.
[6] Nikhil D., Bharatbhushan K. A Review Work On Suspension Systems Models, Control Strategies for Suspension System.
Journal of Emerging Technologies and Innovative Research, ISSN-2349-5162.
[7] Bhanu C. Modelling and Analysis of Half Car Suspension System Using Fuzzy Logic Controller. Indian Institute of
Technology Madras, ResearchGate.
[8] W. Gao, N. Zhang, H. P. Du A half-car model for dynamic analysis of vehicles with random parameters. 5th Australasian
Congress on Applied Mechanics (ACAM 2007), Brisbane, Australia, ISBN-0 8582 5862 5.
[9] IRC-99, Tentative Guidelines on the Provision of Speed Breakers for Control of Vehicular Speeds on Minor Roads: Indian
Roads Congress.