
STUDY OF POLYSULFIDE SPECIATION IN LITHIUM SULFUR ...
108
University of New Mexico UNM Digital Repository Nanoscience and Microsystems ETDs Engineering ETDs Summer 7-6-2017 STUDY OF POLYSULFIDE SPECIATION IN LITHIUM SULFUR BAERIES USING IN SITU CONFOCAL MAN MICROSCOPY Josefine McBrayer Follow this and additional works at: hps://digitalrepository.unm.edu/nsms_etds Part of the Nanoscience and Nanotechnology Commons is esis is brought to you for free and open access by the Engineering ETDs at UNM Digital Repository. It has been accepted for inclusion in Nanoscience and Microsystems ETDs by an authorized administrator of UNM Digital Repository. For more information, please contact [email protected]. Recommended Citation McBrayer, Josefine. "STUDY OF POLYSULFIDE SPECIATION IN LITHIUM SULFUR BAERIES USING IN SITU CONFOCAL MAN MICROSCOPY." (2017). hps://digitalrepository.unm.edu/nsms_etds/39
Transcript of STUDY OF POLYSULFIDE SPECIATION IN LITHIUM SULFUR ...

University of New MexicoUNM Digital Repository
Nanoscience and Microsystems ETDs Engineering ETDs
Summer 7-6-2017
STUDY OF POLYSULFIDE SPECIATION INLITHIUM SULFUR BATTERIES USING INSITU CONFOCAL RAMAN MICROSCOPYJosefine McBrayer
Follow this and additional works at: https://digitalrepository.unm.edu/nsms_etds
Part of the Nanoscience and Nanotechnology Commons
This Thesis is brought to you for free and open access by the Engineering ETDs at UNM Digital Repository. It has been accepted for inclusion inNanoscience and Microsystems ETDs by an authorized administrator of UNM Digital Repository. For more information, please [email protected].
Recommended CitationMcBrayer, Josefine. "STUDY OF POLYSULFIDE SPECIATION IN LITHIUM SULFUR BATTERIES USING IN SITUCONFOCAL RAMAN MICROSCOPY." (2017). https://digitalrepository.unm.edu/nsms_etds/39

i
Josefine Desiree McBrayer Candidate
Nanoscience and Microsystems Engineering
Department
This thesis is approved, and it is acceptable in quality and form for publication:
Approved by the Thesis Committee:
Fernando Garzón, Chairperson
Christopher Apblett
Andrew Shreve

ii
STUDY OF POLYSULFIDE SPECIATION IN LITHIUM SULFUR
BATTERIES USING IN SITU CONFOCAL RAMAN MICROSCOPY
BY
JOSEFINE DESIREE MCBRAYER
B.S., Chemical Engineering, University of New Mexico, 2016
THESIS
Submitted in Partial Fulfillment of the
Requirements for the Degree of
Master of Science
Nanoscience and Microsystems Engineering
The University of New Mexico
Albuquerque, New Mexico
July, 2017

iii
DEDICATION
I dedicate this work to my family for their endless and unconditional support and
belief in my abilities. I would not be where I am today without them.

iv
ACKNOWLEDGMENTS
I would like to acknowledge all of my group members at Sandia and UNM for
their useful discussion and help with this work.
I thank Dr. Chelsea Snyder for initial training on the Raman microscope and
Lance Miller for his help with mass spectroscopy. For help with the design of the in situ
cell I thank John Plakio, Jonathan Leonard, and Harry Pratt. For help with materials, I
thank Dr. Nathan Hahn and Dr. Tylan Watkins.
A big thank you also to Dr. Andy Shreve and Dr. Thomas Beechem for all the
time you dedicated to teaching me how to analyze Raman spectra correctly and for
answering any and all of my questions despite how busy you are.
Thank you to Dr. Brian Perdue for his detailed discussions on lithium sulfur
batteries, mentorship, and for giving me his fancy mouse.
I would like to give a special thank you to Hannah Height for both her technical
support in deciding next steps and for her friendship. Thank you for celebrating with me
in the best of times and listening to me complain in the worst of times, I look forward to a
lifetime of friendship with you.
To Dr. Kyle Fenton and Dr. Mani Nagasubramanian, thank you for showing up at
8 am to help me practice presentations and for your support on a daily basis.
To my manager, Dr. Chris Orendorff, and the whole Power Sources and
Technology Group, thank you for all of the opportunities you’ve given me over the past
two years and for making my time in 2546 a truly amazing and positive experience. I
could not ask for a better place to work.
v
Thank you to my family for the support and love they have always given me.
Thank you for staying up late to help me practice my ECS talk and for all the emotional
support you’ve shown me throughout my master’s and my entire academic career. Thank
you to my dad for forcing me to take breaks and calm down. To my mother for talking
through life with me and the changes it inevitably brings. To my brother for his humor
and wit and making me laugh when I feel like crying. To my sister for the reminder that
life is more than work and research. And lastly to my dog and birds for the love and
companionship they have given me.
Thank you to my advisors, Dr. Fernando Garzón and Dr. Christopher Apblett for
all the knowledge I have gained over the last year and the opportunities you have given
me.
To Chris, thank you for showing me the kind of person I want to be and instilling
in me a passion for both research and for life. I cannot thank you enough for the doors
you have opened for me and the kindness you have shown me. I hope to show you in the
coming years that your investment was worthwhile and that your efforts will be extended
to the future as I try my best to pay what you have taught and given me forward.
Lastly, I would like to acknowledge and thank my funding sources for this work
including the Department of Defense and the Joint Center for Energy Storage Research.
Sandia National Laboratories is a multi-mission laboratory managed and operated by
National Technology & Engineering Solutions of Sandia, LLC, a wholly owned subsidiary of
Honeywell International, Inc., for the U.S. Department of Energy’s National Nuclear Security
Administration under contract DE-NA0003525.

vi
STUDY OF POLYSULFIDE SPECIATION IN LITHIUM SULFUR
BATTERIES USING IN SITU CONFOCAL RAMAN MICROSCOPY
by
Josefine Desiree McBrayer
B.S., Chemical Engineering, University of New Mexico, 2016
M.S., Nanoscience and Microsystems Engineering, University of New Mexico, 2017
ABSTRACT
Secondary lithium sulfur (Li-S) batteries have been heavily studied in the battery
community since the start of the 21st century due to their high theoretical capacity and
specific energy density. The ground-breaking lithium ion battery has revolutionized society
and its ability to store energy, however the lithium ion battery is reaching its limit with a
theoretical capacity almost five times lower than that of lithium sulfur. With the
improvement and commercialization of Li-S batteries, electric vehicles and personal
electronics will have extended performance on a single charge. The viability of this
promising chemistry relies on overcoming several key difficulties, one of the most
imperative being high solubility, mobility, and reactivity of polysulfide reaction
intermediates in liquid electrolytes. In situ Raman microscopy is used to study polysulfide
speciation in the bulk electrolyte (1:1 1,2-dimethoxyethane (DME): 1,3-dioxolane (DOL)
with 1 M lithium bis(trifluoromethane)sulfonimide (LiTFSI) and 0.25 M LiNO3) during

vii
the discharge and charge of a Li-S T-cell to better understand the complex interplay
between chemical and electrochemical reactions in solution. Long chain polysulfides and
the S3- radical appear in the electrolyte at 2.4 V indicating a rapid equilibrium of the
dissociation reaction to form S3-. Interestingly, an increase in the concentration of all
polysulfides was observed during charge indicating the importance of the E/S ratio and
potentially a loss in the useful sulfur inventory from the cathode to the electrolyte. For peak
comparisons, nominal Li2S8, Li2S6, and Li2S4 standards were chemically synthesized under
argon and analyzed for stability, using Raman, for one week. All three standards
equilibrated to contain the same polysulfide species, however the relative distributions of
the species distinguished the standards from one another. Not all peaks observed in the in
situ cell were seen in the standards, indicating that the electrochemical and chemical
equilibria do not yield the same speciation.

viii
TABLE OF CONTENTS
LIST OF FIGURES ............................................................................................... xi
LIST OF TABLES ............................................................................................... xvi
1. Introduction ................................................................................................... 1
Batteries ..................................................................................................... 1
Lithium Sulfur Batteries ............................................................................ 4
1.2.1 Attributes of Lithium Sulfur Batteries ................................................ 4
1.2.2 Obstacles to Lithium Sulfur Batteries ................................................. 7
1.2.3 Mitigating the Polysulfide Shuttle and Other Difficulties .................. 8
1.2.4 Cathodes .............................................................................................. 8
1.2.5 Anodes ............................................................................................... 10
1.2.6 Electrolytes ........................................................................................ 11
1.2.7 Conclusions ....................................................................................... 20
Characterization of Lithium Polysulfides ............................................... 20
1.3.1 Characterization Techniques ............................................................. 20
1.3.2 Polysulfide Standards ........................................................................ 24
Confocal Raman Microscopy .................................................................. 25
1.4.1 Confocal Microscopy ........................................................................ 25
1.4.2 Raman Spectroscopy ......................................................................... 26

ix
1.4.3 Raman to Analyze Lithium Sulfur Batteries ..................................... 29
Research Motivation ............................................................................... 34
2. Experimental Setup ..................................................................................... 36
Raman System and Raman Data Acquisition ......................................... 36
Electrolyte Composition .......................................................................... 37
Raman Polysulfide Standards ................................................................. 38
ESI Mass Spectroscopy Polysulfide Standards ...................................... 40
In Situ Raman Cell Design ...................................................................... 41
2.5.1 Generation 1 ...................................................................................... 41
2.5.2 Generation 2 ...................................................................................... 43
2.5.3 Generation 3 ...................................................................................... 44
In Situ Raman Cell Preparation ............................................................... 46
2.6.1 Cleaning ............................................................................................ 46
2.6.2 Cathodes ............................................................................................ 47
Electrochemical Testing .......................................................................... 48
3. Results and Discussion ............................................................................... 50
Analysis of Cell Components using Raman ........................................... 50
ESI Mass Spectroscopy Results .............................................................. 55
Raman of Lithium Polysulfide Standards .............................................. 57
Generation 1: In situ Coin Cell ............................................................... 66

x
Generation 3: In situ T-Cell .................................................................... 68
4. Conclusions ................................................................................................. 80
5. Future work ................................................................................................. 82
6. Appendices .................................................................................................. 83
Appendix A: Mass Spectra for all Polysulfide Standards ....................... 83
Appendix B: Spectral Processing ............................................................ 84
Appendix C: Voltage Steps and Current Decay, T-Cell Replicates ........ 87
7. References ................................................................................................... 89
xi
LIST OF FIGURES
Figure 1: Electrochemical cell during discharge. 6, 8 .......................................................... 2
Figure 2: Typical first discharge and charge curves of a Li-S battery showing the believed
step-wise reduction of S8 to Li2S. 15 .................................................................................... 5
Figure 3: Diagram of the polysulfide shuttle mechanism during the charge cycle. Figure
adapted from Ref. 2, 6........................................................................................................... 7
Figure 4: Percentage of research focused on various electrolyte solvents for Li-S batteries.
Figure from Hagen et al. 39 ............................................................................................... 11
Figure 5: Discharge and charge profiles of various ether and carbonate solvents used in
electrolytes.46 .................................................................................................................... 14
Figure 6: Lithium salts used in Li-S battery electrolytes.48 ............................................. 15
Figure 7: ESI/MS results from Zheng et al.58 .................................................................. 22
Figure 8: Jablonski diagram showing Rayleigh, Stokes, and Anti-Stokes scattering.75 .. 26
Figure 9: Figure from Suo et al.66 showing the effect of LiTFSI concentration variation in
1:1 DME:DOL electrolyte on Raman spectrum. ............................................................. 30
Figure 10: Raman spectra during the discharge and charge of a lithium sulfur in situ cell.
Figure from Hagen et al.39 ................................................................................................ 31
Figure 11: Figure from Wu et al. depicting a cyclic voltammogram of a Li-S cell and
changes in polysulfide peak intensities during discharge. 67 ............................................ 33
Figure 12: WiTec Alpha300M Raman schematic. .......................................................... 36
Figure 13: Example Raman calibration curve. ................................................................ 37
Figure 14: Polysulfide standards at reaction initiation and just prior to removal from hot
plate. .................................................................................................................................. 38

xii
Figure 15: EIS mass spectroscopy polysulfide standards prior to dilution...................... 40
Figure 16: Generation 1 cell schematic. .......................................................................... 41
Figure 17: Generation 2 cell schematic of a commercial in situ cell from MTI
Corporation.87.................................................................................................................... 43
Figure 18: Cathode and tabs used to attach the cathode to the stainless steel rod leads.. 44
Figure 19: Stainless steel electrode leads. ....................................................................... 44
Figure 20: Generation 3A cell schematic. ....................................................................... 44
Figure 21: Generation 3B cell schematic. ........................................................................ 45
Figure 22: Generation 3C cell photograph. ..................................................................... 46
Figure 23: Generation 3C cell schematic. ........................................................................ 46
Figure 24: The normal discharge curve of a 2032 coin cell with a 60:30:10 sulfur: Super
P: SBR/LI133 cathode and lithium on copper anode (black) and example of voltage steps
used while obtaining Raman spectra. ................................................................................ 48
Figure 25: Spectra of electrolyte components. ................................................................ 50
Figure 26: Difference in fluorescence background when electrolyte was under argon vs.
under dry air. ..................................................................................................................... 51
Figure 27: Raman spectra of the electrolyte using a laser power of 8 mW with 30 seconds
integration time and 10 accumulations and a laser power of 0.5 mW with 240 seconds
integration time and 20 accumulations. ............................................................................ 52
Figure 28: LiTFSI in air using a laser power of 8 mW with 30 seconds integration time
and 10 accumulations and a laser power of 0.5 mW with 240 seconds integration time and
20 accumulations. ............................................................................................................. 53

xiii
Figure 29: LiTFSI time study in air and argon from 2 seconds illumination time to 60
seconds illumination time showing the effect of photo-bleaching at a power of 8 mW. . 53
Figure 30: Raman spectra for S8 in air and Li2S under argon using a laser power of 8 mW,
30 seconds integration time, and 10 accumulations. ......................................................... 54
Figure 31: Raman spectra of 3501 Celgard separator and 60:30:10 sulfur: Super P:
LI133/SBR 8 mil WFT cathode. ....................................................................................... 55
Figure 32: ESI mass spectra of 50mM “Li2S8” in 1:1 DME: DOL and 0.2 mmol Na2S and
0.075 mmol S8 in DME. .................................................................................................... 56
Figure 33: Polysulfides exposed to air 1 and 2 days after being synthesized. ................. 57
Figure 34: Example of color change of polysulfide standards after exposure to air. ..... 57
Figure 35: Polysulfides under argon 1 and 2 days after being synthesized ..................... 58
Figure 36: Nominal Li2S8, Li2S6, and Li2S4 standards under argon at 17 hours from
reaction initiation with peak positions from the literature ................................................ 59
Figure 37: Solid identified as Li2S in the Li2S4 standards.. ............................................. 59
Figure 38: Difference in coloration of the Li2S8, Li2S6, and Li2S4 standards in argon ... 60
Figure 39: Examples of Lorentzian fits for peaks located approximately at 390, 450, 510,
and 533 cm-1 at 17 hours from reaction initiation for Li2S4, Li2S6, and Li2S8. ................. 61
Figure 40: Peak position in the 510 cm-1 range for the Li2S8, Li2S6, and Li2S4 standards
over a week period. ........................................................................................................... 62
Figure 41: Stability study of polysulfide standards under argon.. ................................... 64
Figure 42: First discharge curves with current interrupts for a normal coin cell, and two
replicates of coin cells sealed from the outside using Double/Bubble® extra fast setting
epoxy. ................................................................................................................................ 66

xiv
Figure 43: Image of coin cells sealed from the outside with Double/Bubble® extra fast
setting epoxy before and after cycling. ............................................................................. 67
Figure 44: Result of soaking lithium metal and Double/Bubble® extra fast setting epoxy
in electrolyte for one day. ................................................................................................. 67
Figure 45: Example of current decay reaching equilibrium just prior to the acquisition of
a Raman spectrum at 2.35 V during the discharge cycle. ................................................. 68
Figure 46: Voltage steps and current decays for T-cell replicate number one. ............... 69
Figure 47: T-cell window before and after 1 discharge and charge cycle. ...................... 69
Figure 48: Raman spectra of replicate #1 for in situ discharge and charge at each voltage
step.. .................................................................................................................................. 70
Figure 49: 365 cm-1 peak intensities during the discharge and charge of the in situ Li-S T-
cell. .................................................................................................................................... 72
Figure 50: 365 cm-1 peak intensities as a function of depth of discharge. ....................... 73
Figure 51: Representative raw data and fits of the peaks located at approximately 365 and
390 cm-1 during discharge and charge.. ............................................................................ 74
Figure 52: Ratio of 390 to 365 cm-1 peak intensities during the discharge and charge of the
in situ Li-S T-cell. ............................................................................................................. 75
Figure 53: 533 cm-1 peak intensities during the discharge and charge of the in situ Li-S T-
cell.. ................................................................................................................................... 76
Figure 54: 450 cm-1 peak intensities during the discharge and charge of the in situ Li-S T-
cell. .................................................................................................................................... 77
Figure 55: 1066 cm-1 peak intensities during the discharge and charge of the in situ Li-S
T-cell.. ............................................................................................................................... 78

xv
Figure 56: Initial experiment results on the effect of the laser on the current decay and
dependence on voltage. ..................................................................................................... 82
Figure 57: Mass spectra of polysulfide standards. ........................................................... 83
Figure 58: Example of background subtraction for a Li2S8 standard before and after
background subtraction. .................................................................................................... 84
Figure 59: Example of normalization to the 740.7 cm-1 LiTFSI peak and subtraction of
electrolyte peaks................................................................................................................ 85
Figure 60: In situ spectra for replicate cell one prior to smoothing. ................................ 86
Figure 61: Normal, constant discharge of a T-cell at C/50. ............................................. 88
Figure 62: Voltage steps and current decays for replciates two and three ...................... 88

xvi
LIST OF TABLES
Table 1: Theoretical electrochemical properties of a ......................................................... 4
Table 2: Summary of some of the major characterization techniques used to study lithium
sulfur batteries. .................................................................................................................. 21
Table 3: Comparison of important parameters for the Wu et al.67 and Hagen et al.39 papers
........................................................................................................................................... 33
Table 4: ESI mass spectroscopy parameters. ................................................................... 40
Table 5: List of adhesives tested for compatibility with the Li-S system and with the DME:
DOL electrolyte. ............................................................................................................... 41
Table 6: Peaks observed in current work and their assignments based on literature values.
........................................................................................................................................... 63
1
1. Introduction
A transition to sustainable energy is among society’s greatest challenges.1 With this
change, the development of more efficient, safe, and cost effective batteries is also
necessary.2, 3 Batteries are becoming ever more integral to today’s technology rich world.4
Phones and other personal electronics are reliant on battery performance. Intermittent
power sources, such as wind and solar, require storage devices to deliver a consistent
energy supply2, 5, 6 and more ecofriendly electric vehicles have limited travel distances due
to low energy density batteries.3 Current lithium (Li) ion batteries are already nearing the
bounds of their performance capabilities. An encouraging improvement in specific energy
is possible with lithium sulfur (Li-S) batteries.2, 3, 7
This chapter provides an introduction to battery terminology followed by a
description of obstacles in Li-S battery research, the use of Raman spectroscopy and other
characterization techniques to better understand the behavior of a Li-S battery, and the
motivation behind the current research.
Batteries
A battery is one or more electrochemical cells connected in series or parallel in order
to achieve a desired capacity or voltage. Chemical energy is converted to electrical energy
through a coupled reduction-oxidation (redox) reaction.8 Unlike an engine, a battery does
not require a temperature difference to function and is not limited by the Carnot efficiency.

2
There are three components to an electrochemical cell: the cathode, the anode, and the
electrolyte. A typical electrochemical cell, during the discharge cycle, is depicted in Figure
1. The cathode, also called the positive electrode, is defined as the electrode where
reduction takes place; the cathode
accepts electrons from the anode via the
external circuit. The anode, the negative
electrode, is oxidized as it donates
electrons to the cathode through the
external circuit.8 As electrons flow
through the circuit, they perform
electrical work. The flow of electrons
during cycling is balanced through the movement of ions. The electrolyte provides a
pathway for ions as it is ionically, but not electronically conductive.
If a direct, electronic path between anode and cathode is created, the cell will short. An
internal short circuit renders the battery useless because there is no longer a potential
difference between the two electrodes. It can also pose a safety hazard; if a large current is
allowed to pass uncontrolled between electrodes, excessive heating may occur. Direct
contact between electrodes is prevented by either separation by physical distance or
through the use of an insulating separator. The separator is still permeable to ions, allowing
the passage of ions between cathode and anode.
The potential difference between the cathode and anode, when no current is present, is
called the open circuit potential. This difference is the driving force for the battery voltage
and changes as the materials in the cathode and anode change during the charge and
Figure 1: Electrochemical cell during discharge. The
cathode accepts electrons from the external circuit
while the anode donates electrons to the external
circuit.6, 8
3
discharge cycles. The active materials of a battery are defined as the components that are
intended to be involved in the redox reaction.
The amount of electricity available from the redox reaction per gram of active material
is called the cell’s specific capacity.8 The C-rate of a cell is calculated from the maximum,
theoretical capacity and is defined as the rate that will discharge the battery in one hour.
For example, a rate of 2 C will lead to a discharge time of 0.5 hours while a rate of 0.10 C
will lead to a discharge time of 10 hours.
During normal operation, in the forward (exothermic) reaction, cations move through
the electrolyte towards the cathode, and anions shift towards the anode. This process is
called discharge when referring to batteries. The current and ion flows are reversed during
the charge cycle; cations and anions diffuse towards the anode and cathode respectively,
while electrons pass through the external circuit from cathode to anode.
Cycling is relevant to secondary (rechargeable) batteries which can be charged and
discharged multiple times through the reversal of the redox reaction. Primary batteries are
discarded after a single discharge, as their chemical reactions are considered irreversible.
Although batteries allow for greater efficiencies than engines and provide the
convenience of stored energy, they also have many limitations. Safety is one of the major
limitations of batteries. Volatile, flammable solvents are often used, which can start fires
and cause a battery to explode, given an internal short circuit. Additionally, batteries
require time to recharge and can have a lasting environmental impact due to the use of
hazardous materials. They also cannot yet compete with the mass and volume energy
densities of gasoline. These limitations drive current and future research into the
4
improvement of state of the art batteries as well as the development of new battery systems
to address energy density, safety, environmental impact, and convenience.
Lithium Sulfur Batteries
Li-S batteries are one of several chemistries being researched with the hope of
improving energy density and safety. This section discusses the benefits and limitations to
lithium sulfur batteries and the research to attempt to overcome a variety of technical
challenges.
1.2.1 Attributes of Lithium Sulfur Batteries
Due to the high theoretical capacity and specific energy of sulfur, there has been
interest in primary Li-S batteries since the mid-1960s. Research into secondary Li-S
batteries has increased since the year 2000.2
In addition to these benefits, Li-S batteries have relatively nontoxic, inexpensive,
and abundant raw materials. Li-S batteries are built charged with an initial voltage of
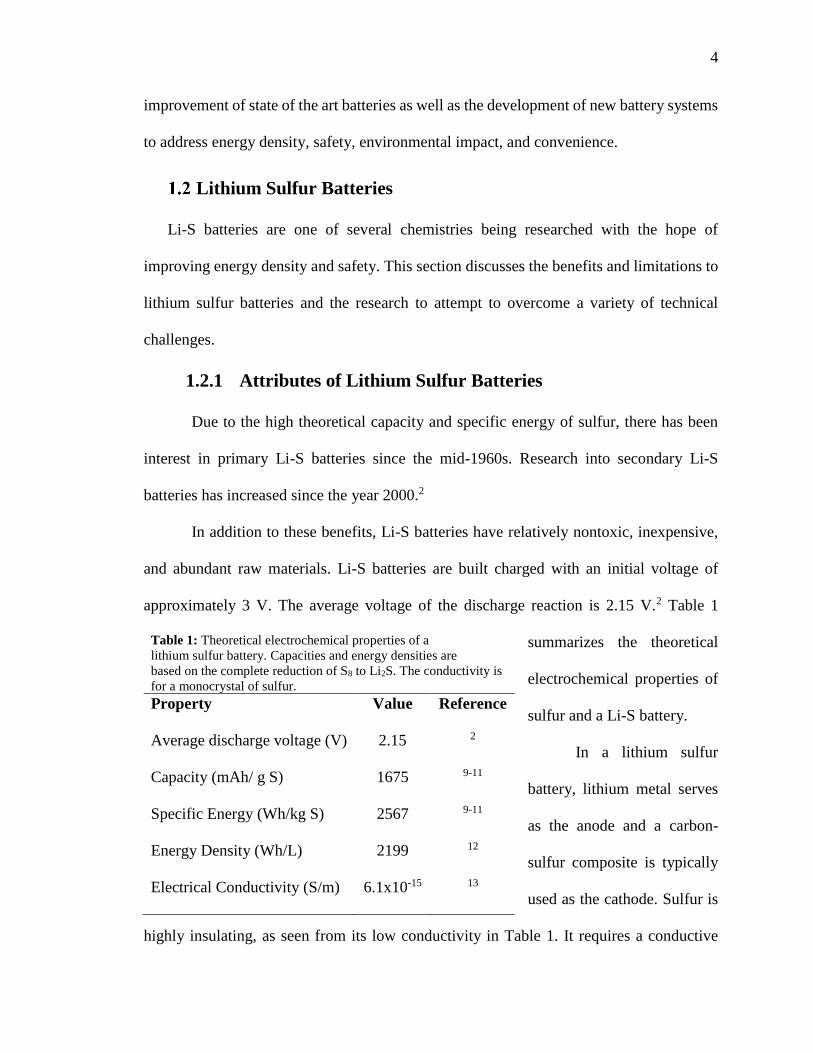
approximately 3 V. The average voltage of the discharge reaction is 2.15 V.2 Table 1
summarizes the theoretical
electrochemical properties of
sulfur and a Li-S battery.
In a lithium sulfur
battery, lithium metal serves
as the anode and a carbon-
sulfur composite is typically
used as the cathode. Sulfur is
highly insulating, as seen from its low conductivity in Table 1. It requires a conductive
Table 1: Theoretical electrochemical properties of a
lithium sulfur battery. Capacities and energy densities are
based on the complete reduction of S8 to Li2S. The conductivity is
for a monocrystal of sulfur.
Property Value Reference
Average discharge voltage (V) 2.15 2
Capacity (mAh/ g S) 1675 9-11
Specific Energy (Wh/kg S) 2567 9-11
Energy Density (Wh/L) 2199 12
Electrical Conductivity (S/m) 6.1x10⁻¹⁵ 13

5
phase to allow for efficient electron transport. A binder is used to combine the conducting
phase and sulfur to ensure consistent electrical contact.
The most common allotrope of sulfur is an eight-membered ring. During discharge,
sulfur (S8) in the cathode is reduced, forming polysulfide anions. S8 has the ability to
transfer sixteen electrons during a redox reaction while most transition metals in
intercalation batteries can only transfer one electron.3 The full reaction is the reduction of
S8 to Li2S. The half and overall reactions for the discharge cycle are listed in Equations 1-
3.2, 14
SLieSLi 28 81616 (cathode) (1)
eLiLi 161616 (anode) (2)
SLiSLi 28 816 (overall) (3)
Figure 2: Typical first discharge and charge curves of a Li-S battery
showing the believed step-wise reduction of S8 to Li2S. 15
However, S8 is reduced in a step wise process to Li2S; first it is believed to be
reduced to long chain polysulfides, Li2Sx 84 x , and then to short chain polysulfides
6
42 x , before being fully reduced to Li2S. As shown in Figure 2,15 there are three
regions in a typical Li-S discharge curve when using ether electrolytes.16 The first spans
from the charged state, open circuit potential of approximately 3 V, to 2 V, and is the
reduction of S8 to Li2S4. The second region consists of the plateau at 2 V; it is the reduction
of Li2S4 to Li2S2. The final curved region is the reduction of Li2S2 to the final product of
Li2S.17 Long chain polysulfides are highly soluble in organic electrolytes while S8, Li2S2,
and Li2S are insoluble.8
Due to similar Gibbs energies of formation, the electrolyte contains a mixture of
the various polysulfide anions at equilibrium with each other throughout cycling.3, 8 While
a mixture of polysulfide anions is present throughout, certain species are thought to
dominate at various states of charge; below ~2.2 V, short chain polysulfides dominate
while above, long chain polysulfides dominate.18
Further complications arise from the interplay between electrochemical and
chemical reactions. The presence of disproportionation reactions also contributes to the
mixture of polysulfides. In disproportionation reactions, a single reactant is spontaneously
oxidized and reduced without an external electron transfer. Disproportionation reactions
are believed to form polysulfide radicals or dianions depending on the solvent used.19, 20
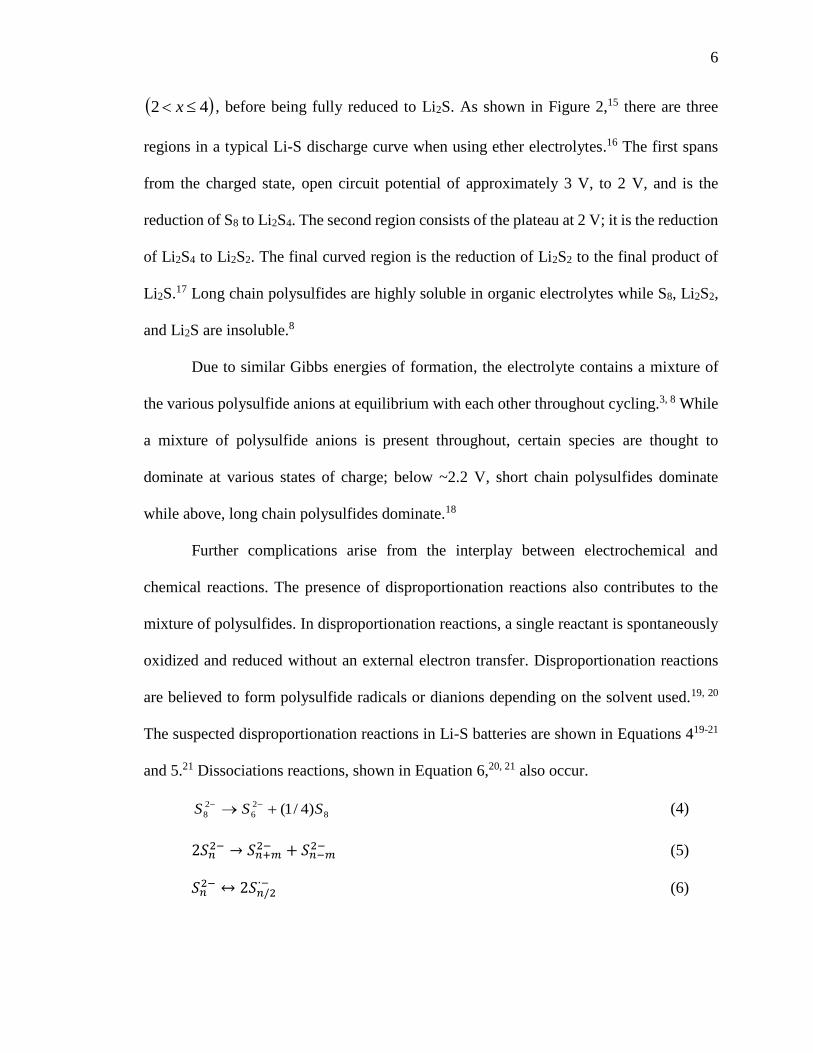
The suspected disproportionation reactions in Li-S batteries are shown in Equations 419-21
and 5.21 Dissociations reactions, shown in Equation 6,20, 21 also occur.
8
2
6
2
8 )4/1( SSS (4)
2𝑆𝑛2− → 𝑆𝑛+𝑚
2− + 𝑆𝑛−𝑚2− (5)
𝑆𝑛2− ↔ 2𝑆𝑛/2
∙− (6)

7
1.2.2 Obstacles to Lithium Sulfur Batteries
There are several difficulties with secondary Li-S
batteries that must be overcome in order to make them more
commercially viable.
One problem is that sulfur is highly insulating and
does not efficiently conduct electrons, as required of a
cathode. To address this issue, conductive carbon is often
added to increase conductivity. However, so much carbon is
currently required that the specific energy of the battery is
significantly decreased due to a decrease in active material
loading.2
Eroglu et al. performed a techno-economic analysis
on the use of Li-S batteries in electric vehicles and found that
a sulfur loading of approximately 7 mg/cm2 is necessary for Li-S batteries to be
economically feasible for use in electric vehicles.14 The loading of sulfur in the cathode
must remain high to maintain high specific energy, but must be conductive enough to
function as a cathode in a battery.
Another problem arises from the solubility characteristics of the discharge
products. The dissolution of polysulfide intermediates allows for the presence of a
detrimental process called the polysulfide shuttle mechanism. During the charge cycle of a
Li-S battery, long chain polysulfides (Li2Sx , 84 x ) diffuse to the anode where they are
reduced to short chain polysulfides (Li2Sx, 42 x ). The short chain polysulfides then
shuttle back to the cathode where a portion of them are partially oxidized to long chain
Figure 3: Polysulfide shuttle
mechanism during the charge
cycle. Long chain polysulfides
shuttle to the anode where they
are reduced to short chain
polysulfides. The short chain
polysulfides are then oxidized
back to long chain polysulfides
at the cathode. Figure adapted
from Ref. 2, 6
8
polysulfides, rather than completely to S8.2, 3, 22 The polysulfide shuttle leads to poor active
material utilization, damage to the anode, inefficient recharging, and rapid capacity fade.
In the presence of this shuttling behavior, complete recharging of a Li-S battery is not
possible.3 The polysulfide shuttling mechanism is shown pictorially in Figure 3.
In addition, Li2S and Li2S2 are highly insulating. The repeated precipitation of these
insoluble products leads to capacity loss with cycling as an insulating layer forms on the
cathode and anode.23 A volume expansion of approximately 80% also occurs due to the
density difference between Li2S and S8.2, 15, 20 The precipitated solids on the cathode and
anode are no longer fully electrochemically available and contribute to low active material
utilization and an increased cell resistance.23
Thus the obstacles to Li-S batteries can be summarized into four predominant
categories, including (1) the insulating nature of sulfur, (2) the solubility and mobility of
reaction intermediates in the electrolyte, (3) the volume change of the cathode, and (4) the
reactivity of the lithium anode.24
1.2.3 Mitigating the Polysulfide Shuttle and Other Difficulties
Current Li-S battery research attempts to reduce or eliminate the polysulfide shuttle
while maintaining a conductive cathode, high capacity, and high specific energy. Various
cathodes, electrolytes, and anode protectants have been developed for this purpose.
1.2.4 Cathodes
Before the cathode structure for Li-S batteries was well defined, low discharge
efficiencies were obtained when sulfur was in the solid form, due to its insulating nature.
As a result, there has been research into a liquid cathode. In 1979, Rauh et al. dissolved
lithium polysulfides (Li2Sn, n=5-8) in tetrahydrofuran (THF) with a solid electrolyte

9
preventing the anode from coming in direct contact with the liquid cathode.25 The result
was a rechargeable system with approximately 300 Wh/kg energy density. The
precipitation of insoluble Li2S was still a major obstacle for this system.
Since then, many contained cathodes have been produced with the goal of
increasing conductivity, retaining the specific energy of sulfur, and keeping sulfur
polysulfides from dissolving into the electrolyte.11, 26-31 Materials such as conductive
carbons and polymers have been added to sulfur to form a more electronically conductive
composite cathode. In particular, research has focused on conductive carbons due to higher
conductivities and capacities.
In 2002, Wang et al. demonstrated the performance of carbon-sulfur cathodes with
a reversible capacity of 440 mAh/g.31 Thermal treatment of the sulfur and carbon was seen
to further increase the capacity by improving sulfur utilization and cyclability.30
Pore size also plays an important role in contact between sulfur and carbon. Zhang
et al. concluded that the use of microporous carbon allowed for an increase in active
material utilization and battery life.32 Ji et al. studied the ability of mesoporous, CMK-3
carbon to support higher sulfur loadings through a larger carbon pore size.27 Cycle life was
also improved in a study by Han et al. in which multiwalled carbon nanotubes were used
as the conductive phase to help decrease sulfur dissolution.33
In 2013, Song et al. developed a sulfur graphene oxide (S−GO) nanocomposite
cathode modified with cetyltrimethyl ammonium bromide (CTAB).29 The cationic
modifier, CTAB, helped retain sulfur in the cathode and improved rate and cycle
capabilities.23, 29

10
Ji et al.34 built cathodes of sulfur immobilized on graphene oxide and saw reversible
capacities of 950 – 1400 mAh/ gram sulfur after 50 cycles. Building upon this concept,
polysulfide adsorption can be enhanced through the use of functional groups containing
oxygen, boron, nitrogen, and sulfur. Nitrogen in particular has shown promise in the work
by Qiu et al.35 which showed that it more evenly traps sulfur. This cathode in this work
yielded a capacity decay rate of only 0.028% per cycle.
1.2.5 Anodes
Lithium metal is the predominant anode for Li-S batteries because it has a high
capacity (~3860 mAh/g) and low voltage.2 Issues with lithium metal anodes in Li-S
batteries include dendrite formation, low lithium cycling efficiency, and the precipitation
of the insoluble polysulfides, Li2S and Li2S2, on the lithium surface. Dendrites are known
to form on lithium metal anodes; however, the ether solvent and polysulfides in Li-S
batteries cause additional parasitic reactions not seen in other systems.2 Dendrites are
believed to form due to an unstable solid electrolyte interphase (SEI) layer; this is caused
by uneven Li dissolution and plating.12 Dendrites can pose a safety concern as they can
cause the cell to short if they grow into the separator.
Passivation of the lithium anode can help mitigate these detrimental processes.
SION Power® added lithium nitrate (LiNO3) to ether electrolytes for Li-S batteries and
found that LiNO3 helps passivate the lithium anode, greatly increasing the capacity and
coulombic efficiency.23 The passivation layer consists of various LixNOy and LixSOy
species and helps to reduce the polysulfide shuttle mechanism by restricting the
precipitation of insoluble polysulfides.36

11
Other anodes such as silicon nanowires, lithium tin alloys, and hard carbons have
been investigated.2 The use of alternative anodes requires the addition of lithium to the
system because the anode can no longer act as the source of lithium. Yang et al. developed
a Li-S battery with a silicon nanowire anode and added lithium through the use of a Li2S-
mesoporous carbon cathode. Although this system achieved an initial discharge specific
energy of 630 Wh/kg, it showed significant capacity loss with cycling.2, 37 Another example
is the work done by Liu et al. in which prelithiated silicon is used as the anode. This work
successfully demonstrated a proof of concept in which the prelithiated silicon anode and a
sulfur, mesoporous carbon cathode obtained a first discharge capacity of approximately
800 mAh/g sulfur.38
1.2.6 Electrolytes
Electrolyte selection is imperative to the Li-S system because the solubility and
speciation of polysulfides can change greatly with varying electrolytes, therefore this
section will go into more depth than that of the cathode or anode sections.
Figure 4: Percentage of research focused on various electrolyte solvents for Li-S batteries.
Figure from Hagen et al. 39
12
Polysulfides are soluble in solvents with high basicity. The degree of solubility can
influence active material utilization, achievable discharge current densities, and cyclability
of the battery. Several different liquid electrolytes, as well as solid electrolytes have been
developed with the hope of shutting down the polysulfide shuttle while maintaining a high
capacity. The percentage of research focused on various liquid electrolytes was
summarized by Hagen et al. in Figure 4. In addition to changes in speciation, the amount
of electrolyte also greatly affects the performance of lithium sulfur cells as it can shift the
equilibrium of speciation and significantly decreases the energy density of the cell.40 This
parameter, the electrolyte to sulfur (E/S) ratio is currently often left out of research papers.
1.2.6.1 Non-Aqueous Organic Liquid Electrolytes
As with all battery systems, desirable electrolyte characteristics include high ionic
conductivity, no electronic conductivity, compatibility with cathode and anode materials,
stability at operation temperature and voltage, low cost, and a high degree of safety. The
viscosity and dielectric constant of the solvent affect the electrolyte’s conductivity; a low
viscosity and high dielectric constant are favorable for better ionic conductivity. It has been
found that using a mixture of solvents can sometimes yield a more electronically resistive
and ionically conductive electrolyte. An example is the use of one solvent with a high
dielectric constant and high viscosity and a second having a medium dielectric constant
and low viscosity.41 The donor number (DN) of the solvent also plays an important role in
Li-S battery electrolytes. The DN measures Lewis basicity and the ability of a solvent to
solvate cations and Lewis acids. It is the negative enthalpy value, in kcal per mole, to form
a 1:1 adduct between the described Lewis base and the standard Lewis acid, SbCl5.42
13
Some of the first electrolytes investigated for this chemistry used liquid aliphatic
amines as the solvent. Herbet and Ulam first used sulfur as a positive electrode in 1962
with an alkaline perchlorate, iodide, bromide, or chlorate dissolved in aliphatic amines.43
Moss and Nole patented metal-sulfur batteries using non-aqueous, organic solvents such
as ethylene carbonate, propylene carbonate, dimethoxyethane and γ-butyrolactone, for the
electrolyte in 1968.41 They recommended the use of lithium perchlorate as the salt. Other
possible salts at the time included lithium aluminum chloride, lithium fluoroborate, lithium
hexafluoroborate and lithium hexafluorophosphate.41
Carbonate electrolytes have since been largely dismissed due to irreversible side
reactions with polysulfides.44
In 1976, dimethyl sulfoxide (DMSO) was investigated, but reduction stopped at
S42- resulting in a low cell efficiency.44 Rauh et al. demonstrated the ability of Li-S batteries
to be recharged25 by using a cathode composed of carbon, an anode of lithium, and a
catholyte of ~5M sulfur in the form of Li2Sn and 1M LiAsF6 in THF. Although
rechargeable, these batteries began to degrade significantly after only 10-20 cycles. THF
was later shown to be unstable in the presence of lithium metal.44
In 1989, Peled et al. studied the performance of dioxolane (DOL) solvents in Li-S
batteries.45 The conductivity at varying temperatures, compatibility with lithium, and
discharge behavior were evaluated. DOL has a dielectric constant twice that of THF-
toluene making it much more ionically conductive which decreases the internal resistance
of the cell. Results from Peled et al. agreed with the expected trend: electrolytes having a
greater fraction of DOL had a greater conductivity. It was also shown that DOL is much
more compatible with lithium than THF or toluene and has a slower, more stable corrosion
14
rate when lithium was soaked in each respective solvent for 70 days. The discharge
behavior was also different when using DOL. The DOL solvent resulted in a sulfur
utilization of only 50%, as compared to 95% with THF-toluene, even at the low current
density of 100µA/cm2. In summary, DOL provides an order of magnitude increase in
conductivity and is more compatible with lithium, however it decreases sulfur utilization
as compared to THF-toluene.45
Ether based electrolytes, such as DOL, have high donor numbers and coordinate
with the lithium cations.44 Two ether electrolytes in particular, in addition to DOL, have
shown promise in the literature:
Tetraethylene glycol, dimethylether
(TEGDME) and 1,2-dimethoxyethane
(DME). Mixtures of dioxolane with
other such solvents have proved
beneficial. DOL and glyme solvents
typically have high lithium polysulfide
solubility; despite the detrimental
effects of the polysulfide shuttle,
solubility has allowed for better initial
electrochemical performance.44
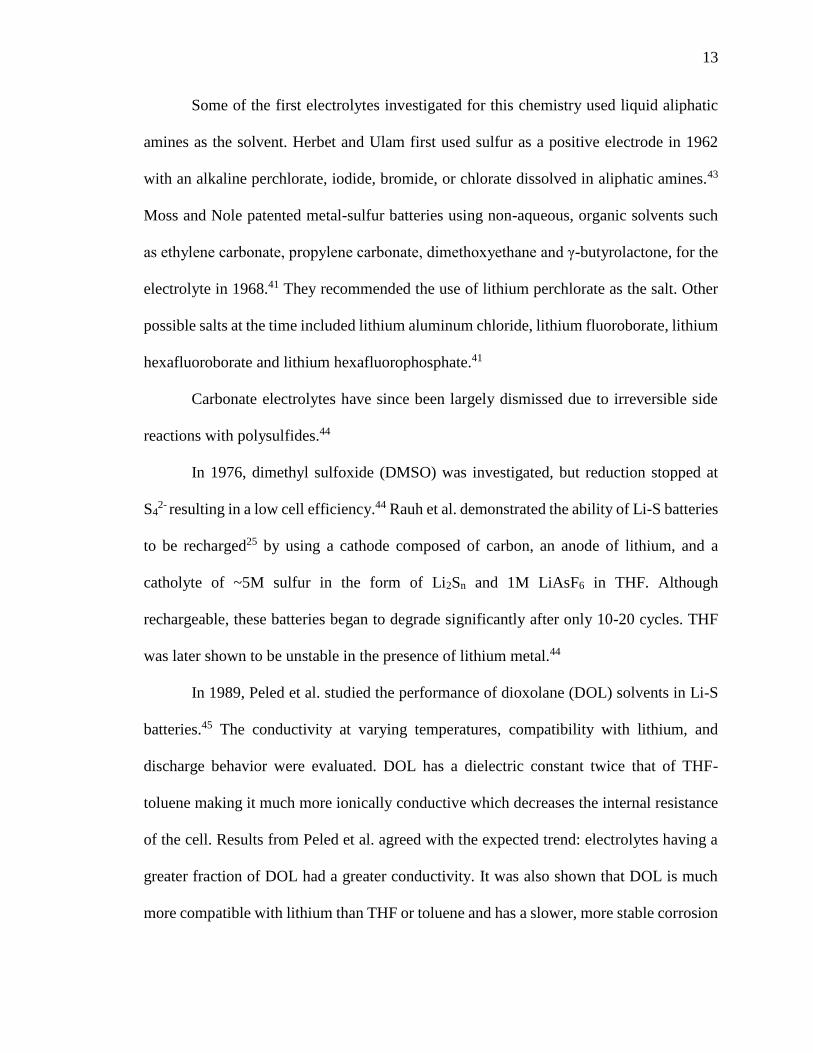
Gao et al. studied the performance of DME, DOL, TEGDME, and carbonate
electrolytes. As can be seen in Figure 5,46 from the charge/discharge profiles, the ether
electrolytes perform better than carbonate based electrolytes. In 2013, Barchasz et al.
investigated the cause for the poor performance when using carbonate electrolytes. They
Figure 5: Discharge and charge profiles of various
ether and carbonate solvents for the electrolyte.46
15
showed that changing the lithium salt did not affect the performance, indicating the solvent
was most likely the component negatively affecting performance. Barchasz et al. concluded
that the poor performance had two causes: (1) polysulfides have a low solubility in
carbonate solvents and (2) the carbonate solvents are reactive and unstable in the presence
of polysulfides.47 The carbonate electrolytes thus have very low charge and discharge
capacities and low active material utilization.
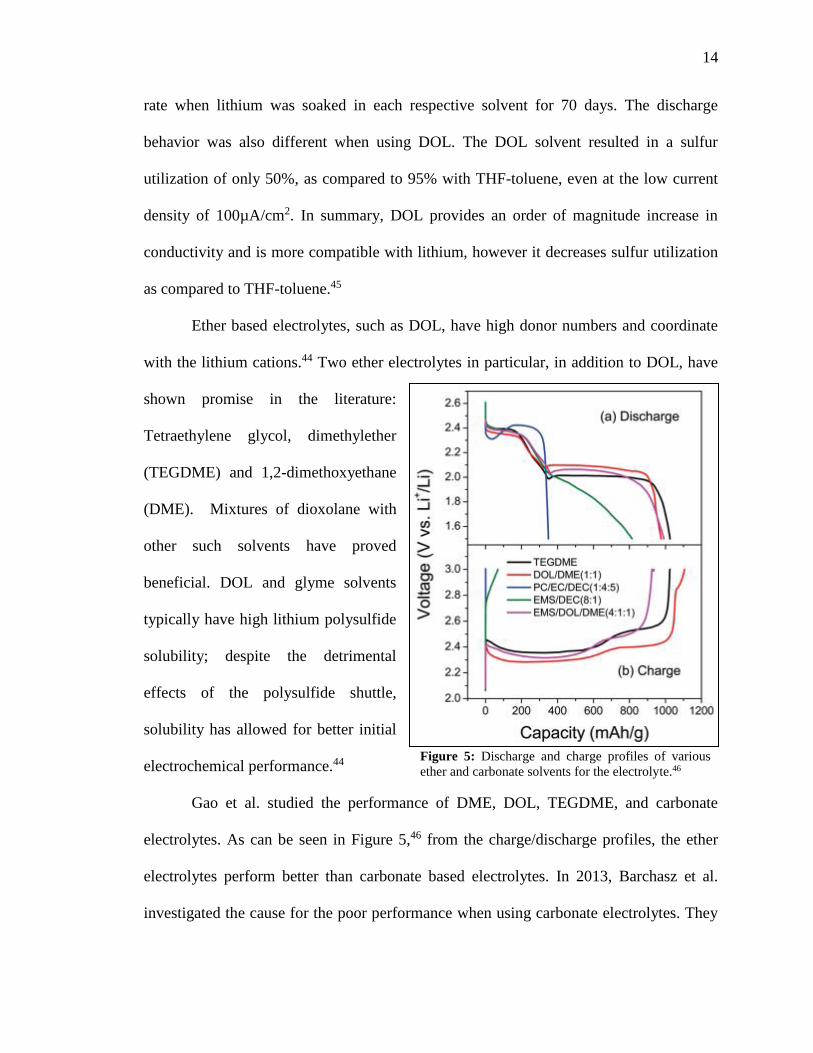
The salts dissolved in a solvent to create the electrolyte also play an important role.
Examples of salts that have been used in Li-S batteries include LiTf, LiTFSI, LiPF6, and
LiClO4.48 These salts are popular for their thermal stability and compatibility with ether
solvents. A complete listing of Li-S battery salts with chemical structures is shown in
Figure 6. LiTf and LiTFSI are the two most commonly used salts. LiTFSI has largely taken
the place of other salts due to a two-fold increase in conductivity over its closest competitor,
LiTf, and high dissociation ability. Typically, these salts are dissolved in the solvent at a
concentration of ~1M. However, greater concentrations have been explored. Greater
Figure 6: Lithium salts used in Li-S battery electrolytes.48

16
concentrations of salts generally decrease polysulfide solubility and slow the diffusion of
polysulfides through the electrolyte.48 In the extreme case of solvent in salt (SIS)
electrolytes, the salt concentration can be up to 7 M, and the salt becomes the majority
component by volume and weight.48, 49 The SIS electrolyte decreases lithium polysulfide
dissolution and protects the Li anode by limiting dendrite growth.49 The greatest downside
to SIS electrolytes is the cost of using such a large quantity of salt.
The success of ether solvents and salts such as LiTFSI and LiTf in Li-S batteries is
possible due to the lower operation voltage as compared to other lithium battery systems.48
Additives are commonly used in lithium ion batteries. The most prevalent example
in the Li-S system is lithium nitrate (LiNO3). LiNO3 stabilizes the lithium anode in DOL
electrolytes by reacting with polysulfides and forming a passivating film on the anode
surface.48 LiNO3 improves coulombic efficiency and stabilizes the reversible discharge
capacity.50 In contrast to this desired effect, LiNO3 can be irreversibly reduced at low
potentials, forming a film on the cathode and decreasing cell performance. This is
prevented by stopping cell discharge at 1.6 V. Below this value, the undesired reduction of
LiNO3 will occur.48
Another common additive to non-aqueous electrolytes is polysulfides. Polysulfides
have been added to electrolytes both as a catholyte, where the only sulfur is in the
electrolyte, and as an addition to a sulfur-carbon cathode. Polysulfides, along with LiTFSI,
can also form a protective layer on the Li anode.48
Thus, the evolution of solvents for Li-S battery electrolytes progressed from
saturated aliphatic amines to propylene carbonate, THF-toluene, and lastly to dioxolane-
based electrolytes.43 Dioxolane-based solvents are commonly used for Li-S batteries today.
17
1.2.6.2 Ionic Liquid Electrolytes
Ionic liquids (ILs) are another candidate for electrolytes. They have gained interest
for a variety of electrochemical systems due to their non-flammability, non-volatility,
safety, high ionic conductivity, and large electrochemical stability window. Their greatest
drawback is a high viscosity leading to poor mobility. Their application in Li-S batteries
has not been heavily researched. Since Li-S batteries have a smaller voltage range than
other Li battery systems, the main advantage to ILs is the ability to design for varying
levels of polysulfide solubility. The first case of a pure, room temperature ionic liquid in a
Li-S cell was studied by Yuan et al. in 2006.48, 51 N-methyl-N-butyl-piperidinium (PP14)
bis(trifluoromethane)sulfonimide (TFSI) was used with a lithium anode and 1:3, sulfur:
acetylene black carbon, cathode. This combination resulted in a first discharge capacity of
1055 mAh/g and a reversible capacity, up to 10 cycles, of 750 mAh/g. The sulfur utilization
was 63% which was higher than organic liquid electrolytes at that time.51
TFSI, the same anion used in liquid organic electrolytes, is the most common anion
used in ILs for Li-S batteries. Conversely, cations in ILs vary greatly in the literature, but
are typically in the imidazolium and pyrrolidinium families.48 Park et al. studied a variety
of binary mixtures of ionic liquids and lithium salts. The solubility of polysulfides in the
IL was found to be largely dependent on the structure and donor number of the anion. It
was shown that Nbutyl-N-methylpyrrolidinium ([P14]+) with trifluoromethanesulfonate
([OTf]−) [P14][OTf], with a large donor number had a high saturation concentration of
polysulfides, comparable to that in TEGDME electrolytes. The less basic (lower donor
number) ILs, with bis(trifluoromethanesulfonyl)amide ([TFSA]−) as the anion, had a much
lower polysulfide solubility. This corresponded to a higher capacity retention after 50

18
cycles when using [P13][TFSA] (~750 mAh/g sulfur) as compared to [P14][OTf] (~200
mAh/g sulfur).52
Mixtures of non-aqueous organic and ionic liquids have also been investigated due
to a lower cost. Examples include mixtures of IL with DOL-DME or with pure DME. A
mixture of 10% EMIMBETI and BMIMPF6 and 0.5 M LiTf or 0.5 M LiPF6 DOL:DME
(1:4 v/v), the discharge capacity and cyclability were improved at -20°C and -10°C. At
0.5C and over 100 cycles, the capacity remained greater than 600 mAh/g sulfur.48
IL electrolytes in Li-S batteries is still an under-researched field; there are
opportunities for further research into balancing ratios of organic and ionic liquids as well
as further research into various cations and anions.48
1.2.6.3 Solid Electrolytes
Solid electrolytes define the last major category of electrolytes for Li-S batteries.
Advantages to solid electrolytes include inherent safety, improved Li anode stability, and
potential to control solubility of polysulfides. Solid electrolytes are safer because they are
more thermally stable, less likely to leak, and less volatile. With these advantages comes
the issue of poor ionic conductivity at room temperature and poor rate capability; solid
state lithium sulfur batteries tend to operate at elevated temperatures limiting their
applications.
There are three main areas of research for solid electrolytes: gel polymer, solid
polymer, and glassy electrolytes.
An example of a gel polymer electrolyte was demonstrated by Ryu et al. A PVDF
gel electrolyte was used with a sulfur-carbon black cathode and Li anode at room
temperature. The first discharge had a capacity of 1268 mAh/g sulfur at a rate of 0.10 C

19
and had the same two plateaus as in ether liquid electrolytes. Performance decreased to
1028 mAh/g sulfur after the first cycle and the first characteristic plateau of the reduction
of long chain polysulfides was no longer present. This could be indicative of decreased
solubility of long chain polysulfides in the solid electrolyte.48, 53
Solid polymer electrolytes require operation at temperatures between 70 and 90°C.
They are typically based on short chain polyethylene oxides (PEO). Mixtures of salts and
PEO have led to poor ionic conductivities. In an attempt to decrease the operation
temperature and increase rate capability, nanoparticles have been incorporated into the
PEO matrix as fillers. The performance is believed to be enhanced by the nanoparticles
interacting with the PEO oxygen atoms and electrolyte anions, which causes decreased
interaction with Li+ and increased Li+ mobility.48 Syzdek et al. studied the preparation and
application of alumina and titania based fillers of different grain sizes in polymer
electrolytes and found that preparation method, in addition to nanoparticle filler material,
greatly affects electrolyte properties and performance.54 A promising filler, ZrO2, was
proposed by Hassoun and Scrosati. With 10% ZrO2 added to the solid PEO electrolyte, an
improved ionic conductivity, Li+ transference number, and electrode-electrolyte stability
was observed.48, 55 A first discharge capacity of 900 mAh/g sulfur was obtained at 0.05C.
Rate capability and cycle life still need to be improved.55
Lastly, glassy electrolytes have been studied. Nagao et al. used a carbon-sulfur
cathode, a Li2S-P2S5 glass-ceramic solid electrolyte, and a lithium metal anode. A lithium
thin film, synthesized by vacuum evaporation, was inserted between the lithium and
electrolyte. The lithium thin film aided reversible Li dissolution and deposition. This solid

20
state battery achieved a discharge capacity of 900 mAh/g sulfur after 20 cycles, but at the
low rate of 0.03C.48, 56
1.2.7 Conclusions
Lithium sulfur batteries are gaining interest as the next high energy density battery.
This section provided a brief sampling of the current and past research in this fast-growing
field. Further research into the retention of the polysulfides near the cathode and the
prevention of parasitic reactions between the polysulfides and lithium anode is required.
New passivation techniques, cathodes, and alternative anodes are needed to help increase
the cycle life of the lithium-sulfur battery. Lastly, a better understanding of the polysulfide
shuttle and the reaction mechanism of the reduction of sulfur will aid in these
developments.
This work will focus on addressing the high solubility and mobility of polysulfides in
electrolyte as well as chemical side reactions. Insight into the mechanism of the sulfur
redox reaction can be gained by a better understanding of polysulfide speciation including
at what state of charge a certain polysulfide species appears, where it is located in the cell
with respect to the electrode, and what the speciation is when the cell is at equilibrium. In
situ and ex situ characterization techniques, including Raman spectroscopy, can provide
this information, which can potentially aid in methods to suppress the polysulfide
dissolution and shuttle.
Characterization of Lithium Polysulfides
1.3.1 Characterization Techniques
Many in situ and ex situ characterization techniques have been used to study the
cathode, anode, separator, and electrolyte of lithium sulfur batteries. Table 2 lists a brief
21
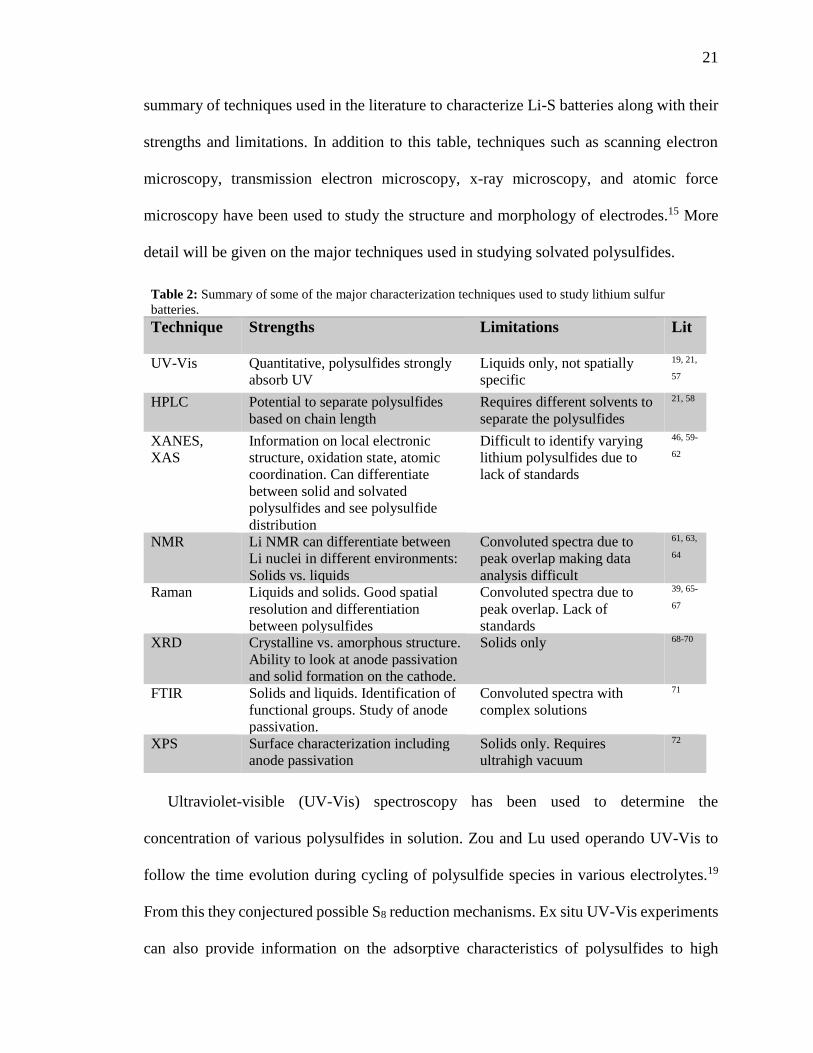
summary of techniques used in the literature to characterize Li-S batteries along with their
strengths and limitations. In addition to this table, techniques such as scanning electron
microscopy, transmission electron microscopy, x-ray microscopy, and atomic force
microscopy have been used to study the structure and morphology of electrodes.15 More
detail will be given on the major techniques used in studying solvated polysulfides.
Ultraviolet-visible (UV-Vis) spectroscopy has been used to determine the
concentration of various polysulfides in solution. Zou and Lu used operando UV-Vis to
follow the time evolution during cycling of polysulfide species in various electrolytes.19
From this they conjectured possible S8 reduction mechanisms. Ex situ UV-Vis experiments
can also provide information on the adsorptive characteristics of polysulfides to high
Table 2: Summary of some of the major characterization techniques used to study lithium sulfur
batteries.
Technique Strengths Limitations Lit
UV-Vis Quantitative, polysulfides strongly
absorb UV
Liquids only, not spatially
specific
19, 21,
57
HPLC Potential to separate polysulfides
based on chain length
Requires different solvents to
separate the polysulfides
21, 58
XANES,
XAS
Information on local electronic
structure, oxidation state, atomic
coordination. Can differentiate
between solid and solvated
polysulfides and see polysulfide
distribution
Difficult to identify varying
lithium polysulfides due to
lack of standards
46, 59-
62
NMR Li NMR can differentiate between
Li nuclei in different environments:
Solids vs. liquids
Convoluted spectra due to
peak overlap making data
analysis difficult
61, 63,
64
Raman Liquids and solids. Good spatial
resolution and differentiation
between polysulfides
Convoluted spectra due to
peak overlap. Lack of
standards
39, 65-
67
XRD Crystalline vs. amorphous structure.
Ability to look at anode passivation
and solid formation on the cathode.
Solids only 68-70
FTIR Solids and liquids. Identification of
functional groups. Study of anode
passivation.
Convoluted spectra with
complex solutions
71
XPS Surface characterization including
anode passivation
Solids only. Requires
ultrahigh vacuum
72

22
surface area carbons as done by Jozwiuk et al.57 Barchasz et al. used a combination of ex
situ high performance liquid chromatography (HPLC) and UV-Vis to discuss
disproportionation reactions and the reduction of S8.21
HPLC has been used in conjunction with electron spray ionization (ESI) mass
spectroscopy to study derivatized polysulfides removed from a lithium sulfur cell.58 The
direct injection of sodium polysulfide standards (in solvent without salt) into an ESI-mass
spectrometer was also looked at during this study. The results are shown in Figure 7. The
Figure 7: A.) (-) ESI/MS spectra of Na2S and S8 in DME, molar ratio of Na2S:S
is 1:3 through direction infusion. B.) (-)ESI/MS spectrum of electrolyte sample
from a discharged Li-S battery by HPLC (-) ESI/MS58

23
LiTFSI signal overwhelms the mass spectrometer and no polysulfide peaks are seen. The
use of HPLC requires the use of polysulfides in varying polar and nonpolar solvents to
achieve any separation, so it must be noted that the speciation almost certainly changes
from that seen in electrolyte.
X-ray absorption spectroscopy (XAS) and x-ray absorption near edge structure
(XANES) spectroscopy have been popular characterization techniques in the Li-S literature
for their ability to differentiate between polysulfide oxidation states. Gao et al. used in situ
XAS to show that carbonate based electrolytes chemically react with solvated polysulfide
species leading to poor battery performance.46 Cuisiner et al. studied polysulfide speciation
using in situ XANES along with solid polysulfide reference standards.59 They were able to
study the S8 and Li2S dissolution and deposition during cycling as well as provide evidence
for the initial stepwise reduction of S8 to Li2S6 and Li2S4.
Work from the same group used in situ Li NMR to distinguish between solvated and
precipitated polysulfides.63 This analysis provided insight into the polysulfide shuttle that
occurs despite the presence of LiNO3, which impedes, but does not stop the process. A
greater quantity of solid Li2S precipitate was observed on the lithium anode over the
cathode after cycling; this result verifies the presence of the polysulfide shuttle.
The last major technique used to study solvated polysulfides is Raman spectroscopy.
Raman spectroscopy was chosen for the present work because it can be used to gain
information from both the solid and liquid states. It also has good spatial resolution
allowing spectra to be obtained from a specific location relative to the electrodes. Lastly,
polysulfides are highly Raman active, although there is some peak convolution due to peak
overlap.

24
1.3.2 Polysulfide Standards
Most characterization techniques used to analyze Li-S batteries suffer from a lack
of lithium polysulfide standards to compare spectra peaks to. It is difficult, if not
impossible, to isolate a single polysulfide chain length in solution due to disproportionation
reactions and rapid equilbirum.39, 58, 59
Due to the lack of lithium polysulfide reference materials, many have researched
ways to synthesize standards. Rauh et al. studied ways to form lithium polysulfides in
various aprotic solvents and studied the resulting solutions using UV-Vis spectroscopy.73
The two chemical methods explored included the chemical reaction of S8 solid and lithium
metal (Equation 7) and the reaction of S8 and Li2S (Equation 8).
2𝐿𝑖 +𝑛
8𝑆8 → 𝐿𝑖2𝑆𝑛 (7)
𝐿𝑖2𝑆 +(𝑛−1)
8𝑆8 → 𝐿𝑖2𝑆𝑛 (8)
The reaction of Li2S and S8 is faster and more easily controlled than Equation 7 and
has been used as a standard for a variety of characterization techniques.39, 58 Despite the
appearance of chemically synthesized lithium polysulfides as standards, there does not
seem to be a standardized reaction time. The stability of the lithium polysulfides are also
unknown.
Hagen et al. chemically synthesized polysulfide standards and analyzed them using
Raman. The standards were sealed under air and the S3- radical peak was the only intense
polysulfide peak observed.39
Cuisinier et al. did have some success in isolating Li2S6 as a solid, however the
other chain lengths were found to be unstable. Upon re-solvating the Li2S6 reference, a
mixture of polysulfides was observed.59

25
Confocal Raman Microscopy
Confocal Raman microscopy couples a Raman spectrometer with an optical
microscope. Raman is a popular characterization method and is used in a wide range of
fields from biology to physics. It has applications in space, medicine, and biology to specify
chemical substances, determine dynamics of structural changes, and identify the signals of
various diseases. The pairing of confocal microscopy with Raman spectroscopy has
allowed for chemical mapping and imaging with a single instrument.74
1.4.1 Confocal Microscopy
A combination of concave and convex lenses are used in objectives and
microscopes in order to achieve achromatic performance to magnify a sample. Confocal
microscopes use a point light source, typically a laser, that is detected through an aperture
or pinhole. Only light from the point source will be seen by the detector through the
pinhole. The spot size is determined by the light wavelength, λ.74 There are several
advantages to confocal over conventional microscopes. Confocal microscopes have the
ability to adjust the analysis area in the XY and Z directions, allowing for the formation of
a 3D image by changing the distance of the sample from the objective. Optical cross
sections can be sampled without physically cutting the specimen. Detection through the
aperture reduces the scattering of light and increases the image contrast. The lateral
resolution is also enhanced by a factor of 2 when an appropriate pinhole size is chosen.74
The numerical aperture (NA) is important because it, along with wavelength,
determines the resolution of the microscope. NA is defined in Equation 9. It is dependent
on one half of the acceptance angle, θ.74 The acceptance angle is half the angle of the cone

26
of light that can possibly pass through the objective. The refractive index, n, is based on
the material the light is traveling through, n=1 in air.
sinnNA (9)
The larger the NA, the smaller the diffraction limit and the greater the resolution.
This can be seen from Abbe diffraction limit (Equation 10).
NAd
61.0 (10)
The light spot diameter (d) is directly proportional to the wavelength divided by
the numerical aperture and is indicative of the smallest feature that can be resolved. Thus
it is important to note the objective (magnification and NA), wavelength, and detector used
in experiments.
1.4.2 Raman Spectroscopy
Raman is a vibrational spectroscopy technique based on the inelastic scattering of
light. There are three types
of light scattering. First, is
Rayleigh, elastic light
scattering. It is
present when the
polarizability of the
molecule is at equilibrium
and is always nonzero when
an external electric field is applied; it has the same frequency as the incident light. The
second two types of light scattering are inelastic and represent a shift away from
polarizability equilibrium. Stokes scattering, scatters light with a lower energy than the
Figure 8: Jablonski Diagram depicting Rayleigh, Stokes, and Anti-
Stokes scattering.75

27
excitation source, resulting in a final state at higher energy than the ground state. Anti-
Stokes scattering, scatters light at a higher energy than the incident light. The differences
between Rayleigh, Stokes, and Anti-Stokes scattering can be seen in Figure 8.74 Stokes
Raman scattering is what typically gives rise to a Raman spectrum.
Raman spectroscopy compliments infrared (IR) spectroscopy because
vibrations with weak or nonexistent IR signals may have strong Raman signals, and vice
versa. This contrast is due to a difference in selection rules between the two spectroscopies.
IR is also a vibrational spectroscopy, but it looks at light absorption rather than light
scattering. Thus, IR measures a change in permanent dipole moment as a vibrational
motion occurs, instead of a change in polarizability as the motion occurs. Therefore,
symmetrical vibrations can be seen using Raman, but not IR because there is no change in
permanent dipole moment.
One major disadvantage to Raman is that signals are generally very weak. Two
main approaches have been developed to help enhance the Raman signal: resonance Raman
scattering and surface-enhanced Raman scattering. These methods attempt to increase the
square of the polarizability and electric field, which are directly proportional to the
intensity of inelastic, scattered light as seen in Equation 11.74
2
0
4
0
2
0
Eq
I q
q
Stokes
(11)
Where α is the polarizability, q is the qth normal coordinate, q 0 is the
frequency of the scattered light, and E0 is the external electric field amplitude of the
incident light. The two parameters that can be varied experimentally to change the intensity

28
are 0 and E0 which correspond to adjustments in the laser frequency and laser power
respectively.74
The already weak Raman signal is further reduced when focused with
confocal microscopy. While the signal of interest is decreased, confocal focus also reduces
fluorescence which can be useful when using Raman. Fluorescence often overwhelms the
signal of interest because it is usually a more efficient relaxation method than inelastic
scattering.76 Due to weak signals, the Raman spectrometer settings, such as laser
wavelength, laser power, location within sample, and integration time are paramount to
obtaining successful spectra.
The wavelength contributes to the determination of spot size (Equation 10).
Wavelengths between 400 nm and 900 nm are often used. Wavelengths below 400 nm
provide stronger Raman scattering, but it is difficult to find an objective that will work in
this range. As the wavelength increases, the fluorescence also increases.74
The excitation power of the laser is directly proportional to the Raman
scattering intensity. A higher power can yield a better spectrum; however, a higher value
can also damage the sample. An acceptable power setting depends on the properties of the
material and can vary between a few microwatts and hundreds of milliwatts.74
Since the Raman signal is weak, taking averages of spectra can help separate
the significant signals from noise. Integration time is the period of time over which the
detector collects photons before the data are processed. The number of accumulations
specifies how many spectra will be taken. Often all accumulations are averaged to create a
single spectrum. Increasing the number of accumulations and the integration time will
provide a clearer spectrum; however, it also increases the experiment’s duration.

29
The invention of the charge-coupled device (CCD) camera greatly reduced
Raman testing times. The CCD camera allows for line scanning rather than point scanning
as was done by photomultiplier tubes (PMTs). PMTs were also only sensitive for a small
range of wavelengths; CCDs have a higher quantum efficiency for a wider range of
wavelengths.74
Before the signal reaches the CCD, the light goes through a grating. The
grating diffracts the various incoming wavelengths of light to different regions of the CCD.
A higher density grating means there are more diffraction lines and a higher spectral
dispersion and resolution can be achieved.76
To enable experiments to be reproduced, the following should be reported:
Raman system used, grating, resolution, laser wavelength, laser power, objective,
integration time, and the number of accumulations.
1.4.3 Raman to Analyze Lithium Sulfur Batteries
The behavior of dissolved polysulfides during the cycling of Li-S batteries is
important to understanding the mechanisms of capacity fade, self-discharge, and other
relevant battery metrics. The use of in situ Raman can reveal the polysulfide speciation as
a function of state of charge. Particular attention is given to changes in peak intensity,
width, and position.
Polysulfide anions have been studied before using Raman spectroscopy and have
been shown to have strong Raman signals between 100 and 600 cm-1.67 Janz et al.
demonstrated the Raman activity of polysulfides through the Raman characterization of
polycrystalline polysulfides, including inorganic potassium,77 barium,78 and sodium79
polysulfides. Each of these inorganic polysulfides had Raman peaks between 20 and 600

30
cm-1. El Jaroudi also studied the effect of the coordinating cation in solid polysulfides by
looking at sodium, potassium and rubidium.80, 81 The change in coordinating cation
changed the bond length of the sulfur- sulfur bonds.
Polysulfides have also been studied in various solvent systems using Raman.82-85
Dubois et al. studied polysulfide speciation in liquid ammonia using Raman.85 Li2S4
solutions were generated by dissolving stoichiometric amounts of sulfur and lithium sulfide
in ammonia. The S3- radical peak was present at 535 cm-1, but was very weak. At room
temperature, the other polysulfide peaks occurred at 490m, 472m, 430vs, 236vw, and
188vs (letters symbolize relative strength of peak intensities, with vs indicating very strong,
m indicating moderate, and vw indicating very weak). The S3- radical was found to be in
equilibrium with S62- and S4
2-. Other radicals were not observed. The temperature
dependence of the speciation was also studied and it was shown that as temperature
decreased, the 535 cm-1 peak was no longer present. When the same experiment was done
with Na2S4, different peaks were observed at 535vs, 485m, 469m, 437vs, and 191vs.
Work done by Yeon et
al.86 used ex situ Raman to study
the change in the cathode with
cycling in TEGDME and DOL
electrolytes. They were able to see
Li2S at the fully discharged state.
They also observed the S3- radical
ex situ and concluded that it is
fairly stable.
Figure 9: Figure from Suo et al.66 showing the effect of
LiTFSI concentration variation in 1:1 DME:DOL electrolyte
on Raman spectrum.

31
Raman has also been used to study common Li-S electrolytes, without
polysulfides present. Suo et al. examined how the Raman spectrum changed when the
concentration of LiTFSI in a 1:1 v/v solvent of dimethoxyethane (DME) and 1,3-dioxolane
Figure 10: Raman spectra during the discharge (A) and charge (B) of a
lithium sulfur in situ cell. The dotted lines are monoanions based on DFT
calculations and literature values gathered by Hagen et al.39
A
B
32
(DOL) was varied .66 As shown in Figure 9, varying the LiTFSI concentration can
shift its most intense peak by 7 cm-1, from 747.3 cm-1 (pure LiTFSI) to 740.7cm-1 (1 M
LiTFSI).
All these studies demonstrate that system properties, such as concentration, solvent,
coordinating cation, state (liquid vs. solid), and temperature can greatly affect peak
positions and intensities.
Two in situ Raman studies of polysulfide speciation in Li-S batteries have been
published in the literature.
In 2013, Hagen et al. used density functional theory (DFT) to calculate theoretical
vibrational modes of lithium polysulfides as well as gather an extensive summary of
polysulfide peaks seen in the literature.39 The DFT calculations and literature values were
then compared to experimental results from in situ Raman spectroscopy. The Raman
spectra taken during discharge are shown in Figure 10. Full oxidation back to S8 was
observed upon recharging. It was also seen that both mono-anions and di-anions of the
polysulfides were present at all states of charge. Chemically synthesized lithium
polysulfide standards were made and sealed under air to compare to the in situ spectra. The
S3- radical was observed in the standards, but not other polysulfide peaks. The experiments
in this paper utilized a DME-DOL solvent system with LiTFSI and LiNO3.
In 2015, Wu et al. performed a similar study of polysulfides as a function of state
of charge. Raman was supplemented with cyclic voltammetry (CV) experiments. The
intensities of the different polysulfide signals were tracked as a function of state of charge
(Figure 11).

33
S8 decreased in intensity, but was present until 2.2 V. At 2.4 V the intensity of S8 dropped
by ~50% and the peaks corresponding to polysulfide anions S4-, S4
2-, and S3.- begin to
increase in intensity. These species disappeared again at 1.8 V. These transitions were
substantiated by the CV experiments, which showed reduction and oxidation peaks at
similar voltages.
Figure 11: Figure from Wu et al. depicting a cyclic voltammogram of a Li-
S cell (black y-axis) and changes in polysulfide peak intensities during
discharge (red axis). 67
Table 3: Comparison of important parameters for the Wu et al.67 and Hagen et al.39 papers
Parameter Hagen et al.39 Wu et al.67
Laser Power (mW) 20 Unknown
Laser Wavelength
(nm) HeNe, 632.8 HeNe, 632.8
Objective 100x Unknown
Numerical Aperture Unknown Unknown
Integration time
(sec) Unknown 75-150
Location in cell Near electrode surface to see
solvated and solid species Unknown
Electrolyte 200 µL DME: DOL (2:1 v/v),
0.7M LiTFSI, 0.25 M LiNO3
20 mL TEGDME: DOL
(1:1 v/v), 1 M LiTFSI
E/S Ratio
(mL/gram S) 45 Unknown
34
A comparison of vital information from these papers is summarized in Table 3.
Both papers fail to mention several important parameters required to reproduce their work.
In particular Wu et al. did not mention their E/S ratio, however since 20 mL was used with
a standard 60:30:10 sulfur: Super P: PVDF cathode, the ratio is assumed to be around 100
times that of Hagen et al.
Research Motivation
The high solubility and mobility of polysulfides in common Li-S battery electrolytes,
along with chemical side reactions, create a complex equilibrium of polysulfide species
and have a detrimental effect on battery performance. To gain a better understanding of the
Li-S battery chemistry, Raman microscopy was used to track polysulfide speciation during
the cycling of a Li-S cell.
Both of the in situ Raman studies discussed above used electrochemical cells specially
designed for Raman, rather than a standard battery prototype. Wu et al. used 20 mL of
electrolyte.67 The quantity and type of the electrolyte, as well as the cell setup, can greatly
affect the polysulfide speciation.40 The research reported here attempted to use in situ
confocal Raman microscopy to study the polysulfide speciation in lithium sulfur batteries
as a function of state of charge and position while in a more realistic cell setup.
The use of chemically synthesized standards has only been studied using Raman when
sealed under air as done in the work of Hagen et al.39 Additionally, the literature arbitrarily
analyzes the polysulfide standards immediately after mixing overnight. A standardized
definition of the stability of the polysulfides or when the standards should be analyzed has
not been defined.

35
Therefore, the current research evaluated the stability of chemically synthesized
polysulfide standards and related the resulting Raman peaks to those of an in situ Li-S
battery. By providing both a set of oxygen free standards and working with technically
relevant E/S ratios, a more realistic and accurate accounting of speciation within a cycling
Li-S cell was sought.
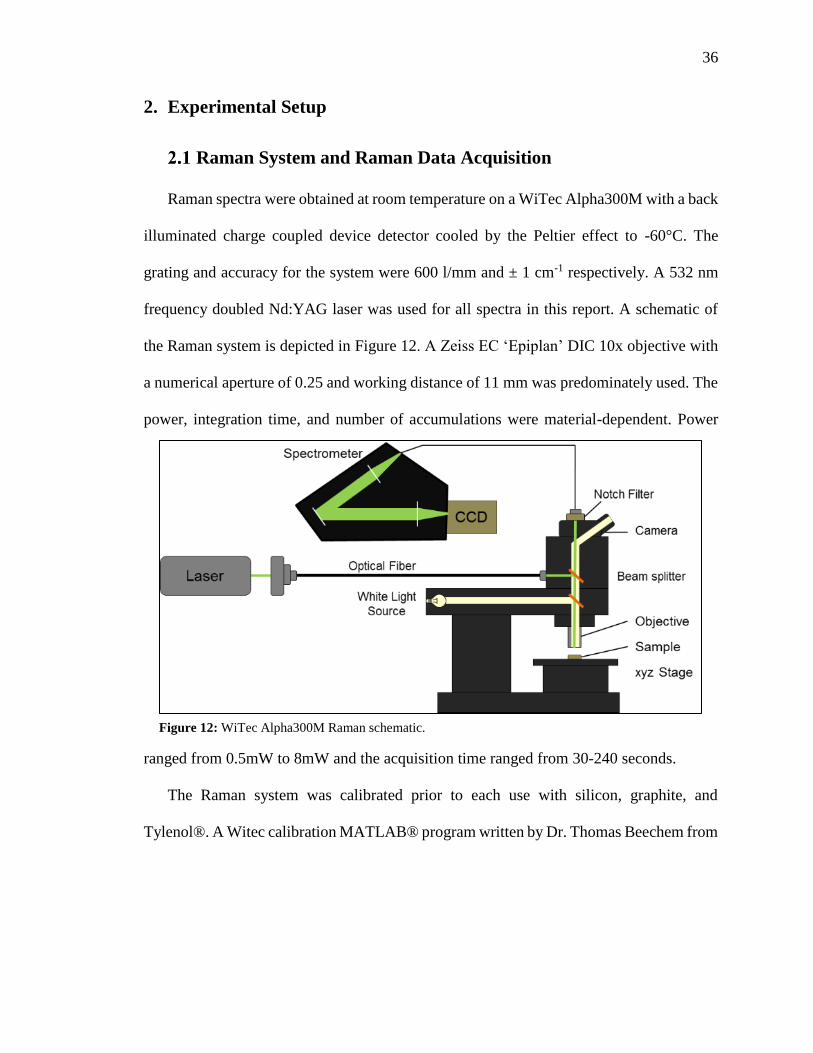
36
2. Experimental Setup
Raman System and Raman Data Acquisition
Raman spectra were obtained at room temperature on a WiTec Alpha300M with a back
illuminated charge coupled device detector cooled by the Peltier effect to -60°C. The
grating and accuracy for the system were 600 l/mm and ± 1 cm-1 respectively. A 532 nm
frequency doubled Nd:YAG laser was used for all spectra in this report. A schematic of
the Raman system is depicted in Figure 12. A Zeiss EC ‘Epiplan’ DIC 10x objective with
a numerical aperture of 0.25 and working distance of 11 mm was predominately used. The
power, integration time, and number of accumulations were material-dependent. Power
ranged from 0.5mW to 8mW and the acquisition time ranged from 30-240 seconds.
The Raman system was calibrated prior to each use with silicon, graphite, and
Tylenol®. A Witec calibration MATLAB® program written by Dr. Thomas Beechem from
Figure 12: WiTec Alpha300M Raman schematic.
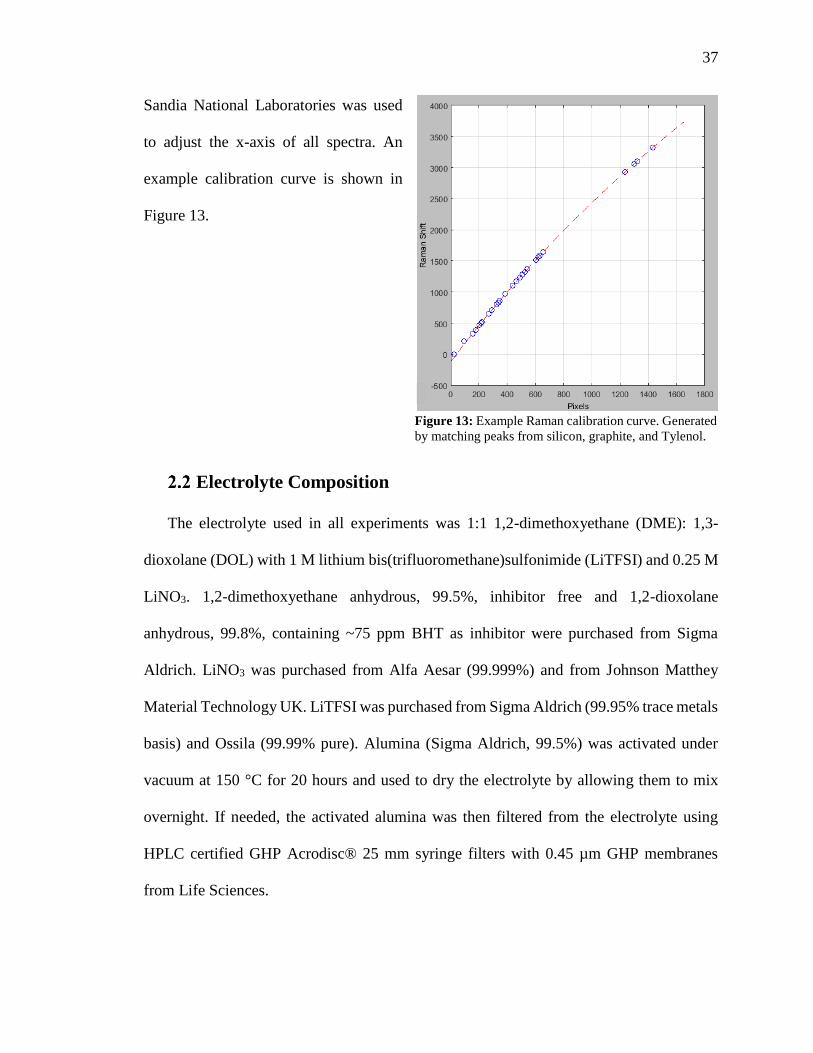
37
Sandia National Laboratories was used
to adjust the x-axis of all spectra. An
example calibration curve is shown in
Figure 13.
Electrolyte Composition
The electrolyte used in all experiments was 1:1 1,2-dimethoxyethane (DME): 1,3-
dioxolane (DOL) with 1 M lithium bis(trifluoromethane)sulfonimide (LiTFSI) and 0.25 M
LiNO3. 1,2-dimethoxyethane anhydrous, 99.5%, inhibitor free and 1,2-dioxolane
anhydrous, 99.8%, containing ~75 ppm BHT as inhibitor were purchased from Sigma
Aldrich. LiNO3 was purchased from Alfa Aesar (99.999%) and from Johnson Matthey
Material Technology UK. LiTFSI was purchased from Sigma Aldrich (99.95% trace metals
basis) and Ossila (99.99% pure). Alumina (Sigma Aldrich, 99.5%) was activated under
vacuum at 150 °C for 20 hours and used to dry the electrolyte by allowing them to mix
overnight. If needed, the activated alumina was then filtered from the electrolyte using
HPLC certified GHP Acrodisc® 25 mm syringe filters with 0.45 µm GHP membranes
from Life Sciences.
Figure 13: Example Raman calibration curve. Generated
by matching peaks from silicon, graphite, and Tylenol.
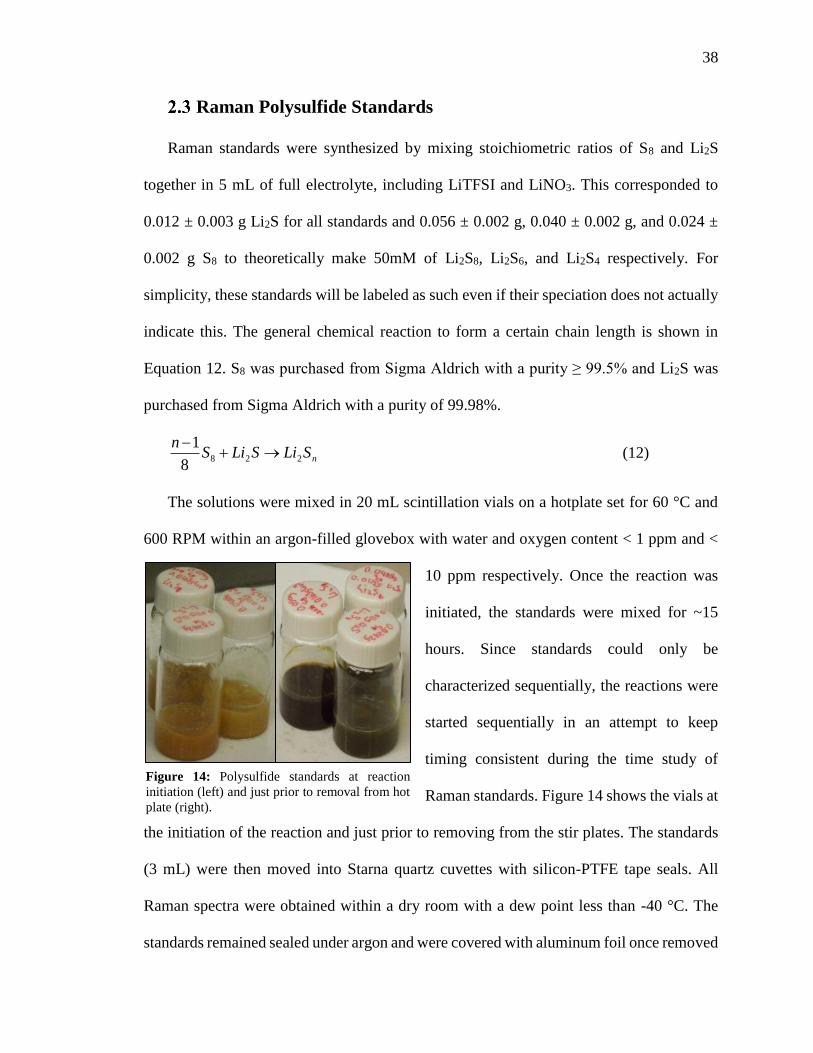
38
Raman Polysulfide Standards
Raman standards were synthesized by mixing stoichiometric ratios of S8 and Li2S
together in 5 mL of full electrolyte, including LiTFSI and LiNO3. This corresponded to
0.012 ± 0.003 g Li2S for all standards and 0.056 ± 0.002 g, 0.040 ± 0.002 g, and 0.024 ±
0.002 g S8 to theoretically make 50mM of Li2S8, Li2S6, and Li2S4 respectively. For
simplicity, these standards will be labeled as such even if their speciation does not actually
indicate this. The general chemical reaction to form a certain chain length is shown in
Equation 12. S8 was purchased from Sigma Aldrich with a purity ≥ 99.5% and Li2S was
purchased from Sigma Aldrich with a purity of 99.98%.
nSLiSLiSn
2288
1
(12)
The solutions were mixed in 20 mL scintillation vials on a hotplate set for 60 °C and
600 RPM within an argon-filled glovebox with water and oxygen content < 1 ppm and <
10 ppm respectively. Once the reaction was
initiated, the standards were mixed for ~15
hours. Since standards could only be
characterized sequentially, the reactions were
started sequentially in an attempt to keep
timing consistent during the time study of
Raman standards. Figure 14 shows the vials at
the initiation of the reaction and just prior to removing from the stir plates. The standards
(3 mL) were then moved into Starna quartz cuvettes with silicon-PTFE tape seals. All
Raman spectra were obtained within a dry room with a dew point less than -40 °C. The
standards remained sealed under argon and were covered with aluminum foil once removed
Figure 14: Polysulfide standards at reaction
initiation (left) and just prior to removal from hot
plate (right).

39
from the glovebox. Raman spectra were obtained 1-2 times daily for 7 days. The cuvettes
were stored, covered with aluminum, and kept in an opaque flammables cabinet when not
being actively analyzed.
Raman spectra were obtained from the bulk of the solution, 50 µm below the solution-
argon interface. Due to the absorptivity of the polysulfides, obtaining spectra deeper into
the solution was not possible. To ensure there were not surface effects from the quartz
cuvette, the cuvettes were not filled to capacity, so that spectra were obtained 0.5 cm below
the quartz surface.

40
ESI Mass Spectroscopy Polysulfide Standards
For electrospray ionization (ESI) mass
spectroscopy, the standards were synthesized
in an argon-filled glovebox with
stoichiometric quantities of S8 and Li2S as
described previously, but were combined
with 1:1 DME:DOL without salt. In an
attempt to replicate the work of Zheng et al.,
Na2S and S8 were also combined in 5 mL of
DME, DOL, acetonitrile (ACN), and 1:1
DME:DOL in proportions of 0.2 mmol and
0.075 mmol respectively. Images of the
standards showing variation in color are
shown in Figure 15. The standards were then
immediately filtered in the dry room to
remove any unreacted material, diluted
to 2-5 µM using 1:1 DME: DOL, and
taken to be analyzed via negative
mode ESI mass spectroscopy. The
settings, including all source
parameters, on the ESI mass
spectrometer were set to the same
Table 4: ESI mass spectroscopy parameters.
Mode Negative
Capillary 3.50 kV
Cone 3.50 kV
Extractor 5.0 V
RF Lens 0.1 V
Source Temperature 90 °C
Desolvation Temperature 200 °C
Nitrogen Gas Flow For Nebuliser 500 L/hr
Nitrogen Gas Flow For Desolvation 500 L/hr
m/z Ratio Range 20 - 600
Figure 15: EIS mass spectroscopy polysulfide
standards prior to dilution where A.) is 0.2 mmol
Li2S, 0.075 mmol S8 in 5 mL DME, B.) is 0.2 mmol
Li2S, 0.075 mmol S8 in 5 mL 1:1 DME: DOL, C.)
is 0.2 mmol Li2S, 0.075 mmol S8 in ACN, D.) is 50
mM “Li2S8” in 1:1 DME: DOL, E.) is 50 mM
“Li2S6” in 1:1 DME: DOL, F.) is 50 mM “Li2S4” in
1:1 DME: DOL, G.) is 0.2 mmol Li2S, 0.075 mmol
S8 in 5 mL DME, and H.) is 0.2 mmol Li2S, 0.075
mmol S8 in 5 mL ACN.

41
values as in Zheng et al.58 but were done on a Xevo G2-XS QTof Quadrupole Time-of-
Flight mass spectrometer. The parameters are listed in Table 4.
In Situ Raman Cell Design
2.5.1 Generation 1
The first generation of the in situ cell design was
a 2032 coin cell with a 2 mm hole precision punched
into the cathode cup. Figure 16 shows the initial cell
setup. Starting from what is typically the cathode cup,
the cell arrangement was then a 5 mm wide, 0.15 mm
thick borosilicate glass slip (Warner Instruments) or a
10 mm wide, 0.1 mm thick quartz cover slip (UQG
Optics), an anode composed of 5/8” diameter, 10 µm
thick lithium on a 10 µm thick copper current collector (Rockwood Lithium), 2 layers of
25 µm thick separator (3501 Celgard), a carbon-sulfur cathode, 2 stainless steel spacers,
and a stainless steel wave spring. This is
inverted from a traditional coin cell
arrangement. The anode and separator were
precision punched such that the cathode was
visible through the cover slip.
Three different variations in the
location of the coverslip were studied in an
attempt to achieve the best Raman spectra.
Table 5: List of adhesives tested for
compatibility with the Li-S system and with the
DME: DOL electrolyte.
1. Superchlon in toluene
2. PVDF in NMP
3. SBR/LI133 in water
4. Sylgard 184 silicone elastomer
5. Double/Bubble® 2 part adhesive:
extra fast setting
6. Double/Bubble® 2 part adhesive:
water-clear-transparent
7. Torr Seal® Low Vapor Pressure
Epoxy
8. Loctite® E-30CL Hysol® Epoxy
Figure 16: Generation 1 cell schematic.
In order from bottom to top is the
cathode cup, cover slip, anode,
separator, cathode, 2 spacers, a wave
spring, and the anode cup.

42
This included inside the cathode cup as in Figure 16, on top of the cathode cup outside of
the cell, and in both positions.
Prior to assembly, an adhesive was used to secure the cover slip to the stainless
steel cathode cup. Several different adhesives were investigated for compatibility with the
Li-S system and are summarized in Table 5.

43
2.5.2 Generation 2
The second generation cell was a commercial in situ Raman cell purchased from MTI
Corporation and was only briefly considered. A schematic of the cell design is shown in
Figure 17.
Figure 17: Generation 2 cell schematic of a commercial in situ cell from MTI
Corporation.87
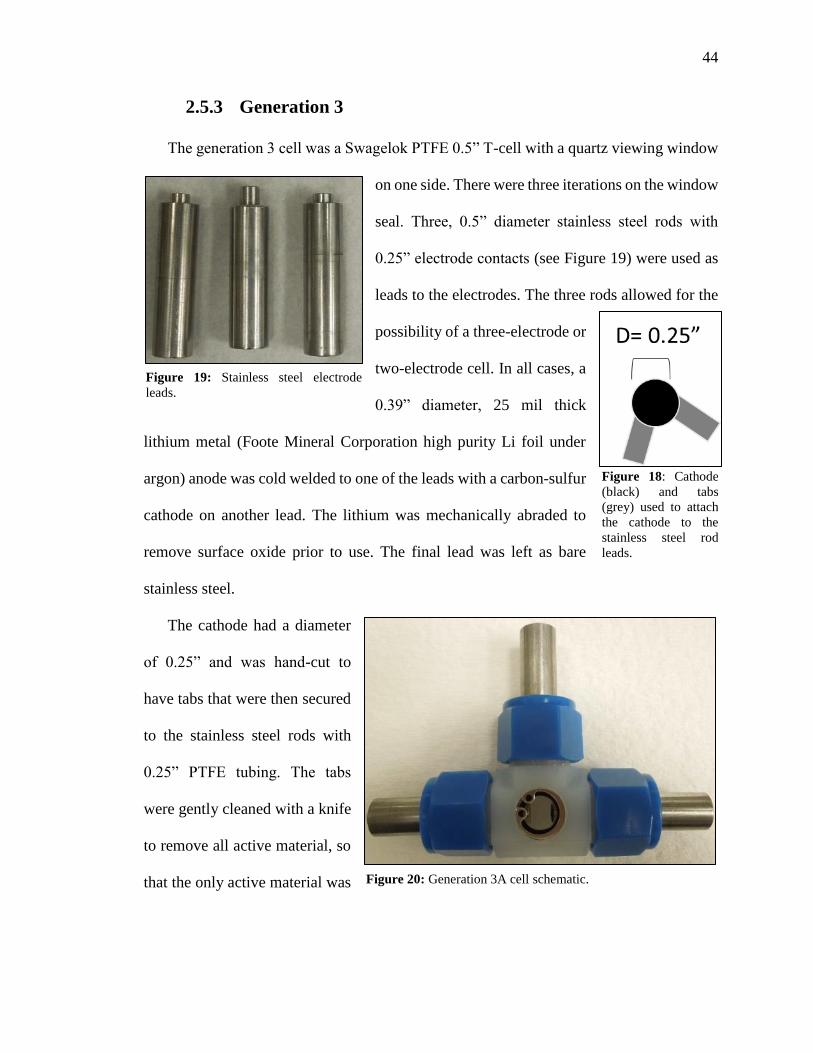
44
2.5.3 Generation 3
The generation 3 cell was a Swagelok PTFE 0.5” T-cell with a quartz viewing window
on one side. There were three iterations on the window
seal. Three, 0.5” diameter stainless steel rods with
0.25” electrode contacts (see Figure 19) were used as
leads to the electrodes. The three rods allowed for the
possibility of a three-electrode or
two-electrode cell. In all cases, a
0.39” diameter, 25 mil thick
lithium metal (Foote Mineral Corporation high purity Li foil under
argon) anode was cold welded to one of the leads with a carbon-sulfur
cathode on another lead. The lithium was mechanically abraded to
remove surface oxide prior to use. The final lead was left as bare
stainless steel.
The cathode had a diameter
of 0.25” and was hand-cut to
have tabs that were then secured
to the stainless steel rods with
0.25” PTFE tubing. The tabs
were gently cleaned with a knife
to remove all active material, so
that the only active material was Figure 20: Generation 3A cell schematic.
Figure 19: Stainless steel electrode
leads.
Figure 18: Cathode
(black) and tabs
(grey) used to attach
the cathode to the
stainless steel rod
leads.

45
in the black region of Figure 18. The electrodes were separated by a distance of 0.8 mm
rather than using a separator.
The T-cell was filled with 2 mL of electrolyte which corresponds to the very large E/S
ratio of 1850 mL/ gram sulfur.
The generation 3A cell is depicted in Figure 20. The viewing window was sealed by a
#013 DuPontTM Kalrez® O-ring and a 15 mm internal stainless steel retaining ring
(McMaster-Carr).
The generation 3B cell shown in Figure 21. In an attempt to create a better seal, top
and bottom plates were printed using a 3D printer and pulled together using knurled thumb
screws.
Figure 21: Generation 3B cell schematic.

46
The final version (generation 3C) of the T-cell shifted back to the more compact design
shown in Figure 22. The T-cell was re-machined such that the 2.5 mm thick quartz window
sat above the face of the PTFE tee as seen in Figure 23. A 3D printed plate was then
screwed down, pressing down on the window which compressed the O-ring and sealed the
T-cell.
In Situ Raman Cell Preparation
2.6.1 Cleaning
The generation 3C cell was cleaned prior to each use to avoid contamination that
could affect the electrochemistry of the cell or the fluorescence background. First, all
components of the cell were rinsed with IPA and DI water. The stainless steel rods were
then polished using 1200 grit silicon carbide paper (Electron Microscopy Science) to
Figure 22: Generation 3C cell photograph.
Figure 23: Generation 3C cell schematic: dimetric view (left) and side view (right).
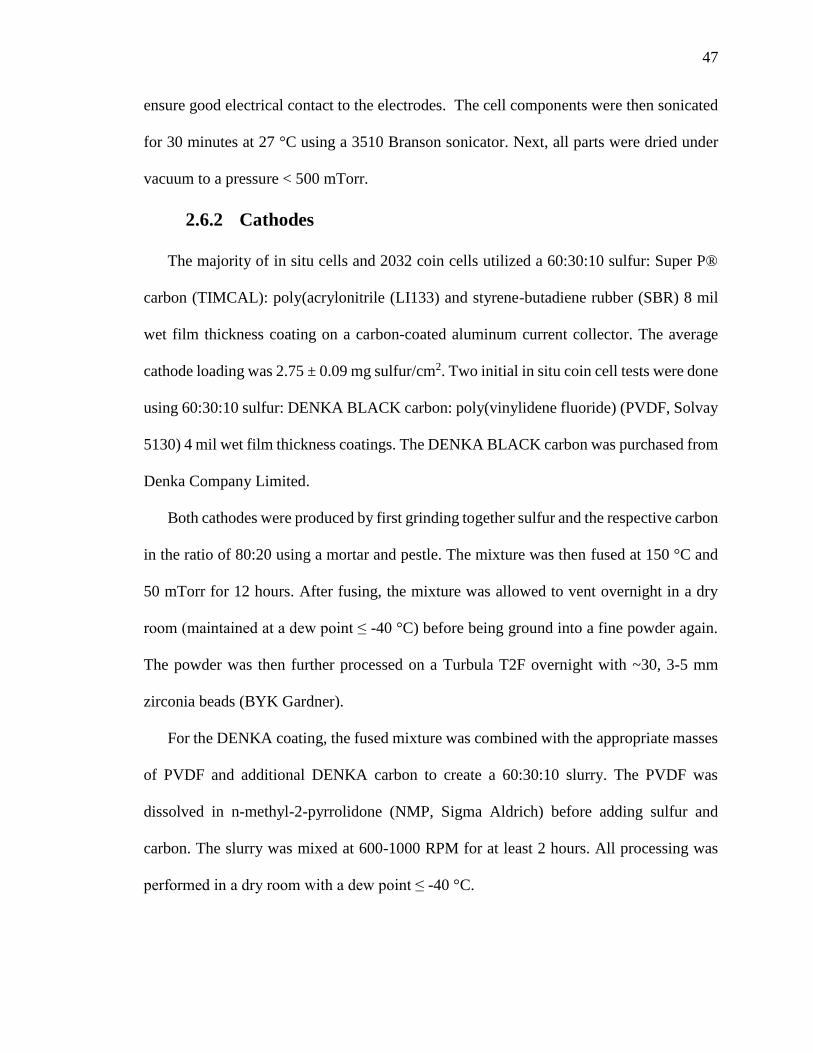
47
ensure good electrical contact to the electrodes. The cell components were then sonicated
for 30 minutes at 27 °C using a 3510 Branson sonicator. Next, all parts were dried under
vacuum to a pressure < 500 mTorr.
2.6.2 Cathodes
The majority of in situ cells and 2032 coin cells utilized a 60:30:10 sulfur: Super P®
carbon (TIMCAL): poly(acrylonitrile (LI133) and styrene-butadiene rubber (SBR) 8 mil
wet film thickness coating on a carbon-coated aluminum current collector. The average
cathode loading was 2.75 ± 0.09 mg sulfur/cm2. Two initial in situ coin cell tests were done
using 60:30:10 sulfur: DENKA BLACK carbon: poly(vinylidene fluoride) (PVDF, Solvay
5130) 4 mil wet film thickness coatings. The DENKA BLACK carbon was purchased from
Denka Company Limited.
Both cathodes were produced by first grinding together sulfur and the respective carbon
in the ratio of 80:20 using a mortar and pestle. The mixture was then fused at 150 °C and
50 mTorr for 12 hours. After fusing, the mixture was allowed to vent overnight in a dry
room (maintained at a dew point ≤ -40 °C) before being ground into a fine powder again.
The powder was then further processed on a Turbula T2F overnight with ~30, 3-5 mm
zirconia beads (BYK Gardner).
For the DENKA coating, the fused mixture was combined with the appropriate masses
of PVDF and additional DENKA carbon to create a 60:30:10 slurry. The PVDF was
dissolved in n-methyl-2-pyrrolidone (NMP, Sigma Aldrich) before adding sulfur and
carbon. The slurry was mixed at 600-1000 RPM for at least 2 hours. All processing was
performed in a dry room with a dew point ≤ -40 °C.

48
For the Super P® coating, the fused carbon-sulfur was added to a mixture of 2.5 wt%
LI133 and 2.5 wt% SBR suspended in water. Enough Super P® carbon was added to create
a ratio of 60:30:10. The solution was mixed overnight at 600-1000 RPM.
For both coatings, once an adequate consistency was achieved, the slurries were cast
onto carbon-coated aluminum, within the dry room, using a doctor blade Elcometer (4340
Automatic Film Applicator) to create the desired wet film thickness.
The coatings dried in the dry room overnight and then were placed in a vacuum oven
at room temperature for at least 12 hours.
Electrochemical Testing
The in situ T-cell were built in an argon-filled glovebox and left to sit overnight to
allow for full wetting of the cathode. Three replicates were discharged at a constant rate of
C/10 between voltage holds which corresponds to a current of 104 µA or a current density
of 328 µA/cm2. The C-rate was calculated based on the average capacity, 1019 mAh/g
sulfur, achieved in a 2032 coin cell with the same 60:30:10 sulfur: Super P: LI133/SBR
Figure 24: The normal discharge curve of a 2032 coin cell with a 60:30:10 sulfur: Super P:
SBR/LI133 cathode and lithium on copper anode (black) and example of voltage steps used while
obtaining Raman spectra. The change in color indicates a change in step voltage. The in situ cells
were discharged at C/10 between voltage holds.
2.9 V 1.7 V

49
cathode. The cell was run with an excess of 130 µL of the same 1:1 DME: DOL electrolyte.
The first discharge curve for the 2032 coin cell is depicted in Figure 24, where the cell
reached a capacity of 1019 mAh/g sulfur at a depth of discharge of 1. An example of the
voltage steps used for the in situ cells is also shown in Figure 24. Each voltage step was
held until the current decay reached the pre-defined, quasi-equilibrium of |𝑑𝐼
𝑑𝑡| ≤ 0.015
µA/sec. The quantity of sulfur in the cathode was calculated based on the average mass of
a 0.25” cathode without tabs. The discharge and voltage control of the T-cells were done
using a Bio-Logic SP-200 potentiostat.
Coin cells were discharged at a constant rate of C/10 using a MACCOR battery tester.

50
3. Results and Discussion
Analysis of Cell Components using Raman
Raman spectra were obtained for all components of the electrolyte under argon in
quartz cuvettes, so that peaks from materials in the cell would not be mistaken for
polysulfide peaks.
Figure 25: Spectra of components composing the electrolyte including A.) DME, B.) DOL, C.) Osilla
LiTFSI, D.) LiNO3, and E.) the entire electrolyte of 1:1 DME: DOL, 1 M LiTFSI, and 0.25 M LiNO3. A, B,
and E contain insets showing the region of wave numbers with the most Raman activity above the full
spectrum with the C-H peaks in the 3000 cm-1 range. All materials were kept under argon in quartz cuvettes.
A B
C
E
D

51
Individual spectra of DOL, DME, LiTFSI, and LiNO3 are depicted in Figure 25 A-
D and the full electrolyte is shown in Figure 25 E. The spectra in Figure 25 are normalized,
but do not have their backgrounds subtracted (other than subtraction of the dark spectrum)
in order to show background fluorescence that can potentially swamp the signal from
polysulfides during in situ measurements. As shown, none of the spectra have a large
fluorescence background. All spectra in Figure 25 were obtained using the 10x objective
and an optimized power of 8 mW with 30 seconds integration time and 10 accumulations.
Consistent within two wave numbers of the results of Suo et al.66, pure LiTFSI has
its most intense peak at approximately 748.9 cm-1 (747.3 cm-1 Suo et al.) while 1 M LiTFSI
in the electrolyte is located at approximately 741.5 cm-1 (740.7 cm-1 Suo et al.).
Since the electrolyte has several intense peaks in the 100 – 600 cm-1 range,
polysulfide peaks were more difficult to identify where there were already peaks.
Exposure to oxygen affects the fluorescence background, in the region of interest
for polysulfides, as seen in
Figure 26. In some cases, at
longer exposure times, the
increase was so intense, that
smaller peaks were difficult
to distinguish from the
background, therefore it was
important for everything to remain under argon in order to obtain useful spectra.
Additionally, some photo-bleaching was observed, especially when exposed to oxygen. If
lower powers and longer integration time were utilized to decrease photo-bleaching, the
Figure 26: Difference in fluorescence background when electrolyte
was under argon vs. under dry air.

52
spectrum became noisy, the fluorescence background increased, and peaks were difficult
to identify. The fluorescence background could also be increased through the introduction
of contaminants, so sample preparation and cleaning, including sonication, were found to
be important.
To determine the source of fluorescence and photo-bleaching behavior, a brief
study was performed on the components of the electrolyte while in air. The electrolyte as
a whole, while exposed to
air, using an 8 mW and 0.5
mW beam, is shown in
Figure 27. The 0.5 mW
power was used with 240
seconds integration time and
20 accumulations while the 8
mW power was used with 30
seconds integration time and 10 accumulations. The spectra can then be more fairly
compared because the same total amount of energy was input into the system in both cases.
As seen in Figure 27, decreasing the power and increasing integration time does not yield
a better spectrum, but greatly increases the time needed to acquire a spectrum (5 minutes
vs. 80 minutes).
Next, the solvent and LiTFSI were analyzed separately to pin point the source of
the fluorescence. 1:1 DME: DOL did not show any change from that of Figure 25 A and B
when decreasing the power below 8 mW. LiTFSI however, appeared to be the source of
photo-bleaching and the large fluorescence background. As seen in Figure 28, using the
Figure 27: Raman spectra of the electrolyte using a laser power of 8
mW (red) with 30 seconds integration time and 10 accumulations and
a laser power of 0.5 mW (black) with 240 seconds integration time and
20 accumulations.
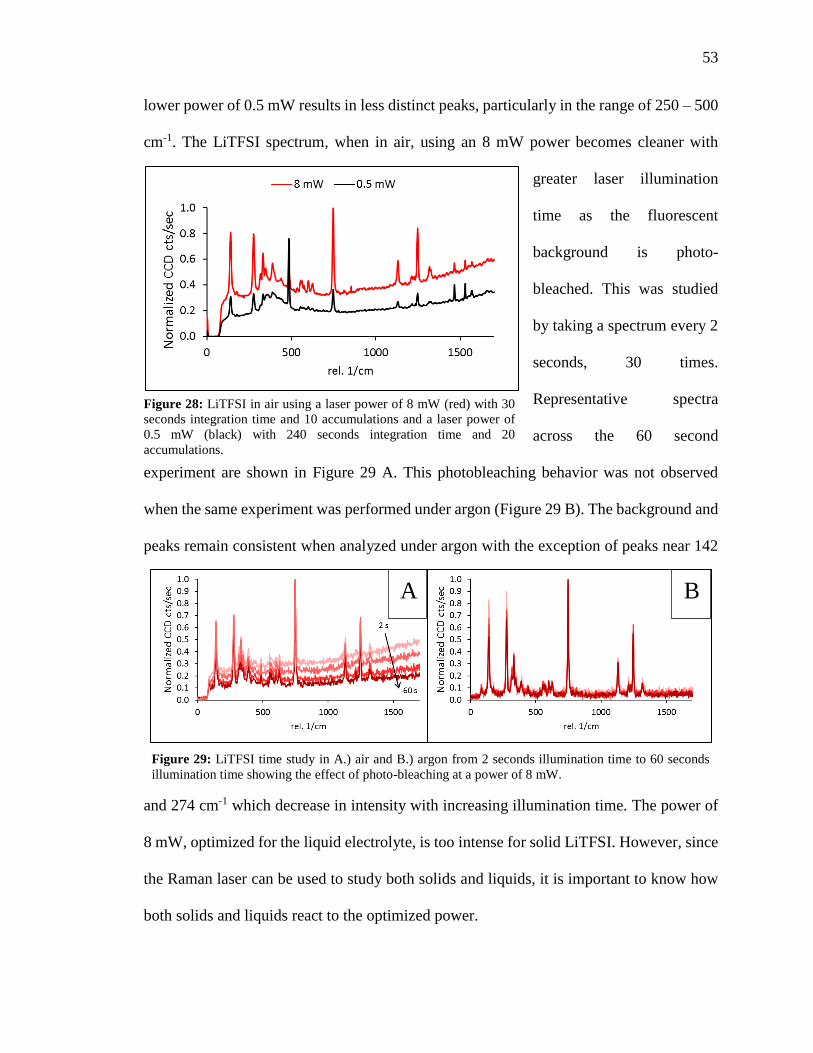
53
lower power of 0.5 mW results in less distinct peaks, particularly in the range of 250 – 500
cm-1. The LiTFSI spectrum, when in air, using an 8 mW power becomes cleaner with
greater laser illumination
time as the fluorescent
background is photo-
bleached. This was studied
by taking a spectrum every 2
seconds, 30 times.
Representative spectra
across the 60 second
experiment are shown in Figure 29 A. This photobleaching behavior was not observed
when the same experiment was performed under argon (Figure 29 B). The background and
peaks remain consistent when analyzed under argon with the exception of peaks near 142
and 274 cm-1 which decrease in intensity with increasing illumination time. The power of
8 mW, optimized for the liquid electrolyte, is too intense for solid LiTFSI. However, since
the Raman laser can be used to study both solids and liquids, it is important to know how
both solids and liquids react to the optimized power.
Figure 28: LiTFSI in air using a laser power of 8 mW (red) with 30
seconds integration time and 10 accumulations and a laser power of
0.5 mW (black) with 240 seconds integration time and 20
accumulations.
Figure 29: LiTFSI time study in A.) air and B.) argon from 2 seconds illumination time to 60 seconds
illumination time showing the effect of photo-bleaching at a power of 8 mW.
B A

54
Another important factor in the variability of LiTFSI spectra was ambient light. The
presence of light sometimes introduced peaks at approximately 2400 cm-1 and 485 cm-1 as
well as dampened peaks in the 250 – 500 cm-1 range.
Despite the problems that LiTFSI introduced to the system, it was preferable to
keep LiTFSI as the salt rather than changing to another because it is used as a standard in
the literature. Most of the issues caused by LiTFSI could be solved by covering the Raman
microscope during data acquisition and keeping everything sealed under argon.
For these reasons, all standards and T-cells were analyzed under argon and with the
microscope covered in order to use the optimized power of 8 mW and obtain a clean
spectrum.
The spectra of the reactant (S8) and final discharge product (Li2S) of the reactions
in Equations 1-3 were also obtained and are shown in Figure 30. Both S8 and Li2S are
insoluble in the electrolyte and thus were only observed in solid form.
Lastly, spectra of the 60:30:10 sulfur: Super P: LI133/SBR cathode and 3501
Celgard separator were obtained (Figure 31). As expected, the cathode contained sulfur as
evident by the peaks located between 100 and 500 cm-1 with similar relative peak
B A
Figure 30: Raman spectra for A.) S8 in air and B.) Li2S under argon using a laser power of 8 mW, 30 seconds
integration time, and 10 accumulations.
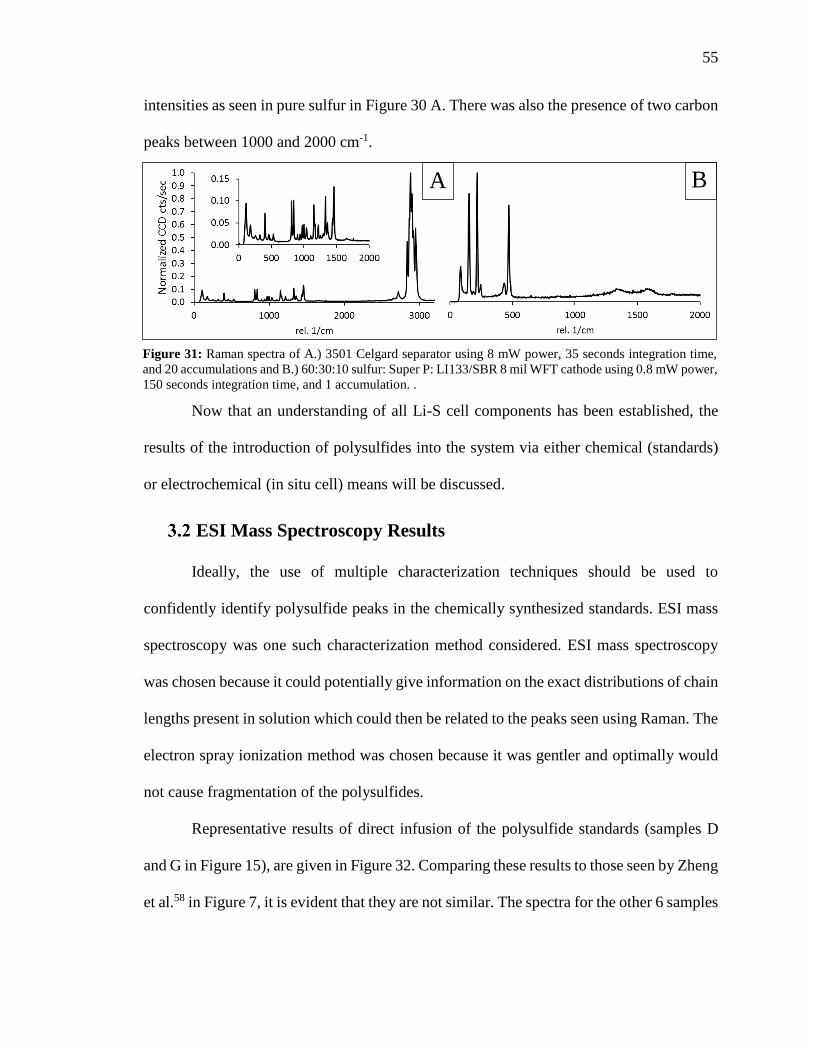
55
intensities as seen in pure sulfur in Figure 30 A. There was also the presence of two carbon
peaks between 1000 and 2000 cm-1.
Now that an understanding of all Li-S cell components has been established, the
results of the introduction of polysulfides into the system via either chemical (standards)
or electrochemical (in situ cell) means will be discussed.
ESI Mass Spectroscopy Results
Ideally, the use of multiple characterization techniques should be used to
confidently identify polysulfide peaks in the chemically synthesized standards. ESI mass
spectroscopy was one such characterization method considered. ESI mass spectroscopy
was chosen because it could potentially give information on the exact distributions of chain
lengths present in solution which could then be related to the peaks seen using Raman. The
electron spray ionization method was chosen because it was gentler and optimally would
not cause fragmentation of the polysulfides.
Representative results of direct infusion of the polysulfide standards (samples D
and G in Figure 15), are given in Figure 32. Comparing these results to those seen by Zheng
et al.58 in Figure 7, it is evident that they are not similar. The spectra for the other 6 samples
A B
Figure 31: Raman spectra of A.) 3501 Celgard separator using 8 mW power, 35 seconds integration time,
and 20 accumulations and B.) 60:30:10 sulfur: Super P: LI133/SBR 8 mil WFT cathode using 0.8 mW power,
150 seconds integration time, and 1 accumulation. .
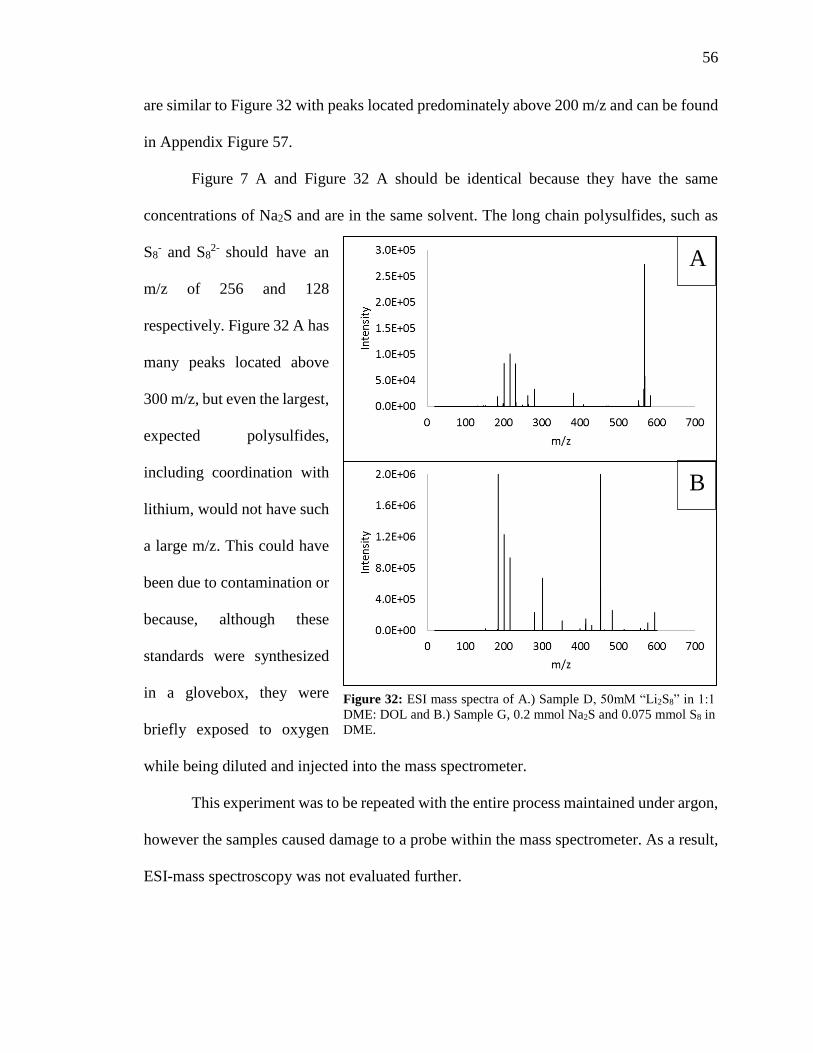
56
are similar to Figure 32 with peaks located predominately above 200 m/z and can be found
in Appendix Figure 57.
Figure 7 A and Figure 32 A should be identical because they have the same
concentrations of Na2S and are in the same solvent. The long chain polysulfides, such as
S8- and S8
2- should have an
m/z of 256 and 128
respectively. Figure 32 A has
many peaks located above
300 m/z, but even the largest,
expected polysulfides,
including coordination with
lithium, would not have such
a large m/z. This could have
been due to contamination or
because, although these
standards were synthesized
in a glovebox, they were
briefly exposed to oxygen
while being diluted and injected into the mass spectrometer.
This experiment was to be repeated with the entire process maintained under argon,
however the samples caused damage to a probe within the mass spectrometer. As a result,
ESI-mass spectroscopy was not evaluated further.
A
B
Figure 32: ESI mass spectra of A.) Sample D, 50mM “Li2S8” in 1:1
DME: DOL and B.) Sample G, 0.2 mmol Na2S and 0.075 mmol S8 in
DME.

57
Raman of Lithium Polysulfide Standards
Figure 33: Polysulfides exposed to air 1 and 2 days after being synthesized (blue and grey). The electrolyte
sealed under argon is shown for comparison of peaks (orange). An inset of the dithionite anion, S2O42-, is
shown in the top right. Dotted and solid lines correspond to polysulfide monoanions and dianions from
the literature39, 67 respectively. The background of all spectra has been removed, but electrolyte peaks are
still present.
Since ESI-mass spectroscopy was not successful, it was decided to use Raman
spectroscopy alone and to rely on literature values for peak assignments.
Chemically synthesized lithium polysulfide standards were made and sealed under
argon to see if more polysulfide peaks were present than Hagen et al.39 observed when the
standards were sealed under air. For comparison, an Li2S6
standard was synthesized and sealed under air (Figure 33).
One day after being synthesized, there are several
polysulfide peaks present (blue). There is also the presence
of the S2O42-, dithionite anion,67 with a peak at approximately
1066 cm-1 indicating that polysulfides are being oxidized.
Two days after synthesis, the polysulfide and dithionite
Figure 34: Example of color
change of polysulfide standards
prior to exposure to air (left) to
exposed to air for several days
(right).

58
peaks decrease in intensity significantly (grey). Thus the polysulfide standards are not
stable when exposed to air.
However, they are stable when in argon (Figure 35). The spectra taken 1 and 2 days
after synthesis are the same; a reduction in the polysulfide peaks is not observed as with
Figure 35: Polysulfides under argon 1 and 2 days after being synthesized (blue and grey). The electrolyte
sealed under argon is shown for comparison of peaks (orange). An inset of the dithionite anion, S2O42-, is
shown in the top right. Dotted and solid lines correspond to polysulfide monoanions and dianions from
the literature39 respectively. The background of all spectra has been removed, but electrolyte peaks are
still present.
the air samples. Additionally, the equilibrium speciation of polysulfides is different when
exposed to air. Notably the Li2S6 standard in air does not have a peak near 200 cm-1 or at
506 cm-1. The peaks are also much cleaner in the argon sample. The dithionite anion, at
approximately 1066 cm-1, is present in both, but is twice the intensity in the air samples.
The presence of the dithionite anion in the argon samples is most likely due to small
amounts of oxygen present in the glovebox during synthesis.
The nominal Li2S8, Li2S6, and Li2S4 standards in argon, 17 hours from reaction
initiation, and their variability between two replicates are depicted in Figure 36. The
background and electrolyte peaks were subtracted to more clearly identify the polysulfide
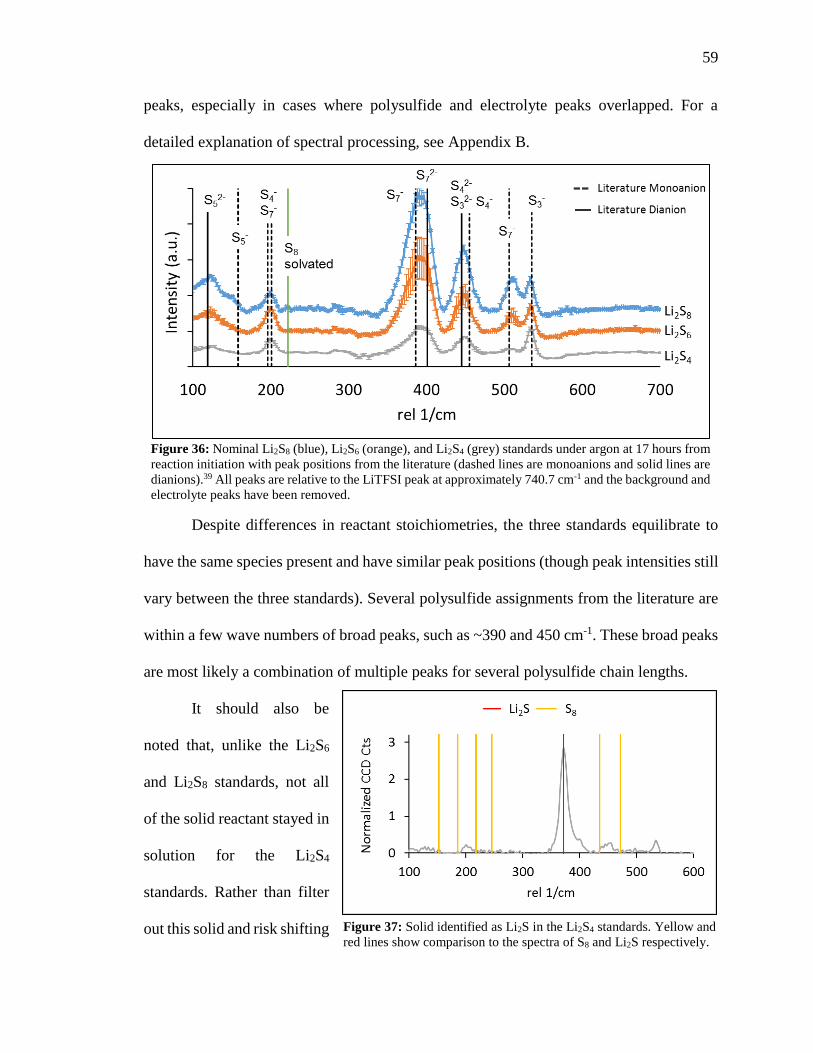
59
peaks, especially in cases where polysulfide and electrolyte peaks overlapped. For a
detailed explanation of spectral processing, see Appendix B.
Figure 36: Nominal Li2S8 (blue), Li2S6 (orange), and Li2S4 (grey) standards under argon at 17 hours from
reaction initiation with peak positions from the literature (dashed lines are monoanions and solid lines are
dianions).39 All peaks are relative to the LiTFSI peak at approximately 740.7 cm-1 and the background and
electrolyte peaks have been removed.
Despite differences in reactant stoichiometries, the three standards equilibrate to
have the same species present and have similar peak positions (though peak intensities still
vary between the three standards). Several polysulfide assignments from the literature are
within a few wave numbers of broad peaks, such as ~390 and 450 cm-1. These broad peaks
are most likely a combination of multiple peaks for several polysulfide chain lengths.
It should also be
noted that, unlike the Li2S6
and Li2S8 standards, not all
of the solid reactant stayed in
solution for the Li2S4
standards. Rather than filter
out this solid and risk shifting Figure 37: Solid identified as Li2S in the Li2S4 standards. Yellow and
red lines show comparison to the spectra of S8 and Li2S respectively.

60
equilibrium, care was taken to allow all solids to settle before taking a spectrum, so that
only the solution was analyzed. Focusing the laser far from the cuvette wall also mitigated
this problem. The solid was identified as Li2S rather than S8 as seen from its spectrum in
solution before the particulates settled (Figure 37). There is a strong peak at approximately
372 cm-1 which matches Figure 30 B for Li2S. There are no peaks corresponding to S8
solid. Since Li2S6 and Li2S8 were completely transparent (no solid matter present) and Li2S4
was transparent once the solids settled, this Li2S peak most likely does not contribute to
the peak observed at 390 cm-1 as Li2S is insoluble in the electrolyte.
Despite these difficulties, the three standards can be distinguished from each other
through differences in coloration (Figure 38) and relative peak intensities.
The peak intensities were obtained by fitting the peaks to
a Lorentzian function (Equation 13) which provides information
on the peak intensity, full width half max (FWHM, symbolized
as Γ), and peak position (p0). The FWHM is defined as the width
of the peak at half its maximum intensity. The variable z is equal
to 2
𝜋𝛤 and functions as a scaling factor. The offset term shifts the
function in the y-direction to match the sample’s spectrum. If
multiple peaks are fit at once, the overall fit function becomes a linear combination of the
individual fits.
𝑓(𝑥, 𝑝0, 𝛤) = 𝑧(
𝛤
2)
2
(𝑥−𝑝0)2+(𝛤
2)
2 + 𝑜𝑓𝑓𝑠𝑒𝑡 (13)
Examples of the fits for Li2S8, Li2S6, and Li2S4, 17 hours after reaction initiation,
Figure 38: Difference in
coloration of the Li2S8,
Li2S6, and Li2S4 standards
in argon
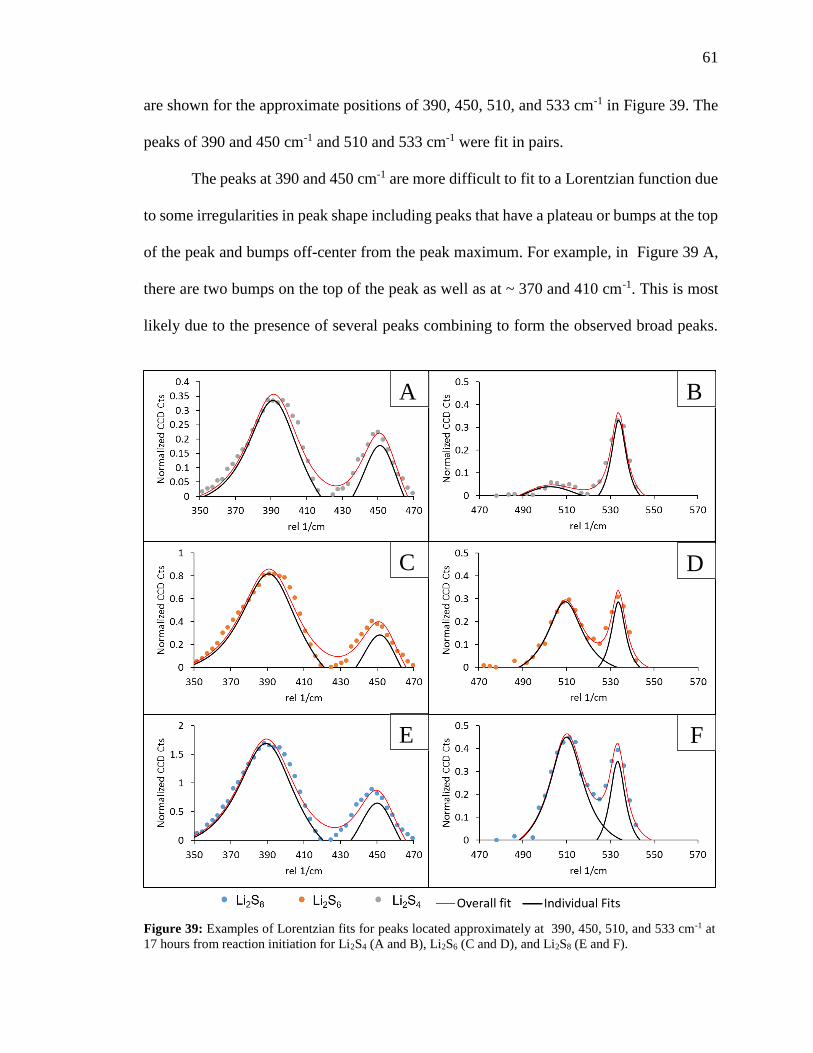
61
are shown for the approximate positions of 390, 450, 510, and 533 cm-1 in Figure 39. The
peaks of 390 and 450 cm-1 and 510 and 533 cm-1 were fit in pairs.
The peaks at 390 and 450 cm-1 are more difficult to fit to a Lorentzian function due
to some irregularities in peak shape including peaks that have a plateau or bumps at the top
of the peak and bumps off-center from the peak maximum. For example, in Figure 39 A,
there are two bumps on the top of the peak as well as at ~ 370 and 410 cm-1. This is most
likely due to the presence of several peaks combining to form the observed broad peaks.
Figure 39: Examples of Lorentzian fits for peaks located approximately at 390, 450, 510, and 533 cm-1 at
17 hours from reaction initiation for Li2S4 (A and B), Li2S6 (C and D), and Li2S8 (E and F).
A B
C D
E F

62
Additional analysis using techniques such as multivariate analysis would be required to
further analyze these peaks; but for this effort, these methods were deemed sufficient for
the analysis.
The fits in Figure 39 provide a consistent method of determining peak intensities,
however the FWHMs from the fits have large confidence bounds. Since no obvious peak
broadening was observed over the time of the experiment, the peak intensity and position
were tracked instead.
The peak position varied slightly between the standards. Most confidence bounds
for the peak positions derived
from the fit were ± 3 cm-1.
For all three standards, there
is always a peak at 533 ± 1
cm-1. The peak at
approximately 510 cm-1 is
less consistent across the
standards as shown in Figure
40. Both Li2S8 and Li2S6 have a peak between 507 and 511 cm-1. Li2S4 has a peak between
498 and 505 cm-1. This shift in wave number of the Li2S4 505 cm-1 peak is accompanied
by a decrease in relative intensity as is evident in Figure 39 B.
For the remaining peaks, all standards are in the same ranges of 199 ± 3, 390 ± 2,
and 452 ± 3 cm-1. For simplicity and comparison, all of these peaks will be referred to as
ranges of 200, 390, 450, and 510 cm-1.
Figure 40: Peak position in the 510 cm-1 range for the Li2S8, Li2S6,
and Li2S4 standards over a week period.
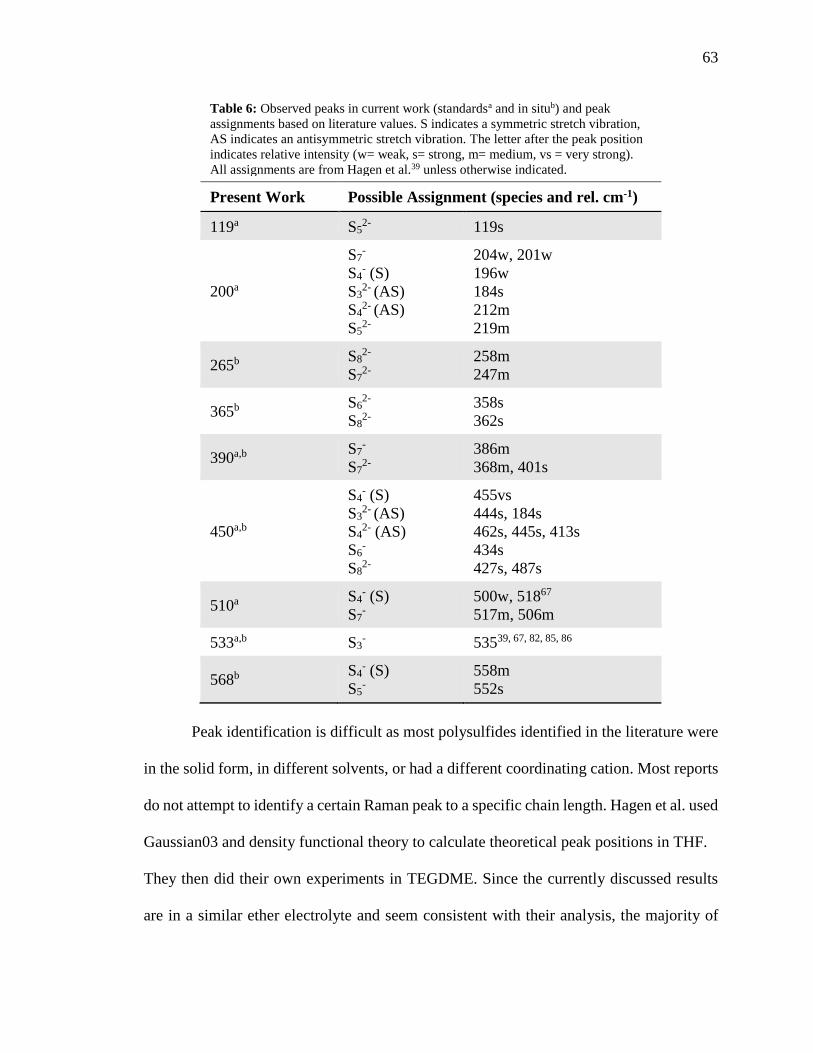
63
Table 6: Observed peaks in current work (standardsa and in situb) and peak
assignments based on literature values. S indicates a symmetric stretch vibration,
AS indicates an antisymmetric stretch vibration. The letter after the peak position
indicates relative intensity (w= weak, s= strong, m= medium, vs = very strong).
All assignments are from Hagen et al.39 unless otherwise indicated.
Present Work Possible Assignment (species and rel. cm-1)
119a S52- 119s
200a
S7-
S4- (S)
S32- (AS)
S42- (AS)
S52-
204w, 201w
196w
184s
212m
219m
265b S8
2-
S72-
258m
247m
365b S62-
S82-
358s
362s
390a,b S7-
S72-
386m
368m, 401s
450a,b
S4- (S)
S32- (AS)
S42- (AS)
S6-
S82-
455vs
444s, 184s
462s, 445s, 413s
434s
427s, 487s
510a S4- (S)
S7-
500w, 51867
517m, 506m
533a,b S3- 53539, 67, 82, 85, 86
568b S4- (S)
S5-
558m
552s
Peak identification is difficult as most polysulfides identified in the literature were
in the solid form, in different solvents, or had a different coordinating cation. Most reports
do not attempt to identify a certain Raman peak to a specific chain length. Hagen et al. used
Gaussian03 and density functional theory to calculate theoretical peak positions in THF.
They then did their own experiments in TEGDME. Since the currently discussed results
are in a similar ether electrolyte and seem consistent with their analysis, the majority of

64
peak assignments stem from their work and are listed in comparison to the current work in
Table 6. The peak at approximately 535 cm-1 is one of the few peaks that the literature
consistently identifies as S3-.39, 67, 82, 85, 86 Both Yeon et al. and Wu et al. identified Sx
2- (x=4-
8) at 766 cm-1, however this is not consistent with other literature sources where the
majority of polysulfide peaks are only present below 600 cm-1; this 766 cm-1 peak was not
observed in any of the current experiments. The peak at 200 cm-1 is more likely a
combination of S7- and S4
- than the other species listed in Table 6 since it is relatively weak
and these two species have strong peaks near the 390 and 450 cm-1 ranges. The other
species that are close to that peak are located ≥ 15 cm-1 from 200 cm-1. The large quantity
of possible assignments with each peak and the spread in wave numbers is consistent with
the broad peaks having contributions from multiple polysulfide chain lengths.
The most intense peaks were tracked over a week to determine the stability of the
B A
C D
Figure 41: Stability study of polysulfide standards under argon. A.) 390 cm-1 most closely corresponding to
S72- and S7
2- B.) 450 cm-1 most closely corresponding to S42-, S3
2-, and S4- C.) Ratio of the 533 cm-1 most
closely corresponding to S3- and 510 cm-1 most closely corresponding to S7
- and S4- D.) 200 cm-1 most closely
corresponding to S8- and S7
-.
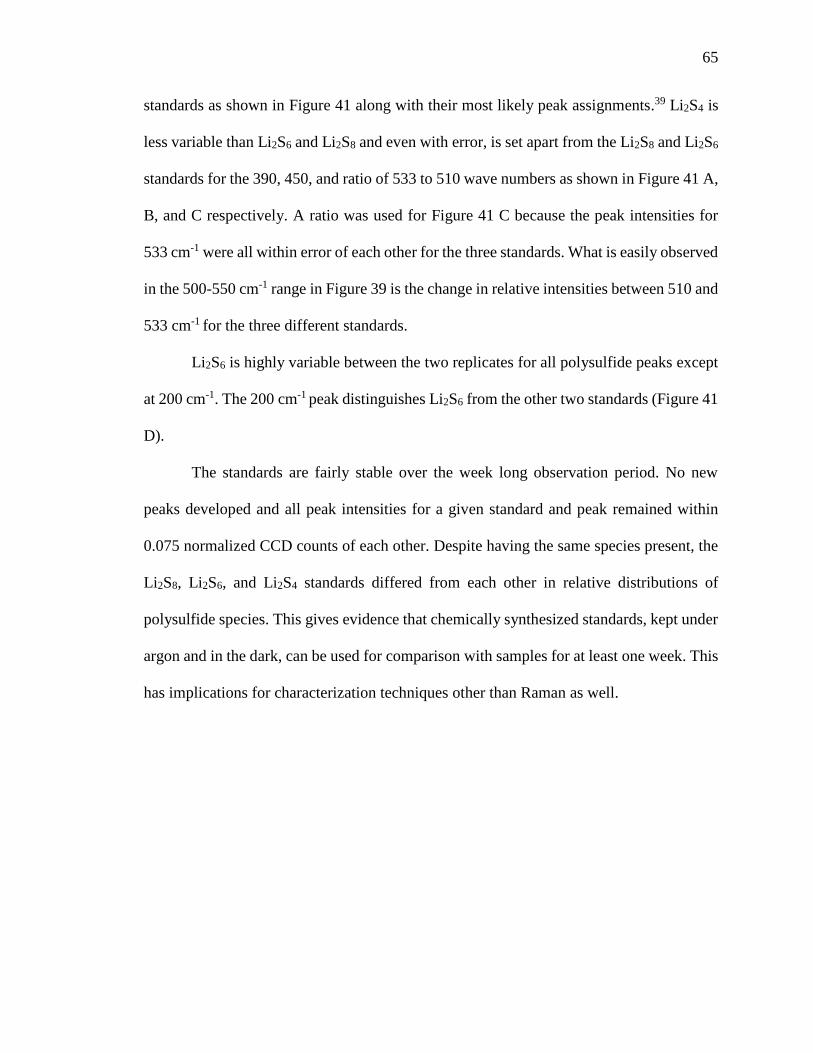
65
standards as shown in Figure 41 along with their most likely peak assignments.39 Li2S4 is
less variable than Li2S6 and Li2S8 and even with error, is set apart from the Li2S8 and Li2S6
standards for the 390, 450, and ratio of 533 to 510 wave numbers as shown in Figure 41 A,
B, and C respectively. A ratio was used for Figure 41 C because the peak intensities for
533 cm-1 were all within error of each other for the three standards. What is easily observed
in the 500-550 cm-1 range in Figure 39 is the change in relative intensities between 510 and
533 cm-1 for the three different standards.
Li2S6 is highly variable between the two replicates for all polysulfide peaks except
at 200 cm-1. The 200 cm-1 peak distinguishes Li2S6 from the other two standards (Figure 41
D).
The standards are fairly stable over the week long observation period. No new
peaks developed and all peak intensities for a given standard and peak remained within
0.075 normalized CCD counts of each other. Despite having the same species present, the
Li2S8, Li2S6, and Li2S4 standards differed from each other in relative distributions of
polysulfide species. This gives evidence that chemically synthesized standards, kept under
argon and in the dark, can be used for comparison with samples for at least one week. This
has implications for characterization techniques other than Raman as well.
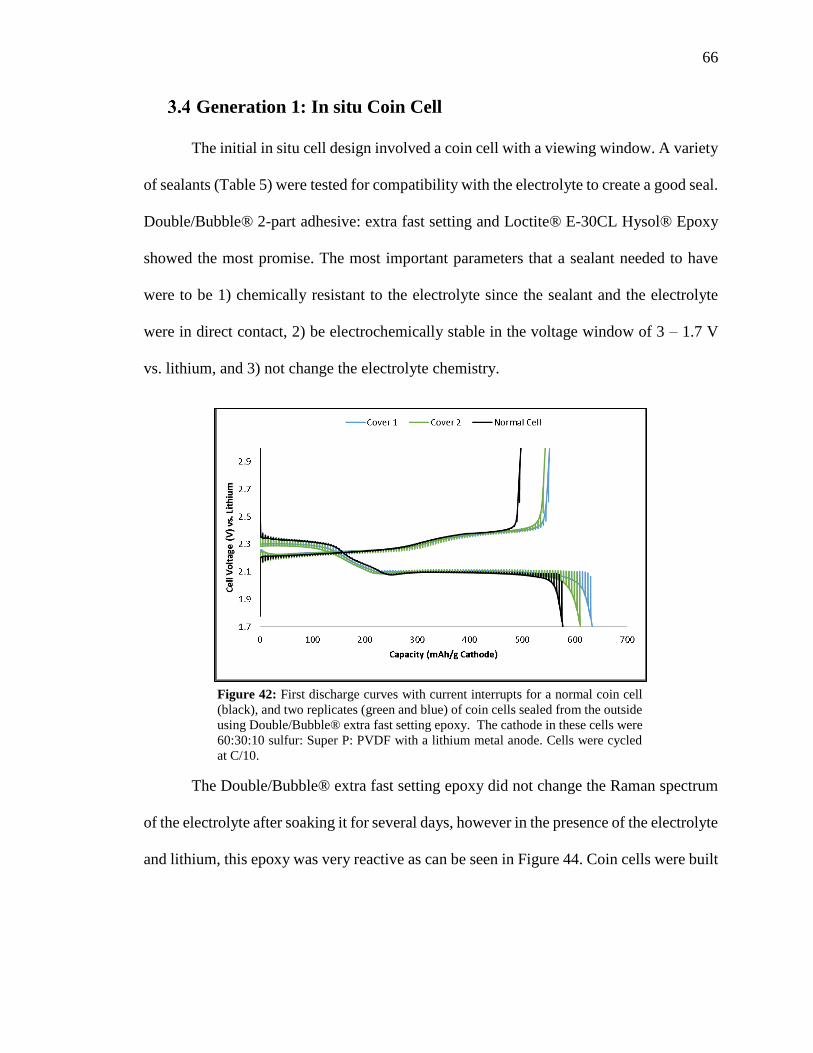
66
Generation 1: In situ Coin Cell
The initial in situ cell design involved a coin cell with a viewing window. A variety
of sealants (Table 5) were tested for compatibility with the electrolyte to create a good seal.
Double/Bubble® 2-part adhesive: extra fast setting and Loctite® E-30CL Hysol® Epoxy
showed the most promise. The most important parameters that a sealant needed to have
were to be 1) chemically resistant to the electrolyte since the sealant and the electrolyte
were in direct contact, 2) be electrochemically stable in the voltage window of 3 – 1.7 V
vs. lithium, and 3) not change the electrolyte chemistry.
The Double/Bubble® extra fast setting epoxy did not change the Raman spectrum
of the electrolyte after soaking it for several days, however in the presence of the electrolyte
and lithium, this epoxy was very reactive as can be seen in Figure 44. Coin cells were built
Figure 42: First discharge curves with current interrupts for a normal coin cell
(black), and two replicates (green and blue) of coin cells sealed from the outside
using Double/Bubble® extra fast setting epoxy. The cathode in these cells were
60:30:10 sulfur: Super P: PVDF with a lithium metal anode. Cells were cycled
at C/10.
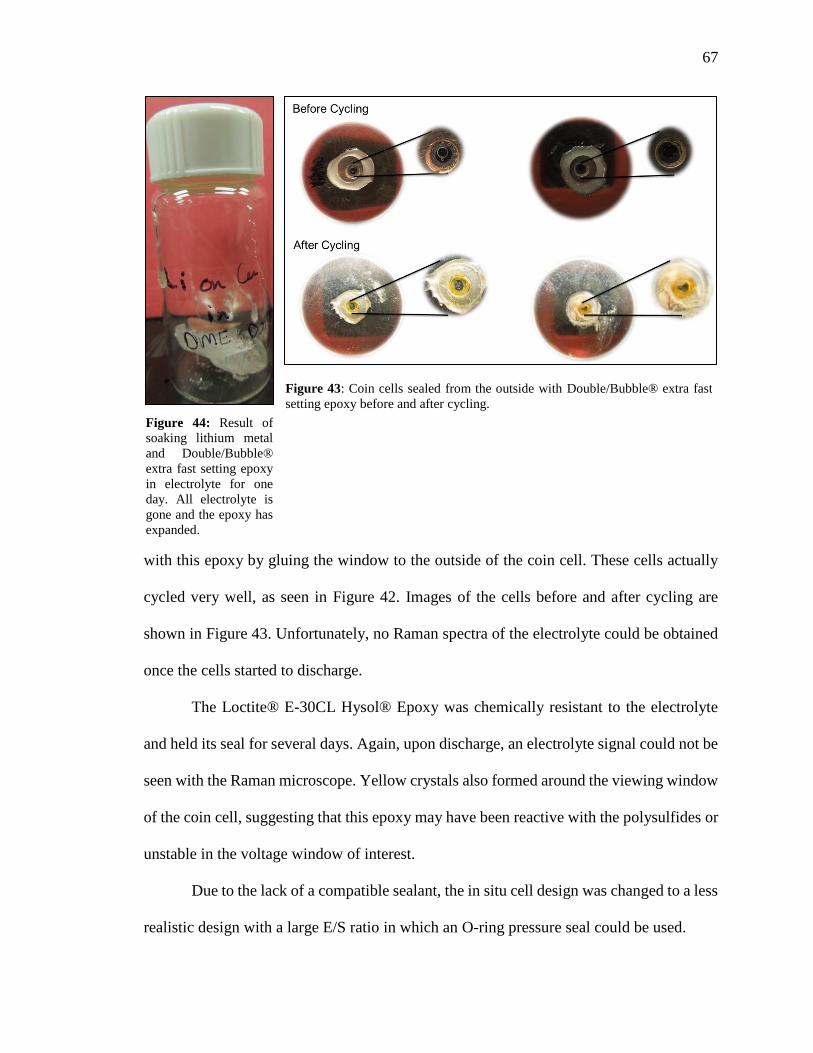
67
with this epoxy by gluing the window to the outside of the coin cell. These cells actually
cycled very well, as seen in Figure 42. Images of the cells before and after cycling are
shown in Figure 43. Unfortunately, no Raman spectra of the electrolyte could be obtained
once the cells started to discharge.
The Loctite® E-30CL Hysol® Epoxy was chemically resistant to the electrolyte
and held its seal for several days. Again, upon discharge, an electrolyte signal could not be
seen with the Raman microscope. Yellow crystals also formed around the viewing window
of the coin cell, suggesting that this epoxy may have been reactive with the polysulfides or
unstable in the voltage window of interest.
Due to the lack of a compatible sealant, the in situ cell design was changed to a less
realistic design with a large E/S ratio in which an O-ring pressure seal could be used.
Figure 44: Result of
soaking lithium metal
and Double/Bubble®
extra fast setting epoxy
in electrolyte for one
day. All electrolyte is
gone and the epoxy has
expanded.
Figure 43: Coin cells sealed from the outside with Double/Bubble® extra fast
setting epoxy before and after cycling.
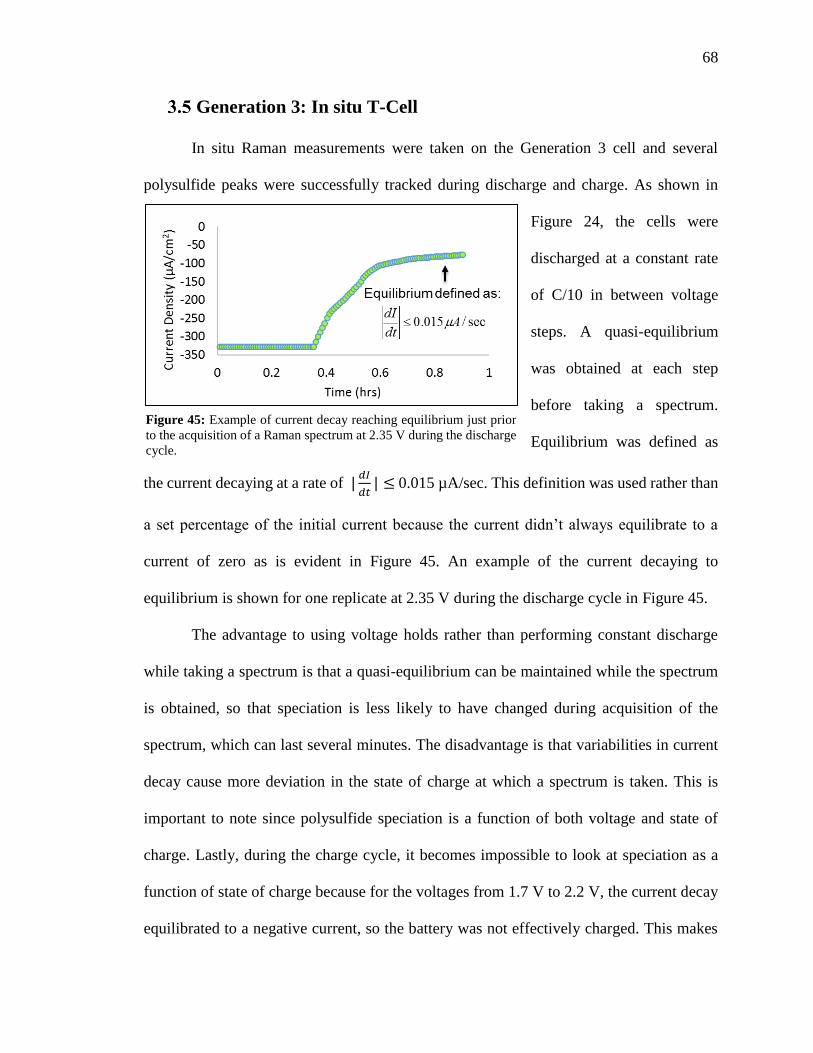
68
Generation 3: In situ T-Cell
In situ Raman measurements were taken on the Generation 3 cell and several
polysulfide peaks were successfully tracked during discharge and charge. As shown in
Figure 24, the cells were
discharged at a constant rate
of C/10 in between voltage
steps. A quasi-equilibrium
was obtained at each step
before taking a spectrum.
Equilibrium was defined as
the current decaying at a rate of |𝑑𝐼
𝑑𝑡| ≤ 0.015 µA/sec. This definition was used rather than
a set percentage of the initial current because the current didn’t always equilibrate to a
current of zero as is evident in Figure 45. An example of the current decaying to
equilibrium is shown for one replicate at 2.35 V during the discharge cycle in Figure 45.
The advantage to using voltage holds rather than performing constant discharge
while taking a spectrum is that a quasi-equilibrium can be maintained while the spectrum
is obtained, so that speciation is less likely to have changed during acquisition of the
spectrum, which can last several minutes. The disadvantage is that variabilities in current
decay cause more deviation in the state of charge at which a spectrum is taken. This is
important to note since polysulfide speciation is a function of both voltage and state of
charge. Lastly, during the charge cycle, it becomes impossible to look at speciation as a
function of state of charge because for the voltages from 1.7 V to 2.2 V, the current decay
equilibrated to a negative current, so the battery was not effectively charged. This makes
Figure 45: Example of current decay reaching equilibrium just prior
to the acquisition of a Raman spectrum at 2.35 V during the discharge
cycle.

69
sense because the large electrolyte volume and electrode separation most likely increase
the effect of the polysulfide shuttle, which is most detrimental during charge and can cause
infinite re-charging, and was possibly the cause of the observed, equilibrated non-zero
current.
The capacity of the three replicates were between 200 and 630 mAh/g sulfur. All
voltage holds and current decays for the first replicate are shown in Figure 46. See
Appendix C for the other two replicates and for the normal discharge of a T-cell at C/50.
Spectra were obtained in the bulk electrolyte due to the absorptivity of the
polysulfides. The Raman was able to record a clean spectrum between the electrodes from
2.9 V until 2.4 V when polysulfides dissolved into the
electrolyte. As a result, the focal point of the Raman
was optimized such that clean spectra could be
obtained throughout charge and discharge without
having to reposition the Raman laser; this optimized
position was in the bulk of the electrolyte rather than in
between the electrodes.
Figure 47: T-cell window before (top)
and after (bottom) 1 discharge and
charge cycle.
Figure 46: Voltage steps and current decays for T-cell replicate number one. Red
is current on the right y-axis and black is voltage on the left y-axis.

70
The polysulfide concentration in the in situ T-cell is far less than that of the polysulfide
standards, so it becomes completely necessary to subtract the electrolyte background from
the polysulfide spectra in order to distinguish polysulfide peaks more clearly. Although the
exact concentration of polysulfides cannot be calculated without the use of additional
characterization techniques, the color of the solution is much lighter than that of the
standards. Images of the T- cell window before and after cycling are shown in Figure 47.
Furthermore, even if all sulfur initially in the cathode dissolved into the electrolyte, which
is almost certainly not the case, the concentration of sulfur would only be about 2 mM as
Figure 48: Raman spectra of replicate #1 for in situ A.) discharge and B.) charge at
each voltage step. Solid black lines are polysulfide peaks from Hagen et al.39 and
dashed lines are peaks in the current work. * indicates where electrolyte peak
subtraction has occurred. All spectra have an integration time of 30 seconds and 10
accumulations at a power of 8 mW.
A
B
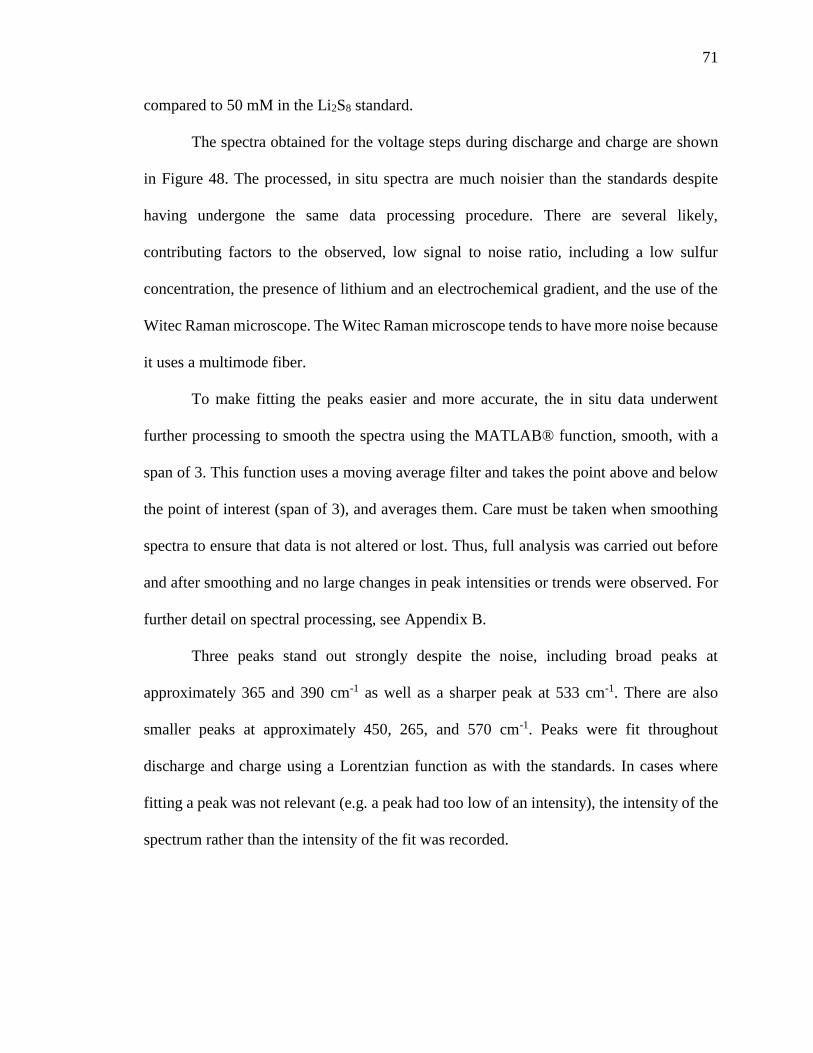
71
compared to 50 mM in the Li2S8 standard.
The spectra obtained for the voltage steps during discharge and charge are shown
in Figure 48. The processed, in situ spectra are much noisier than the standards despite
having undergone the same data processing procedure. There are several likely,
contributing factors to the observed, low signal to noise ratio, including a low sulfur
concentration, the presence of lithium and an electrochemical gradient, and the use of the
Witec Raman microscope. The Witec Raman microscope tends to have more noise because
it uses a multimode fiber.
To make fitting the peaks easier and more accurate, the in situ data underwent
further processing to smooth the spectra using the MATLAB® function, smooth, with a
span of 3. This function uses a moving average filter and takes the point above and below
the point of interest (span of 3), and averages them. Care must be taken when smoothing
spectra to ensure that data is not altered or lost. Thus, full analysis was carried out before
and after smoothing and no large changes in peak intensities or trends were observed. For
further detail on spectral processing, see Appendix B.
Three peaks stand out strongly despite the noise, including broad peaks at
approximately 365 and 390 cm-1 as well as a sharper peak at 533 cm-1. There are also
smaller peaks at approximately 450, 265, and 570 cm-1. Peaks were fit throughout
discharge and charge using a Lorentzian function as with the standards. In cases where
fitting a peak was not relevant (e.g. a peak had too low of an intensity), the intensity of the
spectrum rather than the intensity of the fit was recorded.

72
Once again, peak assignment is difficult and the broad peaks are likely a
combination of several peaks.
The 365 cm-1 peak is most likely predominately S82- since it corresponds nicely to
the value calculated by Hagen et al. at 362 cm-1 (Table 6) and since it is present at the
beginning of discharge (Figure 49 A). The presence of this peak before the start of the
experiment is likely due to self-discharge. While the batteries sat overnight, their open
circuit potential decreased from ~3 to ~2.9 V vs. lithium when the experiment was started.
It is possible, that as Li2S8 is generated (the lithium source is most likely from the LiTFSI
Figure 49: 365 cm-1 peak intensities during the A.) discharge and B.)
charge of the in situ Li-S T-cell. Error bars are from three replicates.
A
B

73
salt), a mixed potential at the cathode is created, decreasing the observed voltage. Li2S8
dissolves into the electrolyte because it is soluble.
The intensity of 365 cm-1 peak is also plotted as a function of depth of discharge to
show the variation in state of charge at which each spectrum was acquired. It can be seen
during the discharge cycle, that the peak intensities have the largest standard deviation
between three replicates at voltages where a discharge plateau occurs, such as near 2.1 V.
Variations in when a spectrum was manually taken at these voltages amplified the error.
The 390 cm-1 peak either had a low intensity or no peak at all at the beginning of
discharge in the three replicates. Its closest peak assignment is S7- and S7
2-.39 At 2.4 V, the
390 cm-1 peak begins to increase with respect to the 365 cm-1 peak until they shift closer
together and become near equal in intensity at 2.15 V. The ratio then decreases between
2.15 V and 1.7 V as the battery finishes discharging. The 365 and 390 cm-1 peaks are
separated during early discharge, but both broaden and combine to span from 350 to 420
cm-1 as the battery continues to discharge as shown in Figure 51 with representative fits for
cell replicate one.
Figure 50: 365 cm-1 peak intensities as a function of depth of discharge.
Error bars are from three replicates. Vertical error bars are error in peak
intensity while horizontal error bars show error in the depth of discharge
between three replicates.

74
Since the spectra were smoothed, only qualitative trends in peak position, rather
than exact values, can be observed with confidence. The change in the ratio of these peaks
during charge and discharge is plotted in Figure 52.
Upon charging, the expected reversal of this process is not observed. The ratio is
highly variable across the replicates but the general trend of a steady increase in the ratio
until reaching a value of approximately 1 when the battery is fully charged is shown in
Figure 52.
A
B
Figure 51: Representative raw data and fits of the peaks located at
approximately 365 and 390 cm-1 during A.) discharge and B.) charge.
This shows how the peaks shift and broaden during discharge. Colors are
consistent with previous in situ spectra for each voltage.
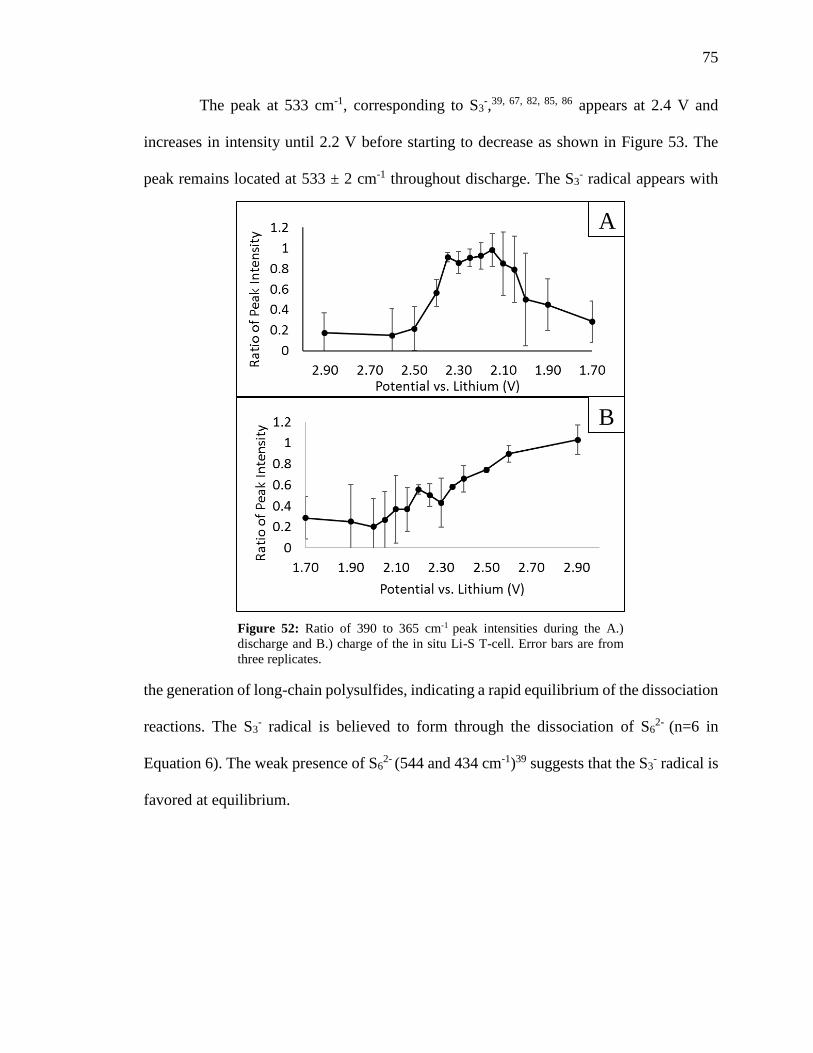
75
The peak at 533 cm-1, corresponding to S3-,39, 67, 82, 85, 86 appears at 2.4 V and
increases in intensity until 2.2 V before starting to decrease as shown in Figure 53. The
peak remains located at 533 ± 2 cm-1 throughout discharge. The S3- radical appears with
the generation of long-chain polysulfides, indicating a rapid equilibrium of the dissociation
reactions. The S3- radical is believed to form through the dissociation of S6
2- (n=6 in
Equation 6). The weak presence of S62- (544 and 434 cm-1)39 suggests that the S3
- radical is
favored at equilibrium.
Figure 52: Ratio of 390 to 365 cm-1 peak intensities during the A.)
discharge and B.) charge of the in situ Li-S T-cell. Error bars are from
three replicates.
A
B

76
The peaks near 265, 450, and 570 cm-1 were much less consistent between
replicates than the more intense peaks discussed thus far. The peaks of 265 and 570 cm-1
in particular become insignificant when averaged between the replicates. These peaks may
become more evident if the polysulfide concentration were greater. The 450 cm-1 peak
intensity as a function of voltage is depicted in Figure 54. Its peak position varied between
440 and 450 cm-1 because it was so broad. Despite a large amount of error, there is a similar
trend as with the other polysulfide peaks. This peak was broad and most likely corresponds
to shorter chain polysulfides such as S32-, S4
2-, and S4- in addition to some long chain
polysulfides.39
B
A
Figure 53: 533 cm-1 peak intensities during the A.) discharge and B.)
charge of the in situ Li-S T-cell. Error bars are from three replicates.

77
Lastly, the 1066 cm-1 dithionite anion peak is also present, also with a large error
(Figure 55). There is less certainty in the intensity of this peak because its position is
outside the range in which polysulfides are Raman active, changing the absorptivity and
background subtraction. Qualitative trends and changes can still be determined. The
presence of this peak is most likely due to trace oxygen in the glovebox. If a large exposure
of air had occurred, an increase in fluorescence would have been observed as discussed in
the section on cell components. This was not observed, so the cell seal must have been
sufficient.
In summary, polysulfide peaks at approximately 390, 450, and 533 cm-1 begin to
increase in intensity at 2.4 V. The peak at 365 cm-1 is most likely S82- and is present prior
A
B
Figure 54: 450 cm-1 peak intensities during the A.) discharge and B.)
charge of the in situ Li-S T-cell. Error bars are from three replicates.

78
to cycling due to self-discharge. This species is present throughout discharge, but decreases
around 2.15 V as it is converted to short chain polysulfides. The 390 peak, which is most
likely S7- and S7
2-, follows a similar trend. The 450 cm-1 peak, corresponding to short chain
polysulfides, is also present throughout, but has its maximum at approximately 2.15 V. The
533 cm-1 peak is indicative of the S3- radical. This suggests that it is favored over S6
2- in
the dissociation equilibrium reaction. All species do not see the reversal of these trends
upon charging, instead they all increase in intensity. This is most likely due to the large
E/S ratio and the polysulfide shuttle. It may also indicate a loss in useful sulfur inventory
from the cathode to the electrolyte, however tracking of the speciation for additional cycles
is needed to confirm this.
B
A
Figure 55: 1066 cm-1 peak intensities during the A.) discharge and B.)
charge of the in situ Li-S T-cell. Error bars are from three replicates.

79
The peaks observed in the in situ cell were not all observed in the standards and
vice versa. The S3- radical, S7
-, and S72- polysulfides were present in both. Thus the
equilibria achieved in the two systems is different. System properties and conditions such
as concentration, solvent, electrochemical gradients, etc. greatly affect the Raman peak
positions and intensities. This explains the variation of the peaks in this study from many
literature sources as these peaks are specific to the DME: DOL solvent system.

80
4. Conclusions
Lithium polysulfide standards were successfully synthesized under argon and were
shown to be stable for at least one week after synthesis if maintained under argon and stored
in the dark. All three of the nominal standards, Li2S8, Li2S6, and Li2S4 had the same
polysulfide species present at equilibrium, namely approximate peaks at 119 (S52-), 200
(S7- and S4
-), 390 (S7- and S7
2-), 450 (S4-, S3
2-, S42-, S6
-, and S82-), 510 (S4
- and S7-), and 533
cm-1 (S3-). Despite having the same species present, the three standards could be
distinguished from each other based on differences in relative peak intensities. Not all of
the peaks observed in the standards were seen in the in situ cell. This result, combined with
multiple species present in the standards, makes it difficult to relate the standards to the in
situ cell. However, the knowledge of the stability of these standards may prove useful for
other characterization techniques.
Despite showing promise initially, the in situ coin cell proved to be infeasible for
the timescale of this work, so a less realistic T-cell with the large E/S ratio of 1850 mL/
gram sulfur was used for in situ Raman experiments. This approach was an improvement
from the value in the Wu et al. paper, but not from that in the Hagen et al. paper.
Due to the absorptivity of the polysulfides, the speciation in the bulk of the
electrolyte was tracked during one discharge and charge cycle. At the beginning of the
experiment the 365 cm-1 (S82-) peak was already present from self-discharge. The peak then
increased at 2.35 V, keeping nearly the same intensity until it decreased at 2.15 V. The 450
cm-1 peak, belonging to shorter chain polysulfides, reached a maximum at 2.15 V. The S3-
peak at 533 cm-1 appeared at 2.4 V and increased until about 2.15 V and then started to
decrease. All species were present during the majority of discharge. During the charge

81
cycle, all the polysulfide peaks increased in intensity rather than reversing the trends seen
during charge. This irreversibility showed that not all polysulfides were removed from
solution, possibly from the large E/S ratio, large electrode separation, or the shuttle effect.

82
5. Future work
Future work includes designing a better in situ cell that decreases the electrolyte to
a more realistic E/S ratio perhaps by further investigation into the coin cell. Doing this
would allow for different Raman focal points rather than just focusing in the bulk
electrolyte. It would also increase the concentration of polysulfides in the electrolyte and
may give cleaner spectra.
Multivariate analysis could also be applied to this work to try and better determine
what polysulfide species are contributing to which peaks.
Additional cycles could be run to determine the loss of electrochemically accessible
sulfur to the electrolyte, if any, with cycling.
Lastly, initial experiments have indicated photo-electrochemistry may be playing a
role in the speciation of the polysulfide speciation as shown in Figure 56 for 2.35 V during
discharge. When the laser is turned on, there is a response in the current decay (Figure 56
A). This response appears to have a voltage, and therefore a polysulfide speciation,
dependence (Figure 56 B). Future work could try to quantify this phenomenon.
Figure 56: Initial experiment results on A.) the effect of the laser on the current decay and B.) dependence
on voltage. Data from current decay at 2.35 V during the discharge of cell replicate number one.
B A

83
6. Appendices
Appendix A: Mass Spectra for all Polysulfide Standards
Mass spectra for samples A-H from Figure 15 are given in Figure 57.
B
G
F E
D C
A
H
Figure 57: Mass spectra of sample standards A-H where A.) is 0.2 mmol Li2S, 0.075 mmol S8 in 5 mL DME, B.) is
0.2 mmol Li2S, 0.075 mmol S8 in 5 mL 1:1 DME: DOL, C.) is 0.2 mmol Li2S, 0.075 mmol S8 in ACN, D.) is 50 mM
“Li2S8” in 1:1 DME: DOL, E.) is 50 mM “Li2S6” in 1:1 DME: DOL, F.) is 50 mM “Li2S4” in 1:1 DME: DOL, G.) is
0.2 mmol Li2S, 0.075 mmol S8 in 5 mL DME, and H.) is 0.2 mmol Li2S, 0.075 mmol S8 in 5 mL ACN.
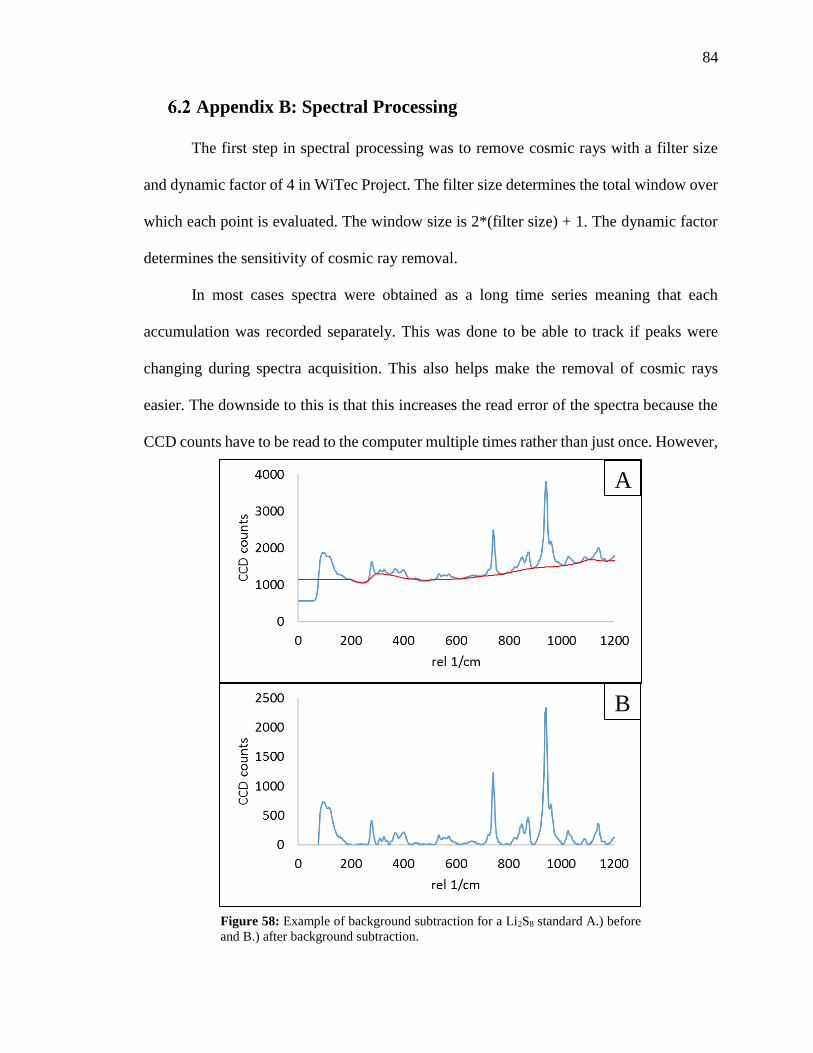
84
Appendix B: Spectral Processing
The first step in spectral processing was to remove cosmic rays with a filter size
and dynamic factor of 4 in WiTec Project. The filter size determines the total window over
which each point is evaluated. The window size is 2*(filter size) + 1. The dynamic factor
determines the sensitivity of cosmic ray removal.
In most cases spectra were obtained as a long time series meaning that each
accumulation was recorded separately. This was done to be able to track if peaks were
changing during spectra acquisition. This also helps make the removal of cosmic rays
easier. The downside to this is that this increases the read error of the spectra because the
CCD counts have to be read to the computer multiple times rather than just once. However,
A
B
Figure 58: Example of background subtraction for a Li2S8 standard A.) before
and B.) after background subtraction.

85
this error is small in contrast to the benefits of being able to see changes in peaks. The
accumulations were averaged together into one spectrum.
The background of each spectrum was subtracted by using MATLAB® to fit a
piecewise cubic hermite interpolating polynomial (PCHIP) to minima on the spectrum. The
minima were determined by looking at 5 points below and above a hand-picked point and
taking the minimum value. Doing this helped to minimize any loss of data. The use of
PCHIP rather than a normal spline prevented any unintended waves between interpolation
points. An example of a raw data set, in the region of interest, and its background
subtraction is shown in Figure 58.
Figure 59: Example of normalization to the 740.7 cm-1 LiTFSI peak and
subtraction of electrolyte peaks where A.) is a comparison of the electrolyte and
a Li2S8 standard prior to normalization and electrolyte subtraction and B.) is
after normalization and electrolyte peak subtraction.
A
B
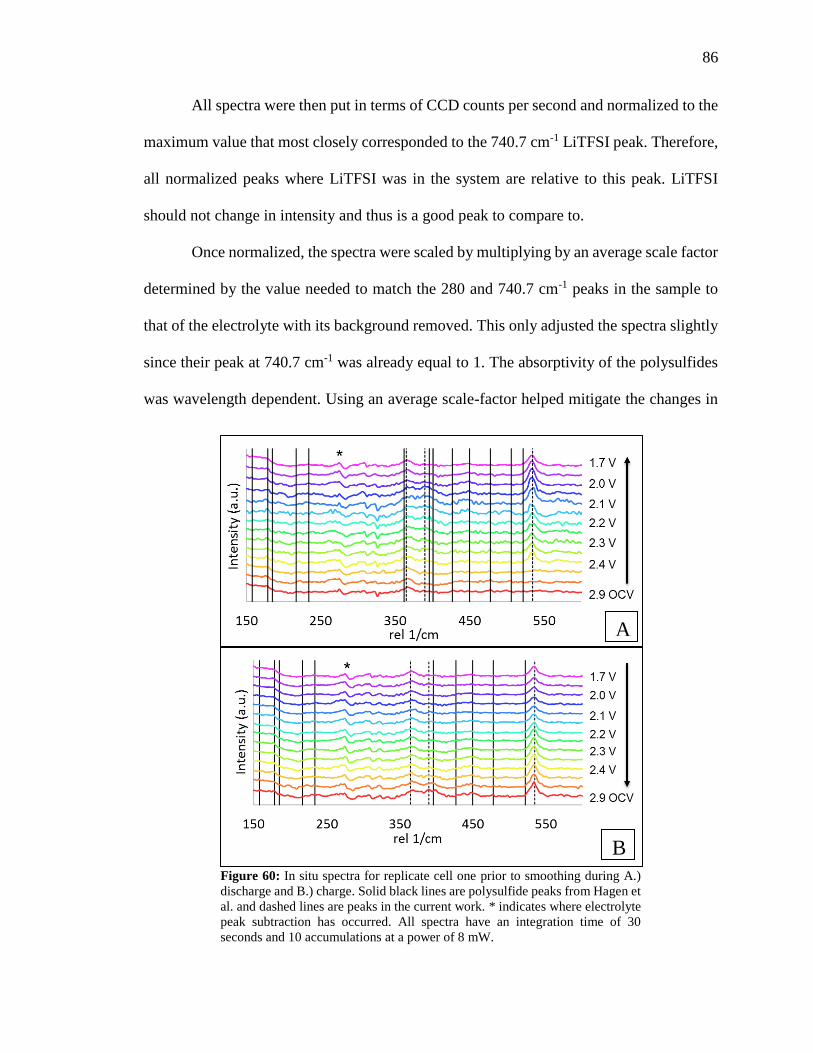
86
All spectra were then put in terms of CCD counts per second and normalized to the
maximum value that most closely corresponded to the 740.7 cm-1 LiTFSI peak. Therefore,
all normalized peaks where LiTFSI was in the system are relative to this peak. LiTFSI
should not change in intensity and thus is a good peak to compare to.
Once normalized, the spectra were scaled by multiplying by an average scale factor
determined by the value needed to match the 280 and 740.7 cm-1 peaks in the sample to
that of the electrolyte with its background removed. This only adjusted the spectra slightly
since their peak at 740.7 cm-1 was already equal to 1. The absorptivity of the polysulfides
was wavelength dependent. Using an average scale-factor helped mitigate the changes in
Figure 60: In situ spectra for replicate cell one prior to smoothing during A.)
discharge and B.) charge. Solid black lines are polysulfide peaks from Hagen et
al. and dashed lines are peaks in the current work. * indicates where electrolyte
peak subtraction has occurred. All spectra have an integration time of 30
seconds and 10 accumulations at a power of 8 mW.
A
B

87
electrolyte peak intensity due to the absorptivity of polysulfides at different wavelengths
above approximately 200 cm-1 and below 900 cm-1. An example of this method is shown
in Figure 59. It can be seen from Figure 59 that above approximately 900 cm-1 there are
still intense electrolyte peaks present. This lack of complete subtraction is due to the change
in absorptivity outside the polysulfide Raman-active range. Since all polysulfide peaks,
excluding the dithionite anion peak at 1066 cm-1, were below 600 cm-1, it was not necessary
to fit an additional wavelength-dependent scaling factor to subtract electrolyte peaks above
900 cm-1.
In cases where LiTFSI was not present, as in the component analysis section of this
report, values were normalized by the conventional means of normalized value = (raw
value - minimum) / (maximum – minimum).
The in situ T-cell spectra were smoothed to allow easier analysis. No large
differences in values or trends were observed after smoothing. For comparison, the spectra
prior to smoothing are shown in Figure 60.
Appendix C: Voltage Steps and Current Decay, T-Cell Replicates
The normal, constant discharge curve at a rate of C/50 (20.8 µA) is shown in Figure
61. It shows the correct shape for a Li-S cell with two plateaus. The plateaus are shifted to
higher voltages (2.4 V and 2.15 V rather than 2.35 V and 2.10 V) than seen in the coin cell
at C/10 because the lower rate allows for a smaller over potential. The slower rate of C/50
was used to allow for diffusion across the large gap between electrodes.
The voltage steps and current decays for replicates two and three are shown in
Figure 62. Due to a computer error, a spectrum was not obtained for 1.9 V and 2.0 V on

88
the charge cycle of replicate number 2. These points in the discussion are the result of the
average of two rather than three replicates.
A
B
Figure 62: Voltage steps and current decays for A.) T-cell replicate two and B.) T-cell
replicate three. Red is current on the right y-axis and black is voltage on the left y-axis.
Figure 61: Normal, constant discharge of a T-cell at C/50.

89
7. References
1. S. Cohen, The Transition to Renewable Energy is Difficult But Feasible, in, T. H. Post Editor, The Huffington Post (2014). 2. A. Manthiram, Y. Z. Fu, S. H. Chung, C. X. Zu and Y. S. Su, Chem Rev, 114, 11751 (2014). 3. A. Rosenman, E. Markevich, G. Salitra, D. Aurbach, A. Garsuch and F. F. Chesneau, Adv Energy Mater, 5 (2015). 4. B. X. Chen and N. Bilton, Building a Better Battery, in, T. N. Y. Times Editor (2014). 5. C. Harvey, This is how cities of the future will get their energy in, T. N. Y. Times Editor (2016). 6. H. L. Pan, X. L. Wei, W. A. Henderson, Y. Y. Shao, J. Z. Chen, P. Bhattacharya, J. Xiao and J. Liu, Adv Energy Mater, 5 (2015). 7. J. Hannauer, J. Scheers, J. Fullenwarth, B. Fraisse, L. Stievano and P. Johansson, Chemphyschem, 16, 2755 (2015). 8. T. B. Reddy, Linden's Handbook of Batteries, The McGraw-Hill Companies (2011). 9. M. Barghamadi, A. Kapoor and C. Wen, J Electrochem Soc, 160, A1256 (2013). 10. P. G. Bruce, S. A. Freunberger, L. J. Hardwick and J. M. Tarascon, Nat Mater, 11, 19 (2012). 11. X. L. Ji and L. F. Nazar, J Mater Chem, 20, 9821 (2010). 12. H. Kim, G. Jeong, Y. U. Kim, J. H. Kim, C. M. Park and H. J. Sohn, Chem Soc Rev, 42, 9011 (2013). 13. Fittipal.F and L. Pauciulo, J Appl Phys, 37, 4292 (1966). 14. D. Eroglu, K. R. Zavadil and K. G. Gallagher, J Electrochem Soc, 162, A982 (2015). 15. R. Xu, J. Lu and K. Amine, Adv Energy Mater, 5 (2015). 16. X. Ji and L. F. Nazar, J Mater Chem, 20, 9821 (2010). 17. Y.-X. Yin, S. Xin, Y.-G. Guo and L.-J. Wan, Angew Chem Int Edit, 52, 13186 (2013). 18. Z. Li, Y. M. Huang, L. X. Yuan, Z. X. Hao and Y. H. Huang, Carbon, 92, 41 (2015). 19. Q. L. Zou and Y. C. Lu, J Phys Chem Lett, 7, 1518 (2016). 20. M. Cuisinier, C. Hart, M. Balasubramanian, A. Garsuch and L. F. Nazar, Adv Energy Mater, 5 (2015). 21. C. Barchasz, F. Molton, C. Duboc, J. C. Lepretre, S. Patoux and F. Alloin, Anal Chem, 84, 3973 (2012). 22. V. Knap, D. I. Stroe, M. Swierczynski, R. Teodorescu and E. Schaltz, J Electrochem Soc, 163, A911 (2016). 23. L. F. Nazar, M. Cuisinier and Q. Pang, Mrs Bull, 39, 436 (2014). 24. M. N. Liu, F. M. Ye, W. F. Li, H. F. Li and Y. G. Zhang, Nano Res, 9, 94 (2016). 25. R. D. Rauh, K. M. Abraham, G. F. Pearson, J. K. Surprenant and S. B. Brummer, J Electrochem Soc, 126, 523 (1979). 26. J. C. Guo, Y. H. Xu and C. S. Wang, Nano Lett, 11, 4288 (2011). 27. X. L. Ji, K. T. Lee and L. F. Nazar, Nat Mater, 8, 500 (2009). 28. M. K. Song, E. J. Cairns and Y. G. Zhang, Nanoscale, 5, 2186 (2013). 29. M. K. Song, Y. G. Zhang and E. J. Cairns, Nano Lett, 13, 5891 (2013). 30. J. L. Wang, L. Liu, Z. J. Ling, J. Yang, C. R. Wan and C. Y. Jiang, Electrochim Acta, 48, 1861 (2003). 31. J. L. Wang, J. Yang, J. Y. Xie, N. X. Xu and Y. Li, Electrochem Commun, 4, 499 (2002). 32. B. Zhang, X. Qin, G. R. Li and X. P. Gao, Energ Environ Sci, 3, 1531 (2010). 33. S. C. Han, M. S. Song, H. Lee, H. S. Kim, H. J. Ahn and J. Y. Lee, J Electrochem Soc, 150, A889 (2003). 34. L. W. Ji, M. M. Rao, H. M. Zheng, L. Zhang, Y. C. Li, W. H. Duan, J. H. Guo, E. J. Cairns and Y. G. Zhang, J Am Chem Soc, 133, 18522 (2011).

90
35. Y. C. Qiu, W. F. Li, W. Zhao, G. Z. Li, Y. Hou, M. N. Liu, L. S. Zhou, F. M. Ye, H. F. Li, Z. H. Wei, S. H. Yang, W. H. Duan, Y. F. Ye, J. H. Guo and Y. G. Zhang, Nano Lett, 14, 4821 (2014). 36. D. Aurbach, E. Pollak, R. Elazari, G. Salitra, C. S. Kelley and J. Affinito, J Electrochem Soc, 156, A694 (2009). 37. Y. Yang, M. T. McDowell, A. Jackson, J. J. Cha, S. S. Hong and Y. Cui, Nano Lett, 10, 1486 (2010). 38. N. A. Liu, L. B. Hu, M. T. McDowell, A. Jackson and Y. Cui, Acs Nano, 5, 6487 (2011). 39. M. Hagen, P. Schiffels, M. Hammer, S. Dorfler, J. Tubke, M. J. Hoffmann, H. Althues and S. Kaskel, J Electrochem Soc, 160, A1205 (2013). 40. B. D. McCloskey, J Phys Chem Lett, 6, 4581 (2015). 41. V. Moss and D. Nole, Battery employing lithium - sulphur electrodes with non-aqueous electrolyte, in, United States (1968). 42. Donor Number, in (2016). 43. A. Manthiram, Y. Fu, S. H. Chung, C. Zu and Y. S. Su, Chem Rev, 114, 11751 (2014). 44. N. Angulakshmi and A. M. Stephan, Frontiers in Energy Research, 3 (2015). 45. E. Peled, Y. Sternberg, A. Gorenshtein and Y. Lavi, J Electrochem Soc, 136, 1621 (1989). 46. J. Gao, M. Lowe, Y. Kiya and H. Abruna, The Journal of Physical Chemistry, 25132 (2011). 47. C. Barchasz, J. C. Lepretre, S. Patoux and F. Alloin, Electrochim Acta, 89, 737 (2013). 48. J. Scheers, S. Fantini and P. Johansson, J Power Sources, 255, 204 (2014). 49. L. M. Suo, Y. S. Hu, H. Li, M. Armand and L. Q. Chen, Nat. Commun., 4, 9 (2013). 50. X. Liang, Z. Y. Wen, Y. Liu, M. F. Wu, J. Jin, H. Zhang and X. W. Wu, J Power Sources, 196, 9839 (2011). 51. L. X. Yuan, J. K. Feng, X. P. Ai, Y. L. Cao, S. L. Chen and H. X. Yang, Electrochem Commun, 8, 610 (2006). 52. J. W. Park, K. Ueno, N. Tachikawa, K. Dokko and M. Watanabe, J Phys Chem C, 117, 20531 (2013). 53. H. S. Ryu, H. J. Ahn, K. W. Kim, J. H. Ahn and J. Y. Lee, J Power Sources, 153, 360 (2006). 54. B. Scrosati, F. Croce and S. Panero, J Power Sources, 100, 93 (2001). 55. J. Hassoun and B. Scrosati, Adv. Mater., 22, 5198 (2010). 56. M. Nagao, A. Hayashi and M. Tatsumisago, Electrochem Commun, 22, 177 (2012). 57. A. Jozwiuk, H. Sommer, J. Janek and T. Brezesinski, J Power Sources, 296, 454 (2015). 58. D. Zheng, D. Y. Qu, X. Q. Yang, X. Q. Yu, H. S. Lee and D. Y. Qu, Adv Energy Mater, 5 (2015). 59. M. Cuisinier, P. E. Cabelguen, S. Evers, G. He, M. Kolbeck, A. Garsuch, T. Bolin, M. Balasubramanian and L. F. Nazar, J Phys Chem Lett, 4, 3227 (2013). 60. Y. Gorlin, A. Siebel, M. Piana, T. Huthwelker, H. Jha, G. Monsch, F. Kraus, H. A. Gasteiger and M. Tromp, J Electrochem Soc, 162, A1146 (2015). 61. M. U. M. Patel, I. Arcon, G. Aquilanti, L. Stievano, G. Mali and R. Dominko, Chemphyschem, 15, 894 (2014). 62. K. H. Wujcik, D. R. Wang, A. Raghunathan, M. Drake, T. A. Pascal, D. Prendergast and N. P. Balsara, J Phys Chem C, 120, 18403 (2016). 63. H. Wang, N. Y. Sa, M. N. He, X. Liang, L. F. Nazar, M. Balasubramanian, K. G. Gallagher and B. Key, J Phys Chem C, 121, 6011 (2017). 64. J. Xiao, J. Z. Hu, H. H. Chen, M. Vijayakumar, J. M. Zheng, H. L. Pan, E. D. Walter, M. Hu, X. C. Deng, J. Feng, B. Y. Liaw, M. Gu, Z. D. Deng, D. P. Lu, S. C. Xu, C. M. Wang and J. Liu, Nano Lett, 15, 3309 (2015). 65. L. A. Nimon, V. D. Neff, R. E. Cantley and R. O. Buttlar, J Mol Spectrosc, 22, 105 (1967). 66. L. M. Suo, Z. Fang, Y. S. Hu and L. Q. Chen, Chinese Phys B, 25 (2016). 67. H. L. Wu, L. A. Huff and A. A. Gewirth, Acs Appl Mater Inter, 7, 1709 (2015). 68. N. A. Canas, S. Wolf, N. Wagner and K. A. Friedrich, J Power Sources, 226, 313 (2013).

91
69. J. Nelson, S. Misra, Y. Yang, A. Jackson, Y. J. Liu, H. L. Wang, H. J. Dai, J. C. Andrews, Y. Cui and M. F. Toney, J Am Chem Soc, 134, 6337 (2012). 70. S. Walus, C. Barchasz, J. F. Colin, J. F. Martin, E. Elkaim, J. C. Lepretre and F. Alloin, Chem Commun, 49, 7899 (2013). 71. T. Yim, M. S. Park, J. S. Yu, K. J. Kim, K. Y. Im, J. H. Kim, G. Jeong, Y. N. Jo, S. G. Woo, K. S. Kang, I. Lee and Y. J. Kim, Electrochim Acta, 107, 454 (2013). 72. Y. S. Su, Y. Z. Fu, T. Cochell and A. Manthiram, Nat. Commun., 4 (2013). 73. R. D. Rauh, F. S. Shuker, J. M. Marston and S. B. Brummer, J Inorg Nucl Chem, 39, 1761 (1977). 74. Confocal Raman Microscopy, Springer (2010). 75. Raman Scattering, in, University of Cambridge (2015). 76. T. Dieing, O. Hollricher and J. Toporski, Confocal Raman Microscopy, p. 289, Springer-Verlag Berlin Heidelberg, Ulm, Germany (2010). 77. G. J. Janz, J. W. Coutts, J. R. Downey and E. Roduner, Inorg Chem, 15, 1755 (1976). 78. G. J. Janz, E. Roduner, J. W. Coutts and J. R. Downey, Inorg Chem, 15, 1751 (1976). 79. G. J. Janz, J. R. Downey, E. Roduner, G. J. Wasilczyk, J. W. Coutts and A. Eluard, Inorg Chem, 15, 1759 (1976). 80. O. El Jaroudi, E. Picquenard, A. Demortier, J. P. Lelieur and J. Corset, Inorg Chem, 39, 2593 (2000). 81. O. El Jaroudi, E. Picquenard, A. Demortier, J. P. Lelieur and J. Corset, Inorg Chem, 38, 2394 (1999). 82. F. P. Daly and C. W. Brown, J Phys Chem-Us, 77, 1859 (1973). 83. F. P. Daly and C. W. Brown, J Phys Chem-Us, 79, 350 (1975). 84. F. P. Daly and C. W. Brown, J Phys Chem-Us, 80, 480 (1976). 85. P. Dubois, J. P. Lelieur and G. Lepoutre, Inorg Chem, 27, 73 (1988). 86. J. T. Yeon, J. Y. Jang, J. G. Han, J. Cho, K. T. Lee and N. S. Choi, J Electrochem Soc, 159, A1308 (2012). 87. Split Test Cell with Quartz Window for Battery Electrode In-situ Analysis: Optional Insert Size & Au Coating - EQ-STC-QW, in, MTI Corporation.


![Research Article Sulfur Speciation in the Surface …downloads.hindawi.com/journals/jchem/2016/3672348.pdfstate of S in soil and marine sediments [, , ], providing information about](https://static.fdocuments.us/doc/165x107/5f0840737e708231d4211621/research-article-sulfur-speciation-in-the-surface-state-of-s-in-soil-and-marine.jpg)


![V. SPECIATION A. Allopatric Speciation B. Parapatric Speciation (aka Local or Progenitor - Derivative) C. Adaptive Radiation D. Sympatric Speciation [Polyploidy]](https://static.fdocuments.us/doc/165x107/56649d3f5503460f94a186e2/v-speciation-a-allopatric-speciation-b-parapatric-speciation-aka-local.jpg)