Study of policies and regulations for waste management in … Cheng... · 2017-05-16 · 2 Study of...
47
1 Study of policies and regulations for waste management in China and potential for application in the U.S. by Zhuo Hao Kevin Cheng Advisors: Profs. Nickolas J. Themelis and A.C. (Thanos) Bourtsalas Submitted in fulfillment of the requirements for the Earth Resources Engineering thesis in Department of Earth and Environmental Engineering, Columbia University EARTH ENGINEERING CENTER COLUMBIA UNIVERSITY May 8, 2017 Disclaimer This document contains copyrighted material for educational purposes. These materials are included under the fair use exemption of U.S. Copyright Law and are restricted from further use. Please note that this document has been prepared on an “All Care and No Responsibility” basis. Neither the authors nor Columbia University make any express or implied representation or warranty as to the currency, accuracy or completeness of the information contained herein.
Transcript of Study of policies and regulations for waste management in … Cheng... · 2017-05-16 · 2 Study of...

1
Study of policies and regulations for waste management in China and potential for application in the U.S.
by Zhuo Hao Kevin Cheng
Advisors: Profs. Nickolas J. Themelis and A.C. (Thanos) Bourtsalas
Submitted in fulfillment of the requirements for the Earth Resources Engineering thesis in Department of Earth and Environmental Engineering, Columbia University
EARTH ENGINEERING CENTER COLUMBIA UNIVERSITY
May 8, 2017
Disclaimer This document contains copyrighted material for educational purposes. These materials are included under the fair use exemption of U.S. Copyright Law and are restricted from further use. Please note that this document has been prepared on an “All Care and No Responsibility” basis. Neither the authors nor Columbia University make any express or implied representation or warranty as to the currency, accuracy or completeness of the information contained herein.

2
Study of policies and regulations for waste management in China and potential for application in the U.S.
by Zhuo Hao Kevin Cheng
EXECUTIVE SUMMARY Chinese cities produce hundreds of millions of tons of solid waste each year, with
much still ending up in landfills. In early 2005, China made one of largest state-sponsored
commitments toward renewable energy, as the country adopted the Renewable Energy Law
which encompassed directives addressed to the management of solid wastes.1 This Law
included a national renewable energy requirement that the use of renewable energy capacity
in China be increased appreciably. As a result, in the last decade, China increased its
renewable energy production, which now accounts for more than 10% of total energy output.
Also, this law recognizes and encourages the use of municipal solid waste (MSW) as a source
of renewable energy. This has led to an enormous growth of the Chinese waste to energy
(WTE) capacity: In 2005, China had 67 Waste to Energy (WTE) plants converting about 9%
of total MSW into energy; by 2013, only eight years after the passage of the Renewable
Energy Law, there were166 WTE plants grew to 166, converting over 30% of the nation’s
MSW to energy.
In comparison, according to the U.S. Energy Information Administration (EIA),
renewable energy currently only accounts for 10% of the U.S. total energy output. Currently,
there is no federal regulation that encourages or recognizes MSW as a source of renewable
energy. Each State government has their definition and regulation of MSW. Only 29 States
recognize MSW as a renewable energy source, and only 23 States have WTE plants. As of
2015, there were 79 operating plants in the U.S. combusting with energy recovery about 27
million metric tons of MSW. According to the EIA, the United States converts about 13% of
the total MSW into energy. Presently, about 63% of MSW ends up in landfills, 29.5% is 1 http://www.npc.gov.cn/englishnpc/Special/CombatingClimateChange/2009-08/25/content_1515301.htm

3
recycled or composted and 7.5% is processed in WTE plants. Without a proper federal
framework and legislation to recycle and recover energy from MSW, nearly two thirds of it
ends up in landfills.
Using China's Renewable Energy Law, other national and regional regulations, and
public information programs as a baseline, this research study aims to analyze and make
recommendations as to how the elements of the Chinese waste management framework and
laws may be transposed to federal and state legislation for potential application in the United
States.
This report concludes that as economic factors and social factors shift the available of
essential resource, WTE will eventually become the most economically viable option for
MSW disposal. For the WTE sector to grow in the US, it is recommended that US federal and
state government adopt policies presented in this report, and use China's WTE development
model as a baseline for what can be accomplished here in the US.

4
Table of Contents
List of Figures and Tables……………………………………………………………………..6
Acknowledgments…………………………………………………………………………......7
1. Management of Solid Waste (MSW) in China…………………………………………8
1.1 Recycling………………………………………………………………………….9
1.2 Composting………………………………………………………………………11
1.3 Energy Recovery…………………………………………………………………11
1.4 Landfilling………………………………………………………………………..12
1.5 Urbanization in China and Management of Municipal Solid Waste…………….14
2. Municipal Solid Waste as a Renewable Energy Source……………………………...15
2.1 MSW as a fuel……………………………………………………………………15
2.2 The MSW Combustion Process ………………………….…………..……….....16
2.3 Development of WTE in China…………………………………………………..17
2.4 Challenges Facing WTE Sector in China………………………………………...18
3. National Support and Policies of WTE in China……………………………………..20
3.1 Stable and Efficient Policies in Support of WTE in China ……………………...20
3.2 Support of WTE in China………………………………………………………...21
4. Structured and Planned Approach to WTE Development in China………………...22
4.1 Structured approach to WTE development in China……………………………..22
4.2 Planned approach to WTE development in China……………………………….24

5
5. Laws, Regulations, and Policies………………………………………………………..25
5.1 WTE Laws and Regulations……………………………………………………...25
5.2 Price Policies……………………………………………………………………..28
5.3 Tax Policies………………………………………………………………………29
6. MSWManagementintheUnitedStates…………………………………………….…..30
7. WTE Development and Policies in the United States……………………...…………34
7.1 WTE development in the United States………………………………………….34
7.2 WTE policies in the United States……………………………………………….37
7.3 Challenges facing WTE development in the United States……………………...38
8. Analysis on Policies in China and in the United States……………………………….39
9. Conclusions ……..……………………………………………………………………....41
10. Recommendations …………..…………………………………………………….……42
11. References……………………………………………………………………………….44

6
List of Figures and Tables
Figure 1: Streets are left covered in rubbish near these high-rise buildings and a children’s playground……………………………………………………………………………………..8 Figure 2: TheWasteManagementHierarchy…………………………………………………..…………...10 Figure 3: A Chinese recycler is sorting through plastic bottles in China. Much of Chin’s recycling process is done by hand and is highly ineffective…………………………………11 Figure 4: A truck empties garbage that is quickly searched by people at a landfill in Changchun……………………………………………………………………………………13 Figure 5: MSW incineration plant, owned by China Everbright International Limited, is located in Suzhou, China……………………………………………………………………..14 Figure 6: MSW consists of everyday items thrown away by individuals…………………....15 Figure 7: Fly ash and bottom ash can be reused if treated properly. The ash is used to make construction materials, such as bricks and concrete………………………………………….19 Figure 8: The population of China represents 19.48 percent of the world’s total population…………………………………………………………………………………….21 Figure 9: An example of a BOT structure of an MSW incineration plant project in China…………………………………………………………………………………………24 Table 1: Policies encouraging WTE projects in China………………………………………26 Figure 10: In the late 1800s, public works in America began. The figure illustrates the town of Kearny, Nebraska having sewer pipes installed…………………………………………..31 Figure 11: Despite solid waste management legislations piles of household garbage is seen at an open dump in present day…………………………………………………….…………...33 Figure 12: New York City is dimly seen through the dense smog covering much of the city……………………………………………………………………………………………33 Table 2: A list of the major federal laws that affect municipal solid waste management…...35 Figure 13: Opened in 1989, the Palm Beach Renewable Energy Facility 1 is an example of waste to energy facility in the United States…………………………………………………36 Figure 14: Opened in 2015, the Pam Beach County Solid Waste Authority’s Renewable Energy Facility 2 is the first WTE facility built in the United States in more than 15 years………………………………………………………………………………………….38

7
Acknowledgements
First, I would like to thank my advisor, Professor Nickolas J. Themelis for his
guidance, patience, and support during my pursuit of my master’s degree. I have been
inspired by his diligence and unwavering passion toward research and waste to energy. I am
forever grateful for his confidence in me. I would also like to thank Professor A.C. Bourtsalas
for his invaluable and generous support on this research. His expertise and knowledge in the
field of waste management were an asset to my research.
Secondly, I would like to thank Professor Steven Alan Cohen for mentorship during my
studies at the Environmental Science and Policy program at Columbia University's School of
International Affairs (SIPA). He taught me innumerable, practical lessons on how to
approach research and how to approach problem-solving.
I gratefully acknowledge the financial support of the Global Waste to Energy
Research and Technology Council (GWC) of the Earth Engineering Center (EEC) at
Columbia University, EEC alumna Dr. Li Wu, and other GWC sponsors . Without them, this
academic pursuit would not have been possible.
I would also like to thank my SIPA colleagues who provided a great deal of moral
support, including Mohammad (Umar) Ashfaq, Zenia Montero, Iara Vicente, Averill
Wickland, Isaac Wilkins, and Lacey McCarthy. Thank you for your comradery and support.
Finally, I cannot thank my family and friends enough for the love and encouragement.
I am grateful for my beautiful mother, Nancy, for her unconditional love and unwavering
belief in me. Secondly, I am fortunate to have such a loving father, Cliff, whose advice and
example has been a positive influence my life. Lastly, I would like to thank my friends,
Marissa Sterling, Tiara L. Cunningham, David Lee, Raymond Liang, Ronald Leung, and
Alex Liu for their friendship.
Thanks to the universe for all of you.

8
1. Management of Solid Waste (MSW) in China
Before the 1980s, there was no formal treatment or disposal of municipal solid waste
(MSW) in China. At that time, MSW was collected and transported to rural areas to be used
as fertilizer because its quantity was small and it consisted of mostly food. However, as
China's economic development took off, China's use of MSW as fertilizer declined and
farmers replaced MSW with chemical fertilizers. As a result, a significant amount of MSW
was dumped in streams, ponds, and roadsides at the outskirts of cities. By the late 1980s,
major cities, like Shanghai and Beijing, became surrounded by MSW creating a hazardous
environmental situation that drew the attention of many local governments (Dong 2011). Of
the 688 cities in China, it is estimated that two-thirds are surrounded by landfill sites (Zhang
et al. 2015). Figure 1 is an extreme example of a trash-filled street in a Chinese city. Data
Source:dailymail.co.ukFigure1Anextremeexample:Aphotographofstreetscoveredinrubbishnearhigh-risebuildingsandachildren'splayground.

9
from 2007 showed that China surpassed the United States of America (USA) as the world's
largest producer of MSW (Song et al. 2013). It has been estimated that China will produce
over 480 million tons of MSW by 2030 (Asian Development Bank. 2009).
The first regulation that was passed to address MSW disposal management was the
City Appearance and Environmental Sanitary Management Ordinance in 1992 by the State
Council of the People’s Republic of China. This legislation is the principal guideline to which
municipal governments look to for MSW disposal practices. Since then, other laws on waste
management have passed. One of the most influential is the Law on Prevention and Control
of Environmental Pollution Caused by Solid Waste of People's Republic of China (PRC).
According to the legislative and regulatory framework for disposal of solid waste, local
government has its role and responsibility. In a sense, like in most developed nations, the
Central government set laws and guidelines for solid waste management for local
government to follow. It is up to each of the municipal governments to then set up its
requirements and practices for MSW disposal.
Currently, there is no single solution to waste management. Instead, there is a mixture
of treatments and disposal options for municipalities to employ to address the MSW problem
in China. Under the general guidance of the Hierarchy of Waste Management system (Figure
2), several solutions have already been implemented, such as recycling, composting,
combustion with energy recovery and finally, sanitary disposal landfilling. However, waste
management facilities in China are not equipped to deal with the amount of MSW collected
and in many cities, these facilities are not sufficient to treat and disposal the MSW (Song et al.
2013). The lack of waste management facilities has resulted to most of the MSW still being
landfilled throughout China..

10
1.1 Recycling
Recycling is a critical cornerstone of the waste management. Currently, in China,
there is a significant amount of formal and informal recycling taking place in the main cities.
In 2005, an estimated over one million people worked in the formal recycling system,
Source:epa.gov
Figure2TheWasteManagementHierarchy(USEPA).

11
employed by local government or local business, with the primary task of collecting and
transporting waste to recycling centers. Another 2.5 million people are estimated to work in
the informal recycling system, which is made up of private citizens selling collected materials,
who are not associated with any local government or business entities (World Bank 2005).
China's recycling numbers are hard to obtain, due to the significant amount of
informal recycling taking place in the country. Many materials are already recovered by
informal recyclers before formal recyclers can collect the waste for processing. An example
of recycling can be seen in Figure 3. In some major cities in China, there is a mandatory
recycling quota that is put in place to limit the amount of waste going to landfills. Cities like
Beijing, Shanghai, and Guangzhou already recycle a fraction of the MSW they generate
(Dong 2011). However, it is hard to know the actual amount of materials that are recycled.
Source:irrawaddy.comFigure3AChineserecyclerissortingthroughplasticbottlesinChina.MuchofChina'srecyclingprocessisdonebyhandandishighlyineffective.

12
1.2 Composting
Composting is seen as another form of recycling. China’s MSW has a high moisture
content, which is especially suited for composting. Although as much as 60% of China’s
MSW is biodegradable organic matter and contains a high moisture content, composting
accounts for only 2% of the total MSW treated in China (Dong 2011).
1.3 Combustion with Energy Recovery
Waste incineration technology was introduced to China in the late 1980s and
developed rapidly in the 1990s. In 2003, there were only 47 waste incineration plants, with a
capacity of 3.7 million tons a year. By 2013, China had 166 waste incineration plants, with a
capacity of 46.3 million tons a year (Zhang et al. 2015). Seen as the best solution for
managing post-recycling MSW, combustion of MSW with energy recovery, commonly
called waste-to-energy or WTE, , has several advantages over landfills, such as significant
volume and mass reduction of waste and energy recovery during the process (Cheng, Hu.
2010). As such, waste to energy plants are becoming more and more important in addressing
the issue of China’s growing MSW generation. However, because of their relatively high
capital investment, most waste incineration plants are located in economically developed
cities in China.
To further encourage waste to energy (WTE) sector in China, the Central government
has issued several favorable policies toward the industry. These include prioritized
commercial bank loans, low loan interest, guaranteed subsidized price for the purchase of
electricity, carbon financing and low or no tax on revenues (Dong 2011). Through the
encouragement of the Central government of China, in 2009 waste to energy accounted for a
nearly 20% of the total MSW treated in China (Dong 2011). The WTE fraction has increased
since then, due to the construction of nearly thirty new WTE plants each year.

13
1.4 Landfilling
Currently, many cities in China have no suitable places for landfills and are
addressing the problem of garbage siege, which is leading to serious environmental,
underground water, soil, and health contamination (Song et al. 2013). The management of
MSW can impact public health, and it is critical for the government to devote resources and
attention to MSW treatment.
The management MSW did not exist before the 1980s. Before the 1980s, waste was
openly dumped anywhere, away from populated areas. It was estimated that only 2% of
MSW was properly disposed before the 1990s. The rate of disposal gradually increased in the
1990s, and by 2013, 89.3% of MSW was disposed of properly (Song et al. 2013).
In 2009, it was estimated that 80% of MSW in China ended up in landfills (Dong
2011). Being the least attractive option for MSW treatment and disposal, there are many
shortcomings when it comes to landfills in China. For example, even well-designed landfills,
with methane capture technology to use for energy recovery, cannot capture all the biogas
generated within the landfill. Also, improperly constructed landfills with the passage of time
can result in environmental damages and degradation. Other issues revolve around the
presence of waste pickers and inadequate collection and treatment of waste. Though China is
looking to improve on these matters, landfills are being heavily used as the primary disposal
option for MSW in China.

14
The problem is much worse for illegal waste dumping sites, which are not
sanctioned by the government for business. Illegal dumping sites are under no environmental
control and can have a serious effect on public health or human health control that would
limit the effects of waste on human bodies. Landfills in China are often opening fields; this
can be seen in Figure 4.
In 2005, it was estimated that in a major city like Beijing or Shanghai, there were
about fifty illegal dump sites, with at least five with immediate attention (World Bank 2005).
With efforts in place to clean up these illegal dump sites, China is on its way to adequately
addressing the MSW disposal issue.
Source:NBC.com
Figure4AtruckemptiesgarbagethatisquicklysearchedbypeopleatalandfillinChangchun.

15
1.5 Urbanization in China and Management of Municipal Solid Waste
In 1978, China initiated market reforms that shifted the economy from a centrally
planned to a market-based economy and began the rapid economic development we see today.
China's urbanization is characteristic by the mass migration of the rural population into cities.
Due to China's rapid urbanization and population growth, MSW generation has rapidly risen
as well. In 2013, estimates put China's total MSW generation at 172 million tons (Song et al.
2013), thus making it one of the highest generators of MSW in the world. China's rapid
economic growth have accompanied by a sharp increase in waste generation. With
development comes improved standard of living, but also significant amount solid waste. For
the past thirty years, municipal solid waste (MSW) collection increased from 31 million tons
in 1980 to 157 million tons in 2009. Estimates put one-third of Chinese cities are facing the
problem of MSW disposal (Dong 2011). An example of a modern WTE facility in China is
seen in Figure 5.
Figure5MSWincinerationplant,ownedbyChinaEverbrightInternationalLimited,islocatedinSuzhou,China.
Source:ebchinaintl.com

16
2. Municipal Solid Waste as a Renewable Energy Source
2.1 MSW as a fuel
The term “renewable energy” has traditionally been referred to energy that is
replaceable or inexhaustible in nature, such as water, the wind, solar and bio-organic
materials. MSW consists of mainly paper, food, wood, cotton, leather waste, and also times
fossil fuel-based materials, like plastics and other artificial fabrics (Zhang et al. 2015). The
conversion of MSW to energy has a significant potential to reduce greenhouse gasses, and the
United States Environmental Protection Agency (US EPA) listed MSW as a renewable
resource for energy production (EPA). The composition of U.S. MSW is shown in Figure 6.
The US EPA defines MSW as any "durable goods, nondurable goods, containers and
packaging, food waste and yard trimming, and miscellaneous inorganic waste" (EPA).
Figure6MSWconsistsofeverydayitemsthrownawaybyindividualssuchasproductpackaging,gardenclippings,newspapers,bottles,foodwaste,clothing,paint,andbatteries.
Source:EPA.gov

17
However, MSW does not cover all forms of solid waste, such as construction waste,
industrial or sewage waste. MSW can also refer to the collection and disposal of urban waste.
In 2005, China's Renewable Energy Law, passed, recognizing MSW as a renewable source of
energy. Since then, MSW incineration plants have been categorized as renewable energy
sources and are treated and benefited from renewable energy tax credits, loans, and subsidies.
The appeal of MSW incineration technology is the dramatic reduction of the need for
landfills and the conservation of land resources.
2.2 The MSW Combustion Process
Waste incineration technology utilizes MSW as a fuel to burn, instead of using coal or fossil
fuel; i.e., MSW is used as the primary fuel. The controlled combustion of MSW is a
fundamental part of the waste management hierarchy, as MSW can be fully utilized to
generate energy for the public. MSW combustion replaces coal, or other types of fossil fuel
as the primary source of chemical energy to the combustion process. MSW is unloaded from
collection vehicles and placed in storage bunker. Then an overhead crane sorts the waste,
which then will lift the sorted MSW into a combustion chamber to be burned. The heat from
the burning MSW is recovered in heat exchangers to convert water into steam, which is then
sent to a turbine generator to produce electricity. The most important part of modern WTE
plants is the Air Pollution Control (APC) system in which chlorine and sulfur compounds in
the furnace gas are removed by chemical reaction with calcium oxide, nitrogen oxides are
removed by reduction with ammonia or urea, and dioxins and volatile metal molecules are
adsorbed on activated carbon particles. The gas then passes though a fabric filter baghouse
where the articulate matter is removed by filtration. The cleaned gas is then conveyed to the
stack.

18
The bottom ash from the combustion process is collected and subjected to ferrous and
non-ferrous metal recovery and can then be disposed in ash monomials or used as a
construction material in highway construction or other civil work application.
2.3 Development of WTE in China
The increase in MSW generation has to lead to environmental damages due to
pressure on existing landfills. The pressure on landfills is why the need for smart waste
management has led to the adoption of a concept known as "hierarchy of waste
management." The United States Environmental Protection Agency developed the tiered
waste management system to guide waste management decision-making, with the aim of
reducing the amount of disposable waste and preserve valuable, limited landfill space. The
system places emphasis on reducing, reusing, and recycling to the cornerstone to sustainable
practices (EPA).
The hierarchical system of management prioritizes minimizing and reusing waste,
however, after all, possible recycling and composting, there is only two options for post-
recycling waste: waste to energy (WTE) or landfilling. Seen as a better solution than
landfilling, WTE can reduce the volume of waste by 90% and lessen the mass of waste by
70%, along with energy recovery (Cheng, Hu. 2010). The reduction in waste is the reason for
WTE facilities are constructed across China, despite the large initial capital investment and
substantial operating cost associated with WTE facilities (Dong 2011).
When compared to landfilling, WTE has a substantial capital investment and high
operating expenses. At the core of WTE is the boiler, which accounts for 50% of the cost of
investment (Zhang et al. 2015). For example, the Shanghai Pudong Waste Incineration Power
Plant has an investment of 110 million USD, and the Shanghai Jiangqiao Waste Incineration
Power Plant has an investment of 144 million USD (Zhang et al. 2015). The cost associated
with WTE facilities are not sustainable for most Chinese cities; hence the majority of WTE

19
facilities are located in economically developed regions of China and majority of the
premises are mainly funded by local governments (Zhang et al. 2015).
Driven by a national target for WTE development and low carbon objectives. China's
WTE sector has experienced rapid growth. However, China's WTE industry is experiencing
challenges in recent years. Not only do problems come in forms of technological, but also
environmental, social, health and other types as well. As China moves into the "13th Five
Year Plan", challenges facing the WTE sector are addressed, but the question remain; how
effectively can the government address the challenges facing WTE industry in China?
2.4 Challenges Facing WTE Sector in China
China's WTE sector is mainly based off technology that is mature and simpler than
other MSW treatment options, excluding landfilling. In 1988, China established its first WTE
facilities, and since then much more followed. As the demand for MSW incineration increase,
China will need to develop more WTE facilities to keep up demand. However, WTE are
capital intensive projects; they require much financial support from an early stage of
development to long-term operation cost. WTE facilities require high cost is one of the
biggest challenges facing the sector. Most of the expense of a WTE facility comes from the
core or the boiler when combustion is taken place. The core can account for 50% of the total
cost for a WTE facility (Zhang et al. 2015). With most WTE plants cost hundreds of millions
of dollars, these costs are unsustainable for many Chinese cities. Although, the government
has turned to Public Private Partnership (PPP) models to encourage private investment into
WTE (Song et al. 2013).
The low heat of MSW in China is another challenge facing China. When compared to
developed countries, China’s MSW separation is less developed (Zhang et al. 2015). As a
result, the MSW has a low heat value because of its high bio-organic composition and
moisture content, making the MSW less energy efficient when incinerated. In turn, a lot of
20
renewable materials are destroyed during the incineration process, and a significant amount
of fly ash is created.
Fly ash is a light form of ash that is the remains of MSW when incinerated and is
light enough to suspend in the air (Cheng, Hu. 2010). Fly ash is light than bottom ash, which
is a heavier form ash that is left from MSW incineration (NRDC 2015). When it comes to fly
ash, many regions in China have yet to address this environmental problem. Fly ash is
hazardous, containing dioxin and heavy metals harmful to the environment and well as to the
human body. Like dioxin emission, which has a national standard to meet, fly ash, and
bottom ash also has requirements regarding proper treatment. However, few municipalities in
China have the special facilities for treating fly ash, and instead illegally dump the fly ash in
open dumping sites (Zhang et al. 2015). Bricks created out of fly ash can be seen in Figure 7.
As living standards improve, so does the expectation for the living environment. The
expectation for a better living environment is why, as new WTE facilities are planned, the
public opposition have been a significant challenge for WTE development. In a report
measuring Chinese WTE facilities, dioxin emission found that many incineration plants do
not meet the national standard for dioxin emission (Ni et al. 2009). This substandard
Source:atrinandancementproducts.comFigure7Flyashandbottomashcanbereusediftreatedproperly.Theashisusedtomakeconstructionmaterials,suchasbricksandconcrete.

21
performance has led to strong public opposition to the construction of waste incineration
plants in communities across China.
The growing green movement in China is increasing the awareness of the need to
protect the environment, and hence public opposition has become the most challenging aspect
of WTE development in China (Qiu et al. 2012). With inappropriate site selection for many
WTE facilities, there is a growing amount resistance to waste incineration in many Chinese
communities. The resistance to waste incineration in China have resulted in a social
movement in China known as the “Not in My Backyard,” which is an organized opposition to
planned industrial or commercial land near residential communities (Herszenhorn 2000). One
of the main reasons why there is such an opposition towards WTE is the lack of public
participation during the planning stage of WTE development.
As citizens in China are becoming more and more environmentally conscious, the
public has begun to worry about the negative health effects of WTE incineration may have on
the human body. Currently, there is limited public participation in the planning process.
Whatever participation is there is seen as a form of goodwill, which is far from fully
involving the public in WTE development (Zhang et al. 2015).
3. National Support and Policies of WTE in China
3.1 Stable and Efficient Policies in Support of WTE in China
Despite the challenges facing Chinese WTE sector, for the past three decades, the
WTE industry in China has experienced a historical growth, unseen before in history. For
China’s WTE industry, the stable and efficient policies adopted by the Central government
are the foundation for the rapid expansion, experienced by the sector. Today, WTE industry
is given the special support status of renewable energy to develop the potential of WTE in
China further.

22
The potential of WTE in China comes from the growing population and shortage of
land. Figure 8 shows China’s population since the 1950s. The extreme difficulties to find
land for landfills is driving local municipality authorities to look for other MSW management
solutions. Waste incineration can reduce the volume of MSW by 90% (Cheng, Hu. 2010) and
can incinerate over a 1000 tons of MSW per day, WTE has great potential to play a larger
role in MSW treatment.
3.2. Support of WTE in China
The potential of WTE in China can only be achieved by the support of policies and
incentives to which then can the WTE sector grow. As a strong foundation, Chinese WTE
industry has already experienced a tremendous rate of growth under reliable and efficient
policies. In recognizing the problem of MSW generation, the Central government of China
adopted solutions to address the issue. Solution mainly involving MSW incineration were
supported by several national policies. In China's "12th Five Year Plan”, a Soviet-style
Figure8ThepopulationofChinarepresents19.48percentoftheworld´stotalpopulationwhicharguablymeansthatonepersonineveryfivepeopleontheplanetisaresidentofChina(WorldBank).
23
economic plan published by the Chinese every five years, outlining the targets and goals for
the nation. Chinese national government planned on investing 12.3 billion dollars into WTE
development (Zhang et al. 2015), in the period from 2011 to 2015, hoping to introduce the
MSW solution to more regions in China.
Along with direct investment from the government, the support for WTE in China is
far more significant than compared to the United States. Regarding funding policy for large
environmental protection projects, the government requires a private investor provide 30% of
the initial capital (Zhang et al. 2015), and remaining capital can be provided by local,
provincial, or Central governments. In much WTE development, the local government will
provide much of the initial capital investment and look for private investors to buy into the
project, to meet the national government requirements. The Central government often provide
revenue policies, making WTE an attractive industry for private investment. By establishing
favorable tax incentives, high energy purchase price, and tax exemption on 5% of earned
revenue (Zhang et al. 2015), the Central government has made WTE sector in China a safe
investment, eliminating as much risk as possible for potential investors.
Part of the Central government's plan toward codifying environmental legislation and
regulation, many policies have been enacted to address the MSW problem and utilize MSW
as a source of renewable energy (Zheng et al. 2014). Since 2000, Chinese WTE industry has
experienced an incredible rate of growth, in part driven my progressive policies and
regulations list above.
China has an extensive list of rules and regulation on MSW that stretches back to
1992 with China’s first law regarding the treatment of MSW, the “City Appearance, and
Environmental Sanitary Management Ordinance." However, the WTE sector only recently
experienced a rapid growth in the 2000s.

24
4. Structured and Planned Approach to WTE development in China
4.1 Structured approach to WTE development in China
The success experienced by the WTE sector in China can be attributed to the
approach the Central government adopted over the years. When it comes to high capital and
high-risk projects, very few private investors would want to be attached to such projects. The
high risk involved with waste incineration plants, the Central government set mechanisms in
place to address the high-risk factor associated with the WTE industry. Along with
supportive policies and tax incentives, there are market tools; the Central government has
employed to support WTE sector growth.
The financial structure of funding WTE projects are the primary market device, the
Central government in China, have adopted to foster WTE industry development. The three
most common types of financial structure are Build-Operate-Transfer (BOT), Transfer-
Operate-Transfer (TOT) and Public-Private Partnership (PPP). Each of these structures has
advantages and disadvantages (Xin-gang et al. 2016), but by far the most common structure,
out of the three, is BOT.
Government investment can be a strong signal to private investors the willingness and
seriousness of government commitment towards certain public projects. Government
commitment towards certain public projects is why BOT financial structure is the most
common in Chinese WTE development (Xin-gang et al. 2016). BOT structure allows the
financial burden be shared among private and public stakeholders.
By introducing professional private companies and staff, it can lower the construction
period and reduce the cost, along with improvising efficiency. Not only does the BOT
structure benefit large multinational professional firms, but also helps China by bringing a
significant amount of foreign capital into the country. The BOT structure is illustrated in
Figure 9.

25
BOT structure is used to attract both foreign and domestic investment. BOT allows
the government to share the risk of large projects. The government grants the construction
and operation of the facilities to an enterprise, which is then responsible for the investment,
financing, design, construction, and operation of the waste incineration plant. After a period
of operation, usually 20 to 30 years (Y. Li et al. 2015), the operation is transferred over to the
government.
The government in the meantime pays waste disposal fees to the waste incineration
plant and ensure the electricity generated by the plant can be sold to the national grid. BOT
the policy is key to China’s rapid WTE development. Not only do investors obtain a return on
investment, but the investors also earn additional revenue (Y. Li et al. 2015). The BOT
approach to WTE development key factor lies in the full utilization of social forces and
market competition to create an environment of rapid growth and high quality.
Source:sciencedirect.com(Zhengetal.2014)
Figure9AnexampleofaBOTstructureofanMSWincinerationplantprojectinChina.

26
4.2 Planned approach to WTE development in China
Every five years, China publish an economic development plan outlining China’s
economic target to meet in the coming five years. In the “12th Five-Year Plan”, which ended
in 2015, the Central government promoted resource utilization of MSW. Within the “12th
Five-Year Plan”, it recognized the relationship of MSW treatment and economic, as well as
social, development of China. The “12th Five-Year Plan”, also recognized the importance of
MSW treatment when it comes to environmental protection and public health (Li et al. 2015).
Based on the “12th Five-Year Plan”, the Central government planned a vast number of
projects for MSW incineration throughout China, showcasing the support the Central
government has the technology and the industry. With China moving into the “13th Five-Year
Plan”, stretching from 2016 to 2020, it is predicted that more MSW incineration projects are
in development and that China is looking to add 19,500 tons of MSW processing capacity per
day in the next five years (Zheng et al. 2014).
Through a series of policies, preferential tax treatments, and favorable tariffs of MSW
incineration, the Chinese government is maintaining a healthy supportive attitude towards
WTE development. It is through these active and beneficial policies did the WTE industry
grow and continue to grow.
5. Laws, Regulations, and Policies
5.1 WTE Laws and Regulations
A key piece to successful WTE development in China in recent history is the
Renewable Energy Law passed in 2005 by the National People's Congress. The law came
into effect on January 1, 2006, as part of China's overall shift towards renewable energy, the
law is the cornerstone of renewable energy development in the years that followed (Zheng et
al. 2014). The passage of the Renewable Energy Law helped boost the development of wind
and photovoltaic energy production. However, MSW incineration did not, at first, realize the

27
potential of the law, until the first amendments were made to the legislation (Zheng et al.
2014). Table 1 lists the policies that encourage the development of WTE in China.
Table 1 Policies encouraging WTE projects in China
No. Time Policy File Name Abstract
1 May 1997
Temporary Regulations on the Basic Construction Projects of New Energy
Specific provisions on construction projects of new energy
2 1998 Notification of approval of new energy construction projects
Includes waste to energy in new energy, and provides a lot of preferential policies to support waste to energy
3 Jan. 1999
Notification from the Planning Commission and the Ministry of Science and technology on further supporting the development of renewable energy
gives clear norms on the aspects of project setting up, financial support, grid combination preferential and pricing method, to accelerate the development of renewable energy priority of basic construction loans 2% financial discount for renewable energy project loans Acquisition of all power the power grid would share the part that is higher than the average price
4 May. 2000
Municipal solid waste disposal and pollution control technology policy
Specified garbage disposal technology and pollution treatment technology in detail.
5 Sep. 2002
Opinions on promoting the industrialization of urban sewage and garbage treatment
1) Guarantee the operating expenses and investment payback, achieve market-oriented operation of waste collection, transportation, treatment, and recycling 2) For investment in urban sewage and garbage disposal facilities, the project capital should not be less than 20% of the total investment, and operating period not more than 30 years3) Government gives necessary policy support to municipal solid waste treatment enterprises and projects constructions, including discounted power supply for waste treatment; allocation of project construction land for new urban garbage treatment facilities 4) operating cost compensation policy Governments should compensate the cost of the construction of waste collection and transportation facilities and garbage disposal fees

28
6 2002
Notification on the implementation of the municipal solid waste disposal charging system to promote the industrialization of garbage disposal
For waste treatment facilities that are in the construction for supplement waste treatment capacity, with the approval of the city government, household garbage treatment fee is allowed to support the construction. But the construction must complete and operation within three years.
7 Jul. 2004
Decision of the State Council on the reform of investment system
Allowing accesses for social capital to enter the infrastructure, public utilities and other industries and fields within laws and regulations permission.
8 Mar. 2004
No. 126th Document from the Ministry of Construction of the people's Republic of China
Defined franchise period no more than 30 years
9 2005 Industrial structure adjustment Guidance Catalogue
Government supports the Reduction, Recycling, Harmless Treatment and Comprehensive Utilization of Urban Garbage and Other Solid Waste Project
10 2005 People's Republic of China Law of Renewable Energy
1) the nation encourages and supports power generation by renewable energy and its combination with the power grid 2) enterprises on the power grid should sign contracts with those renewable energy power generation companies have legally obtained administrative license or submitted for the record, provide easy accesses to grid combination, and acquire their full generated power 3) Power price should be decided according to local conditions based on economic and reasonable principle, and be published.
11 2006 Trial management of renewable energy power prices and cost sharing
1) the subsidy price standard is 0.1 dollar per kilowatt-hour (equivalent to 0.65 yuan). Power generation projects enjoy the subsidy for 15 years from the date of production at the price of 0.25yuan/kWh 2) the mixed fuel power generation projects consume conventional energy of more than 20% shall be deemed as conventional energy power generation projects and don't enjoy the subsidies
12 Jan. 2006
Regulations on the Administration of renewable energy power generation
For large and medium-sized renewable energy projects, direct accesses to the power grid for hydropower, wind power and biomass power shall be invested by the power grid enterprises
13 May 2010
Notification on printing and distributing "the technical guidelines for the domestic refuse treatment."
Incineration facilities relate to less land use, rapid stabilizing, effective waste reduction, easy odor control and useful waste incineration heat.

29
14 Apr. 2011
Notification on Further Strengthening the work of municipal solid waste disposal
By 2015, the city garbage harmless treatment rate reaches higher than 80%. Each province builds more than one model city for garbage classification. 50% city achieves kitchen garbage classified collection. Municipal solid waste resource utilization ratio reaches 30%, and important cities plan to reach 50%. Establish improved urban household garbage disposal supervision system. Promotion for waste product recycling, waste incineration for power generation, biological treatment and other solid waste resource utilization.
15 Apr. 2012
Notification of the National garbage disposal facilities construction plan for the 12th Five-Year Plan
By 2015, the country's urban domestic waste incineration treatment facilities capacity reaches more than 35% of the total capacity of harmless treatment, of which the eastern region reaches more than 48%.
The amendments enforced purchase obligation by the national grid and the
commitment was incorporated into the overall national framework of renewable energy
development. The amendment included WTE into the national framework and recognizing
MSW as a renewable resource for energy production. The amendment also created a
renewable energy development fund, which is financed by budgetary allocations from the
Central government, and a collection framework for renewable energy fees charged
throughout China (Zheng et al. 2014). The establishment of a collection framework greatly
improved the financing of renewable energy production, including WTE, and created a broad
platform for the development of WTE in China.
5.2 Price Policies
When discussing WTE development, the environmental benefits should come before
the economic benefits. Financial returns are what most investors are concerned about when
considering a potential project. As a result, the Central government enacted two pricing
policies, with the latest policy regarding the most important (Zheng et al. 2014). In 2006, the
Central government tried to regulate the production price for WTE sector, by passing the
"Trial Measures for Price Administration and Costs Sharing of Electricity Generated from

30
Renewable Energy." The policy looked at the current price for MSW incineration power
generation and established the additional US $0.043 per kWh of electricity to be subsidized
by the government (Zheng et al. 2014). However, this policy applies to projects after 2006
and will in place for fifteen years. The adoption of the trial price system promoted in a rapid
development of WTE on a large scale. However, due to high cost, many WTE projects still
were only making ends meet.
As a result, in 2012, the Central government adopted the "Improvement of Feed-in
Tariff Policy of MSW Incineration Power Generation." The new policy looked to bolster the
already existing subsidies received by the WTE industry by increasing the feed-in tariff for
MSW incineration to US$ 0.11 per kWh of electricity, which is much higher than what coal-
fired was receiving at US$ 0.005 kWh of electricity (Zheng et al. 2014). Along with an
increase in subsidies, there were conditions put on WTE sector to boost energy production.
The condition came in the form of how renewable energy price is calculated and how it is
defined, regarding power generation.
To encourage the output of WTE generation as well as limit the use of traditional
energy the Central government adopted a new way of calculating purchase price. First, the
quantity of energy supplied by WTE (Q1) is calculated; second, comparing Q1 with the
overall traditional power (Q2), if Q1 is less than 50% of Q2, the WTE energy is regarded as
traditional energy and is purchased at the price of traditional energy; if Q1 is more than 50%
of Q2 but less than overall Q2, the WTE energy is then regarded as renewable energy and is
purchased at the price as renewable energy (Song et al. 2013). The Central government
believes by implementing new price policies; it will encourage the growth of renewable
energy and improve the profit for MSW incineration projects.

31
5.3 Tax Policies
China’s WTE development have been characterized as late-starting, large-scale and
rapid growth (Zeng et al. 2013). There is a need for research into WTE technology,
management, and policy, as to propyl promote the successful development of WTE in China.
As a result, the Central government implemented preferential tax policies toward WTE
development, and since, preferential tax policies have been the core principle of which the
Central government address WTE development in China.
The "Notice of Policies regarding the Value-Added Tax on Products on Products
Made through Comprehensive Utilization of Resources and Other Products," was adopted to
refund value-added tax (VAT) to WTE projects on January 1, 2001 (Zheng et al. 2014).
VAT is a general base consumption tax assessed on the value added to a good or a service
(EY 2016). Since then, the policy has been expired, replaced with a policy that only 80% or
more of the total fuel used can be refunded (Zheng et al. 2014).
In 2009, a trail program was lunch, titled "Notice on Promulgation of the Catalogue
for Enterprise Income Tax Preference for Environmental Protection and Energy and Water
Saving Programs." The trail program exempted WTE sector from paying income tax, for
three years, as of January 1, 2010 (Zheng et al. 2014). With the adoption of preferential tax
policies, WTE industry profited enormously. Again, these preferential tax policies showcased
that the commitment the Chinese government have toward WTE industry.
6.MSWManagementintheUnitedStates
Forthelongest,Americancitieshadnoorganizedpublicworksforthewaste
collection,sewagetreatment,andhumanwasteremoval.Itwasinthe1800s,didrecurring
epidemicsforcedeffortstoimprovepublicworksforstreetcleaning,wastecollection,
sewagetreatmentandhumanwasteremoval.However,bythetimeattentionturnedto
solidwastemanagement,fundingwasnotavailable,andthus,solidwastemanagement

32
becamealocalresponsibility,centeredonlocaldumps.Publicworksinlate1800canbe
seeninFigure10.
Inthemid-1900s,MSWgenerationincreasedasaresultofrisingAmericanaffluence
andurbanizationaccompaniedbyhigherlevelsofconsumption.Aslocalgovernment
expandedtocopewithnewdemandintheUnitedStates,thefederalgovernmentbecame
involvedwithregulationandfinancingforpublicworks.In1965,PresidentLyndonB.
Johnsoncalledfor"bettersolutionstothedisposalofsolidwaste"(Louis.2004).Thecallfor
bettersolutionstothedisposalofsolidwastefocusedfederalattentionontheissueofsolid
waste.
Asaresult,theUnitedStatesCongresspassedtheSolidWasteDisposalAct,asan
amendmenttotheCleanAirAct.TheSolidWasteDisposalActwasintendedtodothe
following:
1. Overseetheimplementationofsolidwastemanagementandresource
recoverysystem.
Source:circleofblue.org
Figure10Inthelate1800s,publicworksinAmericabegan.Thefigureaboveshows,in1889,thetownofKearny,Nebraskainstallingsewerpipesforthetown.

33
2. Providetechnicalandfinancialassistancetostates,localgovernments,and
interstateagenciesintheplanninganddevelopmentofthesesystems.
3. Accelerateandinitiateresearchprogramstodevelopsystems,guidelines,
andtrainingforeffectiveimplementation.
However,theattemptedtodealwiththesolidwasteproblemwaslimitedtoassessment
oftheproblem.Themainfocusofthefederalgovernmentwastoimprovedisposalmethods
ratherthanaddressingtheproblemasawhole.
In1970,fiveyearsafterthepassageoftheoriginalSolidWasteDisposalAct,theact
wasamendedagain,thistime,theamendmentwastoshiftthefocusofwastemanagement
towardrecyclingandenergyrecovery(Louis.2004).However,thepassageofthe
amendment,knownasResourcesRecoveryAct,raisedastrongresponsefromthelocaland
statelevels.However,by1975,almostallofthestateshadenactedsomeformofsolid
wastemanagementlawsandmosthadestablishedstateagenciesthatdealtwithsolid
wastemanagement.Despite,thefederalandstatelaws,thedaytodayoperationremained
alocalormunicipalresponsibility.Opendumpscontinuedtooperate,andthedesign,
construction,andoperationoflandfillswereignoredandinconsistentfromstatetostate,
leadingtoconfusion.AnexampleofanopendumpintheUnitedStatesinthepresentday
canbeseeninFigure11.
Duetoindustrializationandurbanizationofthe1900s,manyAmericancitiesand
industrialcentersexperienceddense,visiblesmogpromptthepassagetheCleanAirActof
1970(EPA).AnexampleofthesmoginAmericancitiescanbeseeninFigure12.TheClean
AirAct(CAA)includedspecificpartstoaddressemissionsfromincinerators,factories,and
landfills,aswellasemissionsfromcompostingfacilities(Louis.2004).Followingthepassage
ofCAAin1970,in1976,theResourceConservationandRecoveryActwaspassedintolaw.

34
TheResourceConservationandRecoveryAct(RCRA)becamethedefinitivelegislationfor
solidwastemanagementaswenowknowtoday(Louis.2004).RCRA'sintentionisto
promotetheprotectionoftheenvironmentandpublichealthtoconservevaluablematerial
andrecoverenergy.TheintentionofRCRArepresentedasignificantshiftinpolicyand
approach,fromtheevaluateandassesstothedirectimplementationapproach,especially
whenitcomestohazardouswastemanagement.
Figure11Despitesolidwastemanagementlegislationspilesofhouseholdgarbage,bagsofyardwaste,appliances,oldbarrels,usedtires,anddemolitiondebrisisseenatanopendumpinthepresentday.
Source:epa.illinois.gov
Figure12November1953,NewYorkCityisdimlyseenthroughthedensesmogcoveringmuchofthecity.
Source:vintag.es

35
WiththepassageofRCRAandCAAinthe1970s,landfilldeclined,whilewasting
incineration,recycling,andcompostingincreasedtooffsetthedrop-inlandfilling(Louis.
2004).RCRAeffectivelybecamethebasicapproachtosolidwastemanagementasweknow
ittoday.RCRAoutlinedtheprimaryfederalguidelinesforstateandregionalgovernments
fortheproperdisposalofsolidwaste.However,thefederalguidelinesand,later,federal
directivesstopattheplanninglevel.Asaresult,mostregionalgovernmentsdevelopedbut
didnotimplementregionalsolidwastemanagementplans.Currently,theimplementation
ofsolidwastemanagementplansremains,largely,alocalormunicipalgovernment
responsibility.
Intheabsenceofregulation,policyordirectivetoimplementsolidwaste
managementplans,ortocoordinatesolidwastemanagementefforts,solidwaste
managementoperationsremainedalocalandmunicipalresponsible,occasionallyinvolving
stategovernments.Currently,atthelocalandmunicipallevel,thefocusisonestablishing
operationalunitstoaddresssolidwasteinthenear-term.ThefailureofRCRAtorequire
morethanplanningstage,havereturnedtothecontactsystem,whereprivatecorporations
areincreasinglyowningandoperatinglargescaleMSWmanagementfacilities(Louis.2004).
ItisestimatedthatsomeregionsinAmerica,relyprimarilyontheprivatecorporationto
addresstheirsolidwastemanagement.DuetoregulationsfromCAAandRCRA,thecostfor
MSWmanagementhasincreased.Hence,manysmallmunicipalitiesareturningtoprivate
managementorganizationsfortheirsolidwastesolutions.Majorfederalstatutesthataffect
municipalsolidwastemanagementcanbeseeninTable2.

36
7. WTE Development and Policies in the United States
7.1 WTE development in the United States
Currently, in the United States (US), the most common method of MSW management is
landfilling, accounting for 64%; other methods of MSW management, including composting,
recycling, biological treatment, and WTE. Composting and WTE combine only accounts for
estimated 7% and recycling accounts for an estimated 28% (Psomopoulos et al. 2009). While
landfills have declined over the past three decades, the individual landfills itself have been
increasing in size. At current capacity, landfills can address the MSW management problems
in many regions of the United States. However, in the 1990s, MSW going to landfills
dropped by an estimated 11 million tons, and the net per capita discarding rate dropped from
3.19 per capita in the 1990s, to 2.32 per capita in the early 2010s (EPA 2015). The drop of
discarding rate can be attributed to several factors, one of which is recycling efforts to reused
materials American discard.
The first waste incineration power plant was introduced into the United States in the
early 20th century. By the 1970s, the US WTE industry was rapidly expanding, which was in
part due to policies that were enacted to address the 1970 energy crisis. The Public Utility
Regulatory Policies Act (PURPA) was passed in 1978 to mandate the price of electricity to
be "equal to the utility's avoided the cost of energy and capacity" (Williams. 2011). What
Source:Louis.2004Table2Alistofthemajorfederallawsthataffectmunicipalsolidwastemanagement.
37
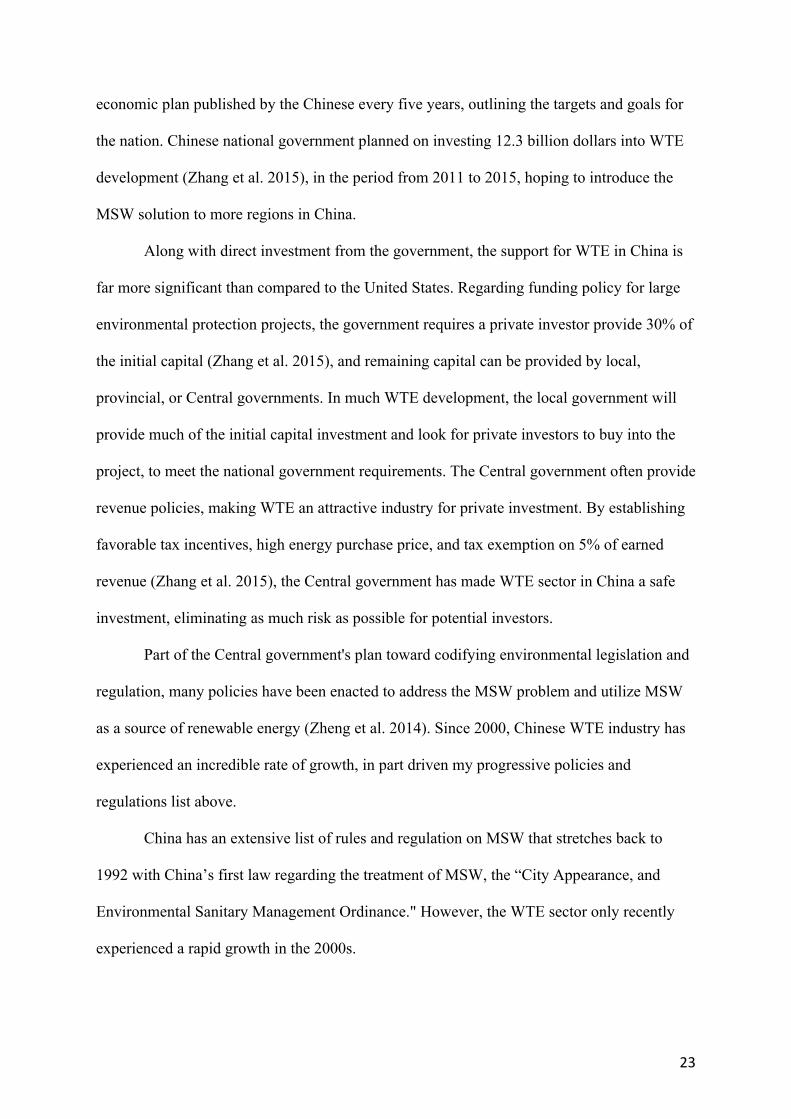
PURPA did was to off-set the cost of energy production, so that energy producers' cost of
energy production is limited and revenues are maximized. As a result, WTE industry received
a higher profit than they usually would. However, by the 1990s, WTE industry began to
stagnate, mainly due to environmental concerns brought on by the public and the end of
favorable policies toward WTE. Figure 13 shows the Palm Beach Renewable Energy Facility
1, opened in 1989, is an example of a WTE facility in the United States.
The opposition to WTE as an energy resource or as MSW management solution has
been universally adopted by activists and regulators here in the United States. The opposition
has been mainly based on the terrible experiences with traditional waste incinerators, which
emits high levels of toxic emissions. To address the toxic emission problem, the EPA enacted
regulation known as Maximum Achievable Control Technology (MACT) that required WTE
facilities to install Air Pollution Control (APC) systems to control the toxic emissions from
the facilities. With the enactment of MACT, the operating cost for many WTE facilities
increased. On top of the increase in operating cost, the PURPA policies and many tax
incentives that followed PURPA, all ended in the 1990s. The convergence of policy and
environmental factors affected the profitability of many WTE facilities in the US, resulting in
many facilities to be closed down.
Figure13Openedin1989,thePalmBeachRenewableEnergyFacility1isanexampleofwastetoenergyfacilityintheUnitedStates.
Source:swa.org

38
In the 2000s, there were efforts for WTE resurgence, given the America Jobs Creation
Act of 2004, that expanded the federal tax credit program for renewables. In the following
year, the Energy Policy Act was passed that recognized MSW as a renewable energy source,
hence, making MSW incineration projects eligible for renewable loan guarantees (Williams.
2011). Despite the recognition as a renewable energy source and eligibility for renewable
loan guarantees, there is still little sign for WTE to make a comeback in the US.
7.2 WTE policies in the United States
One of the biggest misconceptions of WTE in the US is that there is no governmental
policy on integrated waste management (Themelis. 2014). However, there are several
policies and guidelines from the US EPA, on integrated waste management in the US. RCRA,
passed in 1976, requires states to design and implement a solid waste management strategy.
RCRA tasked the EPA to develop guidelines to which states can then follow and implement
their MSW management plans. RCRA also banned open dumps nationwide and created a
guideline for the proper treatment of hazardous waste. These guidelines required by RCRA
outlined a governmental policy for states to implement an integrated waste management
strategy.
Under RCRA, WTE shows a rapid growth in the 1970s and 1980s. The rapid growth
of WTE sector was mainly attributed to the tax incentives that was provided by the federal
government in response to the 1970 energy crisis. According to estimation, WTE projects
receives the less amount of federal support when compared to another source of electricity,
which is including coal (EESI. 2009). The lack of support means that WTE projects are less
attractive to investors, given the large capital needed, as the risk of the project is too high for
private entities. In 2009, there were efforts to make renewable energy more attractive to
investors; the federal government passed the America Reinvestment and Recovery Act
(ARRA). ARRA gave a tax credit to renewable energy producers for ten years, starting from

39
the date of service. ARRA however, only applied to renewable energy facilities built after
August 2005 and not before October 2004 (EESI. 2009). The tax credit increased the
production of renewable energy to an average of US$ 7.42/kWh compared to coal
US$ 0.44/kWh (EESI. 2009). Which the incentives and tax credits, there is little development
in US WTE sector.
In 2016, Palm Beach County built the first WTE facility in two decades (Dawid.
2015), singling a positive sign to WTE development in the US. The newly finished WTE
facility in Palm Beach Country is seen in Figure 14. However, the construction of one WTE
in two decades is a modest development for the WTE sector, given the size of the US and the
US demand for energy.
7.3 Challenges facing WTE development in the United States
Looking through reports conducted by the US EPA, the US EPA identified three main
reasons why MSW combustion facilities are not more common in the US. They are as follow:
Figure14ThePalmBeachCountySolidWasteAuthority’sRenewableEnergyFacility2isa$672millionstate-of-the-artwastetoenergyfacility.Theproject,completedin2015,isthefirstofitskindintheU.S.nearly20yearsandthemostadvancedandcleanestwaste-to-energypowerplantinNorthAmerica.
Source:swa.org

40
1. The US EPA have concluded that regions where populations are dense, and land
is limited have greater adoption of WTE compare to the US, which is mainly
attributed to the limitation of available spaces.
2. The US EPA have also concluded that a strong factor in slow WTE development
in the US is due to public opposition to MSW incineration facilities. Due to a
negative experience with unregulated air emissions, incineration facilities have
gained a reputation as high polluters. There is also the factor of many
communities do not want the increased traffic from trucks handling waste.
3. The US EPA lastly concluded that the upfront capital needed to construct an
MSW combustion facility is significant and economic benefits takes years to be
fully realized. Large MSW combustion facility cost at US$ 100 million to
construct according to EPA estimates, and larger facilities may cost double or
triple as much.
The EPA conclusion is correct as to the three factors that have contributed to the lack
of development in the WTE industry. However, after analysis, a fourth factor should be
added to the factors that contributed to the lack of development for America WTE
industry; the lack of a federal plan and approach for the development of WTE in the US.
Without a clear and consist target and goal, the WTE sector in the US does not have the
drive to further develop itself. As financial and economic factors are against expanding
the industry, mainly due to large capital needed and slow returns on investment; there is
no incentive to for the industry to develop, resulting in the decline and stagnation we see
today.
8. Analysis of Waste Management Policies in China and United States
Government policies play a major role in supporting the development of the waste
management and the WTE sectors. In China, there are several government policies designed

41
to support the WTE industry to address the "waste siege" experienced by many cities. In
America, government policies are designed to help the US move away from dependency on
fossil fuels and focus on renewable energy production than on addressing any waste problem.
The different drivers of policy have drastically shifted the policies of both countries.
In China, WTE is seen as a solution to the growing MSW problem due to its growing
population. Whereas in the US, WTE is seen is a renewable energy source that is unlike by
Both the public and by politicians. As a result, policies in China and the US have similar
characters but drastically different motives and results.
China’s WTE development has outpaced the US, leaving the US to catch up. China’s
successful WTE development can be attributed to the efforts of a strategic nationwide
approach that can be broken into two main parts;
1. Structured approach by using market tools to eliminate financial risk associated
with WTE development, making the path clear for private investors and firms.
The Chinese government has preferred using the BOT structure when it comes to
financing WTE projects, as it allows financial risk to be shared among parties.
2. Planned approach with targets set by the Chinese central government for WTE
development and amount allocated to WTE growth. The planned approach is
associated with China’s Five Year Economic Plan. China’s Five Year Economic
Plan, illustrate China’s development path and goals for the next five years. WTE
is recognized by the Central government as an integral part of growth, both
economically and socially.
The planned approach is critical to WTE development in China, which is due to a
combination of favorable tax policies, tax exemptions, loan guarantees, and favorable pricing
on energy production.

42
US’s WTE development peaked in the 1980s and 1990s, where most of its currently
WTE facilities were built (Hauck et al. 2011). Time since the 1990s, there has not been much
WTE development in the US. The reason for lack of WTE development can attribute to the
abundance of cheap landfills, opposition from state officials who fear WTE could undercut
recycling programs and a negative public perception in the US (Rosenthal. 2010). As a result,
WTE regulation, legislation, and policy, on the federal level, have reminded relatively
unchanged for more than 20 years. The exception came in 2007, when the Energy
Independence and Security Act was passed, recognizing MSW as a renewable fuel source
(EESI. 2009). Again, in 2009 when the American Reinvestment and Recovery Act was
passed which provided production tax credit to renewable energy production (EESI. 2009).
According to Professor Nickolas J. Themelis, the Director of the Earth and Environmental
Engineering Center at Columbia University, “America’s resistance to constructing new
[WTE] plants was economically and environmentally irresponsible.” (Rosenthal. 2010).
Compared to the US, China publishes new WTE development targets and goals every
five years. New targets and goals from the Central government not only push forward the
WTE industry by creating competition and innovation but also shows the Central government
commitment to the development of WTE. In the US, there is no national target for WTE
development or any goal set forth by the federal government. As a result, WTE development
in the US has slowed and stagnated over last decade, while developing countries like China
have outpaced the US, constructing more WTE facilities than the US have in the last two
decades.
9. Conclusions
Municipal solid waste disposal is an increasing issue worldwide. As landfills are still
viewed as the best option for developing nations whereas, in developed nations, they
employ more advance methods for MSW disposal. The Chinese government recognized

43
that WTE development is not only is the best option for the disposal of MSW but also
associated with the positive economic development of the country. As a result, the
Chinese government has employed several policies aiming to encourage WTE
development. The US government, however, does not recognize WTE development as
the best option for disposal of MSW, it has left the decision to individual States to decide
what is best for their jurisdiction. As a result, American WTE development has been in a
state of stagnation and decline. With growing population and increasing demand for land,
resource, and energy, MSW generation looks to continue to increase over the next decade.
As economic factors and social factors shift the available of essential resource, WTE will
eventually become the most economically viable option for MSW disposal. For WTE
sector to grow in the US, it is recommended that US federal government adopt policies
stated within this report, and use China's WTE development model as a baseline for what
can be accomplished here in the US.
10. Recommendations
Based on analysis conducted in this paper, there are three recommendations for the
US to help restart the development of WTE in the US:
1. The United States should adopt federal legislation that would reduce and limit the
production of waste and reduce the amount of MSW being disposed at landfills.
The comprehensive strategy can be modeled after the European Union’s (EU)
directives on limiting landfills and reduction of waste. A directive is a legislative
act that sets out a goal that all EU countries must achieve. However, it is up to the
individual countries to devise their methods on how to achieve the directive
(europa.edu). For example, in 1999, the EU passed the EU Landfill Directive
(1999/31/EC), which required a progressive reduction of MSW to 75% of the
1995 disposal level by 2010 and 35% reduction by 2020 (Chang et al. 2010). The

44
result was some different solid waste management programs being adopted. There
was the Pay-Per-Bag scheme in Belgium and Italy; a plastic bag levy in Ireland; a
weight based charging scheme in Denmark and Sweden; and many other MSW
management schemes throughout the EU. Another example is the European
Council Directive (91/156/EC) that urges EU member states to "take appropriate
measures to encourage the prevention and reduction of waste production and its
harmfulness" (Chang et al. 2010). The directives left to implement to individual
EU countries to determine which method is best to achieve set targets and goals.
The US federal government should follow by passing regulations that sets targets
and goals for WTE development and MSW management.
2. The United States should adopt an approach to that would reduce the financial risk
associated with WTE projects, this would great encourage investment and create
an economic incentive for WTE development in the US. Upfront capital needed to
construct an MSW combustion facility is significant and economic benefits takes
years to be fully realized. Based on the Chinese financing model for WTE projects,
the US should adopt the same model. When local and municipal share the
economic burden along with private investors, it signals to investors that the
government is both committed and confident in the project. By adopting the BOT
structure of financing, the local government and state government aren’t carrying
the financial risk by themselves, but rather shared equally among partners.
3. Along with adopting a national target and goal for WTE development, the US
federal government should strengthen the renewable energy tax credit and adopt a
favorable tax policy that increases the incentives for renewable energy
development, including WTE development.

45
11. References
Castaldi, Marco J., and Nickolas J. Themelis. "The case for increasing the global capacity for waste to energy (WTE)." Waste and Biomass Valorization 1.1 (2010): 91-105. Chang, Shoou-Yuh, Wanchi Huang, and Shu-Liang Liaw. "Municipal Solid Waste Management: A Comparison between the US and Other Countries." Journal of Solid Waste Technology & Management 36.3 (2010). Chen, Xudong, Yong Geng, and Tsuyoshi Fujita. "An overview of municipal solid waste management in China." Waste management 30.4 (2010): 716-724. Cheng, Hefa, and Yuanan Hu. "Municipal solid waste (MSW) as a renewable source of energy: Current and future practices in China." Bioresource technology 101.11 (2010): 3816-3824. Dong, Yani. Development of Waste-To-Energy in China; and Case Study of the Guangzhou Likeng WTE plant. Diss. Department of Earth and Environmental Engineering Columbia University December 2011 Research sponsored by Earth Engineering Center, Columbia University, 2011. Ernst & Young (EY). “China VAT reform: Are you ready for the last run?” http://www.ey.com/Publication/vwLUAssets/EY-china-vat-reform-are-you-ready-for-the-last-run/$FILE/EY-china-vat-reform-are-you-ready-for-the-last-run.pdf
Glover, Brian, and Justin Mattingly. "Reconsidering Municipal Solid Waste as a Renewable Energy Feedstock." Environmental and Energy Study Institute (EESI), Washington DC (2009). Hauck, Paul L., Anthony M. LoRe, and Kevin Trytek. "Has the Time Come for More Publicly Operated WTE Facilities in the United States?." 19th Annual North American Waste-to-Energy Conference. American Society of Mechanical Engineers, 2011. Herszenhorn, David M. “Now It's 'Nothing in My Backyard'; Just About Any Kind of Project Can Rile Homeowners.” The New York Times. (2000). Kiser, Jonathan VL. "The Status of Waste-to-Energy in the US." 13th Annual North American Waste-to-Energy Conference. American Society of Mechanical Engineers, 2005. Li, Yun, et al. "Waste incineration industry and development policies in China." Waste Management 46 (2015): 234-241. Louis, Garrick E. "A historical context of municipal solid waste management in the United States." Waste management & research 22.4 (2004): 306-322. Michaels, Ted. "The 2014 ERC Directory of Waste-To-Energy Facilities." Energy Recovery Council (2014).

46
Psomopoulos, C. S., A. Bourka, and Nickolas J. Themelis. "Waste-to-energy: A review of the status and benefits in USA." Waste management 29.5 (2009): 1718-1724. Qiu, Ling, Yani Dong, and Nickolas J. Themelis. "Rapid Growth of WTE in China: Current Performance and Impediments to Future Growth." 20th Annual North American Waste-to-Energy Conference. American Society of Mechanical Engineers, 2012. Rosenthal, Elizabeth. "Europe finds clean energy in trash, but US lags." The New York Times 12 (2010). Song, Jinbo, et al. "Risk identification for PPP waste-to-energy incineration projects in China." Energy policy 61 (2013): 953-962.
The World Bank. “China, Overview.” http://www.worldbank.org/en/country/china/overviewCLE United States Environmental Protection Agency (EPA). “Clean Air Act Requirements and History.” https://www.epa.gov/clean-air-act-overview/clean-air-act-requirements-and-history United States Environmental Protection Agency (EPA). “Energy recovery from the combustion of municipal solid waste.” https://www.epa.gov/smm/energy-recovery-combustion-municipal-solid-waste-msw United States Environmental Protection Agency (EPA) “RCRA, Superfund & EPCRA Call Center Training Module.” https://www.epa.gov/sites/production/files/2015-09/documents/defsw.pdf (2001) Van Haaren, Rob, Nickolas Themelis, and Nora Goldstein. "The state of garbage in America." BioCycle 51.10 (2010): 16-23. Wang, Feng, Haitao Yin, and Shoude Li. "China’s renewable energy policy: commitments and challenges." Energy Policy 38.4 (2010): 1872-1878. Williams, Matt, and Anna Helm. "Waste-to-energy success factors in Sweden and the United States." Analyzing the Tranferability of the Swedish Waste-to-Energy Model to the United States (2011).
Xin-gang, Zhao, et al. "Technology, cost, a performance of waste-to-energy incineration industry in China." Renewable and Sustainable Energy Reviews 55 (2016): 115-130. Zeng, Ming, Chen Li, and Lisha Zhou. "Progress and prospective on the police system of renewable energy in China." Renewable and Sustainable Energy Reviews 20 (2013): 36-44. Zhang, Dongliang, et al. "Waste-to-Energy in China: Key Challenges and Opportunities." Energies 8.12 (2015): 14182-14196.

47
Zhang, Dong Qing, Soon Keat Tan, and Richard M. Gersberg. "Municipal solid waste management in China: status, problems and challenges." Journal of Environmental Management 91.8 (2010): 1623-1633. Zheng, Lijun, et al. "Preferential policies promote municipal solid waste (MSW) to energy in China: Current status and prospects." Renewable and Sustainable Energy Reviews 36 (2014): 135-148.