Study of Multicultural Color Preferences - · PDF file2 STUDY OF MULTICULTURAL COLOR...
21
FLORIDA STATE UNIVERSITY COLLEGE OF COMMUNICATION Study of Multicultural Color Preferences Natalie Kates ADV5416- Multicultural Marketing Communication Final Assignment Spring 2009 Dr. Felipe Korzenny
Transcript of Study of Multicultural Color Preferences - · PDF file2 STUDY OF MULTICULTURAL COLOR...

FLORIDA STATE UNIVERSITY COLLEGE OF COMMUNICATION
Study of Multicultural Color Preferences
Natalie Kates ADV5416- Multicultural Marketing Communication
Final Assignment
Spring 2009 Dr. Felipe Korzenny

2
STUDY OF MULTICULTURAL COLOR PREFERENCES
INTRODUCTION
There are various factors that differentiate cultural groups worldwide and
within the increasingly multicultural society of the United States “Today, taste and
trends must be considered globally in order to effectively market a product, and
understanding regional preferences is a prerequisite” (Hayden, 2008). Firms in our
nation and globally should develop marketing strategies that create and maintain
the desired brand image in customers’ minds and across cultural borders.
“One marketing cue that marketers can use regardless of
location is color. Color is an integral part of products,
services, packaging, logos, and other collateral that can
be an effective means of creating and sustaining brand
images in customers’ minds” (Madden, Hewett, and Roth).
Marketers that underestimate color may not realize that it is especially
crucial for creating first impressions. In the United States-- a society feeling
increasingly rushed for time-- many purchase decisions are considered the result of
impulse shopping. In these cases, color plays a huge role in standing out on the
aisles to consumers. “Color sets the tone before you can even begin to load the
mental software required to read a product’s label, marketing messages,
promotional materials, etc” (Sturgess, 2008). Before conducting my research on
color preferences, an important initial step is to explore previous studies that have
already been conducted.
3
LITERATURE REVIEW
Personality Influences on Color Preferences
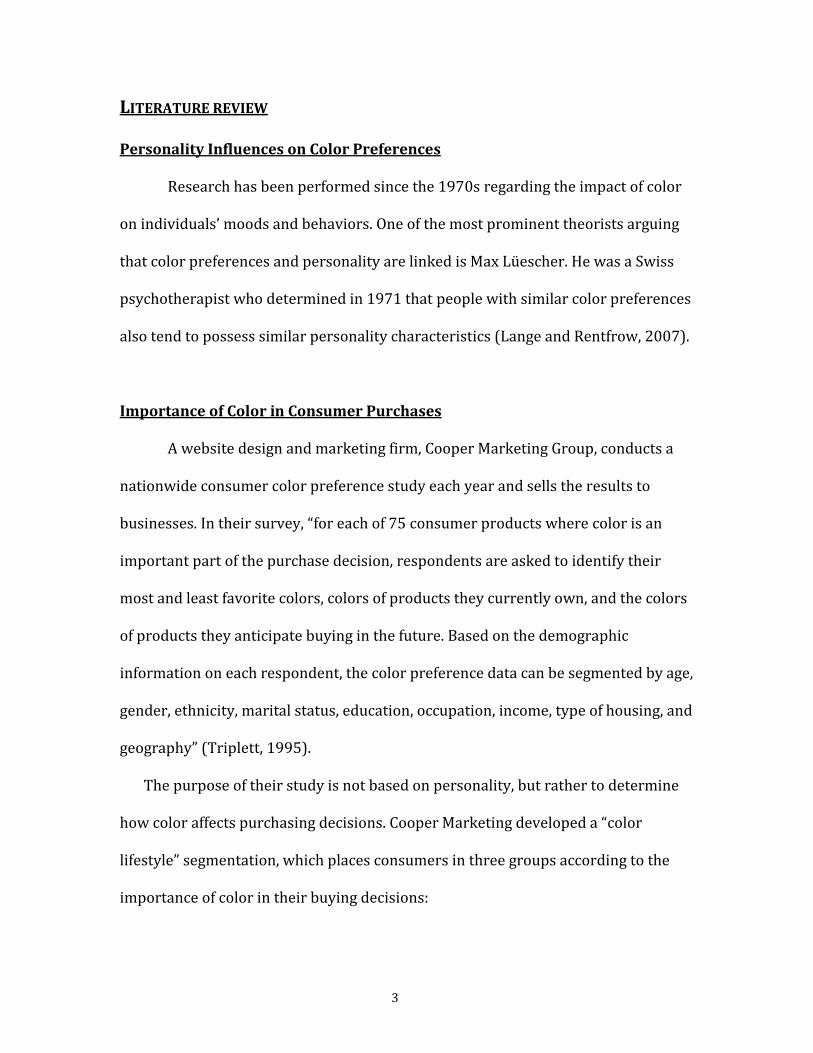
Research has been performed since the 1970s regarding the impact of color
on individuals’ moods and behaviors. One of the most prominent theorists arguing
that color preferences and personality are linked is Max Lüescher. He was a Swiss
psychotherapist who determined in 1971 that people with similar color preferences
also tend to possess similar personality characteristics (Lange and Rentfrow, 2007).
Importance of Color in Consumer Purchases
A website design and marketing firm, Cooper Marketing Group, conducts a
nationwide consumer color preference study each year and sells the results to
businesses. In their survey, “for each of 75 consumer products where color is an
important part of the purchase decision, respondents are asked to identify their
most and least favorite colors, colors of products they currently own, and the colors
of products they anticipate buying in the future. Based on the demographic
information on each respondent, the color preference data can be segmented by age,
gender, ethnicity, marital status, education, occupation, income, type of housing, and
geography” (Triplett, 1995).
The purpose of their study is not based on personality, but rather to determine
how color affects purchasing decisions. Cooper Marketing developed a “color
lifestyle” segmentation, which places consumers in three groups according to the
importance of color in their buying decisions:

4
• The Color-Forward Consumer likes to be the first to try a new color and is
willing to spend more for a product in a fashionable color. This group
represents a small, but highly influential consumer segment.
• The Color-Prudent Consumer will buy a new color only after seeing friends
try it. They often put quality ahead of color when choosing products and are
the largest majority of the market.
• The Color-Loyal Consumer replaces a product with another of the same
color and prefers safe rather than fashionable colors. These are a small,
predictable segment because they usually consistently buy the same color.
The Impact of Gender and Age on Color Preferences
Traditionally, men and women have had different tastes in color. In the past,
women were usually drawn to brighter tones and more sensitive to subtle shadings
and patterns. “The differences are attributed to biology, since females see color
better than males do (color blindness is 16 times more prevalent in men), and in
part to socialization”, says Kathy LaManchusa, a color trend strategist for companies
such as Kmart, Motorola and Philip Morris (Paul, 2002). More recently, some studies
are showing that gender is having less of an impact on color choices.
Research has also found that age can affect color preferences. Margaret Miele,
assistant professor of psychology at the Fashion Institute of Technology in New York
City, explains that as we get older, our eyes mature and our vision takes on a yellow
cast. “Color looks less bright to older people, so they gravitate to white and other
bright tones” (Miele, 2002).

5
Due to the evidence of age influencing preferred colors, the director of color
marketing and design at the Sherwin-Williams Company (a global paint producer),
Linda Trent, made divisions of color preferences into age groups consisting of:
• The Mature Market (individuals over the age of 65)- prefer yellow, pink,
blue, and white
• Baby Boomers (born between 1945 and 1964)- drawn to cool shades of blue
• Generation X (born between 1964 and 1980)- exotic greens, violet, and reds
• Generation Next (teenagers)- leans towards bright neons and tropical hues
Multicultural Influences Affecting Color Preferences
Ethnic differences arising from cultural, religious and historical experiences
are a major influence on color preferences (Paul, 2002). Research has indicated that
the color choices of younger consumers can be particularly influenced by the
cultural context in which they come of age.
"Each generation has its own history. They grew up with
different values and ideals, were exposed to different
cultural trends and ethnic influences. Today, people are
surrounded by many more cultures, making younger
generations more open to cultural influences, and this
comes out in color preferences a great deal.” -Kathy LaManchusa, a color trend strategist for companies such as Kmart, Motorola and Philip Morris
The trend we may be witnessing in the United States toward brighter and
more complex colors reflects the increasingly multicultural makeup of the country.
6
The vice president of Cooper Marketing Group, Mimi Cooper explains that “As we
become a nation of minorities, more people are going to want to try out new colors.
That may mean the country will keep getting more colorful.”
"We're seeing a strong influence from the Hispanic market in terms of reds,
yellows and oranges, being reflected in consumer products," says Jay de Sibour,
president of the Color Marketing Group. "And with globalization, we're seeing more
colors from Asia, also in the red and yellow family.” Past research has found that
African Americans are drawn to strong colors often in the red, yellow and brown
families. This is a preference that may be rooted in their African heritage.
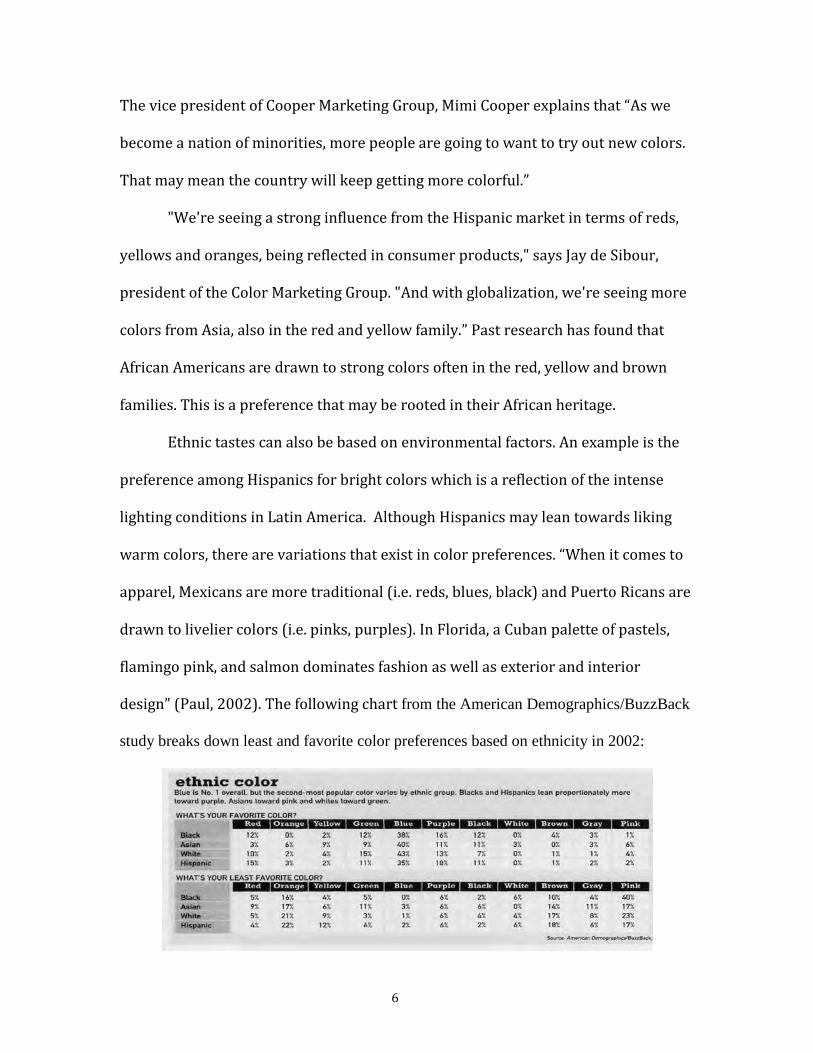
Ethnic tastes can also be based on environmental factors. An example is the
preference among Hispanics for bright colors which is a reflection of the intense
lighting conditions in Latin America. Although Hispanics may lean towards liking
warm colors, there are variations that exist in color preferences. “When it comes to
apparel, Mexicans are more traditional (i.e. reds, blues, black) and Puerto Ricans are
drawn to livelier colors (i.e. pinks, purples). In Florida, a Cuban palette of pastels,
flamingo pink, and salmon dominates fashion as well as exterior and interior
design” (Paul, 2002). The following chart from the American Demographics/BuzzBack
study breaks down least and favorite color preferences based on ethnicity in 2002:

7
METHODS
Hypothesis
The aim of this report is to determine if cultural or ethnic background influences the
preferences of colors. Past research has shown that preferred color choices differ
based on certain ethnic groups. In our increasingly multicultural nation, there
should be differences among the major U.S. cultural groups in terms of their
preferred color choices. Therefore,
H₁: Ethnic groups will be different in terms of their preferences of colors. Color Preferences HS ≠ Color Preferences HE ≠ Color Preferences NHW ≠ Color Preferences AA ≠ Color Preferences Asian Methodology
The data used for this analysis was collected in an online survey sponsored
by Florida State University and American Online (AOL). The survey included
questions regarding consumer behavior and online media habits on a variety of
topics. For this report, we focused on questions about ethnicity, demographical
information, and color preferences as well as determining the importance that
colors play in these consumers’ lives. For the English speaking sample, respondents
were originally sampled via the Opinion Place online river methodology.
Respondents were screened and assigned to surveys in real-time, and were not
considered registered panelists since most did not return to the site for ongoing
survey participation.
For the Spanish-speaking sample, respondents were invited from Tu Opinión
Latina, a bilingual online Hispanic panel. Given the quota requirements for this
8
study, a random sample of respondents was selected based on their demographic
characteristics and invited to participate in this special survey opportunity via a
custom email invitation.
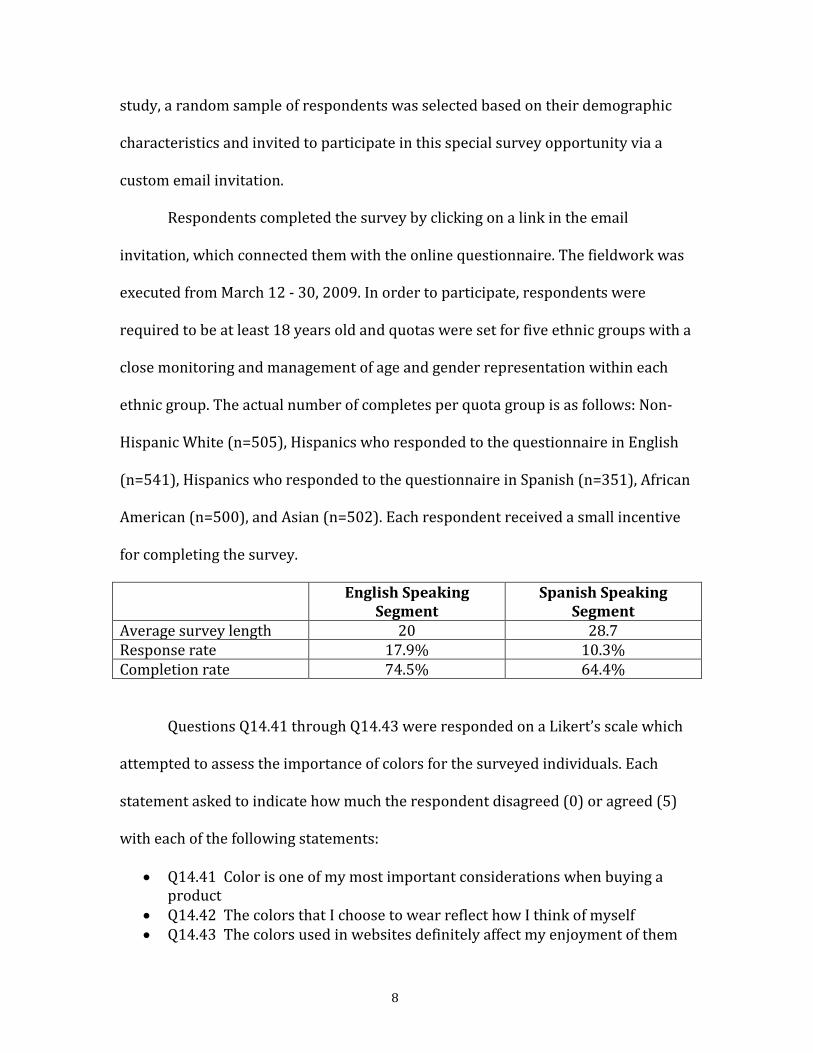
Respondents completed the survey by clicking on a link in the email
invitation, which connected them with the online questionnaire. The fieldwork was
executed from March 12 - 30, 2009. In order to participate, respondents were
required to be at least 18 years old and quotas were set for five ethnic groups with a
close monitoring and management of age and gender representation within each
ethnic group. The actual number of completes per quota group is as follows: Non-
Hispanic White (n=505), Hispanics who responded to the questionnaire in English
(n=541), Hispanics who responded to the questionnaire in Spanish (n=351), African
American (n=500), and Asian (n=502). Each respondent received a small incentive
for completing the survey.
English Speaking Segment
Spanish Speaking Segment
Average survey length 20 28.7 Response rate 17.9% 10.3% Completion rate 74.5% 64.4%
Questions Q14.41 through Q14.43 were responded on a Likert’s scale which
attempted to assess the importance of colors for the surveyed individuals. Each
statement asked to indicate how much the respondent disagreed (0) or agreed (5)
with each of the following statements:
• Q14.41 Color is one of my most important considerations when buying a product
• Q14.42 The colors that I choose to wear reflect how I think of myself • Q14.43 The colors used in websites definitely affect my enjoyment of them

9
Additionally, Questions 18 a through Q18 b were used to test my hypothesis and
also displayed on a Likert’s scale. These were created to help determine which
specific colors were preferred by individuals from varied U.S. multicultural groups
preferred. Each statement asked respondents to rate how much they liked each of
the following thirteen colors from “I hate this color” (0) to “I love this color” (5):
Q18. a. White Q18. b. Black Q18. c. Silver Q18. d. Gold Q18. e. Brown Q18. f. Red Q18. g. Orange Q18. h. Yellow Q18. i. Green Q18. j. Blue Q18. k. Purple Q18. l. Pink Q18. m. Platinum
Using the SPSS computer program, the demographic information produced from the
survey and specific data for the Color Preference variable questions were investigated using
procedures. These included running Frequency Analyses, Compare Means, One-Way ANOVA
tests, and Cross Tabs. A factor analysis was also conducted in order to determine the
commonalities between the color choices for Q.18 a through m and group them according to
the findings.

10
RESULTS
The Importance of Color for U.S. Multicultural Groups
From the five U.S. multicultural groups studied in the survey, based on Q.14 41
through 43, there was a clear indication that color was an especially important factor for
Asians and to a lesser extent for English-Speaking Hispanics. Using the One-Way ANOVA
Duncan procedure, significance was determined at the .05 alpha level for the three
questions among ethnic groups.
Q14.41 asks respondents to rank 1 to 5 how much they agree that “Color is
one of my most important considerations when buying a product.” Using the One-Way
ANOVA- Duncan procedure, you can see from the following chart that Asians ranked
the highest mean for this question with 2.92.
Q14_41 Q14_41. COLOR IS ONE OF MY MOST IMPORTANT CONSIDERATIONS WHEN BUYING A PRODUCT
Please indicate how much you agree or disagree with each of the following statements. (From 0 = completely disagree to 5 = completely agree)
ETHNIC_FIN Final Ethnicity Quotas N
Subset for alpha = 0.05
1 2 3
Duncana 5.00 Hispanic Spanish 335 2.37
1.00 Non Hispanic White 498 2.38
2.00 African American 489 2.59
4.00 Hispanic English 528 2.62
3.00 Asian 496 2.92
Sig. .934 .781 1.000
Means for groups in homogeneous subsets are displayed.
Q14.42 asks respondents to rank 1 to 5 with how much they agree that “The
colors that I choose to wear reflect how I think of myself.” With this question, Asians

11
again held the highest average with a ranking of 3.13 and English-Speaking
Hispanics ranked second with an average of 2.98.
Q14_42 Q14_42. THE COLORS THAT I CHOOSE TO WEAR REFLECT HOW I THINK OF MYSELF Please indicate how much you agree or disagree with each of the following statements. (From 0
= completely disagree to 5 = completely agree)
ETHNIC_FIN Final Ethnicity Quotas N
Subset for alpha = 0.05
1 2 3 4
Duncana 5.00 Hispanic Spanish 333 2.58
1.00 Non Hispanic White 500 2.70 2.70
2.00 African American 487 2.89 2.89
4.00 Hispanic English 528 2.98 2.98
3.00 Asian 494 3.13
Sig. .261 .073 .362 .164
Means for groups in homogeneous subsets are displayed.
Q14.43 has specific implications for brands developing websites and asks
respondents to rank 1 to 5 with how much they agree that “The colors used in
websites definitely affect my enjoyment of them.” With this question, Asians once
again had the highest average with a ranking of 3.07 and Hispanics who
predominantly speak English were ranked second with a mean 2.91.
Q14_43 Q14_43. THE COLORS USED IN WEBSITES DEFINITELY AFFECT MY ENJOYMENT OF THEM Please indicate how much you agree or disagree with each of the following statements. (From 0
= completely disagree to 5 = completely agree)
ETHNIC_FIN Final Ethnicity Quotas N
Subset for alpha = 0.05
1 2 3 4
Duncana 5.00 Hispanic Spanish 351 2.52
1.00 Non Hispanic White 505 2.63 2.63
2.00 African American 500 2.81 2.81
4.00 Hispanic English 541 2.91 2.91

12
3.00 Asian 502 3.07
Sig. .314 .090 .339 .156
Means for groups in homogeneous subsets are displayed.
Multicultural Color Preferences
In order to determine what were the most popular colors among the five
major U.S. ethnic groups, One-Way ANOVA-Duncan tests were conducted to see how
the thirteen colors ranked in popularity. The results showed that black ranked the
overall highest among all the cultural groups, but was liked somewhat less by non-
Hispanic Whites(M=3.81) and slightly more by African-Americans (M=4.30). The
second most popular color chosen was Blue, whose averages were about the same
for all groups (overall M=4.08).
White was the third most popular color. As can be seen from the following
chart, it was slightly more popular among Spanish-speaking Hispanics and Asians.
Q18_1 Q18_1. WHITE How much do you like each of the following colors?
Please rate each on a scale from 0 to 5 where 0 means you hate the color and 5 means you love it.
Duncan
ETHNIC_FIN Final Ethnicity Quotas N
Subset for alpha = .05
1 2
1.00 Non Hispanic White 502 3.31
4.00 Hispanic English 538 3.33
2.00 African American 496 3.38
5.00 Hispanic Spanish 351 3.70
3.00 Asian 497 3.71
Sig. .487 .977
Means for groups in homogeneous subsets are displayed.
13
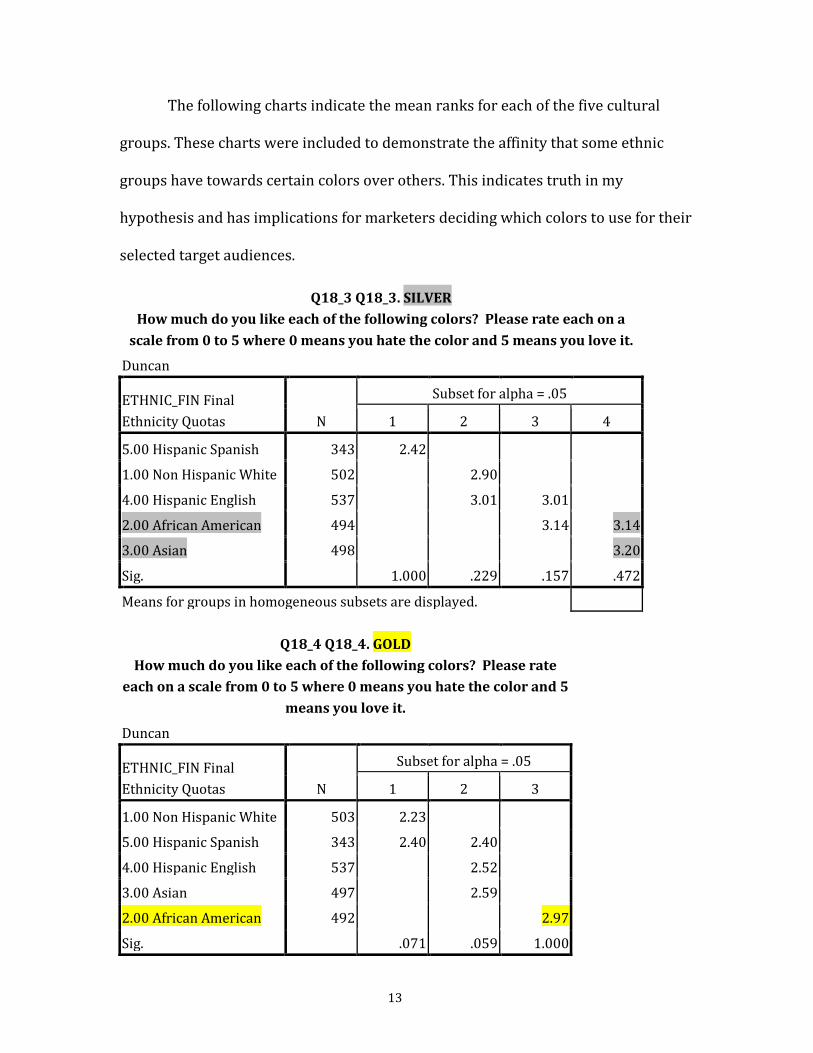
The following charts indicate the mean ranks for each of the five cultural
groups. These charts were included to demonstrate the affinity that some ethnic
groups have towards certain colors over others. This indicates truth in my
hypothesis and has implications for marketers deciding which colors to use for their
selected target audiences.
Q18_3 Q18_3. SILVER How much do you like each of the following colors? Please rate each on a
scale from 0 to 5 where 0 means you hate the color and 5 means you love it.
Duncan
ETHNIC_FIN Final Ethnicity Quotas N
Subset for alpha = .05
1 2 3 4
5.00 Hispanic Spanish 343 2.42
1.00 Non Hispanic White 502 2.90
4.00 Hispanic English 537 3.01 3.01
2.00 African American 494 3.14 3.14
3.00 Asian 498 3.20
Sig. 1.000 .229 .157 .472
Means for groups in homogeneous subsets are displayed.
Q18_4 Q18_4. GOLD How much do you like each of the following colors? Please rate
each on a scale from 0 to 5 where 0 means you hate the color and 5 means you love it.
Duncan
ETHNIC_FIN Final Ethnicity Quotas N
Subset for alpha = .05
1 2 3
1.00 Non Hispanic White 503 2.23
5.00 Hispanic Spanish 343 2.40 2.40
4.00 Hispanic English 537 2.52
3.00 Asian 497 2.59
2.00 African American 492 2.97
Sig. .071 .059 1.000

14
Q18_4 Q18_4. GOLD How much do you like each of the following colors? Please rate
each on a scale from 0 to 5 where 0 means you hate the color and 5 means you love it.
Duncan
ETHNIC_FIN Final Ethnicity Quotas N
Subset for alpha = .05
1 2 3
1.00 Non Hispanic White 503 2.23
5.00 Hispanic Spanish 343 2.40 2.40
4.00 Hispanic English 537 2.52
3.00 Asian 497 2.59
2.00 African American 492 2.97
Sig. .071 .059 1.000
Q18_5 Q18_5. BROWN
How much do you like each of the following colors? Please rate each on a scale from 0 to 5 where 0 means you hate the color and 5
means you love it.
Duncan
ETHNIC_FIN Final Ethnicity Quotas N
Subset for alpha = .05
1 2 3
1.00 Non Hispanic White 503 2.78
3.00 Asian 498 2.95 2.95
4.00 Hispanic English 536 3.09 3.09
5.00 Hispanic Spanish 348 3.13 3.13
2.00 African American 494 3.20
Sig. .058 .058 .259
Means for groups in homogeneous subsets are displayed.

15
Q18_9 Q18_9. GREEN How much do you like each of the following colors?
Please rate each on a scale from 0 to 5 where 0 means you hate the color and 5 means you love it.
Duncan
ETHNIC_FIN Final Ethnicity Quotas N
Subset for alpha = .05
1 2
5.00 Hispanic Spanish 348 3.05
4.00 Hispanic English 537 3.16 3.16
2.00 African American 496 3.17 3.17
3.00 Asian 498 3.25
1.00 Non Hispanic White 503 3.32
Sig. .246 .096
Means for groups in homogeneous subsets are displayed.
Q18_6 Q18_6. RED How much do you like each of the following colors?
Please rate each on a scale from 0 to 5 where 0 means you hate the color and 5 means you love it.
Duncan
ETHNIC_FIN Final Ethnicity Quotas N
Subset for alpha = .05
1 2
3.00 Asian 499 3.30
1.00 Non Hispanic White 503 3.41 3.41
5.00 Hispanic Spanish 348 3.43 3.43
2.00 African American 495 3.51
4.00 Hispanic English 536 3.53
Sig. .171 .236
Means for groups in homogeneous subsets are displayed.

16
Q18_13 Q18_13. PLATINUM How much do you like each of the following colors? Please rate
each on a scale from 0 to 5 where 0 means you hate the color and 5 means you love it.
Duncan
ETHNIC_FIN Final Ethnicity Quotas N
Subset for alpha = .05
1 2 3
5.00 Hispanic Spanish 340 2.16
1.00 Non Hispanic White 499 2.62
4.00 Hispanic English 531 2.66
2.00 African American 480 2.73
3.00 Asian 495 2.97
Sig. 1.000 .266 1.000
Means for groups in homogeneous subsets are displayed.
Q18_11 Q18_11. PURPLE How much do you like each of the following colors? Please rate
each on a scale from 0 to 5 where 0 means you hate the color and 5 means you love it.
Duncan
ETHNIC_FIN Final Ethnicity Quotas N
Subset for alpha = .05
1 2 3
5.00 Hispanic Spanish 343 2.65
3.00 Asian 498 2.88
4.00 Hispanic English 537 2.94 2.94
1.00 Non Hispanic White 503 3.09
2.00 African American 494 3.11
Sig. 1.000 .586 .112
Means for groups in homogeneous subsets are displayed.
17
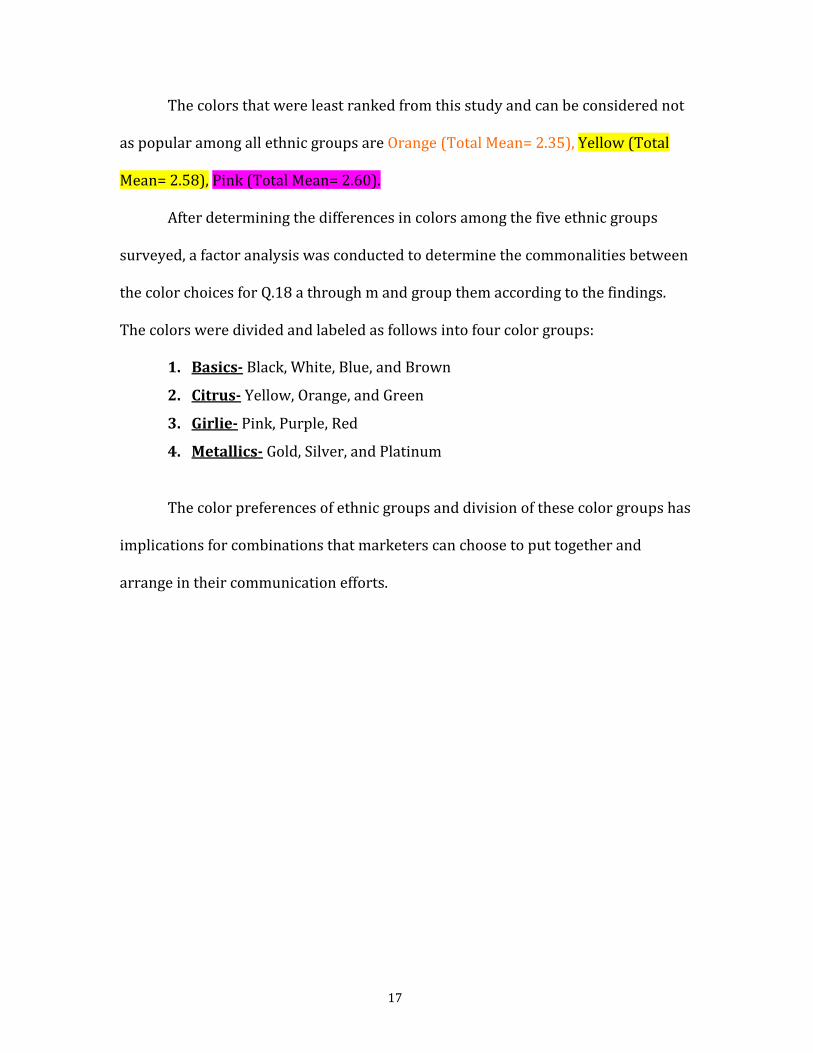
The colors that were least ranked from this study and can be considered not
as popular among all ethnic groups are Orange (Total Mean= 2.35), Yellow (Total
Mean= 2.58), Pink (Total Mean= 2.60).
After determining the differences in colors among the five ethnic groups
surveyed, a factor analysis was conducted to determine the commonalities between
the color choices for Q.18 a through m and group them according to the findings.
The colors were divided and labeled as follows into four color groups:
1. Basics- Black, White, Blue, and Brown
2. Citrus- Yellow, Orange, and Green
3. Girlie- Pink, Purple, Red
4. Metallics- Gold, Silver, and Platinum
The color preferences of ethnic groups and division of these color groups has
implications for combinations that marketers can choose to put together and
arrange in their communication efforts.
18
DISCUSSION
Beyond the cultural associations of color, it is also important to take
demographic differences into account when selecting a brand's colors because
different hues may not be perceived the same by various ages, genders and ethnic
groups. An issue related to my study is “the elasticity of meaning associated with
certain chunks of the color spectrum” (Sturgess, 2008). For example, green is
almost universally regarded a color of youth, vitality and nature.
The data from this study indicates that it is important for marketers to
consider color preferences of target audience consumers. Color choices do vary
demographically so determining the color preferences of targeted consumers can be
very useful in marketing and product positioning. The information from studies of
multicultural color preferences can also be used to create decorating schemes (in
product designs, marketing messages, websites, etc.) that enhance the pleasurable
effects of colors for selected target audiences.
RECOMMENDATIONS
Intuitive marketers should realize the potential that color choices have to
create brand imagery and even to convey moods. With the current downturn of our
economy and particularly the negative effects on car companies, data on color
preferences is especially pertinent. Automotive marketing people must make
business decisions every year about which colors to add and which colors to drop.
(Triplett, 1995). Conducting studies of their target audience members’ color
19
preferences will help them determine which color catalogue to keep for their car
models. Color choices are also important for retail and other product industries.
It is no accident that Tiffany’s “little blue box” and other colors
representative of a brand are often trademarked. This is because color can take on
cultural symbolism and ramifications for a brand. Eco-awareness is a perfect
example of an entire consumer category that has given the color green a new
relevance to markets, categories, and brands (Sturgess, 2008).
Ironically, “in the catalog of a brand’s sensory equities, color is often one of
the most overlooked, underleveraged assets.” This implies that some brands are
missing out! “Opportunities for significant growth come from exploring under
appreciated (or downright ignored) adjacencies”(Sturgess, 2008). By anchoring a
brand’s equities (specifically color), product packaging will be able to interact with
consumers in new ways and is more likely to catch their attention while shopping.
Color choices and combinations are also important brand communicators for
marketers developing other critical components such as their logos and websites.

20
BIBLIOGRAPHY Lange, Rense and Rentfrow, Jason. (2007). “Color and Personality: Strong's Interest
Inventory and Cattell's 16PF.” North American Journal of
Psychology, 9(3), 423-437. Retrieved April 1, 2009, from ABI/INFORM
Global database. (Document ID: 1398057091).
Hayden, Nancy C. (2008, September). “Do Cultural Preferences Influence Fragrance
Development?” Global Cosmetic Industry, v. 176, no. 9. Retrieved April 1,
2009, from ABI/INFORM Global database.
Hewett, Kelly, Madden, Thomas J., and Roth, Martin S. (2000). “Managing images in
different cultures: A cross-national study of color meanings and
preferences.” Journal of International Marketing, 8(4), 90-107. Retrieved
April 1, 2009, from ABI/INFORM Global database. (Document ID: 66520003).
Paul, Pamela. (2002, February). “Color by numbers.” American
Demographics, 24(2), 30-53. Retrieved April 1, 2009, from ABI/INFORM
Global database. (Document ID: 105776697).
Projected Changes In Consumer Color Preferences. (2003, November). Textile
World, 153(11), 32. Retrieved April 1, 2009, from ABI/INFORM
Global database. (Document ID: 735680231).
Silayoi, Pinya and Speece, Mark. (2007). “The importance of packaging attributes: a
conjoint analysis approach.” European Journal of
Marketing, 41(11/12), 1495-1517. Retrieved April 1, 2009, from
ABI/INFORM Global database. (Document ID: 1373507031).
21
Stein, Shifra. (2006, May). “COMMUNICATING with Color.” Women in
Business, 58(3), 1415. Retrieved April 1, 2009, from ABI/INFORM
Global database. (Document ID: 1040504661).
Sturgess, Donna J. (2008, August). “Top of Mind: A Spectrum of Missed
Opportunity.” Brandweek, 49(29), 15. Retrieved April 1, 2009, from
ABI/INFORM Global database. (Document ID: 1540560121).
Trent, Linda. (2000, August). “Generations of color.” Buildings, 94(8), 16. Retrieved
April 1, 2009, from ABI/INFORM Global database. (Document ID: 59216123).
Triplett, Tim. (1995, August). “Research probes how consumers rely on color for
their purchases.” Marketing News, 29(18), 1. Retrieved April 1, 2009, from
ABI/INFORM Global database. (Document ID: 6811571).