STUDY OF MECHANISM WHICH CAUSES FILM FORMATION ON …
79
NASA CR 120884 STUDY OF MECHANISM WHICH CAUSES FILM FORMATION ON MERCURY SURFACES by Geoffrey Frohnsdorff and Diane Dunn THE GILLETTE COMPANY RESEARCH INSTITUTE prepared for National Aeronautics and Space Administration CONTRACT NAS3-14363 NASA Lewis Research Center Cleveland, Ohio 44135 Eugene P. Symons, Project Manager Chemical Propulsion Division
Transcript of STUDY OF MECHANISM WHICH CAUSES FILM FORMATION ON …

NASA CR 120884
STUDY OF MECHANISM WHICH CAUSES
FILM FORMATION ON MERCURY SURFACES
by
Geoffrey Frohnsdorff and Diane Dunn
THE GILLETTE COMPANY RESEARCH INSTITUTE
prepared for
National Aeronautics and Space Administration
CONTRACT NAS3-14363
NASA Lewis Research CenterCleveland, Ohio 44135
Eugene P. Symons, Project ManagerChemical Propulsion Division

1. Report No.
NASA CR- 120884
4. Title and Subtitle
STUDY OF MECHANISM WHICH CAUSESON MERCURY SURFACES
2. Government Accession No.
FILM FORMATION
7. Author(s)
Geoffrey Frohnsdorff and Diane Dunn
9. Performing Organization Name and Address
The Gillette Company Research Institute1413 Research BoulevardRockville, Maryland 20850
12. Sponsoring Agency Name and Address
National Aeronautics and Space AdministrationWashington, D. C. 20546
3. Recipient's Catalog No.
5. Report DateMarch 1972
6. Performing Organization Code
8. Performing Organization Report No.
10. Work Unit No.
11. Contract or Grant No.
NAS 3-14363
13. Type of Report and Period Covered
Contractor Report
14. Sponsoring Agency Code
15. Supplementary Notes
Project Manager, E. P. Symons, Chemical Propulsion DivisionNASA Lewis Research Center, Cleveland, Ohio
16. Abstract
The purpose of the program was to determine the mechanism by which small quantities ofdissolved tin, sodium and lithium lower the rate of evaporation of mercury in vacuum. Anapparatus was built in which dilute amalgams could be prepared and studied in an oxygen-freeenvironment before being exposed to oxygen under controlled conditions. The apparatus wasable to maintain a pressure of less than 1.3 x 10~6 N/m2 (10~8 torr) of gases and vaporsother than mercury and less than 1.3 x 10"8 N/m2 (lO"-10 torr) partial pressure of oxygen;also, it provided for mechanical sweeping of the liquid metal surfaces in the vacuum environ-ment. The rates of evaporation of pure mercury and of dilute amalgams of tin (52 ppm), sodium(229 ppm) and lithium (165 ppm) were determined at temperatures between 25° and 55°C bothbefore and after 70 minute exposures to an approximately 270 N/m2 (2 torr) pressure of oxygen.The rates of evaporation of the pure mercury and the amalgams as first prepared were similarbut the rates for the amalgams were reduced by at least 80% at 25°C as a result of theexposure to oxygen. The effect of the oxygen treatment could be completely removed by sweep-ing the amalgam surfaces. It was concluded that the reduced rates of evaporation resultedfrom the formation of transparent, insoluble, oxide films on the amalgam surfaces.
17. Key Words (Suggested by Author(s) )
mercuryamalgamsevaporationoxygen
19. Security Classif. (of this report)
Unclassified
18. Distribution Statement
Unclassified - Unlimited
20. Security Classif . (of this page) 21. No. of Pages 22. Price*
Unclassified 74 $3.00
: For sale by the National Technical Information Service, Springfield, Virginia 22151
NASA-C-168 (Rev. 6-71)

TABLE OF CONTENTS
Page
SUMMARY
INTRODUCTION 1
LIST OF SYMBOLS 2
BACKGROUND INFORMATION 4
CONSTRUCTION, CHECK-OUT AND METHOD OF USE OF THE EQUIPMENT FOR THEEVAPORATION MEASUREMENTS 7
The Design and Components of the Equipment 7Initial Check-out of the Equipment 9Characteristics and Uses of the Pressure Gauges 9Measurement of Vapor Pressures and Evaporation Rates 10Temperature Control and Measurement 12
MEASUREMENTS ON PURE MERCURY 14
MEASUREMENTS ON AMALGAMS 17
1. Tin Amalgam 182. Sodium Amalgam 203. Lithium Amalgam 234. Final Measurements on Mercury 26
GENERAL DISCUSSION 27
Relative Evaporation Rates 27Absolute Evaporation Rates in the Evaporation Chamber and in
Free Space 29
CONCLUDING REMARKS 32
SUMMARY OF RESULTS 33
REFERENCES 35
TABLES 1 - 1 1
FIGURES 1 - 1 7

TABLE OF CONTENTS (Concluded)
Page
APPENDIX I - Surface Excess Concentrations of Alkali Metalsin Amalgams
APPENDIX II - Materials
APPENDIX III - Calculation of the Meniscus Surface Area andVolume from the Meniscus Weight
APPENDIX IV - Temperature Corrections
APPENDIX V - Analysis of Amalgams
APPENDIX VI - The Effective Pressure above the Meniscus in theEvaporation Experiments
DISTRIBUTION LIST

SUMMARY
This report describes a program aimed at establishing the mechanism bywhich small quantities of dissolved impurities, specifically tin, sodium andlithium, lower the rates of evaporation of mercury in vacuum. At the start ofthe program, an ultra-high vacuum system with the special features neededfor evaporation rate measurements was built. It was designed so that puremercury and dilute amalgams could be prepared and studied in an oxygen-freeenvironment (<1.3x 10~° N/m^ partial pressure of 62) before being exposedto oxygen under controlled conditions. A feature of the equipment was thatthe liquid surface in the vacuum system could be cleaned by mechanical sweep-ing. The apparatus was used for evaporation rate measurements on pure mercuryand three amalgams. The amalgams contained, respectively, 52 ppm tin, 229 ppmsodium, and 165 ppm lithium.
For each of pure mercury and the amalgams, evaporation rate measurementswere made at 25°, 40° and 55°C on the liquids (i) as first prepared, (ii)after sweeping of the surface, (iii) after exposure to oxygen, and (iv) aftersweeping the surface again.
The results showed that the rates of evaporation of pure mercury and ofthe three amalgams were the same within the approximately 15% limits ofexperimental error over the 25° to 55° temperature range. They also showedthat exposure to an approximately 270 N/m^ pressure of oxygen for 70 minutesreduced the rates of evaporation of the amalgams at 25°C by at least 80%but it had no effect upon the pure mercury. The lowered rates of evapora-tion, at least for the sodium and lithium amalgams, were due to the forma-tion of thin, transparent, insoluble, films which only became visiblewhen they buckled as the surface area of the liquid was reduced. Further,the films on the amalgam surfaces could be removed and the evaporationrates restored to their original values by sweeping the surfaces.
While most of the results were comparative, one set of absolute measure-ments of the rates of evaporation of the sodium amalgam was made volumetri-cally. By combining the results of these absolute measurements with therelative ones, it was possible to deduce the rates of evaporation of each ofthe amalgams and pure mercury in free space. The values for pure mercurywere (in g.cm'2.sec'1), 1.0 x 10~4 at 25°C, 3.0 x 10~4 at 40°C, and 8.5 x10'4 at 55°C.
The rates of evaporation of the oxygen-free amalgams were the same asfor the mercury within the experimental error and it was concluded that thevapor pressures of the amalgams and the mercury were also the same withinthe experimental error.

INTRODUCTION
Mercury is a candidate liquid metal for use in some components of spacevehicles. In particular, it is being considered for use in sliding contactsconnecting the solar cells to the other electrical components of the directbroadcast television satellite being studied by NASA. A major limitationon the usefulness of pure mercury for this application is its undesirablyhigh rate of evaporation under the hard vacuum conditions of outer space.
In studies carried out for NASA at The Gillette Company ResearchInstitute between 1968 and 1970 (1,2), it was shown that low concentrationsof soluble metallic impurities in mercury can cause films to form on themercury surface which will lower the rate of evaporation in vacuo by morethan 99%. Among the metals which produced at least a 99% reduction in theevaporation rate of mercury, when present at about 200 ppm by weight, weretin, lithium and sodium. However, the earlier work did not establish themechanism responsible for the lowered rates of evaporation and it wastherefore not certain whether the mecahnism would be operative in outerspace even though it was in a laboratory apparatus capable of achieving avacuum of 10~3 to 10" N/m^. The possible mechanisms were considered to be:(i) formation of a Gibbsian adsorbed layer of a soluble species, whethermetal, intermetallic compound, or oxide; and (ii) formation of a surfacelayer of an insoluble compound, e.g. an insoluble oxide. (The possibilityof occurrence of oxides could not be ruled out because of the difficulty ofobtaining the metals in perfectly clean form and because of the probableoccurrence in the vacuum system of at least enough oxygen to form a mono-layer of oxide on the amalgam surfaces.)
The first of the two types of mechanism would have the advantage thatthe surface layer would be inherently self-healing if disturbed. Thesecond would probably only be self-healing if oxygen, or some other oxidiz-ing agent, were present to cause the formation of more insoluble materialto replace any which was displaced from the surface. Either mechanism couldbe useful in spacecraft applications, but it is necessary to know themechanism if the optimum design is to be achieved. It is, of course,possible that different metals lower the rate of evaporation of mercury bydifferent mechanisms.
The purpose of the work described in the present report was to deter-mine the mechanism which causes the formation of a film on the surface ofliquid mercury to which trace amounts of tin, lithium and sodium have beenadded. A more specific objective was to determine if the mechanism whichcauses the film formation would permit the regeneration of a new filmshould the original film be disrupted in the absence of oxygen.
The report is divided into five main sections. The first, the intro-duction, includes a list of symbols and background information pertinent tothe later parts. This is followed by a description of the apparatus usedand by two sections devoted to the measurements, one on pure mercury andone on the amalgams. Finally, there is a general discussion in which allof the results are reviewed and interpreted.
- 1 -

LIST OF SYMBOLS
2A area of meniscus or orifice (cm )
C? concentration of solute (moles/1.)
F conductance of tube (cm .sec )
-2 -1G rate of evaporation per unit area (g.cm .sec )
-2 -1G rate of capture of molecules per unit area (g.cm .sec )Cclp
G rate of evaporation per unit area (as measured in the evaporationchamber) (g.cm .sec"*)
-2 -1G rate of escape of molecules per unit area (g.cm .sec )c S G
-2 -1Gf rate of evaporation per unit area in free space (g.cm .sec )
K constant in equation for calculation of F
M gram molecular weight (g.mole )
2 2P pressure (newton/m or torr; 1 torr =• 133.5 N/m )
2P pressure at level at which condensation occurs (N/m )c
P. pressure indicated by the ionization gauge (torr)
2P saturation vapor pressure (N/m )sat
Q rate of flow of mercury vapor (g.sec )
R the gas constant (joule.deg .mole )
R rate of evaporation from the total area of the meniscus (g.sec )
T temperature (°C or °K)
T wall temperature at level at which condensation occurs (°C)C
T meniscus temperature (°C)m
T wall temperature (°C)w
3V meniscus volume (cm )
V average velocity of gas molecule (cm.sec )di
d diameter of evaporation chamber (cm)
- 2 -

h meniscus height (cm)o
v volume evaporated (cm or
t time (duration of experiment) (sec)
x distance between meniscus and level at which condensation occurs (cm)
_2F surface excess concentration (moles.cm )
AT temperature difference (°C)
Y surface tension (dynes.cm" )
- 3 -

BACKGROUND INFORMATION
The net rate of evaporation of a liquid is the difference between therates at which molecules leave and enter the surface, to and from the vaporphase. The rate at which molecules leave the surface is governed by thearea of the liquid-vapor surface, the heat of vaporization and the kineticenergy distribution of the molecules in the liquid. The heat of vaporiza-tion is governed by the intermolecular forces between the molecules in theliquid and the kinetic energy is governed by the temperature. It isgenerally believed that evaporation of a molecule from a condensed phaseproceeds by two more or less distinct steps: (i) migration from the bulkinto the surface and (ii) escape from the surface. If this is so, then thecomposition of the surface layer should be an important factor in governingthe rate of escape.
The rate at which molecules of a pure liquid enter the surface fromthe pure vapor phase is generally the same as, or very close to, the rateat which they hit the surface. This must be true for pure mercury in thetemperature range of interest here since its accomodation coefficient hasbeen shown to be unity from -30° to 60°C (3). The rate of capture, Gcap,by the surface can be calculated from the kinetic theory of gases and maybe shown to be (4):
-4 /M\ -2 -1G = 4.410-10 'P- 7F §-cm -sec (Dcap \T/
2where P is the pressure in N/m , M the molecular mass in grams, and T theabsolute temperature in degrees Kelvin. This is an important relationshipsince, at the saturation pressure, the rates of escape from and capture bythe surface must be equal. Thus, the rate of escape, Gesc, which isgenerally believed not to change significantly with the pressure of thevapor (4), can be written:
j,
G = 4.410-10~4-P -( Y g.cm"2.sec"1 (2)esc sat \T/
2where Psat is the saturation vapor pressure (in N/m ) at T°K, and the netrate of evaporation can be expressed:
\.
G = G -G = 4. 4lO'10"4-(p -PVO;)2 g. cm"2, sec"1 (3)esc cap \ sat / \T/
The quantity Gesc in equation (2) defines the rate of evaporation which canbe achieved from the surface of a pure liquid in free space, while G inequation (3) expresses the net rates of evaporation at finite pressures ofthe vapor. Gesc is the quantity which is of greatest interest from thepoint of view of the present investigation though it is G that is measureddirectly.
Applying equation (2) to the evaporation of mercury at 25°C (298°K),knowing its saturation vapor pressure at this temperature to be2.76 x 10 N/m (5) it may be calculated that the rate of evaporation infree space should be 1.0 x 10" g.cm'^.sec" .
- 4 -

Whereas equations (2) and (3) can be applied to the cases of pureliquids and solids, they cannot always be applied to surfaces covered byfilms of surface active materials. Thus, it is well known that the rate ofevaporation of water can be significantly reduced by monolayers of some highhigh molecular weight fatty acids and alcohols (6), even though the vaporpressure of the water is not changed. The explanation is that the filmlowers the rates of escape and capture equally by the introduction of abarrier of low permeability between the liquid and vapor.
While some surface films act as barriers to evaporation, not all do so.Examples of monolayers which do not measurably retard the evaporation ofwater from aqueous media are protein layers on water (7) and layers ofn-octadecylamine on 0.01N sulfuric acid solution (8). The effectiveness oflayers in retarding evaporation of water depends upon the closeness of pack-ing of the molecules in the surface layer and upon the length of the hydro-carbon chains in the molecules. The effectiveness is high for long chainnormal saturated fatty acids but it is lowered by the replacement ofhydrogen atoms in the alkyl group by halogen atoms or other groups such ashydroxyl which hinder the closest packing. Small quantities of impuritiesin the retarding material can also reduce its effect.
The effect of solutes upon evaporation of the solvent is usuallyconsidered to be due to their effects on the solvent vapor pressure. Forsolutions which approximate to ideality, the vapor pressure lowering can becalculated from Raoult's law (9), i.e. the lowering is directly proportionalto the reduction in mole fraction of the solvent. However, many amalgams,particularly those of the alkali metals, show large negative deviations fromRaoult's law with the mercury vapor pressures over concentrated amalgamsbeing far below the predicted values. Thus, Poindexter (10) calculated thevapor pressure of mercury over a 50% mole fraction sodium amalgam at 20°Cto be 4 x 10" N/m^ whereas,~if the solution were ideal, the pressure shouldhave been about 9 x 10" N/m . For dilute amalgams (e.g. < 1% of solute),the vapor pressures of mercury above them do not differ much from the valuespredicted by Raoult's law (11,12). Thus, any large reduction in the rate ofevaporation of a dilute amalgam cannot be attributed to the reduced vaporpressure.
The alkali metals are strongly surface active in solution in mercurybut tin is less so. A comprehensive review of the effects of dissolvedmetals on the surface tension of mercury has been given by Semenchenko (13).It has not been established whether the high surface excess concentrationsof the alkali metals have a marked effect on the rate of evaporation. Sur-face excess concentrations calculated from the Gibbs equation show that theaccumulation of alkali metals in the surface regions even of dilute amalgamscould be sufficient to produce a quite high concentration of alkali metalatoms if they were localized in the surface (see Appendix I). Independentevidence for the occurrence of high concentrations of alkali metal atoms(or ions) in dilute amalgams was obtained by Pohl and Pringsheim (14) whoshowed that the surface of a 2 x 10" atom % (0.4 ppm by weight) potassiumamalgam had the photo-emission characteristics of pure potassium. If the
- 5 -

surface layer of a dilute amalgam contains a high proportion of adsorbedatoms or ions, it seems possible that this could reduce the rate of evapora-tion of mercury to below that predicted from the vapor pressure andequations (2) and (3).
Whereas surface composition in terms of soluble surface active speciesmight possibly affect evaporation rates of amalgams, it is also possiblethat insoluble layers such as oxides on the surface might do so. The oxida-tion of metals has been studied intensively over many years, particularlyin connection with corrosion. Most metals spontaneously form oxide or othercoatings on exposure to air at ambient temperature, the coatings oftenbeing very thin but sufficiently dense to almost completely inhibit furtherreaction (15). Such coatings appear to be barriers to the migration ofoxygen or other reactive species to the metal surface. Pure mercury is oneof the relatively few metals which does not appear to form an oxide coatingwhen exposed to air at ambient temperature (3,15). However, it is wellknown that mercury containing dissolved metallic impurities often showssigns of reaction with the atmosphere by the formation of a scum (1,16).In a study relevant to the present report, Feldmann (17) showed that sodiumamalgam reacted with oxygen at ambient temperature and 10 atmospherespressure to give a quantitative yield of sodium peroxide. Presumably suchan oxide, if formed as a dense coating over an amalgam surface, could reducethe rate of evaporation.
In studies of surface films on liquids, it is important to be able toachieve clean surfaces on the liquids to provide points of reference againstwhich to assess the effects of the films. A well-established technique forthe removal of insoluble surface layers without removing the liquid itselfis to sweep the surface with a barrier which penetrates the surface overits whole width (6). Another technique which has been shown to be effectivein preparing clean surfaces of mercury for gas adsorption studies is tocause the overflow of the mercury from its container so as to carry surfacecontamination with the overflow (18). Both of these techniques haveinfluenced the method of cleaning used in the present work.
The quantitative intercomparison of low pressures of vapor was arequirement for the program described in this report. A method which isfrequently used in the continuous monitoring of a system without signifi-cantly perturbing its state is to leak vapor from it through a smallorifice to a sensitive quantitative gas detector such as an ionizationgauge or mass spectrometer. If the pressures on both sides of the orificeare in the molecular flow range, and if the geometry and pumping charac-teristics of the downstream portion of the system are held constant, thepressure at the gauge is proportional to the pressure on the up-stream sideof the orifice (19) . Such systems have been used for determination of theheat of vaporization of materials of low volatility by determination of thetemperature variation of vapor pressure and application of the Clausius-Clapeyron equation to the data. In the present work, determination of theheat of vaporation of mercury was used as a check on the internal consis-tency of the measurements and the method of treatment of the data. Valuesfor the heats of vaporization and other characteristic properties of mercury,tin, sodium and lithium are given in Table 1.
- 6 -

CONSTRUCTION, CHECK-OUT AND METHOD OF USE OF THE EQUIPMENTFOR THE EVAPORATION MEASUREMENTS
The Design and Components of the Equipment
The purposes of the equipment were to:
(i) prepare oxygen-free pure mercury and amalgams of known concentration;
(ii) determine the relative vapor pressures of pure mercury and of theamalgams at 25°C;
(iii) determine the rates of evaporation from as-prepared and cleanedsurfaces of the amalgams and pure mercury at 25, 40 and 55°C, both beforeand after exposure to a finite pressure of oxygen. The exact sequence ofoperations to be carried out was mentioned in the Introduction and will bedescribed in more detail in the later sections of this report.
Specific performance requirements of the equipment were that is shouldbe capable of maintaining within it a pressure less than 1.3 x 10" N/m^(10~° torr) of gases and vapors other than mercury. The pumping and pres-sure measuring system was purchased as a complete unit built up from standardstainless steel ultra-high vacuum components but with modifications, wherenecessary, to ensure satisfactory performance in the presence of theexpected pressures of mercury vapor. The remainder of the system was con-structed almost entirely of borosilicate glass. A photograph of the systemprior to the first measurements is shown in Figure 1.
The pumping and pressure measuring system is shown schematically inFigure 2. It consisted of a 3.8 cm i.d. manifold built up from standardflanged stainless steel fittings using corner-sealed copper gaskets.Connected into the manifold for pressure measurements and system monitoringwere a Bayard-Alpert type ionization gauge tube with a thoria-coated iridiumfilament, and also a low resolution mass spectrometer (residual gas analyzer).Of six stainless steel, bellows-sealed valves providing access to the mani-fold, valves 1, 2 and 4 were connected, through stainless steel bellows, tothe glass portion of the system, while valve 3 could be used to isolate thepressure gauges while pumping through valve 6 or opening the system to theair or to an oxygen supply through valve 5. The flanges on the manifoldside or valves 1 and 2 carried special nickel-plated copper disks whichserved as gaskets but also, through small holes bored at their centers, asleaks to the gauges.
The pumps were a 50 1/s ion pump and a sorption pump. All of the pump-ing and pressure measuring system, apart from the sorption pump and thevalves to it, was mounted in a specially constructed, electrically-heated,furnace with demountable sides so that it could be baked at temperatures upto 250°C. The furnace was constructed from a 3.8 cm angle iron frame withsides, top and bottom of 1.3 cm or 2.5 cm thick asbestos-cement board insu-lated with 2.5 cm of glass wool covered with another, thinner layer of

asbestos-cement board. Seven 76 cm long, 1 KW, strip heaters were mountedwith three equally spaced in parallel array 2.5 cm above the furnace bottomand with one along each side at a height of 7.5 cm from the bottom. Controlof the heaters was provided by a temperature indicating controller and, asa fail-safe protection against overheating, an override control was providedby a bimetallic strip controller.
The glass portion of the system was mounted on a grid attached to thetop of the furnace for the pumping and pressure measuring system. It wasmodified from time to time as the needs of the work dictated. Its originalconfiguration for the first measurements on pure mercury was as in Figure 3,except that the flange joint carrying the boat for evaporation of the metalfor amalgamation was replaced by a glass cap since the first experiment wasto be with pure mercury. Like the metal portion of the system, the glass-ware could be baked out at temperatures of at least 250°C by enclosing it ina specially built demountable furnace of similar construction to that forthe metal part.
The features of the glass apparatus can be conveniently described byreviewing how it was used. After leak testing and baking out, the portionof the system above and to the left of break seal BSl was under vacuum readyfor the start of an experiment. Then pure mercury was poured into flask Fl,capacity 250 cc, through the side arm which was then connected, through aliquid nitrogen trap, to an auxiliary high vacuum system. The mercury in Flwas then refluxed under vacuum for about one hour in order to degas it andthe walls of the flask. The thick-walled glass tubing at Si was then sealedoff with a flame and the mercury was allowed to cool. Next, seal BSl wasopened by use of the magnetic hammer MHl and the bulk of the mercury wasdistilled from flask Fl into the similar flask F2. Seal S2 was then closedoff with a flame to leave the redistilled mercury in F2 and to isolate thesystem from Fl which was no longer needed. At this point, in two of theamalgam experiments, the metal in the tantalum boat in the 1 liter flask F3was evaporated by electrical heating using heavy copper leads through theflange joint, J. When it was judged that enough metal had been depositedon the walls of F3, the evaporation was stopped and mercury from F2 wasdistilled into F3 to dissolve some of the evaporated metal and to overflowinto the reservoir R formed by the lower end of the sloping tube Tl. Thedissolution of the metal in F3 could be assisted by stirring with themagnetic stirrer bar MSl, or by using the bar to remove metal from theotherwise untouched steeper regions of the walls by scraping or by raisingdrops of mercury to its level to amalgamate with it. Periodically, thedistillation of mercury through F3 and into R was stopped and a sample ofthe amalgam in R was removed for analysis. The sample was taken by usingthe magnetic scoop MS2 first to stir the amalgam in R, then to transferabout 1 cc to the lowest of the capsules A. The capsule was sealed off witha flame so that the sample could be removed without breaking the vacuum. Onthe basis of the analytical results, it was then decided whether to washmore-of the trace metal from F3, to dilute the amalgam in R by direct dis-tillation of mercury into R after closing off seal S3, or to use the amalgamwithout further change.
- 8 -

When the amalgam in R was judged ready for use in the evaporationexperiments, scoop MS2 was used to transfer the amalgam to the tube T2 untilthe level just reached the ground horizontal surface of the precision borecapillary C. The height of the meniscus in C was then adjusted so as toproject above C for 1 to 2 mm by movement of the magnetic plunger MS3. Themagnetically-operated ball joint valve Bl was closed and the vapor pressureor the rate of evaporation of the amalgam from the meniscus was then deter-mined. For the evaporation measurements, the lower end of the wide boreevaporation tube T3 was surrounded by liquid nitrogen to trap the mercurywhich evaporated from the meniscus. The trap served the dual purpose ofmaintaining a high rate of pumping for the mercury vapor and allowing theevaporation tube to be pumped out continuously during the experiments whileprotecting the ion pump and the gauges from mercury vapor.
Initial Check-out of the Equipment
When the equipment had been assembled, it was tested for its abilityto meet the requirements of the project. It was baked out for 24 hours at250°C. After the system had cooled, the ultimate vacuum recorded by theion pump was 2.7 x 10"? N/m^ and that recorded by the ionization gauge was2.1 x 10~" N/m . The residual gas analyzer gave the following indicationsof the partial pressure (N/m ) of the gases remaining in the system:N2, 0.9 x 10'
7; A, 0.3 x 10'7- Ne, 0.5 x 10'7; He, 1.3 x 10'7; H20, 1.5 x10"7; C02<10'8; H2> 1.2 x 10~7; 02, not detectable (< 10 ~8). These pressureswere calculated from the gauge readings and the calibration factors providedby the manufacturers. When summed, they indicated a total pressure of5.7 x 10~7 N/m^. This was only about one-third of the ionization gaugereading. (Subsequent calculations made to correct the ionization gaugereading for a gas mixture in the ratios indicated by the mass spectrometersuggested that the total pressure was 3.8 x 10" N/m^.)
The leak rate on the glass portion of the system was determined bymeasuring the pressure build-up in it when closed off from the pump forseveral hours. The leak rate was calculated to be 7 x 10"*•-> moles -sec .The gas detected by the mass spectrometer was predominantly nitrogen.Assuming that the pressure build-up represented a real leak of air and thatthe amount of oxygen which had entered the system was 25% of the quantityof nitrogen, it was calculated that it would take 8 days for enough oxygento enter the system to form a single close packed layer of oxygen moleculeson 1 sq cm area of surface. From these considerations, it was concludedthat the system was satisfactory for the measurements on pure mercury.
Characteristics and Uses of the Pressure Gauges
According to the manufacturer, the ionization gauge had a sensitivityof 750p.A per N/m^ for nitrogen and had a working range from 1.3 x 10"° to2.7 x 10"* N/m . The manufacturer's accumulated experience on ionizationgauge performance suggests that the sensitivity seldom changes by more than20% over the life of a gauge (20). In order to obtain reproducible results,the gauge filament was always turned on for at least an hour before critical
- 9 -

measurements were to be taken and the gauge was degassed for ten minutesprior to the measurements. The gauge zero and the filament current werechecked periodically. Evidence to be mentioned in the Discussion sectionsuggests that the gauge sensitivity fell by about 40% during the course ofthe study.
The mass spectrometer was a 1 cm radius, 180° magnetic deflectioninstrument. Two main ranges of mass numbers could be scanned with it.These were 12 to 60 and 48 to 240. The manufacturers stated the minimumdetectable partial pressure for nitrogen to be 4 x 10" N/m2 and theresolving power (10% valley definition) to be 44. Additional switch posi-tions made possible the detection of masses 2, 3 and 4, but without scanning.The filament, which was rhenium, was always turned on at least one hourbefore critical measurements were to be made to ensure stability. Experiencegained over the course of the project showed that the mass spectrometer per-formed well following the high temperature bake-outs and before mercury wasadmitted to the system, with well-resolved peaks being obtained for nitrogen,argon, water vapor, carbon dioxide, neon, helium and hydrogen. The sensi-tivity varied with the magnet used. For most of the runs, the sum of thepartial pressures was between 50 to 75% of the corrected total pressuredetermined with the ionization gauge. Thus, the mass spectrometer was use-ful for semi-quantitative determinations of the background pressure of thegases in the system and for showing that the system was free from any detect-able quantity of oxygen.
While the performance of the mass spectrometer towards the gases andvapors other than mercury did not change significantly once a satisfactorymagnet had been obtained, its performance towards mercury changed markedlywith time. As a result, reliance was placed on the ionization gauge forthe mercury pressure measurements, while the main function of the massspectrometer was to monitor the partial pressures of the other species toensure that they remained so low as to be negligible with respect to themercury pressures which were usually in the 10" to 10~2 N/m2 range. In afew cases where the measured pressure was in the 10"-> N/m2 range, the massspectrometer readings were used to provide a small correction to the ioniza-tion gauge readings to obtain the mercury pressure.
Measurement of Vapor Pressures and Evaporation Rates
Most of the measurements were comparative rather than absolute. Theprinciple used is illustrated in the sketch on the following page.
If a vapor pressure measurement was to be made, the evaporation cham-ber was held at a constant temperature and valve VI was fully opened so thatmercury vapor from the chamber could be leaked into the manifold leading tothe gauges and pump through the smaller orifice, 01. The diameter of 01was such that the pressure at the gauges when the pressure of mercury vaporin the chamber was 2.7 x 10'1 N/m2 was about 1.3 x 10"5 N/m2, while orifice02 gave a similar pressure at the gauges when the pressure in the chamberwas in the 10"-* N/m2 range. The dimensions of the orifices were 01
- 10 -

(diameter, 0.0134 cm; length, 0.119 cm) and 02 (diameter, 0.0980 cm; length,0.107 cm) and the ratio of their conductances as calculated from theexpression (4):
F = K. A V /4a(4)
where F is the conductance, K a factor determined by Clausing (see p. 94 ofref. 4) which depends on the length to radius ratio, A the orifice area andV the average velocity of the gas molecules, was 210. This value was usedin intercomparing measurements through the two orifices. The calibrationof the system for pressure measurements is described in connection with themeasurements on pure mercury and in the Discussion section.
01 VIEVAP.CHAMBER
02 V2
TRAP
LIQUID
Since the conductances of the various portions of the system were heldconstant throughout the series of experiments, the pressures measured on thedownstream side of 01 or 02 were proportional to the pressures on the up-stream side, provided sufficient time was taken for a steady state to beachieved. The time taken to reach the steady state was certainly less than10 minutes and probably less than 1 minute, but about 20 minutes was usuallyallowed before taking readings. By taking measurements with mercury in theapparatus at a known temperature, the pressure of vapor in the apparatuscould be calculated from the published vapor pressure data and the systemcould be calibrated for absolute pressure measurements.
For measurements of evaporation rates, the trap of the evaporationchamber was surrounded by liquid nitrogen so that the vapor evaporating fromthe amalgam or pure mercury was pumped away at high speed. This pumpingaction effectively lowered the pressure of vapor above the mercury surfaceand hence lowered the pressure on the up-stream sides of the orifices tothe pressure gauges. The pressure on the up-stream side of the orifices 01and 02 when valves Vl or V2 were fully open was governed by the rate of
- 11 -

evaporation of mercury from the amalgam and by the effective pumping speedof the refrigerated trap. Provided the pumping speed was held constant,the pressure recorded by the gauges depended only on the rate of evaporationof the mercury. Since the rate of evaporation of pure mercury can be calcu-lated from its vapor pressure and equations (2) and (3), the rates of evapo-ration of the amalgams could be determined in absolute units.
Temperature Control and Measurement
For calibration of the system for absolute pressure measurements usingthe saturated vapor pressure of mercury as the standard, the system contain-ing mercury was allowed to achieve temperature equilibrium with the labora-tory. The laboratory temperature was measured with a mercury-in-glassthermometer which, like all thermometers used in this work, had been checkedagainst a certificated thermometer with a calibration traceable to theNational Bureau of Standards. The temperature of the mercury or amalgamwas estimated to be correct to within 0.25°C.
For the evaporation rate measurements, the portion of the evaporationchamber surrounding the evaporation tube was wrapped with six turns ofrubber hose of semicircular cross-section, three above and three below theevaporation tube, through which water at a constant temperature could becirculated (see Figure 4). In addition, for all except the first puremercury experiment, three auxiliary electrical heaters in series withvariable potentiometers were wound on the main body of the chamber and onthe side arms to .make possible more precise control of the wall temperatureat the point at which the evaporation tube passed through the wall. Fivecopper-constantan thermocouples were attached to the glass close to thepoint of entry of the tube into the evaporation chamber to determinewhether there were any significant heat leaks which might cause^ the tempera-ture at this point to be different from the general wall temperature, and tohelp define the temperature as precisely as possible. The common referencejunction for the thermocouples was attached to the bulb of the calibratedmercury-in-glass thermometer in the constant temperature water bath used forthe general temperature control of the evaporation chamber. The thermocoupleoutput was determined with a moving coil galvonometer. The water bathtemperature could be determined to within ±0.1°C and the temperature differ-ence between the bath and the other thermocouple junctions could also bedetermined to within ±0.1°C. The probable error in the determination of thethermocouple temperatures was therefore estimated to be about ±0.15°C.
In general, it was found that the four thermocouples closest to thepoint of entry of the evaporation tube indicated a temperature spread ofabout 0.5°C at 25°C and about 1°C at 55°C. The temperature of the point ofentry was then taken as the average of the four readings. The error inthis temperature could not be estimated very precisely. However, it wasnot considered possible for the temperature to lie outside the range indi-cated by the four thermocouples and, on this basis alone, the maximumpossible error was judged to be no greater than about ±0.5°C. Since thesymmetry of the placement of the thermocouples about the point of entry
- 12 -

should have caused the probable error to be about zero, it was concludedthat the actual error was unlikely to exceed ±0.25°C, the average of themost probable error and the maximum possible error. The calculated tempera-ture of the point of entry was used in the calculation of the temperature ofthe mercury or amalgam at the evaporation surface as described in AppendixIV.
- 13 -

MEASUREMENTS ON PURE MERCURY
The apparatus used in the study of pure mercury was as described inthe previous section, except that only the smaller orifice 01 was providedas a leak to the pressure gauges. As mentioned, the pressure in the systemafter a 24 hour bake-out at 250°C prior to the introduction of mercury wasvariously indicated as 2.1 x 10"° N/m^ (ionization gauge), 5.7 x 10"? N/m^(mass spectrometer, total of partial pressures) , and 2.7 x 10 N/m^ (ionpump), and the leak rate as measured with the ionization gauge was 7 x 10" -moles.sec . At no time during the experiments, except when it was inten-tionally admitted, was oxygen detectable in the system (< 10 N/m ).
The mercury used was of the highest purity commercially available.(Information on the sources and specifications of the mercury and themetals used in preparing the amalgams is given in Appendix II) .
Measurements
After the double distillation of the mercury in the oxygen-free environ-ment of the vacuum system, the mercury was allowed to return to room tempera-ture and the evaporation tube was filled. The saturated mercury vapor wasthen allowed to leak through the orifice into the evacuated manifold con-nected to the pressure gauges. The steady gauge readings were recorded toprovide a calibration factor relating the readings taken through 01 to theknown saturation vapor pressure of the mercury at the measured room tempera-ture. (Further calibration data for the orifices were obtained during theamalgam studies;, the data for orifice 02 is summarized in Table 10.)
Following the measurement on the saturated vapor, liquid nitrogen wasplaced around the trap of the evaporation chamber and a we11-formed meniscusabout 0.15 cm high was produced above the horizontal surface of the evapo-ration tube. The base of the meniscus was bounded by the elliptical openingin the evaporation tube. This was the case for all the measurements on puremercury and for most of the amalgams (see next section). The meniscusheight was measured with a cathetometer and the meniscus area was calculatedfrom the height as described in Appendix III. With the temperature of thepoint of entry of the evaporation tube into the evaporation chamber heldconstant at 25°C, pressure measurements were made through orifice 01 withboth the ionization gauge and the mass spectrometer. The time allowed fortemperature stabilization of the meniscus after adjustment of the tempera-ture was 90 minutes. Subsequent observations showed that the time takenfor stabilization was less than 30 minutes. After the measurements at 25°C
- 14 -

were completed, the temperature was raised to 40°C, the meniscus height andthe liquid nitrogen levels were adjusted, and pressure measurements weremade after allowing the usual 90-minute period for temperature stabiliza-tion. The procedure was repeated at about 55°C and 25°C to complete themeasurements on the as-prepared mercury. The raw data is tabulated underthe heading Run 1 in Table 2.
Run 2 was a repeat of Run 1 after the surface of the mercury exposedabove the level of the evaporation tube had been cleaned by repeated sweep-ings. The sweepings physically dislodged drops of mercury which fell intothe bottom of the liquid nitrogen trap. Any small drops which clung to theunderside of the evaporation tube were allowed to evaporate before anyfurther measurements were made. Pressures recorded during the sweepingprocess indicated very rapid responses of the gauges to movements of thesweeping blade.
At the end of Run 2, the system was closed off from the pump, themeniscus level was adjusted, and pure oxygen at a pressure of 240 N/mwas let in from an auxiliary vacuum system through a liquid nitrogen trapconnected to valve 5 (Figure 2). Valve 5 was then closed and the oxygenwas allowed to remain in the system for 70 minutes before being pumped out.When oxygen was no longer detectable and the pressure of gases and vaporsother than mercury, as indicated by the mass spectrometer, had fallen to1.3 x 10 N/m , Run 3 was begun. In Run 3, the sequence of measurementswas as for Runs 1 and 2.
The last run for the pure mercury, Run 4, was carried out afterrepeatedly sweeping the mercury surface above the evaporation tube toremove any products which might have been formed at the surface as a resultof the exposure to oxygen. The raw data for these first measurements onpure mercury are shown in the three left hand colums of Table 2. Someadditional measurements on pure mercury made at the end of the program arereported later with the data for the amalgams (see next section) .
The raw data was subsequently reduced to obtain the quantities in thethree right hand columns of Table 2. The quantities are the meniscus areaA, the meniscus temperature T, and the relative rate of evaporation perunit area. As mentioned previously, the area A was calculated from themeniscus height, the meniscus temperature was calculated from the relativeevaporation rate as indicated by the ionization gauge and the measuredtemperature of the evaporation chamber wall as described in Appendix IV,and the relative evaporation rate per unit area was calculated as the(quotient of the ionization gauge reading divided by the area) x 10?.
The data in the two right hand columns of Table 2 are plotted inFigure 5 in the form of an Arrhenius plot of log (relative evaporation rateper unit area) versus 1/T°K. The best straight line through the points wasfitted by linear regression. The standard error of estimate (SEE) is indi-cated on the figure. The slope of the regression line was used to calculatethe heat of vaporization of the mercury. The value obtained was58.8 kjoules'mole which may be compared with the literature value of61.5 kjoules-mole-1 (3).
- 15 -

The main conclusions to be drawn from the data of Table 2 and Figure 5are:
a. The apparatus performed satisfactorily in that it was able todetect the changes in evaporation rate which accompanied changesin the temperature of the mercury. Further, the changes in ratewere consistent with the known heat of vaporization of mercury;
b. The rate of evaporation of the mercury was not changed signifi-cantly by a 70-minute exposure to a 240 N/m^ pressure ofoxygen.
The results for the pure mercury provided data with which to comparethe results for the amalgams discussed in the next section. They will alsobe referred to again in the Discussion section of this report.
- 16 -

MEASUREMENTS ON AMALGAMS
The studies of the tin, sodium and lithium amalgams followed the samegeneral plan as for the pure mercury. Before each study, the glass portionof the apparatus had to be dismantled for cleaning and rebuilt with anynecessary modifications. Those parts of the glassware, such as the evapo-ration chamber, which had to be reused, were washed with concentrated nitricacid to remove any residual mercury and then rinsed thoroughly with distilledwater and dried before being reattached to the system. Other parts were com-pletely replaced with new glass. Differences in the details of the apparatusbetween the experiments with the various amalgams will be mentioned in con-nection with the individual experiments.
Common features of all the experiments were that the equipment wasalways thoroughly leak tested before the introduction of mercury by enclos-ing it in a large plastic bag filled with helium and monitoring the systemwith the mass spectrometer. When the system had been shown to be free fromexternal leaks, it was baked out for at least 7 hours with the maximumtemperature being at least 190°C. On cooling, the leak rate was determinedwith the system closed off from the pump. At worst, the leak rate was1.4 x 10" moles.sec~l. If the leak rate for oxygen had been 25% of thisfigure, it would have taken about 4 days to supply enough oxygen to form aclose-packed layer of oxygen atoms on a 1 cm^ area of surface. However,using the mass spectrometer, no oxygen was detected in the system during themeasurements except following the oxygen treatment of the surfaces at thestart of Run 3; thus the oxygen pressure was less than 10 N/m . The systemwas always pumped down to a pressure of less than 1.3 x 10"° N/m^ as indi-cated by the ionization gauge before starting to prepare the amalgam.
Due to their different characteristics, different precautions againstcontamination were taken in handling the tin, sodium and lithium. In thecase of the tin, the only precautions were to carry out the loading of thetantalum evaporation boat in the minimum of time and without direct handling
- 17 -

of the material. The sodium, which had been obtained in a 5 g quantity ina sealed glass capsule containing argon was able to be transferred to smallercapsules and sealed into them under vacuum without exposure to air. One ofthe smaller capsules, which was provided with a break seal, was connected tothe main apparatus for the sodium amalgam experiments and was opened directlyinto the apparatus after it had been evacuated. The lithium, which had beenobtained in foil form packed in a screw top jar with an argon atmosphere,was handled in dry nitrogen when loading the tantalum evaporation boat.Later observations indicated that some reaction had taken place between thefoil and the nitrogen and that argon would have been a better choice ofenvironment. This will be mentioned further in the description of thelithium amalgam study.
The mercury for preparing an amalgam was always outgassed by refluxingunder vacuum and then sealed off while still hot. It was then opened tothe system through a break seal and distilled once before evaporation ofthe other metal. After the other metal had been evaporated, the mercurywas distilled a second time and used to dissolve the metal to make theamalgam.
The procedures for analyzing the amalgams are described in Appendix V.Essentially, the amalgams were first extracted with acid to separate thetrace metal from the mercury and the aqueous extracts were then analyzed byatomic absorption spectrophotometry. The results were used to calculatethe concentration of the trace metal in the amalgam.
1. Tin Amalgam
Apparatus - The apparatus used for the tin amalgam experiments wassimilar to that used for the measurements with pure mercury (Figure 3) .The main changes were:
• provision was made for the evaporation of tin in flask F3 by theinclusion of the flange joint and electrical feed-through carrying a tantalumboat filled with about 0.5 g of tin;
• a glass-enclosed iron stirrer slug was placed in flask F3 to pro-vide for magnetic stirring of the amalgam as it was formed;
• small, individually controlled electrical heaters were woundaround the evaporation chamber and side-arms close to the level of theevaporation surface to minimize stray heat leaks to the evaporation surface;thermocouples to monitor the temperature at five critical points on thechamber walls were provided (Figure 4);
• the larger orifice, orifice 02, was placed in the system at theflange on the downstream side of valve 2 (Figure 2).
The last two of these modifications were made to improve the precisionof temperature measurements at the point of entry of the evaporation tubeinto the evaporation chamber and to improve the precision of rate of
- 18 -

evaporation measurements by increasing the pressures to be measured in themanifold by a factor of about 200. The exact value of the factor turnedout to be 210.
Amalgam Preparation - While the first distillation of the mercury wasin progress, and throughout the amalgam preparation, the lower end of theevaporation chamber was surrounded with liquid nitrogen to protect the pumpand pressure gauges from mercury vapor. After the distillation, the tin wasevaporated onto the walls of F3 (Figure 3) by heating the tantalum boat to awhite heat for consecutive three minute periods for a total of 30 minuteswith an applied voltage of 26 volts. Finally, after it was judged that allthe tin had evaporated, mercury was distilled into F3 until about 15cc hadoverflowed into R. The amalgam collected in R was sampled at A and analyzedas described in Appendix V. The concentration of tin was found to be only100 ppm. The magnetic stirrer was then used to raise drops of amalgam fromthe pool in F3 up the walls to enrich them with tin and then guide them backto the pool. This process was continued until almost all of the tin had beenremoved from the walls and then more mercury was distilled to carry theenriched amalgam into R. When a sufficient volume of amalgam had been col-lected in R and when it was clear that further distillation would onlyresult in dilution of the amalgam, analysis showed the tin concentration tobe 53 ppm. Although this was much below the 200 ppm aimed for, the concen-tration was judged to be high enough for a meaningful experiment to be madein accord with the technical objectives. A duplicate analysis on a separatesample of the amalgam gave 51.5 ppm and confirmed the original analysis.(The reason for the low concentration of tin was not established withcertainty. However, about 0.4 g of tin was found remaining in the tantalumboat at the end of the experiment. Since this was distributed over thetantalum, it may have reduced the resistivity of the boat and lowered theboat temperature so that the evaporation rate fell below the rate determinedin preliminary tests.)
A portion of the amalgam was transfered to the evaporation tube usingthe scoop in Tl (Figure 3). The ball joint valve to the evaporation chamberwas then closed to isolate the amalgam reservoir from the chamber in prepa-ration for the measurements.
Measurements - The evaporation rate measurements on the tin amalgamwere made by the same procedure and in the same sequence as for the puremercury. The results are given in Table 3 together with derived quantitiesobtained using the corrections for the temperature and area of the evapora-tion surface as described in Appendices III and IV. Although the rates ofevaporation of the amalgam were much reduced by the exposure to oxygen atthe start of Run 3, there was no change in its clean, bright appearance atthe evaporation surface.
The data of Table 3 is plotted as the logarithm of the relative evapora-tion rate per unit area against 1/T°K in Figure 6. The best straight linethrough all the points for the clean surfaces (Runs 1, 2 and 4) and the beststraight line through the points for Run 3 (oxygen-treated surface) were
- 19 -

fitted by linear regression. They are shown by the solid lines in the figurewhile the broken line is the regression line from the data for pure mercury,Figure 5.
The main conclusions to be drawn from the data of Table 3 and Figure6 are:
a. The rate of evaporation from the clean surface of a 52 ppm tinamalgam is similar to the rate for pure mercury;
b. Since the rate of evaporation of the 52 ppm tin amalgam wassimilar to that for pure mercury, its vapor pressure was alsosimilar to that for pure mercury.
c. The rate of evaporation of a 52 ppm tin amalgam at 25°C is reducedby at least 80% by exposure to a 290 N/m^ pressure of oxygenfor 70 minutes; the reduction in rate appears to be due to aninsoluble surface film.
d. The effect of the oxygen exposure on the rate of evaporation canbe completely removed by mechanical cleaning of the surface.
The results for the tin amalgam will be compared with the results forthe other amalgams and pure mercury in the Discussion section.
2. Sodium Amalgam
Apparatus - As a result of the experience gained in preparing the tinamalgam, and in view of the greater ease of evaporation of sodium, theapparatus used for the sodium amalgam study was as shown in Figure 7. Thisretained the main features of the earlier apparatus but included somemodifications:
« the sodium was mounted in a sealed glass capsule at the end of aninverted U so that the evaporation could be carried out by external electri-cal heating;
• the use of two interconnected sloping manifolds, each with a mag-netically operated scoop, made possible a greater degree of control overthe amalgam concentration by giving more options for concentration and dilu-tion than the previous design;
• a magnetically operated ball joint valve at the amalgam manifoldend of the evaporation tube was provided to prevent evaporation; thusvolumetric measurements could be made on the mercury in the tube to obtainindependent measurements of the rates of evaporation;
• a U-tube trap of large bore was included in the pumping linebetween the amalgam manifold and the top of the evaporation chamber toavoid the need to use the evaporation chamber trap for protection of thepump and gauges during amalgam preparation;
- 20 -

• a by-pass line L was provided to make possible the introductionof pure mercury into the evaporation tube if it should-be decided to makemeasurements on pure mercury at the end of the study of sodium amalgam.
Amalgam Preparation - The steps in making the sodium amalgam weresufficiently different from those for the other amalgams to require aseparate description. After the mercury had been distilled into flask F2(Figure 7) and seal S2 had been closed, the break seal BS2 was opened andthe inverted U containing about 0.5 g of sodium was heated to 400°C for7 hours using a tubular electric furnace. When it was judged that enoughsodium had been distilled into Rl, seal S3 was closed. At the end of thedistillation, the glass in the U was dark brown, almost black, due toattack by the sodium.
The distillation of mercury from F2 into Rl was begun. The first dropsof mercury to come into contact with the sodium evaporated almost explosivelydue to the large amount of heat liberated by the amalgamation. Subsequently,an irregular mass of solid amalgam was formed which only dissolved slowly inthe mercury which was added later. When analysis showed that an amalgam ofabout 1000 ppm had been produced in Rl, nine scoopfuls of it were transferredto R2 and S4 was sealed off. The amalgam in R2 was repeatedly diluted bymercury distilled from F2, stirred with the scoop, sampled and analyzed (seeAppendix V) until it was decided that no further improvement in compositionwas needed. The analysis of the amalgam showed it to contain 229 ppm ofsodium. The amalgam in R2 was sampled again at the end of the sodiumamalgam study. The sodium content was found to be 228 ppm. It was noticedthat the clean amalgam had a contact angle very close to 90° against theglass in the air-free, mercury vapor environment inside the system.
Finally, enough of the 229 ppm sodium amalgam was transferred to theevaporation tube to give a well-formed meniscus at the evaporation surfaceand both ball joint valves were closed.
Measurements - The evaporation rate measurements on the sodium amalgamwere carried out in the same sequence as for the pure mercury and the tinamalgam. However, an important addition was that volumetric measurements toobtain absolute evaporation rates were carried out concurrently with somemeasurements based on pressure readings. In the volumetric measurements,the cathetometer was used to determine the positions and shapes of themenisci at both ends of the evaporation tube. From these observations, themean evaporation rates over specific time peripds were calculated. Theresults from the pressure measurements are shown in Table 4 together withthe quantities derived using the corrections for the temperature and area ofthe evaporation surface (Appendices III and IV) while the volumetric ratemeasurements are given in Table 5.
In the experiment with oxygen (Run 3), it was established from pressuremeasurements at the beginning and end that only a small proportion of theoxygen let into the system at a pressure of 240 N/m^ h ad reacted during the70 minute exposure. This was shown by opening the system momentarily tothe McLeod gauge of the auxiliary vacuum system at the end of the 70 minute
- 21 -

2period. The pressure, which could be determined to the nearest 13 N/m was215 N/m^ -- a decrease of about 26 N/m from the initial pressure. Sincethe volume of the apparatus was about 5 1, a drop of 26 N/m^ in the pressurewould correspond to the removal of about 6 x 10" moles or 2 mg of oxygenfrom the gas phase. This quantity is an upper limit since about one fifthof the observed pressure drop was due to expansion into the approximately100 cc volume of the evacuated manifold of the auxilliary system. Unlikethe tin amalgam, the sodium amalgam showed definite signs of reaction withthe oxygen. These were first noticeable on the large exposed surfaces ofthe amalgam in Rl and R2 but not on the exposed meniscus in the evaporationtube. The appearance of these surfaces was, at first, as though they werecovered with very slender, transparent needles radiating from the scoopsand the other glass surfaces. Later observations suggested that the appear-ance was caused by folds in a very thin surface film, the folds being verystraight and roughly parallel so as to give the illusion, of closely-packedneedles. The films could be easily swept aside by moving the scoops whichthen became covered with a layer of silvery material with a matte appearance,presumably consisting of the surface film and trapped amalgam. The appear-ance of the evaporation surface was, at first, less obviously affected bythe oxygen exposure. The meniscus still appeared smooth and bright to thenaked eye though, when viewed through the cathetometer telescope, areflected beam of light from a remote source (flashlight) in the equatorialplane showed a more distinct halo than was usual for clean amalgam sur-faces. This suggested increased light scattering from the surface, possiblydue to the presence of small particles or a surface film. The halo becamestill more pronounced toward the end of Run 3 as the volume of the meniscusdiminished due to evaporation and to thermal contraction of the mercury inthe evaporation tube on cooling the evaporation chamber from 55° to 25°C.At the end, the meniscus was no longer smooth and bright even to the nakedeye but showed an appearance as though it were enclosed in a very thin,crinkled, transparent membrane. At this point, the shape of the meniscuswas that of a disc with slightly rounded corners -- a shape quite unlikethat shown by the free surface of the amalgam when clean.
Another observation made for the sodium amalgam was that the tendencyfor drops to cling to the underside of the evaporation tube after sweepingof the surface appeared to be greater than for pure mercury and the tinamalgam. This was the case both before and after the oxygen exposure. Forpure mercury, any drops which clung to the tube evaporated quite quickly so,provided sufficient time was allowed for their evaporation, there was noconcern about their effect on the measured rates. In the case of the sodiumamalgam, the drops also evaporated quite quickly but they left a small solidresidue, presumably of a solid amalgam of low vapor pressure, on the under-side of the tube. That these residues were of no significance in affectingthe measurements was concluded from the following considerations. Beforeevaporation the largest of the drops was roughly spherical and about 0.1 cmin diameter. The surface area of such a drop would have been about 0.008 cm^as compared with the 0.2 to 0.3 cm^ area of the meniscus. Thus, on thebasis of its original exposed area, it would have contributed no more than4% to the total evaporation rate. However, because it was allowed to
- 22 -

evaporate to a solid residue before evaporation rate measurements weretaken, its contribution would have been negligible both because of itssmall volume and area and because of the reduction in vapor pressurebrought about by the increased sodium concentration. Although the volumeof the irregular solid residue was difficult to assess in precise terms, itwas clearly very small. If its composition was that of the most dilutesodium amalgam which exists as a solid at 25°C (about 0.3% Na (21)), itsvolume would have been less than one tenth of the volume of the original229 ppm drop, say about 5 x 10" cc as compared with 5 x 10" cc for a 0.1cm diameter drop. As will be seen from the results of the volumetricmeasurements on the evaporation of sodium amalgam, this volume of mercurywould evaporate from 0.25 cm^ area of a clean meniscus of the amalgam at25° in about 10 seconds.
The logarithms of the relative evaporation rates per unit area areplotted against 1/T°K in Figure 8. The regression lines through the pointsfor Runs 1, 2 and 4 (clean surface) and Run 3 (oxygen-treated surface) areshown as full lines while the broken line is the regression line from thedata for pure mercury, Figure 5. The data from the volumetric measurementswill be discussed at greater length in the Discussion section.
From the results shown in Tables 4 and 5 and Figure 8, it was con-cluded that:
a. The rate of evaporation from the clean surface of a 229 ppmsodium amalgam is similar to the rate for pure mercury;
b. Since the rate of evaporation of the amalgam was similar to therate for pure mercury, its vapor pressure was similar to thatfor pure mercury;
c. The rate of evaporation of the amalgam was reduced by at least97% over the 25° to 55°C temperature range by a 70 minuteexposure to a 240 N/m^ pressure of oxygen; the reduction inrate appeared to be due to the formation of an insoluble sur-face film;
d. The effect of the oxygen exposure on the rate of evaporation ofthe amalgam can be completely removed by mechanical cleaning ofthe surface.
The results for the sodium amalgam will be considered further and com-pared with the results for the other amalgams and pure mercury in theDiscussion section.
3. Lithium Amalgam
Apparatus - The apparatus used for the experiments with lithium amalgamcombined features of the apparatus used in the experiments with the tin andsodium amalgams. The lithium was evaporated from a tantalum boat in thesame flask as used for the tin (Figure 3). The manifold for the preparation
- 23 -

of the lithium amalgam was also as in Figure 3 though a connection was pro-vided to make possible the distillation of pure mercury into the evaporationtube_at the end of the amalgam experiment; this feature was as L in Figure 7but with a spare break seal being included in the connection in case a needshould develop to provide entry to the system without breaking the vacuum.The rest of the apparatus was as for the sodium amalgam measurements includ-ing the U-tube trap between the amalgam manifold and the top of the evapora-tion chamber, and the ball joint valve at the manifold end of the evaporationtube.
The pure lithium (see Appendix II), which was in the form of foil washandled in a glove bag filled with dry nitrogen. The foil was sliced withcleaned stainless steel scissors and about 0.3 g was packed into the tanta-lum boat which was then quickly mounted in the evaporation flask and thesystem, which had been flushed with dry nitrogen, was pumped out.
Amalgam Preparation - The procedure for making the lithium amalgam wasas for the tin amalgam though the temperature needed for evaporation of thelithium was about 500°C lower. During the lithium evaporation, the glassof the evaporation flask darkened to black due to attack by the hot metal.Then, when the mercury was distilled into the flask to form the amalgam, itwas noticed that the amalgam had a dull surface. This appeared to be dueto some insoluble dark material floating on it. The two most likely sourcesfor this material were the black reaction product between the lithium andthe borosilicate evaporation flask, and lithium nitride (Li N) formed beforethe lithium was put into the system. Later observations seemed to confirmthat both lithium nitride and some other material were present. Thus, smallbubbles of nitrogen were liberated from the amalgam for some while, appar-ently due to reaction between lithium nitride and the glass walls. (Theexistence of such a reaction was subsequently confirmed (22).) When theliberation of nitrogen had stopped and a satisfactorily low pressure of lessthan 1.3 x 10~6 N/m obtained, some dark material still remained on theamalgam surface. This was believed to be the product of the reactionbetween lithium and the glass. The final concentration of lithium in theamalgam was found to be 165 ppm. A confirmatory analysis of amalgam takenfrom the reservoir at the end of the experiment also showed the concentra-tion to be 165 ppm. The analyses did not seem to be affected by theinsoluble material on the amalgam surface since this clung to the walls sothat little of it was transferred.
When the amalgam concentration was judged satisfactory, amalgam wastransferred to the evaporation tube in readiness for the evaporation measure-ments. It was noted that the evaporation surface was clean and bright.
Measurements - The evaporation rate measurements for the lithiumamalgam were carried out in the same sequence as for the other amalgams. Theresults are shown in Table 6, together with the quantities obtained byapplying the corrections for the temperature and area of the evaporationsurface (Appendices III and IV).
- 24 -

As for the sodium amalgam, pressure measurements made at the begin-ning and end showed that only a small portion of the oxygen let into thesystem at the start of Run 3 could have reacted with the amalgam, duringthe 70 minute exposure. The initial oxygen pressure was 300 N/m^ and thefinal pressure, 280 N/m2. This set an upper limit of about 3 x 10~5 molesor 1 mg on the quantity of oxygen removed from the gas phase during theexposure to the amalgam. Also, during the evaporation rate measurementsfollowing the oxygen exposure, the meniscus behaved very much like themeniscus of the sodium amalgam in that, at first it appeared clean andbright but later, as the meniscus volume became smaller, the surfaceappeared to be enclosed in a thin, wrinkled, transparent membrane and themeniscus shape approximated that of a disc with rounded edges. An importantobservation was that, as the temperature was increased from 40° to 55°C,thermal expansion of the amalgam in the evaporation tube caused the meniscusto become so large that part of it broke away and fell into the trap. Inspite of the damage this must have caused to the film on the amalgam surface,no increase in the evaporation rate above that which would have beenexpected from the data for oxygen-treated surf aces at 25° and 40° was observed(see Figure 9).
The logarithms of the relative evaporation rates per unit area ofTable 6 are plotted against 1/T°K in Figure 10. The full lines drawnthrough the points for Runs 1, 2 and 4 (clean surface) and Run 3 (oxygen-treated surface) were fitted by linear regression and the broken line isthe regression line from the data for pure mercury, Figure 5.
From the data on the 165 ppm lithium amalgam, it was concluded that:
a. The rate of evaporation from the clean surface of the amalgam issimilar to the rate for pure mercury;
b. Since the rate of evaporation of the amalgam was similar to therate for pure mercury, its vapor pressure was similar to that forpure mercury;
c. The rate of evaporation of the amalgam was reduced by at least93% over the 25° to 55°C temperature range by a 70 minuteexposure to a 300 N/m^ pressure of oxygen; the reduction inrate appears to be due to the formation of an insoluble surfacefilm;
d. The surface film has some ability to heal if broken;
e. The effect of the oxygen exposure on the rate of evaporation ofthe amalgam can be completely removed by mechanical cleaning ofthe surface.
The results for the lithium and other amalgams will be discussedfurther and compared with those for mercury in the Discussion section.
- 25 -

4. Final Measurements on Mercury
At the end of the measurements on the lithium amalgam, mercury was dis-tilled so as to run into the evaporation tube and wash out the amalgam. Thevolume of the tube was estimated to be 5 cc and 50 cc of mercury was dis-tilled to flush it out and replace the amalgam with essentially pure mercury.A set of measurements was then made on the mercury to provide a final checkon the system performance. These measurements were made using orifice 02whereas the original measurements had been made using orifice 01. Theanalysis of the mercury at the end of the run showed it to contain 0.3 ppmof lithium. This is considered to be an upper limit on the lithium contentsince it was believed to have been contaminated during removal from theevaporation tube. The results are recorded in Table 7 and they are plottedin the usual form of log (relative evaporation rate per unit area) versus1/T°K in Figure 11. The regression line for this data is the solid line inthe figure while the line for the original set of data on pure mercury isshown by the broken line. While the results confirmed that no catastrophicchange had occurred in the performance of the system, they suggested that achange in the sensitivity of the ionization gauge might have occurred duringthe course of the program. This possibility is discussed in the next sec-tion in connection with the magnitudes of the errors and the general signifi-cance of the data.
- 26 -

GENERAL DISCUSSION
Relative Evaporation Rates
The evaporation rate data for pure mercury and the amalgams were givenin arbitrary units in Tables 2, 3, 4, 6 and 7, and in Figures 5, 6, 8, 10 and11. The regression lines fitted to the log (evaporation rate/unit area)versus 1/T°K plots for the clean surfaces of pure mercury and the amalgamsand for the oxygen-treated surfaces are shown again in the composite plotof Figure 12. The average standard error of estimate (SEE) for the pointsrepresented by the regression lines is shown in the figure. Attention mustbe drawn immediately to the difference of about 0.2 units o"n the log scalebetween the positions of the regression lines for the first and last setsof data for mercury. This difference, the value of which may be calculatedfrom the equations of Table 9 to be 0.196 at 40°C, is much larger than theaverage standard error of estimate for the regression lines (0.074 logunits) and it represents an apparent reduction of almost 40% in the relativeevaporation rates per unit area from the first run to the last. Thissuggests that there was a reduction of almost 40% in the ionization gaugesensitivity over the course of the program since an analysis of likelyerrors (summarized in Table 8) does not lead to any other explanation.Additional facts which are consistent with the idea that there was asystematic downward drift in the ionization gauge sensitivity are:
a. The data for the last points (Run 4) in each of Tables 2, 3 and• 6, and the associated Figures 5, 6 and 10, tend to lie below thecorresponding points (Runs 1 and 2) obtained earlier; (while the
same trend is not apparent for the sodium amalgam data of Table 4and Figure 8, there is reason for believing it to be masked bylarger than usual errors in two of the points for Run 1).
b. The standard errors of estimate are about twice as large as wouldbe expected from the combined random errors indicated in Table 8;the unexpectedly high SEE's could be attributable to a systematicerror from a drift in gauge sensitivity being superimposed uponthe random error contribution to the SEE.
Since the presumptive evidence for a drift in ionization gauge sensi-tivity over the course of the measurements was strong, a correction for sucha drift was made as follows. It was assumed that the drift had occurred atan essentially constant rate while the equipment was in use but that, forsimplicity, the total drift could be considered to have taken place in stepsfrom one experiment to the next. Then, to correct for the changes, thefactors 1.1, 1.2, 1.3 and 1.4, respectively, were used to correct the ioniza-
- 27 -

tion gauge readings for the tin, sodium, and lithium amalgam experiments, andthe last mercury experiment, for comparison with the first mercury experiment.The revised regression lines are plotted in Figure 13. While more sophisti-cated ways of correcting the gauge readings for the drift could have beenused, (e.g., making a correction on the basis of hours of operation of thegauge in the presence of mercury), it was not felt that enough informationwas available to justify more than a simple empirical correction.
The important conclusion to be drawn from Figure 13 is that the evapora-tion rates for mercury and the clean amalgams all lie within the approxi-mately 15% experimental error of each other while the rates of evaporationof the amalgams which have been exposed to oxygen are at least 90% lower at25°C. It is now clear that the low rates of evaporation of tin, sodium andlithium amalgams observed in the earlier study (2) were presumably due tosome form of contamination such as oxide, hydroxide or nitride.
In regard to the mechanism by which exposure to oxygen reduces the rateof evaporation of the amalgams, the evidence of the present study is thatthe reduced rates result from the formation of thin, insoluble films on thesurfaces. The effects of the films, and presumably the films themselves, canbe removed by mechanical sweeping of the surfaces. The fact that the filmdoes not reform without further exposure to oxygen indicates that it is notsufficiently soluble to form a reservoir of dissolved material from whichit can be regenerated by Gibbsian adsorption. While the films can be removedwithout difficulty, it is significant that on one occasion the surface filmof the oxygen-treated lithium amalgam must have been broken by the breakingaway of a drop of amalgam from the meniscus, without causing more than amomentary increase in the evaporation rate. Thus, at least for the lithiumamalgam, the surface film does have some ability to heal if broken.
The retardation of evaporation by the films, which presumably consistof metal oxide, must be attributed to a low permeability of the films to thepassage of mercury vapor. Depending on the structure of the oxide film,the mercury atoms may escape from the amalgam by either activated diffusionthrough pores of atomic dimensions in the film or by gas phase diffusionthrough pores with effective diameters large with respect to the diameterof the mercury atom. If the former, the apparent heat of vaporization ofthe mercury (which can be deduced from the slopes of the regression linesin Figure 13) should be increased over the value for pure mercury or for theclean surface of the amalgam. If the latter, the heat of vaporization shouldbe unchanged. Of the three metals studied as amalgams, only tin appeared toshow an increase in the heat of vaporization, whereas the other two appearedto show a decrease. The decrease in the heats for sodium and lithium arebelieved not to be real but to be due to disproportionately large errors inthe low pressure readings resulting from residual mercury in the manifoldfollowing measurements at higher pressures. While this hypothesis has notbeen confirmed quantitatively, it was observed on several occasions thatclosing off of the glass system from the manifold following measurements onmercury showed that there was a small but detectable background pressure ofmercury which could not be removed in any reasonable period of time. Errors
- 28 -

from this source would be expected to lead to an apparent reduction in theheat of vaporization which would be most significant when the measuredpressures were lowest i.e., for the oxygen-treated amalgams. Thus, it islikely that the heats of vaporization of the oxygen-treated amalgams asdetermined from the lines in Figure 13 would be at least slightly underesti-mated. For this reason, it is not considered significant that the heats ofvaporization of the oxygen-treated sodium and lithium amalgams appeared tobe lower than the value for pure mercury, but it is considered significantthat the heat for the oxygen-treated tin amalgam appeared to be raisedabove the value for pure mercury.
The differences in the rates of evaporation of the oxygen-treatedamalgams may be due to several factors:
a. Differences in the concentrations of the metals in the amalgams
b. Different structures and thicknesses of the surface films.
It seems likely that the second of these will be the most important,provided enough metal is present to form a dense surface film and providedenough time is allowed for the film to grow to an adequate thickness. Itis certain that there was enough trace metal in each of the amalgams of thepresent study to form oxide layers many atomic diameters thick. However,the rate of reaction of the tin amalgam with oxygen may have been lower thanthe rates for the other amalgams because of lower surface concentrations oftin; the lower surface concentrations would result from the lower bulk con-centration of the tin amalgam and a probably lower adsorption of tin at themercury surface (as indicated by the data of Semenchenko (12)). A lowerrate of reaction would lead to a thinner film and, probably, a smallereffect on the retardation of evaporation.
Absolute Evaporation Rates in the Evaporation Chamber and in Free Space
With the exception of the volumetric measurements of the evaporationrates of the sodium amalgam (Table 5), all the rate data discussed has beenpresented in arbitrary units. Comparison of the volumetrically determinedabsolute evaporation rates for the sodium amalgam with the rates expressedin arbitrary units represented by ionization gauge readings gives a factorfor converting all the rate data to absolute terms. This has been done incalculating the right hand ordinate scale of Figure 13. The relationshipwas found to be:
-2 -1Rate of evaporation (in g.cm .sec ) = _,relative evaporation rate per unit area x 2.70 x 10
The absolute evaporation rates which are shown in Figure 13 apply tothe specific conditions in the evaporation chamber when the flow of mercuryvapor away from the evaporation surface is limited by the conductance ofthe tube leading to the trap. The evaporation rates in free space would bea little higher than the values of Figure 13 because conductance would notbe a limiting factor.
- 29 -

There are two ways of determining the magnitude of the correction whichshould be applied to the evaporation rates of Figure 13 to obtain values forfree space. The first recognizes that (i) the rate of evaporation is, asshown by equation (3), proportional to (Psat-P) > where Psat is the satura-tion vapor pressure of the mercury or amalgam and P is the effective pres-sure above the surface, and (ii) the rate of flow of vapor to the trap isproportional to P, since the effective pressure in the trap is negligible,and that P can be calculated for the evaporation chamber geometry forvarious temperatures and areas of the evaporation surface. Such calculationsare described in Appendix VI. They indicate that P is likely to be lessthan Psat/15. Thus, since it follows from equations (2) and (3) that theevaporation rate in free space Gfs should be related to the rate Gec in theevaporation chamber by the relationship:
G, P ^fs sat ,
G p _P -ec sat
then G,. will lie between G and (15/14)G .fs ec ec
In the second method of approach to calculating Gf from Gec, P isdetermined experimentally and the measured value substituted in equation (5) .If, as seems likely, P is essentially identical to the pressure above theevaporation surface which was monitored in the evaporation rate measurements,then P can be determined from the ionization gauge readings of the ratemeasurements (e.g. Tables 2, 3, 4, 6, and 7) if the calibration factor relat-ing the gauge readings to the pressure in the chamber is known. This factorwas determined from readings taken on various occasions when mercury in thesystem was allowed to come to equilibrium with its saturated vapor at thelaboratory temperature. From the results summarized in Table 10, the cali-bration relationship was shown to be:
r\ i
Pressure (N/m ) = Ionization Gauge Reading (torr) x 1.36 x 10
Applying this relationship to the data from Tables 2, 3, 4, 6 and 7, valuesof P were obtained which could be combined with the known values of Psatusing equation (5) to calculate Gfs from the Gec regression lines of Figure13. As an example, Gec was calculated to be 1.1 x 10" g. cm" .sec" at 25 °Cwhile P above a 0.25 cm2 evaporation surface at 25 °C was found to be1.3 x 10~2 N/m2. Then, knowing that Psat for mercury at 25.0°C is2.76 x 10" •"- N/m, application of equation (5) gave a value of 1.15 x 10"g. cm" .sec" for Gf . This may be compared with the value of Gfg (Gg )calculated from the kinetic theory using equation (2) - 1.0 x 10"g.cm" .sec . This agreement must be considered satisfactory when thepreviously discussed sources of error are taken into account. Thus, thetreatment of the data for mercury is seen to lead to reasonable results forthe rate of evaporation in free space.
- 30 -

The same approach was taken in calculating the rates of evaporation infree space (see Table 11) from the amalgam surfaces. However, some addi-tional consideration was necessary to justify the choice of values of Psatfor the clean amalgams and for the oxygen-treated amalgams. For the cleanamalgams, the similarities of their rates of evaporation to the rates ofevaporation for mercury could only be explained if their P . values weresimilar to the Psat values for mercury. Thus, referring to equation (3),it can be seen that if P is small, the Psat values are essentially propor-tional to the G values.
The situation is different for the oxygen-treated surfaces. Here,definite differences in the evaporation rates from those for mercury doexist. However, since Psa£ should not be changed by the physical presenceof the surface film, and since the rate of diffusion away from the surfacethrough the physical barrier provided by the film will be proportional to(Psat-P), equation (5) should still apply. It is upon this basis that therates of evaporation in free space for all the oxygen-treated amalgams(Table 11) have been calculated. However, because the apparent heat ofvaporization of the tin amalgam through the film is higher than for puremercury, the true driving force for the rate determining step in the diffu-sion of mercury away from the surface must be somewhat less than (Psat~ )•Thus, the rates of evaporation for the tin amalgam in free space afterexposure to oxygen will have been slightly underestimated in Table 11.
- 31 -

CONCLUDING REMARKS
The work described in this report was stimulated by a need to knowwhether the low rates of evaporation previously observed for some diluteamalgams were due to insoluble films or to Gibbsian adsorbed layers.Whereas Gibbsian layers would have an inherent ability to reform if thesurface were disturbed, insoluble films might not reform spontaneously.Thus, insoluble films would be less desirable than Gibbsian layers ifGibbsian layers could cause a large reduction in evaporation rate.
While the experiments described show conclusively that insolublesurface films formed by exposure of amalgams to oxygen can be removed byvigorous cleaning of the surface, there is evidence from the experimentswith lithium amalgam that the films have some ability to heal. The extentof this ability should be investigated further if the use of mercury inspace is still of interest. Also, whereas the films on the amalgams of thestudy reported here were formed by reaction with oxygen, films should alsobe able to be formed by interaction between amalgams and a variety ofother gases (e.g. water vapor) or liquids (e.g. water, ethanol). Theability to form or renew surface films using other active species thanoxygen could prove valuable in space applications.
- 32 -

SUMMARY OF RESULTS
Using an ultra-high vacuum apparatus designed for the purpose, puremercury and dilute amalgams of tin, sodium and lithium were prepared insuccessive experiments. The amalgam concentrations were tin, 52 ppm;sodium, 229 ppm; and lithium, 165 ppm. The rates of evaporation of themercury and the amalgams were determined at temperatures between 25° and55°C both before and after a 70 minute exposure to about a 270 N/m^ pres-sure of oxygen. In addition, the rates were determined again after theliquid metal surfaces had been cleaned by mechanical sweeping.
The results showed that:
1. The rates of evaporation of pure mercury and the amalgams werethe same, within about a 15% experimental error, over the 25°to 55°C temperature range.
2. The rates of evaporation of the amalgams, but not of the mercury,were reduced by the exposure to oxygen; the reductions in therates for the amalgams were at least 807, over the 25° to 55 °Ctemperature range.
3. The reduced rates of evaporation, at least for the sodium andlithium amalgams, were caused by the formation of thin, trans-parent, insoluble oxide films which only became visible when theybuckled as the surface area of the liquid was reduced; the filmscould be removed by sweeping the surface.
4. Although the effects of the oxygen treatment could be easilyremoved by sweeping the surface, there is evidence that the filmon the oxygen-treated lithium amalgam had some ability to healif broken in other ways. Thus, on one occasion it was observedthat the breaking away of a drop from the large meniscus did notresult in an increase in the rate of evaporation.
5. The rates of evaporation of pure mercury and the clean and oxygen-treated amalgams in free space were calculated for 25°, 40° and55°C. The results were:
- 33 -

Rates of evaporation in4 -2
10 (g.cm .sec40°C 55°C
4 -2 -1free space x 10 (g.cm .sec )
Pure mercury and clean amalgams 1.0 3.0 8.5
02-treated tin amalgam (52 ppm) 0.095 0.32 1.3
02-treated sodium amalgam (229 ppm) 0.025 0.048 0.088
0_-treated lithium amalgam (165 ppm) 0.085 0.19 0.32
6. Since the rates of evaporation of the pure mercury and the cleanamalgams were the same within the experimental error, theirsaturated vapor pressures must also have been the same within theexperimental error.
- 34 -

REFERENCES
1. A. H. Ellison and S. B. Tejada, NASA CR72441, July 23, 1968.
2. A. M. Schwartz and S. B. Tejada, NASA CR72715, April 20, 1970.
3. G. T. Engel in Kirk-Othmer Encyclopedia of Chemical Technology,2nd ed., Vol. 13, p. 218, Interscience, New York, 1967.
4. S. Dushman, Scientific Foundations of Vacuum Technique, 2nd ed.,Wiley, New York, 1966.
5. K. K. Kelley, U. S. Bureau of Mines Bulletin No. 585, 1960, (reissueof Bull. No. 383, 1935).
6. N. K. Adam, The Physics and Chemistry of Surfaces, 3rd ed., OxfordUniversity Press, London, 1941.
7. F. Sebba and E. K. Rideal, Trans. Faraday Soc., 37, 273 (1941).
8. N. L. Jarvis, C. 0. Timmons and W. A. Zisman, in Retardation of-Evaporation by Monolayers, ed. V. K. LaMer, p. 41, Academic Press,New York, 1962.
9. S. Glasstone, Textbook of Physical Chemistry, 2nd ed., Van Nostrand,New York, 1946.
10. F. E. Poindexter, Phys. Rev., ,28, 208 (1926).
11. International Critical Tables, Vol. 3, p. 284, 1928.
12. J. H. Hildebrand, A. H. Foster and C. W. Beebe, J.A.C.S., 42,545 (1920).
13. V. K. Semenchenko, Surface Phenomena in Metals and Alloys, PergamonPress, New York, 1961.
14. R. Pohl and P. Pringsheim, Verh. deutsch. Phys. Ges., p. 431, 1931;as referenced in V. K. Semenchenko, Surface Phenomena in Metals andAlloys, p. 235, Pergamon Press, New York, 1961.
15. U. R. Evans, The Corrosion and Oxidation of Metals, St. Martin'sPress, New York, 1960.
16. E. de B. Barnett and C. L. Wilson, Inorganic Chemistry, 2nd ed.,Longmans, New York, 1957.
17. A. Feldman, Giorn. chim. ind. applicata., j), 455 (1927); CA 22, 362(1927).
- 35 -
18. C. Kemball, Proc. Roy. Soc. A201, 377 (1950).
19. R. D. Craig, in Modern Aspects of Mass Spectrometry, ed. R. I. Reed,p. 21, Plenum, New York, 1968.
20. G. McDonagh, Veeco Instrument Company, private communication.
21. International Critical Tables, Vol. 2, p. 436, 1927.
22. N. Smith, Foote Mineral Company, private communication.
23. J. R. Hutchins, III and R. V. Harrington, in Kirk-Othmer Encyclopediaof Chemical Technology, 2nd ed., Vol. 10, p. 533, Interscience,New York, 1966.
24. R. C. Weast (ed.), Handbook of Physics and Chemistry, 48th ed., 1967-1968, Chemical Rubber Company, Cleveland, 1967.
25. E. A. Moelwyn-Hughes, Physical Chemistry, p. 24, Pergamon Press,New York, 1957.
26. International Critical Tables, Vol. 4, p. 440, 1928.
27. S. N. Zadumkin and V. G. Egiev, Fiz. Metal, i Metalloved, 22, 121(1966); CA 65, 17839h (1966).
- 36 -

cu C 6o o o^-vcd -H o
3 <l)CO H
ooVO
I—VO
COmCM
vOCMm
oo
CMCMCM
VOoo
ooONCO
to
CJMH
c cuM-l O r-lO -H O
4J 6jj cd •CO N COCU -i-l 4)frj !-i r-i
0 3O. 0cd '""i
in• s-^
oo oin co
CMN*X
oo VOCO
H
PnO
PM Oo
. N '
PQ
VOCO CM
CM
CN|CTiOO CO
m
wh-lH&WCL,O
cd4J oo
OOCO
CJS00
COCM
OO
wHO
COO 3•r-l -Hc:O cfl
VO
o
tovO
CMi—IO
00LO
cacu•un)4JCO
U CO•H 3Eo•u
vOOO
CM
cdU 4J•H XIg 60O -H4J CU
< 3
ONin•o0CM
ONVO•
00i— 1i— 1
ONON•
CMCM
ONCOON
vO
0)S
Mffi
CCO
CMmCM
M-4CUVl
vOCM
OCCU-0
carH
COMcu
CCO
I
-a cu
CM

>H
OS
CM
CUu
M-l
I— 1^^ h^ ^rf— H c<5 ^<J o bD I*O M C O c^J
-H 4J i-lW *T3 v— '
<J Q>PM fvj
oMH i-l ft /~J O
pq CO CD ° 1 10O |2 H s-'| CM
<!>w
^~\r-ic3Pi>^x
CO4Jd€0)^43COcO01g
1-1COi-l4->i-ldM
VO vO
1 — CTv 00 00CM m
vO CO vO vO
co in " * ~<)• m CM CM
/^CM
C
Piv—
4-1acu$
CO
0)uCO
14-1i-i3
m oo CMCM ~d- i-l
vo m i-io m m<t m CM
CMe**»•.£5o*^CM
•UcO
C(UM
X
O
O4J
-00)COOaXu
a>i-i
r-o
^^CO
a3f.
• ^
COcu4J3a
•H0
O
M
O*-M
0 0
co oo ooin
C^ CM CM
<• in mm CM CM
s-\<rc3Pi*~s
4-1pU
CO
CUuCOJ_|
3CO
<f i— 'CM vO
CM mo mst m
M k^
O4-4„. cOCO <1>
4J I_i. f*03 <J
CO§
O^ 0)
*+H "n
'd cua> S
* •!•3 M0 C
i— i i-lcO TJ0 cO
CUco nCO
CM G"0 M
v^xCUU CU•H 60H-l 0•H (0H O0
Ci-l Oo -3
M-l +JcO
co N0) i-l3 C•-I 0cO 1— 1
k> V-**
• •
CO ^3

3 (Ua) u> COCM
•H Pd g4J 0« .
--I CX MCU CO <Upi > a
m roO O ^ f v O O \
CM
0) <j3 /O <CO CO
1-1 CUC M
m in in voC N C N C N C N c o t o m o o
C N O I t N C M• • • •O O O O
vor~r-~«*C N C N C N C N
• • « •O O O O
I - H V O V OC O C S C S• • •
O O O
to H3 .„" t<c ffl •HH
CO3 •>O 4->^W J3 I•^ 601a 1-1 .cu cu
o o o m
o o o o
o co co m* • • *o o o o o o o o ooo
COPdO
iuH
OMH
2
g
U
r-o
X^
CO 60 HO C KM i-l O
T) 4JCO ^
(S
in o> oo
• - ICNin CM<f*-* <-i \o
CM in CM n
CM co in CM
r^ co co •*
CM co m CM
c o r ^ c N c oin o in mCM <r m CM
00 00
uto
•i-iCcu
ffcdcu
CM
t-l
c3
N—/
CO•u
cuacu3COCO
s,_,
CO•H4-1•HCM
•
O
CM^^CM
C3
>^
jjacu»
CO
cuuCO
M-4•13
CO
4-1CO
ccuW!
XQ
04->
-oCOoaw
CO
£J
3Pix^^
COcu4J3C•HE0
j^O
cuCM 60O 3 cu
CO 4-1CU O «
XMS
*-
C
Di\^/
4-1acu
CO
cuucfl
*-H^-43
CO
U E•t-l C -Hin O 4J•H i-l WJ , | 1 [-T*]
O CON iH
6C i-l COC C 3
•i-l O COCO M -H
|— 1 N^^ ^k
. . .
Cfl & 0

W
PQH
MGoC/l
Pio
H
G
OH-lH
oPH
,0.cu•H4Jcd
t— 1CU
CO
0•!-l
COf3cu
CO3uCO
•1-1
2
CO
3CO
•l-(es
f
cdOM
1— 1[
cd
CU4-JCNI
* ^jP- 0)cd &
^X— S
<Mcd SCU 0
3~
H
V* X*N
CX C_3
cu -H
42
4-1 x^43 &60 8
•i-4 v-'
s**»oI-l
X/•-v
60 -i£3 M
••-1 OT3 -Wcd N-x0)
P* /-
CU oH "-^
x^CO
inco
O
inCMCM
in1-1CM
o
^*grH
O
<J-
X-N
r -[
£3piv^
CO4J
CU0CUJj
j3COcd0)Si— icd••-i4J•i-lpj1-1
,_| ,_! r-» CMCTi VO i-4 CO
i— 1
CM CO CTi i-4CO CM i-l CO
O O O O
<fr CM r- CT>CO i-l CO CMCO in CM CM
oo co m inoo o co ooi-l i— 1 O i-l
O 0 O O
CM CO• •
CT* r^ co cT*CM CO
o oo 1-1 r-iCM m -d- ~d-<j- m cs CM
^N
CM
(3
piN^
4JP-CU
J^C/3
0)Ucdm^c/)
covO
•
<r m oo o00 O CM
CM
cy\ %^ f*^ i — iCM CM CM in
o o o o
•-I »* O CO
r i CM 1-1CO <f CM CM
<f oo co oovo 1-1 m CTIi— 1 i-l i-l CM
0 O O O
CMm co. •
*^ CTN r^ coCM <)•
r-4 m 01 oo
O CO CM r-lsf m CM CM
CMJ3g;
O^J"CM
J-lcd(3cu6C^*XQ
o+JTd0)COo
XW
oo1-1
mmo
CO
1-1
**
^^i— iCO
0
0
1-1
I-l<»•
CO
c3
COcu4J3f3•He0r^
o
oo•
CN
i-lin
0
CO
.in
ooo^CM
O
^*•i— 1
in<fm
oovO•o
I-lCO
o
mCMC\l
i-l00r-4
O
i— 1CM
O
mCMCM
CMCM
1-1co
o
•3oCN
VO00r-l
O
cr*•vO
CO
r-<CM
y^N
<J"
£33
£
JJ
P.0)
CO
cu0cdif-i^_i0
c/3
CMoo
^~CM
O
O\
mCO
vOr— |
1— 1
O
oCM
^OOCO
i-iooi-i
*^CM
O
mm
"*
i -i—4i-l
O
^"<f
CTi
Om
s f
CM
f^.CM
O
CM
ONi— 1
Om•-I
o
^>•
vO
O
OCM
M-l
O1-1
x
a0)
CO
uCO
1-1cd
oM
CUCM 60O 3
U
If-> 4-1O cd
N60 -.-IC f3•r4 OCO I-l

u->
3
cuu
0) CO4-1 O,cO coC4
0)>-. cu)-i h n)O 4-1 O0) to
.C C <1>H -H O
0 >-, «•H ^4 U4J 3 o0) 0 HC ^
•H CU 4-1^ a <o
0M-l
.— iicjcuCO
CN
'aCJ
60
f-\
1O•H O4-1CO *J-i CUO 4J(X COCO pj
CO3 <UCO '
•H (0(] CUcu J-i
S3 -a!
OcuCO•
M1au(30
v— /
s~\Nlau
s_x
to H3O •to •
•F-I ae a£ £
xTCU CUa 4-i3 cfl
0 0
1
4-1
O 4-1a
C cuo a•H T-l4-1 McO cu
|&Q N
^uoV— '
T-l
a
/-N
•COucuto
r-l OJ/-N^ a|ocfl culo!5 H^
miorH
^
•*
VO
mi0
"xVD•
rH+1r~
S
coeg
•o
vO•
tr>rH
O
CO
OCM!*•*co
CM•
OCM
•d-iorH
X
i— 1
vO
^O
^J
i0rHX
X"Nf>H
•
O
COA
C^
coCM
oO
VO
0^st
CM
rHrH
O0
o•
to10
CM
Co
CO
crcu
g14-1T3cu
3urHCOU
o
curHi
rH
CO
aoH
M-4
3COcut-l
o
u
cu oto «HO Wft cfl4J C
siCO CU
4-1CO CUg*CU 3
rH•o ocu >4-1cO cuO rC
c c

n Q)0) 4-1> ctfCM
•H prf g4J Ocfl CXi
r-l Ctf !-l
CU > 0)Pi W CX
co3 <tjOto -<M
•H Cfl EC 0) OO) J-lS <d
to3 HOCO - s-^
•r-l f"* ! C_^(-< Cox-x fj p o
g cu a) v~'& a Hex
r-l J3" — CO
3 **S O 4J<tf to ,C ^0 -r4 60 E
"I f» , 1 f \1 — 1 t-t *I~I w<J QJ QJ ^
S! s w
£5 r**M 0W r-l
HVO M X
r-I CO ^
W O 60 rJi-4 pi M C MM O -r-l O<; PH T3 4JE-i cfl ^—
<; o)H Pi
Q
W
pi cfl CD o*"^ r i **~s
&0r-lH
0F4
"J>
w
vO•
c v j m n o O^-NJ -ON «— <>^ r*^> o^ ^O **^ r*^ !**•' c^
r-l r-l
CM vo o ^o **o in in r — i o>c M C M c o m c M C M c M i n mo o o o o o o o o
m o c o i — <l~i — r—im r— i
C O O O O O C M C O O O O N C O inC M C O v f C M C M C O - J - C M CM
i — 1 i — 1 ON OO CO ON ^" in ONO\~Jr~-r - l « d " C M C M O N CMO r-l 1— 1 CO r— 1 r— 1 r— 1 CM CO
o o o o o o o o o
**oCO ON
• .ON rjN. co !**•* o o *^~ in o
P-l in r-1 r— 1 CM <f r— 1
p"~ l* in r - r " ' — i in co CM
<tom<f <)• r— i st m mCM *cj" in CM CM *j~ in CM CM
CMc
r-l \
^c3 oPi ON^ CM
j~\
CO CM 4-14J' Cflc d0) 3 Cg pi O)Ol x_^ b£to >3 4J Xco a oto a>01 g OS en 4Jr — 1 CU T3
cfl O 0)•r-l CO CO
4J l*-l O•r-l to O
a 3 xM en w
CM•
**o
0\o
0
r~-
r— 1
j-
CMCOCO
"~l
p .
CO
CM
CM
^^CO
fi3Pi
in0)
3C
'Eo
0M-l
r-^
r-l CO OO VO CO r-
r-i CM r^ m fr— 1
ON CM in NJ* i — i oCO CM CM CO CO U"
o o o o o c
oo co m m co u"-sj- in ^ 1 — O r-m CM CM co m c>
m ON oo oo co ocCO OO CM O OO C-CM O r— 1 CM r-l f
o o o o o c
,--4co oo ON
• • •vj- CD " **Q ON OC
CM <t r-
co <)• <)• r- CM «
m m m o '•Q fin CM CM Kj" in c*
—^SN;J-
C3
S -
JJ
a0)
CO
0)oCO
"4-1
^43en
ii
N
1
)
N.
^•1
3J1
)
Or— 1
X
*— scfl0)J-l^3
) W< 3
ow
•T-l
a2
3 •!•
•) 60J C
•r-l
rr^
COaito,
Or-lv^
0)CM 600 3
cflCl) UCJ
•r4 aM-l O•r-l '
to -uO ffl
N60 •"-!c d
•r4 OCO M
ED ^
• •co -Q

^2 (I) CMCD 4-1 6> w o
•H PS4-1 MCO CX (U•-I c<J Oj<y >ftf w
-* CO <t<N CM CM
00 VD CM OOoo oo -j- -*
3
•r41-1ea.o.
en
CO
3 <;o /-.CO «CM•.-I <0 gC <u o<U !-l ^s <:
co co r^CM CM CM
c?\ r-CM CM
O O-iCM i-i
o o o o o
CM<f
o o o o
cfl01M
PQ
^pjo
CO H
O «co a,
••-i 6c S<U H
CM m r-i m <J- o cr><f <f <1- i~» r i—i 1-1CM CM CM mm m in
o vooo oo
OCO
J=CO3 -O 4-1 x-vCO X S
•iH 60 OC -r4 -^0) 0)
S ffi
CM r>~ oo cr> in•— 1 O i— I
0 0 O
OO vOvO <fi-H 1— 1
0 O
O vo r^ voin i-i r» mo o CM CMO O O O
psoO(
w
t^0I-lX ^
ctf 60 M0 C ^M -i-l O
T3 4JCB -0)oi
m CM <rm m vo
a>CM 60O 3
ctfa) o
oo oo mm en
CMvo
S-lO
60
ol-l4-1«N-HaO
--i a^ e
CO CU oDS H
vD oo
CM CM CNO O vO vo vD vO
m in m m
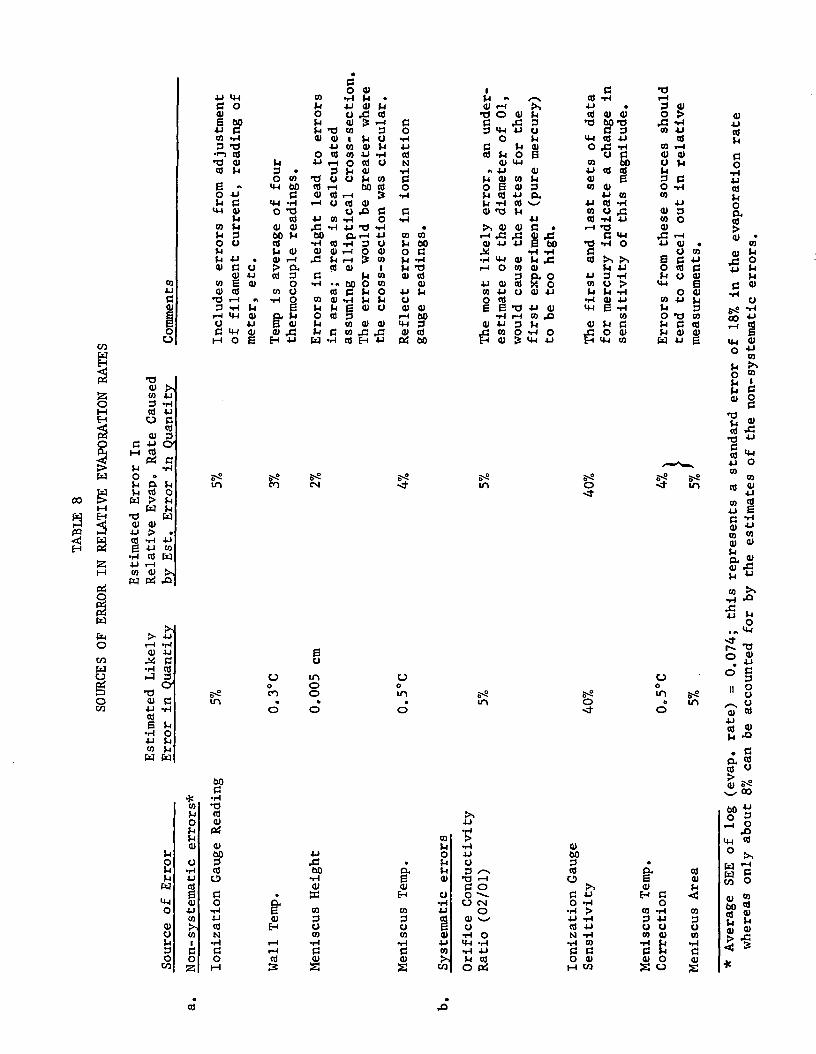
CO4JGQ)§
0
4-1 (4-1C 0cuE oo4-1 (3CO i-t3 *T3
•i ) cO*O 0)CO rl
E -O 4-1rl C
u-i curl
CO J-Irl 3O U
rl 4J .01 C U
0) 4Jco E <uCU CO
*O i— 1 •*3 1-1 rli-i IH cu.O 4J
i-i O ECOW
P5 T301 >,
•a to 4JO 3 inM CO 4JH 0 C
P5 CU 3
§ c 4J cyM P§ c
P> rl *rlW O «
L| 0. L|W rl CO O
co J> w > j-iM W rl
W H *T3 WH < 01 01PQ 1-4 4-1 > .<! W CO -H 4JH (X g 4-i co
•i-l cO WS 4J i-lM co Q) >,
W Pi ,Q
B-Sin
O
3U
•> UO i-l -H
0) 4JCO JiJ CW -H CO0 r4 3Frf O-H *13
O 0) CCO 4J -H
0)E rl•rl 04-1 J-ICO JjU W
B-Sin
00c
* -r-l
J_J
O
J-Iw•Mo0)UJ5o
CO
co *oJ-i COO 0)J-l Prfrl01 0)
000 3
•H CO4-1 O
g c301 O4-1 i-lCO 4-1>, COCO N1 •!-!
C C0 0
u3 «O co
(4-1 00cj
(H 1-1O ^3
COcu cu00 rlCOJ-I CU01 i-l> 0.CO 3
OCO U
°H SfX rlE oio> .eH 4J
^0
en
0oen
O
•fl,£;
01H
i-lr-lCO&
O 0)CO i-| L| •rl 4J 0) rlO O .£! «trl OI £ i-lrl T) CO 34) 41 | (-1 O
4-1 CO 4> J-Io at 09 4J 1-1•u r-i o at o
3 rl 01•O U O rl COat 1-1 oo atcu cd r-i $
i-l O CO CU0 .0 C
4-1 CO i-l O
00 (X i-l 4-1•H a) 1-1 3 oCU 0) i-l O CU
^3 rl i-H > COcd cu i
(3 rl CO•rl • - 00 O CO
Cd (3 rl 0CO CU 1-1 J-I rlri rl S 01 OO cd 3rl CO CU CU
W -H cO H 4J
&-SCN
EU
mooo
4-11"!
00•H0)
EC
CO3UCO•H(30)S
c04J
atN•H
o1-1
c•H
ca corl 000 Crl 1-1
CU CO0)
4-1 J-Iocu cu
i-< 00ill »-$
CU COPi 00
B-2*^
oomo
COLIo
• rlCU rlE cu
H 0•rl
CO 4J3 COo ECO 01•rl 4-1C w01 >,S W
1J-I « / .0) i-l >•
Tl O CU rl(3 rC D3 <H 4J u
O rlC rl CUa) ri o E
0) (4-1» 4J CU
t-l 01 CO rlO E CU 3Jj Hj 4 * O^rl -H 0) ^0) t3 rl
4J>, CU CU C .
01 4J 4-1 E 00J* Tt 1-1
i-l O CO CU3 O. O
4J CD Cd X OCO 4J O OI 4Jo atE E *o -w cu
•H i-l CO ,OCU 4J 3 rl
-C CO O -rl OH cu !5 IH 4J
B-2in
B-2in
t**4J•H
•H4JU
^O ^~if3 0O ^.U CM
OOI \U•H O•4-1 -H•H 4Jrl Oto PC!
cCfl >rt4-1 «Cfl OI 0)
*O &0 T3C 3
(H CO 4-1O .C -H
0 CCO 004J CQ tdcu Em cu
4J CO4-1 CO i-lW 0 .Cat -H 4J^H ^3
C ll 1**H
T3 -rl O
4J 3 -rl» O >
T-l 41 4-1*rl E 1-1
CO0) J-I |3
. C O O )1-i »4-i to
B-50
B-2b
0)003atOC 4-1O i-li-i >4J -HCO 4JN 1-1
•H COC CO CUl-l OT
T)i-l3 0)0 >X 1-1CO 4J
atCO r-lOI CUU rlrl3 C0 T4m
4-1cu 3CO O01
»£3 r— 14J CU •_. O coe c 4-10 CO Crl O CU
O 01CO 4-1 rlrl 3o *a corl C COrl CU 0)W 4J E
'— -,
B-S S-S•* in
0om s-so
*a. atE aiCU rlH c <;
0CO i-l CO3 *J 3U U UCO 0) CO•H U TJC C C0) O CU
0)4Jat
13oj-iato
atOI •
COCU rl
1 2rl
C «
"H 0
oo •*-**** ***^ I(H CU0 wLJ ^*0 »
rl Ccu O
C•n
S^"8 w
2 oCO 01
4-1co ^d-4 ^JM i,
0) ^CO CO0) 0)«. _.
flj -tjtj WW
CO Ps-_j ^Q•M r^
"5 too.„ <4-l
<J" ^
f-\ cu0 «
o §11 8
^rS•tj
rl -°
. Ca Sa) «> „cu B-2C- 00
M 4J^^O 3
i[ j cd
!>*.iw cCO O
0) COhn Cdcc? «t_l J-IM "^A) Q)
<j &
*
CO

wmH
o?-<
w*t3
rrtMJ
*Bcd4_)CO
cdCO
•H4-1cd3crW
Co, 1•rl01COcu
60CU
(Vj
C•rl
Ol4-1
Ccd4-101C
u
cu
g*~*
•HW
W
4HO
4-1Ccu
•1-1o•H14-1"4-1CUOU
0•H01CO(iiw
60CUPi
4-1CUcuo^1cuil
CM
B4JCO
CO
COf*^oo
COoI— 1
X
/-"N
ooi— io+1^-!— 1
CO1
\fffs
CO,—1
CM1— 1
01cuo >-,cd j-i
4-1 3r-l 03 M
c/> cu
ccd cuCU Mr-l 3O P-i
CMCMO
O
ro0i— H
X
^— vOO
O+1r .oent
\^^
i— ii*-r-l
I— 1
•HI_J
B(Xa
CO•0\^/
J_j
30J-i
1
CUr-l3
P-4
oooooo
COoi— iX
^-^10CM
O-f-j00CTi
CMI
*. j
*«Omi—it— i
^-^Ba.a
CMin
B
60r-l
Btti
B•1-1H
vOOi— i
O
COoi-H
^
^-^mCM
o*HooCO
1- — '
ooini-ir-i
s~**Ba.ex
Q\C^JCMN^
B60
rtBcd
B3
•H
OCO
0"\vO0
o
COoT—l
X
^-^r^t— i
O+10VO
CM1
\^^s
p^CM
Oi— 1
Ccu60
B irtCX 0a
om 4-ivDt-i cuN^-^ t-t
3B oico oW) &
1 — 1 ^g wcd 60
c1 -g•H OrG I""'
4-1 r-l•H O
CT> OOr-< CM0 O
O O
CO COO OI-l !-(
W W
^™S ^N00 OO r-l
o o+1 +1i — I vOr^ <y\
CO i-l1 1
X^X V»*
r^ r~Ov <f
CM VOi— 1
/— N
Bex
B o^ex CMex CM\^^
CMm Bx-' cd
60B --<cd cd60 BrH 5cdB Bcd 3
•HC -0
•H OE-i co
CO
oo1-1
0
COoI-l
X
^^COr^CD+1i— iCM
CM|
^_^
Ooor»!
'i'exexmr— i\^s
Bcd60
r— icdBcd
§•Hr"j4-J•H1-4
oE-i
CUoo13O
•Hca01cu60<U
CUO
cu4-JC
cdcu
4-1•i-l(3
CUexcu4-1cd
13O
•r-l
Oex>cu
60o

PM4JCOw
p-lCM
CMO
o1— 1
H1—3
pa^3H
O55 >HM Pi
Q CO |"~*§ O U<U Pi
CO UW E~t >;o 23|~~S M [Vt
^d § Oc3 w
2 CO2 1 * flo co 2H S co•^ ^ CON [VI
M t3 2s 2 P-I0 to1-1 co pd
CO O
o S <PU >
23O pi QM O W
ri ri2 CM P3PQ o pM Hi-j w <d<3 cj coO M
fe w1— ( FrfPi H0
fl ^COw
p-l^
0)
3CO /-~.
CO Mcu >-iM 0
CM -M\^
o(Xcfl
CO CO CO1 1 Io o oI— 1 1— 1 T— 1
X X XvO vO COr~- r-- r^• • •!— 1 •— 1 ,— 1
W)"I-l
Pk•V
S5••J•rtT3
CO0) s~^Pi ^
i0) O60 tJ
COO
m m mi i io o or~4 r~\ ^H
M »y» Vl"l ("i ("i
o m oC^ * <J"
• • •CM i-l r-l
o, ^6 u<]) oH -^
o o co• • •
CO CO CMCM CM CM
MO•U0COIH
cO CCO O
1 v-lO -U•-( CO
•HV0 iMO cfl
0CM
<4-l
O•
cu G3 COi-l 60
CO i-l
P
O ctf60co en 30) -H> J3
in •< 4Ji 1-1O i-lr~t
cuX J2
4-1COo n
0CM IM
CO••-I
cOi t4J
CO
CO•I-l
H
.*^ "CM cO

135*<l
f^J2J<
}H
SQ_J
ft5
**
§8*£O COMH W<I3 WW MO KPH«! «> HW
fnO
COFH
2Q
B3t3C?h"J
cS
/-^fl
1o01CO•
CN
'eQ60v^
<r0t n|
X
eo•fi4JCOMOaC!l
Hmo<u+jta05
CO
omm
*-<+iinto
m
oO<f
*to+1oco
0m«M
m»
f™^
*0
+io
»1-1
COe5^ M>>1-l^ ct)
O t(JUm d>s
4J<UM t)3 C
fM cO
CO
1-1
CM(O
O
mc*o
•
o
s~\eco
1£^4
tNin•*~s
e«60r-(atea)c•H4-1
•O014JCO0)Vi4J1CS|
O
OO00oo
oostoo
m<MO
*O
/— s
£a.aOiCVJCM» -
e<«00r-l<rtgc«
•r4t?OCO
•ocuwa)a>M4J1CM
o
CMco
o
a\i— i
d
S0
*O
x"N
^M|di(X
in\ot-i"
1c»i-itrtgC8
p•HJ3•wi-(iH
•OV•u«jeuKi4JtCM
O
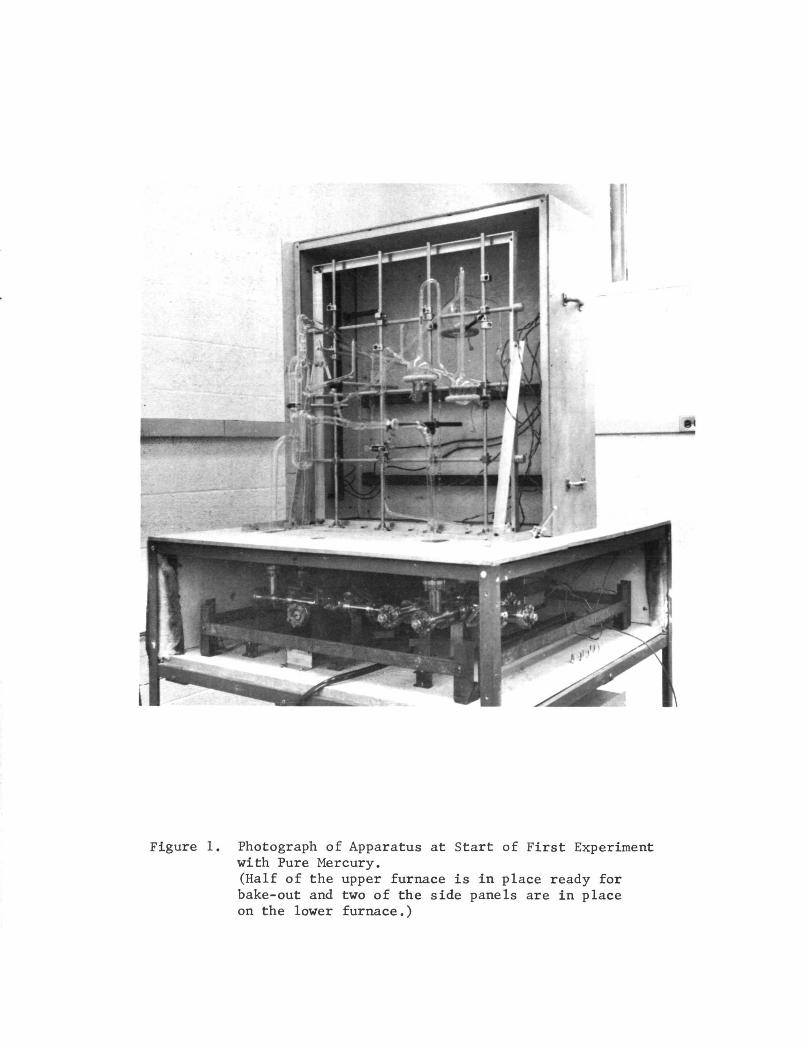
Figure 1. Photograph of Apparatus at Start of First Experimentwith Pure Mercury.(Half of the upper furnace is in place ready forbake-out and two of the side panels are in placeon the lower furnace.)

Figure 2. Pumping and Pressure Measuring System.
To Aux. Vac.System
SorptionPumD
7
& IonPump
6
CO
6?<>Furnace(TO 300 °c;
4
M io JW rv,amh,
lonizationGauge
To Evap.Chamber
01
02
2
JTo Evap.Chamber
Trap
MassSpec.

MH1
Figure 3. Glass Portion of the System as Usedfor Tin Amalgam Measurements.
V4

to gauges
/\
evaporation tube
Liq.
Level
Figure 4. The Evaporation Chamber ShowingTemperature Controls.
mercury
E H electric heaters
HC rubber heating coil
T thermocouples

Figure 5. Evaporation Rates for Pure Mercury.
2.5
2.0
CO0)
CO
4J3e 1.5CD4-1cO
4JcflMO(XCO
CD
1.0
0.5
M)O
0.0
SEE
Run 1Run 2Run 3 (oxygen)Run 4
340 330 32010 /T °K
310

Figure 6. Evaporation Rates for Tin Amalgam.
2.5
1*2.0
(S
-u•r-lc
0)
•iJ 1.5
co•r-l
0)
•r-i
0.5
60O
0.0
SEE
340 330
Run 1O Run 2•fc Run 3 (oxygen)
n Run 4
— — Pure Hg (1st expt.)
«- 32010 /T °K
310

BSt
Figure 7. Glass Portion of the System as Userfor Sodium Amalgam Measurements.
V4

Figure 8. Evaporation Rates for Sodium Amalgam.
2.5
2.0
Mcd
<u 1w i .cd(-10O
cd
1,1.0cd
0)
cd
SO.5
00O
0.0
^ ^ ^
'/ I SEE
340 330
• Run 1O Run 2•fc Run 3 (oxygen)Q Run 4
— — — Pure Hg (1st expt.)
4320
105/T °K

Figure 9. lonization Gauge Chart Recording DuringBreak Away of Lithium Amalgam Drop.
VDo
5.0o4J
M-lO
03JJ•H
§ 4.0
3.0o>60
cfl60
CO•H
N•HfiO
2.0
1.0
Expected Course
10
Time (minutes)
15 20
While heating the amalgam from 40° to 55°C in Run 3, a portion of themeniscus broke away and fell into the trap. The instantaneous increasein pressure followed by a pressure decrease is attributed to a reduc-tion in area and healing of the surface film.

Figure 10. Evaporation Rates for Lithium Amalgam. •
2.5
2.0cd0)
c3
w 1 5CO J"3
Co•H-u
& i.o
0)
0.5
00o
0.0
SEE
0 Run 1O Run 2•¥• Run 3 (oxygen)
n Run 4— — — Pure Hg (1st expt.)
340 330I320 . 310
°K

Figure 11. Evaporation Rates for Pure Mercury (0.3 ppm Li)
2.5
CO(U
cfl
.U•HC
JJCO
2.0
1.5
oCLCO
1 1-°1-14-1CO
SO.560O
0.0
SEE
• Run 1
'—-—— pure Hg (1stexpt.)
340 330 320 310
10 /T °K

Figure 12. Evaporation Rates for Mercury and Amalgams.
Sn Li
340 330 320
105/T °K
310

Figure 13. Evaporation Rate Regression Lines (Correctedfor Changes in Gauge Sensitivity).
cfl01
•r*c
Hi4-JCOM
CO
•r-l4Jmi-ioexn)(U
0)S-l
MlO
0.5
0.0
-3.07
-3.57
oO)CO
CM
O
c•r-l
4. 57 1
oCuto
0)
-5.07MO
-5,57
340 330 320 310
10 /T °K

APPENDIX I
SURFACE EXCESS CONCENTRATIONS OF ALKALIMETALS IN AMALGAMS
The surface excess concentration F2 of a solute at the solvent inter-face can be calculated if the relationship between solute concentration C2and surface tension y is known. The calculation makes use of the Gibbsequation
r _ - £2 . ai2 RT dC2
in which R is the gas constant and T is the absolute temperature.
In the case of amalgams, the most comprehensive compilation of surfacetension data is that given by Semenchenko (12). The data presented suggestthat the surface tensions of some 0.001 mole fraction amalgams are (in dynes.cm'1) Sn, 400; Li, 360; Na, 340; K, 280; Rb, 240; Cs, 230. Thus, in thealkali metal series, the surface activity increases with atomic weight,with cesium being very much more surface active than lithium or sodium.
To indicate the surface excess concentration of a 200 ppm solution ofsodium in mercury, the surface tension data of Semenchenko for 25°C may beused:
Na concn.. C2 -y y,calc.(moles/1) (ppm) (dynes/cm) (dynes/cm)
0.00305 5,1 386 3820.00537 9.1 368 3660.0167 28 354 3460.0523 88 328 3380.0911 154 337 336
The data in the third column can, to a sufficiently good approximation, befitted by the hyperbola:
•y - 0.22 + 004C2 + 0.0015
where C2 is in moles/1. Values of 7 calculated using this expression aretabulated in the right hand column of the table to indicate the goodiesof fit. By differention of this expression for 7 with respect to C2, andthen substituting the value of C2 = 0.118 mole/1, it may be calculated thatd 7 /dC2t-15.2 dynes, cm?1 mole"1, liter for a 200 ppm sodium amalgam. Usingthe known values of C2, d7/dC2, R and T in the Gibbs equation, it may becalculated that:
1-1

T2 = 7.3 x 10"11 moles, cm'2
0 °-2= 4.38 x 10'J molecules. A
This0implies that the area occupied per excess sodium §tom in the surface is230 A*. If the effective area of a sodium atom is 10 A^ and if the surfaceexcess is localized in the outermost layer of atoms, then sodium atoms willoccupy about 5% of the total surface area of a 200 ppm sodium amalgam.
1-2

APPENDIX II
MATERIALS
A. Pure Mercury
The mercury used was triple distilled instrument mercury obtained fromthe Bethlehem Apparatus Company*. The supplier's Certificate of Analysisstated that the total residue on evaporation did not exceed one part in tenmillion.
B. Pure Tin
The tin was obtained from the Ventron Company in the form of 0.025 cm(10 mil) wire. The supplier stated the purity to be 99.999% in terms ofmetal content. Inevitably, some contamination, particularly by oxidation,must have occurred during the wire-forming process.
C. Pure Lithium
The lithium was obtained from the Ventron Company in the form of a5.08 cm (2 in) wide, 0.038 cm (15 mil) thick ribbon packed in argon. Thestated purity of the lithium was 99.95% in terms of the metal content, butits dull appearance indicated a quite thick layer of corrosion product,presumably oxide or nitride.
D. Pure Sodium
The sodium was obtained from the Ventron Company in a glass ampoulesealed off under argon. The stated purity of the sodium was 99.95% interms of total impurities. Typical impurity levels of sodium in this formare (in ppm) K, 40; C, 20; Si, 20; 0, 10; Rb, 10; others, less than 5.
E. Pure Oxygen
The oxygen was obtained from the Airco Company in a 1 liter borosilicateglass flask with a break seal. The purity of the oxygen was stated to be99.995%.
F. Standard Solutions
The 1000 ppm standard solutions of tin, sodium and lithium used inanalyses of extracts from the amalgams were obtained from the AztecInstrument Company.
*Supplier's names are given for completeness of description. Their use isnot intended to imply special endorsement of the products.
II-l

APPENDIX III
CALCULATION OF THE MENISCUS SURFACE AREA AND VOLUMEFROM THE MENISCUS HEIGHT
Meniscus Surface Areas
The opening in the precision bore evaporation tube was elliptical sincethe tube was cut off and ground at 45° to its axis (see Figure 4). Measure-ments of the major and minor axes of the ellipse showed them to be 0.488 and0.410 cm, respectively. Except in rare cases, the meniscus was adjusted sothat its base exactly coincided with the elliptical opening in the tube.However, due to the evaporation, the meniscus height could not be held con-stant. It was therefore necessary to find a way of determining the meniscusarea so that changes in area could be taken into account when intercomparingevaporation rates.
Since the base of the meniscus was usually fixed by the tube opening(as in Figure 14(a)), it appeared that the meniscus area should be a func-tion only of the meniscus height. It was then assumed that the meniscuscould be approximated by the unique prolate spheroid sitting on the ellipti-cal tube opening which projected to the meniscus height h above the plane ofthe opening. However, to simplify the calculations of the areas of segmentsof the prolate spheroids above the opening, it was further assumed that theareas of the spheroids were simply related to the areas of the spheres ofthe same heights sitting on a circular base of the same area as the ellipti-cal opening. The exact comparisons between the properties of the spheroidsand the corresponding spheres are summarized in Figure 14. Many of theexpressions listed are well known, e.g., see ref (24), and the others areeasily derived from the standard ones.
Using the known dimensions of the axes of the ellipse and expressionsfrom (6) of Figure 14, it was shown that, when the portion of the spheroidabove the plane xx of the opening was a hemispheroid, its surface area was13% larger than the area of the spherical segment of the same height on abase of the same area. Also, since, for h = 0, the spheroidal and sphericalsurfaces had the same area, it appeared that a reasonable approximation tothe area of the spheroidal segment, height h, up to the height of the hemi-spheroid, would be the area of the spherical segment plus a correction whichincreased linearly from 0 to 13% of its area as h increased from 0 to 0.205cm, the height of the hemispheroid. A similar calculation was made forheights greater than that of the hemispheroid. Here, the area of themeniscus was calculated as the difference between the total area of the com-plete spheroid defined by the elliptical base and height h, and the area ofthe portion of the spheroid below the base; the area of the portion belowthe base was approximated by comparison with the area of a portion of asphere in exactly the same way as described for the smaller menisci. Thederived curve which was used in the work described in this report is shownas Figure 15. The meniscus heights were measured to ± 0.002 cm using acathetometer.
III-l

Figure 14. Relationships between Areas and Volumes of Prolate Spheroidsand Spheres Sitting on a Defined Ellipse or a Circle of EqualArea.
ELEVATION
Prolate Spheroid Sittingon Ellipse (Semi-axes: a,b)
1. Semi-axes of spheroid:A (major), B (minor)
2. Area of ellipse: TTab
3. Height above xx.-- h
4. Expressions for A and B:
5. Area of complete spheroid:
6. (a) Height of hemispheroidsitting on ellipse:
Sphere Sitting on Circle(radius T, where T" .= a b)
1. Radius of sphere: R
2. Area of circle: Tfab
3. Height above xx: h
4. Expressions for R:
5. Area of complete sphere:
6. (a) Area of segment of sphereof height h above xx:
7T
(b) Area of hemispheroid: (b) Area of segment of sphere ofheight b above xx:
7. Volume of complete spheroid: 7. Volume of complete sphere:
8. Volume of hemispheroid, 8. Volume of segment of sphere,height b, sitting on ellipse: height b, sitting on circle:
IIII-2

As an experimental check on the correctness of the surface area calcu-lation, relative evaporation rates for mercury were measured over a range ofmeniscus heights corresponding to areas between 0.19 and 0.25 cm^. It wasfound that, after applying the necessary temperature correction as describedin Appendix IV, the quantity (relative evaporation rate/area x Psat) was aconstant, as it should be, to within about 2%. This test provided evidencethat the combined area and temperature corrections were of the correct orderof magnitude. A similar demonstration of the consistency of the correctionsis given by entries in the last four rows of Table 7. Although the meniscusareas differed by as much as 0.27 cm^ and the meniscus temperatures differedby as much as 3.9°C, the four corrected values all lie close to the regres-sion line of Figure 11 at its upper end.
Meniscus Volume
As mentioned above, the meniscus areas were calculated as the areas ofa portion of a prolate spheroid using the convenient approximation based onthe area of the section of a sphere of the same base area and same height.A similar approach was taken to the calculation of meniscus volumes. Inthis case, the correction needed to deduce the volume of the hemispheroidfrom the volume of the spherical segment of the same base area and sameheight was only about 6%. Once again, the correction was assumed to varylinearly from 0 to 6% as h varied from 0 to 0.205 cm. The curve relatingmeniscus volume to meniscus height is shown as Figure 16. It was used incalculating the change in volume of the meniscus during the volumetricmeasurements of the rate of evaporation of the sodium amalgam.
III-3

Figure 15. Relationship Between Meniscus Height and Area
0.7
0.5
CM
0.3
0.10 0.1 0.2 0.3
h (cm)
Figure 16. Relationship Between Meniscus Height and Volume.
70
60
40
^
>
20
0.1 0.2h (cm)
III-4
0.3

APPENDIX IV
TEMPERATURE CORRECTIONS FOR THE EVAPORATIVE COOLINGOF THE MENISCUS
The evaporation tube and meniscus were as sketched in Figure 17.Although the temperature Tw of the wall at the point of entry of the evapo-ration tube was fixed for each set of measurements, the temperature T atthe evaporation surface was always lower due to evaporative cooling. SinceT could not be measured directly, it was calculated from Tw by applicationof a correction AT. Clearly, AT was directly proportional to the rate ofevaporation and, hence, to the ionization gauge readings of Tables 2, 3, 4,6, and 7.
To find the factor relating gauge reading to AT, the data in Table 7were used. The method was to calculate the temperature differences whichmust have existed between the evaporation surfaces when Tw was nominally25°, 40° and 55° if the relative evaporation rate was proportional tothe saturation vapor pressure. It was then calculated that AT could beexpressed by:
AT = Ionization Gauge Reading (torr) x (-0.124 x 10 )°C.
This relationship was used to correct, all the data in this report.
As a check on the correctness of the expression for AT» the thermalconductivity of the evaporation tube from meniscus to wall was calculated.The calculations were for a 2.6 cm long, straight borosilicate glass tube(0.408 cm. i.d., 0.808 cm o.d.) filled with mercury, the length being theestimated length of the axis of the actual, bent evaporation tube. Thespecific thermal conductivities of the borosilicate glass and mercury weretaken to be 11.7 x 10" joule'Cm~^-sec"^-deg-l and 92 x 10"3 joule-cm'^'sec"^-.deg"^-, respectively (3,23). The thermal conductivity of the filled tube wasthen calculated to be 63 x 10" joule•see"1-deg" . Next, the rate of evapo-ration from a 0.25 cm meniscus at 50°C was calculated from equation (2); itwas 1.7 x 10~4 g.sec"!. Since the heat of vaporization of mercury at 50°Cis 302 joule*g » the heat loss from this meniscus at 50°C could be calculatedto be 5.15 x 10~2 joule-sec"!. The temperature difference, AT, necessary tomaintain this rate of heat flow along the path of the calculated conductancewas 8.2°C. This was in general accord with, but about 15% higher than, thevalues of about 7°C determined by the method previously described. In viewof the inaccuracies in the measurements of the tube geometry, this degreeof agreement is satisfactory.
IV-1

Figure 17. Evaporation Tube Dimensions and Positionin Evaporation Chamber.
\ i.d. 0.408 cm
o.d. 0.808 cm
IV-2

APPENDIX V
ANALYSIS OF AMALGAMS
The concentrations of the amalgams were determined by atomic absorptionspectrophotometry of acid extracts. Since the most suitable concentrationranges for accurate analysis were tin, 0-200 ppm; sodium, 0-3 ppm; andlithium, 0-10 ppm, standard solutions in these ranges were prepared by dis-tilled water dilution of 1000 ppm standard solutions (see Appendix II). Allthe analyses are believed to be correct to within ± 1% of the quantitypresent.
Tin Amalgam
For tin analysis, a weighed quantity of amalgam was mechanicallyshaken with 2 ml of concentrated HC1 for 5 minutes. Then the acid extractand further distilled water washings of the amalgam were combined anddiluted to the 0-200 ppm concentration range. Readings of the spectro-photometer were taken for the extract and for the standard solutions. Fromthe results, the weight of tin in the original weighed quantity of amalgamwas calculated. The completeness of the extraction was confirmed bycarrying out a second extraction on the same sample. In all cases, atleast 99% of the tin was removed in the first extraction.
The effectiveness of the tin extraction procedure was confirmed byapplying it to a tin amalgam of known concentration. The analysis agreedwith the known concentration to within 170.
The results for duplicate samples of the tin amalgam used in theevaporation rate study were 53 ppm and 51.5 ppm.
Sodium Amalgam
The sodium amalgam analysis was carried out in a manner similar tothat for the tin amalgam with a slight difference in the first dilution.A first quick rinse of the amalgam was made using about 5 ml of distilledwater, and then the amalgam was shaken with 2 ml of 3.7 N HC1 for 5 minutes.The acid extract and the distilled water washings were combined and dilutedto the 0-3 ppm concentration range. The results for duplicate samples ofthe sodium amalgam used in the evaporation rate study were 228 ppm and229 ppm.
Lithium Amalgam
The lithium amalgam analysis was performed in a similar manner to thesodium amalgam analysis. The first dilution to the 0-10 ppm concentrationrange included a first quick extraction with 5 ml of distilled water, anacid extraction from shaking the amalgam for five minutes with 2 ml ofconcentrated HC1, and a final extraction with distilled water. Triplicatesamples of the lithium amalgam used in the evaporation rate study gave165 ppm, 165 ppm, and 161 ppm.
V-l

APPENDIX vi
THE EFFECTIVE PRESSURE ABOVE THE MENISCUS IN THEEVAPORATION EXPERIMENTS
To gain an insight into the pressure distribution and flow ofmercury vapor in the evaporation chamber, calculations based on thesituation depicted in the accompanying diagram were carried out. Thisrepresents a mercury meniscus of area A cm and at a temperature T °Cfrom which evaporation is taking place into an otherwise evacuated tube,diameter d. The lower end of the tube is cooled so thatcondensation of the vapor occurs on the tube walls at a distance xbelow the meniscus. The temperature at the point of condensation is T .
, r
The values used in the calculations were, as far as possible, based onmeasured quantities. Thus the internal diameter of the tube was knownto be about 4.6 cm, the distance x as assessed in actual experiments wasabout 12 cm, and, since the mercury condensed as crystals, the temperatureat the point where condensation occurred was less than -38.9°C. The pressureat all points above the level of the meniscus was considered to be at theconstant value P, while the pressure P and the pressures at all pointsbelow the condensation level were negligible (< 4 x 10
Rate of Evaporation
Under these conditions outlined, the total rate of evaporation R from themeniscus could be calculated from equation (3). For pressures given in torr:
R = G-A = 5-833 - 10-2
(Psat - P> g-sec-1
For mercury (M = 200), this expression can be reduced to:
_ 0.825 (Psat - P) A -1Re= (T)* — 8-sec
VI-1

Rate of Flow of Vapor
The rate of flow Q of the mercury vappr from the meniscus level tothe condensation level is given by:
Q = F (P - Pc)
where F is the conductance of the tube (4). For a short tube, F may becalculated from:
F = 3638K (Area)«h£\ 2 cm3 «sec". \M/
where K is a constant dependent on the length-to-radius ratio of the tube.For a tube of radius 2.3 cm, effective length for flow, 12 cm, Clausing'scalculations (4) show K to be 0.31. Therefore, for mercury (M = 200):
F = 1330 (T) cm3.sec"1
and:
j . 3 - 1Q = 1330 (T)2 • (P - P ) torr.cm .sec
4.28 (P - P ) -i= c g-sec
Calculation of P
In the steady state, the rate of flow of vapor down the tube will beequal to the rate of evaporation. By equating Q with R , it may be shownthat:
(P - P ) = 0.193 (Psat - P).. -A
so that P may be calculated if Psat, P , and A are known. Since P isnegligible as compared to P, then P may be written as:
0.193.A.Psat ;
1 + 0.193-A
2Further, if A = 0.25 cm :
P = 0.046 • Psat
2or, if A = 0.50 cm :
P = 0.088 . Psat
Thus, it can be seen that, if A is constant, P is a constant fraction ofPsat. Also, to a good approximation, the ratio P/Psat is proportional tothe meniscus area A. For most of the measurements made in connection with
VI-2

2the present work, A was about 0.25 cm . Thus, these considerations suggestthat P should have been about 1/20 of Psat for most experiments. This wasthe case as can be illustrated with data from the first measurements onpure mercury (Table 1). For the third point of Run 4, the area was0.25 cm , T was 48.0°C and Psat for this temperature is known to be 1.60
(12.0 x 10~3 torr) . The pressure P as deduced from the ionizationgauge reading using the calibration factor of 102 was 8.3 x 10" N/m^(6.2 x 10~4 torr). Thus, the value of P/Psat was 1/19.4 and close to theapproximate value of 1/20. This degree of agreement confirms that themeasured pressures were in the expected range, though the calculations bywhich the ratio P/Psat was deduced cannot confidently be expected to becorrect to within better than about ± 25%. This is because of the diffi-culty of calculating the flow conductance precisely when evaporation istaking place from a point source in a tube which is partially blocked by asmaller tube projecting through its wall.
VI-3

DISTRIBUTION LIST - CR 120884
General Electric CompanyMissile and Space DivisionValley Forge Space Technology CenterP. 0. Box 8555Philadelphia, Pennsylvania 19101Attn: S. Weinberger 1 copy
Hughes Aircraft CompanySpace Systems DivisionLos Angeles, California 90009Attn: R. B. Clark 1 copy
National Aeronautics and Space AdministrationLewis Research Center21000 Brookpark RoadCleveland, Ohio 44135Attn: R. R. Lovell (M.S. 54-3)
J. R. Danicic (M.S. 500-313)S. G. Jones (M.S. 54-3)E. P. Symons (M.S. 500-318)
2 copies1 copy1 copy
30 copies
Poly Scientific DivisionLitton Industries1111 N. Main StreetBlacksburg, Virginia 24060Attn: W. 0'Brian 1 copy
NASA Scientific and Technical Information FacilityBox 33College Park, Maryland 20740Attn: NASA Representative 2 copies
National Technical Information ServiceSpringfield, Virginia 22151 40 copies