Study of Hospital Funding and Payment … of Hospital Funding and Payment Methodologies for Florida...
246
Study of Hospital Funding and Payment Methodologies for Florida Medicaid Prepared for: Florida Agency for Health Care Administration February 27, 2015 navigant.com/healthcare
Transcript of Study of Hospital Funding and Payment … of Hospital Funding and Payment Methodologies for Florida...

Navigant
Study of Hospital Funding and Payment
Methodologies for Florida Medicaid
Prepared for:
Florida Agency for Health Care Administration
February 27, 2015
navigant.com/healthcare

Navigant Page 2 of 246
Table of Contents
1 Executive Summary ............................................................................................................................ 7
1.1 Background ................................................................................................................................. 7
1.2 Hospital Funding ....................................................................................................................... 9
1.2.1 General Revenue .................................................................................................................. 11
1.2.2 Provider Assessment ........................................................................................................... 12
1.2.3 Inter-Governmental Transfers ............................................................................................ 13
1.2.4 Certified Public Expenditures ............................................................................................ 14
1.3 Hospital Payments ................................................................................................................... 15
1.4 Evaluation of Florida Medicaid Hospital Funding and Payment ..................................... 17
1.4.1 Introduction .......................................................................................................................... 17
1.4.2 Florida Medicaid Aggregate Hospital Pay-to-Cost ......................................................... 19
1.4.3 Florida Medicaid Hospital Pay-to-Cost Based on IGT Status ........................................ 20
1.5 Options for Future Hospital Funding and Payment ........................................................... 22
1.5.1 Interaction between Funding and Payment ..................................................................... 22
1.5.2 Combination Funding and Payment Options Offered in this Study ............................ 24
1.5.3 Modifying the Low Income Pool Program ....................................................................... 24
1.5.4 Delivery System Reform Incentive Payment Program ................................................... 25
1.5.5 Medicaid Expansion ............................................................................................................ 26
1.5.6 Constraints for the Various Options.................................................................................. 28
1.6 Conclusion ................................................................................................................................ 28
2 Introduction ....................................................................................................................................... 31
3 Applicable Federal and State Regulations .................................................................................... 37
3.1 Regulatory Summary ............................................................................................................... 37
3.2 State Plans and Waivers .......................................................................................................... 40
3.3 Regulations Related to Medicaid Funding ........................................................................... 41
3.3.1 Inter-governmental Transfers ............................................................................................. 42
3.3.2 Certified Public Expenditures ............................................................................................ 44
3.3.3 Health Care-Related Taxes ................................................................................................. 45
3.4 Regulations Related to Medicaid Payment .......................................................................... 50
3.4.1 Fee for Service Regulatory Environment .......................................................................... 50
Navigant Page 3 of 246
3.4.2 Managed Care Regulatory Environment .......................................................................... 53
3.4.3 Disproportionate Share Hospital Payments ..................................................................... 56
3.4.4 Graduate Medical Education Payments ........................................................................... 58
4 Description of Current Funding and Payment Methods ............................................................ 60
4.1 Introduction .............................................................................................................................. 60
4.2 Low Income Pool Program ..................................................................................................... 60
4.2.1 Overview ............................................................................................................................... 60
4.2.2 History ................................................................................................................................... 63
4.3 Hospital Claim and Supplemental Payment Funding ........................................................ 67
4.3.1 Background ........................................................................................................................... 67
4.3.2 Historical Mix of Funds ....................................................................................................... 67
4.3.3 General Revenue .................................................................................................................. 73
4.3.4 Inter-governmental Transfers ............................................................................................. 76
4.3.5 Certified Public Expenditures ............................................................................................ 80
4.3.6 Hospital Assessment............................................................................................................ 80
4.4 Claim and Supplemental Payments ...................................................................................... 82
4.4.1 Claim Payments.................................................................................................................... 83
4.4.2 Supplemental Payments ...................................................................................................... 85
4.4.3 State Perspective on Waiver Payments ............................................................................. 85
4.4.4 Review of CMS-64 Reports ................................................................................................. 87
5 Analysis of Hospital Funding and Payment Methods ................................................................ 90
5.1 Introduction .............................................................................................................................. 90
5.2 Methodology ............................................................................................................................. 90
5.3 Adequacy .................................................................................................................................. 92
5.4 Sustainability ............................................................................................................................ 94
5.5 Accountability .......................................................................................................................... 96
5.6 Equity ......................................................................................................................................... 97
5.6.1 Introduction .......................................................................................................................... 97
5.6.2 Equity in Payments by Service ........................................................................................... 98
5.6.3 Equity in Payments Across Hospitals ............................................................................. 100
5.6.4 Equity in Funding Across Medicaid Programs ............................................................. 110
5.7 Conclusion .............................................................................................................................. 115
Navigant Page 4 of 246
6 Medicaid Expansion ....................................................................................................................... 116
6.1 Introduction ............................................................................................................................ 116
6.2 Background on Medicaid Expansion .................................................................................. 117
6.3 Florida’s Current Stance on Medicaid Expansion ............................................................. 118
6.4 Proposed Medicaid Expansion Outcomes .......................................................................... 119
6.4.1 Access to and Use of Medical Care .................................................................................. 119
6.4.2 Health Outcomes ................................................................................................................ 120
6.4.3 Impact on Providers........................................................................................................... 122
6.4.4 Financial/Economic Implications ..................................................................................... 122
6.5 Enrollment and Cost Estimates for Medicaid Expansion in Florida .............................. 123
6.6 Potential Savings and Offsetting Revenue Increases from Expansion ........................... 125
6.6.1 Potential Reductions in State Cost from Expansion ...................................................... 125
6.6.2 Potential Increases in Revenue from Expansion ............................................................ 126
6.7 Alternatives to Medicaid Expansion ................................................................................... 126
6.8 Medicaid Expansion Conclusion ......................................................................................... 130
7 Delivery System Reform Incentive Payment Programs ............................................................ 132
7.1 Introduction ............................................................................................................................ 132
7.2 Background on 1115 Demonstration Waivers ................................................................... 133
7.3 Key Components of DSRIP Programs ................................................................................. 133
7.3.1 Eligible Providers ............................................................................................................... 133
7.3.2 Projects and Organization ................................................................................................. 134
7.3.3 Financing ............................................................................................................................. 137
7.4 Challenges with DSRIP Programs ....................................................................................... 138
7.4.1 Dynamic DSRIP Requirements ........................................................................................ 138
7.4.2 Lengthy Implementation Time ........................................................................................ 139
7.4.3 Administrative Complexity .............................................................................................. 140
7.5 Comparison of LIP and DSRIP ............................................................................................. 140
7.5.1 LIP Demonstration Years 1 Through 5 ............................................................................ 140
7.5.2 LIP Demonstration Years 6 Through 8 ............................................................................ 141
7.5.3 AHCA Proposal for LIP Demonstration Years 9 Through 11 ...................................... 142
7.6 DSRIP Conclusion .................................................................................................................. 143
8 Survey of Other Medicaid Programs ........................................................................................... 145

Navigant Page 5 of 246
8.1 Introduction ............................................................................................................................ 145
8.1.1 Purpose of Survey .............................................................................................................. 145
8.1.2 State characteristics reviewed (specifically reviewing and why relevant) ................ 145
8.1.3 States selected for Survey .................................................................................................. 146
8.1.4 Survey Method ................................................................................................................... 147
8.2 Summary of states and findings .......................................................................................... 148
9 Options for Florida Medicaid to Consider .................................................................................. 161
9.1 Introduction of Options......................................................................................................... 161
9.2 Current Upper Payment Limit Gap..................................................................................... 161
9.3 Options for Funding Sources................................................................................................ 164
9.3.1 Increase Current Assessment ........................................................................................... 164
9.3.2 Increase General Fund Revenue ...................................................................................... 167
9.3.3 Managed Care Assessment ............................................................................................... 168
9.3.4 Continue Inter-Governmental Transfers ........................................................................ 174
9.3.5 Medicaid Expansion – Funding ....................................................................................... 175
9.3.6 Certified Public Expenditures .......................................................................................... 176
9.3.7 Designated State Health Program ................................................................................... 179
9.4 Options for Payment Methods ............................................................................................. 180
9.4.1 Continue the LIP Program ................................................................................................ 180
9.4.2 Increase Medicaid Fee-for-Service Program Rates and Medicaid Managed Care
Capitation Rates .............................................................................................................................. 181
9.4.3 Delivery System Reform Incentive Payment Program ................................................. 184
9.4.4 Medicaid Expansion – Payments ..................................................................................... 185
9.4.5 Upper Payment Limit Program for Fee-for-Service Eligibles ...................................... 186
9.4.6 Graduate Medical Education ............................................................................................ 187
9.4.7 Disproportionate Share Hospital Payments ................................................................... 190
9.4.8 Uncompensated Care Pool ............................................................................................... 191
9.4.9 Physician Supplemental Program ................................................................................... 192
9.4.10 Transition Period ............................................................................................................ 194
9.5 Combination of Various Options ......................................................................................... 194
9.5.1 Introduction ........................................................................................................................ 194
9.5.2 Increase in Broad-Based Funding and Increased Rates ................................................ 197
9.5.3 Continued Use of IGTs and a DSRIP Program .............................................................. 199

Navigant Page 6 of 246
9.5.4 Medicaid Expansion with Either a Broad-Based Funding Increase or IGTs ............. 203
9.5.5 Partial Implementation of Funding Options .................................................................. 204
10 Evaluation of Options for Consideration for Florida Medicaid .......................................... 205
11 Conclusion .................................................................................................................................. 209
12 Appendices ................................................................................................................................. 213
12.1 Appendix A – Definitions and Acronyms .......................................................................... 213
12.2 Appendix B – Description of Alternative LIP Programs .................................................. 216
12.3 Appendix C – Summary of Tier – Two Milestones Defined in 2011 Waiver STCs ...... 218
12.4 Appendix D – Hospital Payments ....................................................................................... 224
12.5 Appendix E – Hospital Cost ................................................................................................. 234
12.6 Appendix F – Waiver for Health Care-Related Taxes ...................................................... 243
12.6.1 Overview of Waivers ..................................................................................................... 243
12.6.2 Waiver Of Broad-Based Requirement Only (“P” Values) ........................................ 243
12.6.3 Waiver Of Uniform Tax Requirement (“B” Values).................................................. 245

Navigant Page 7 of 246
1 Executive Summary
1.1 Background
Since the approval of its Medicaid Reform 1115 Waiver in 2005, the State of Florida has
significantly expanded its Medicaid managed care program, representing a major transition
from traditional Medicaid fee-for-service payment. During 2014, this Medicaid managed care
transition was accelerated and included rollout of mandatory managed care enrollment for
nearly all Medicaid recipients throughout the state. In contrast to state fiscal year (SFY) 2005/06,
when managed care payments comprised approximately 13 percent of Medicaid payments, the
Florida Agency for Health Care Administration (AHCA) estimates that by SFY 2015/16, 85
percent of all Florida Medicaid recipients will be enrolled in managed care plans and 65 percent
of Medicaid payments will be made for services provided to recipients enrolled in Medicaid
managed care.
Prior to the Medicaid Reform waiver, Florida Medicaid distributed payments annually
(approximately $660 million in SFY 2005/06) to hospitals in the form of supplemental payments.
These payments were made through the Upper Payment Limit (UPL) program which allows
supplemental payments to be made to a Medicaid provider based on the difference between the
amount paid in standard payment rates and a maximum amount referred to as the “Upper
Payment Limit.” However, federal regulations specify that standard UPL payments are
allowed only for services provided through a traditional Medicaid fee-for-service program, and
not through managed care. As such, the transition from fee-for-service to managed care had the
potential to significantly reduce the amount of funds Florida Medicaid could pay to providers
through supplemental payments because of standard (non-waiver) federal regulations related
to Medicaid supplemental payments. In other words, the transition from fee-for-service to
managed care made it necessary for Florida Medicaid to find another way to continue making
these supplemental payments.
To enable continued supplemental payments with the transition to Medicaid managed care, a
new program was defined within the 2005 1115 demonstration waiver called the Low Income
Pool (LIP) program. The LIP program was “established to ensure continued government
support for the provision of health care services to Medicaid, underinsured and uninsured
populations.”1 As originally defined, the LIP program was limited to $1 billion in total
payments each year. In addition to replacing the UPL supplemental payment program, the LIP
program increased total annually dispersed funds by approximately $300 million and increased
the list of providers available to receive supplemental payments. Under the former UPL
program, supplemental payments were only made to acute care hospitals. In contrast under the
LIP program, supplemental payments could be made to a variety of provider types and in
practice have been made to acute care hospitals, Federally Qualified Health Centers (FQHCs)
and Community Health Departments (CHDs).
1 Centers for Medicare and Medicaid Services, Special Terms and Conditions for Florida Medicaid Reform Section 1115
Demonstration, Document number 11-W-00206/4, (2005).

Navigant Page 8 of 246
The LIP program has been an approved component of the State’s 1115 demonstration waiver
through June 30, 2014. In 2014, when the mandatory Medicaid managed care portion of the
waiver was renewed for an additional three years, the LIP program was only renewed for one
more year. Included in this one-year renewal was a shift of self-funded inter-governmental
transfer (IGT) rate enhancements (totaling $963 million annually) and the teaching physician
supplement payment program (totaling $204 million annually) into the LIP program. These
funds transitioning into the LIP program were in addition to the traditional $1 billion cap
previously available through LIP. Thus in this renewal year, SFY 2014/15, a total of nearly $2.2
billion will be distributed as supplemental payments through LIP.
Also included in CMS’s Special Terms and Conditions (STCs) for the 2014 waiver renewal was a
requirement for AHCA to contract with an independent consultant to conduct a review of the
state’s funding and payment mechanisms. The intent of this study is to suggest “sustainable,
transparent, equitable, appropriate, accountable, and actuarially sound Medicaid payment
systems and funding mechanisms that will ensure quality health care services to Florida’s
Medicaid beneficiaries throughout the state without the need for Low Income Pool (LIP)
funding.”2 (emphasis added by Navigant) To do this, the STC’s outlined several key
requirements. The report must:
Include detailed information on the historical methods of funding hospital payments,
the interaction between state funded payments and provider funded payments, and
describe the composition of payments, including base and supplemental payments.
Analyze the adequacy of current payment levels for Medicaid providers, and the
adequacy, equity, accountability and sustainability of the state’s funding mechanisms
for these payments. The report must primarily focus on the types of providers
supported by IGT or LIP funds.
Include an analysis of how future changes in Medicaid, including possible Medicaid
expansion would affect Medicaid payment amounts and structure, including fee-for-
service payments, managed care, and LIP.
Recommend reforms to the Florida Medicaid financing system that can allow the state,
beginning in state fiscal year 2015-2016, to move toward Medicaid fee-for-service and
managed care payments to providers that ensure access and quality of care for Medicaid
beneficiaries without the need for LIP funds. These payments should be based on a
rationalized, non-facility specific payment mechanism, which can be applicable to future
changes in Medicaid including Medicaid expansion. This type of rationalized payment
2 Centers for Medicare and Medicaid Services, Special Terms and Conditions for Florida Medicaid Reform Section 1115
Demonstration, Document number 11-W-00206/4, (2014).

Navigant Page 9 of 246
mechanism would not include payment based on facility specific costs or local tax
revenue and would discontinue incentive payments through the LIP.
In addition, the 2014 Legislature included proviso language in the 2014/15 General
Appropriations Act stating additional requirements of the report including:
Identify federal regulations on the following: IGTs, including their sources, uses, and
allowable repayment arrangements; supplemental hospital payments, including
allowable types, purposes, and payees; and direct provider payments that are allowed
within Medicaid programs that are based primarily on risk-bearing managed care plans.
Identify other states’ uses of IGTs and supplemental hospital payments, including:
arrangements for incenting or requiring IGTs; methods of payment, particularly in states
with high managed care penetration; and specific federal waiver terms and conditions
that apply to IGTs and supplemental hospital payments.
AHCA engaged Navigant Consulting, Inc. (Navigant) to perform this study. A draft of the
resulting report is due to CMS no later than January 15, 2015 with the final report due March 1,
2015.
This study deals primarily with funding and payment made through the LIP program. The vast
majority of funds for the LIP program come from inter-governmental transfers (IGTs) made in
the names of specific hospitals. In addition, the vast majority of payments made through the
LIP program are made to acute care hospitals. As a result, the study has a very strong focus on
Florida Medicaid hospital reimbursements and the funds gathered to enable those
reimbursements. In addition, the study considers hospital costs for care of uninsured and
under-insured as well as Medicaid reimbursements for these patients which come from
Disproportionate Share Hospital (DSH) payments and from a portion of payments made
through the LIP program.
1.2 Hospital Funding
At a high level, funds that pass through a Medicaid program for payment for health care
services for Medicaid recipients, the uninsured, and the underinsured, can be categorized as
either “state share” or “federal share.” For every dollar spent, a certain percentage of that dollar
comes from the state share and the rest from the federal share. For the State of Florida, the
blended state share percentage has been in the low forties or high thirties over the last few
years. The federal share has been in the high fifties or low sixties over that same time period. In
state fiscal year 2014/15, for example, the state share percentage is 40.44 percent and the federal
share percentage is 59.56 percent. This means for every dollar spent by the Medicaid Agency in
SFY 2014/15, 40.44 cents come from state resources and 59.56 cents come from federal resources.
Another way to think of this is that $1.00 in state funds in SFY 2014/15 yields $2.47 in total funds
for the Medicaid program (1 / 0.4044 = $2.47).
Navigant Page 10 of 246
Prior to 1986, the entire state share of funds used for payments to hospitals under the Medicaid
program came from state general revenue. Starting in 1986 and continuing in subsequent years,
a variety of legislation has been passed which has slowly reduced the percentage of the state
share of hospital funding coming from general revenue and replaced that money with funds
from other sources. Those other sources are generated through a provider assessment and
IGTs. To a small degree, Florida Medicaid also utilizes certified public expenditures (CPEs).
For a recent five year period, the percentages of funding for Florida Medicaid hospital
reimbursement from each of the various sources are shown in Figure 1 below.
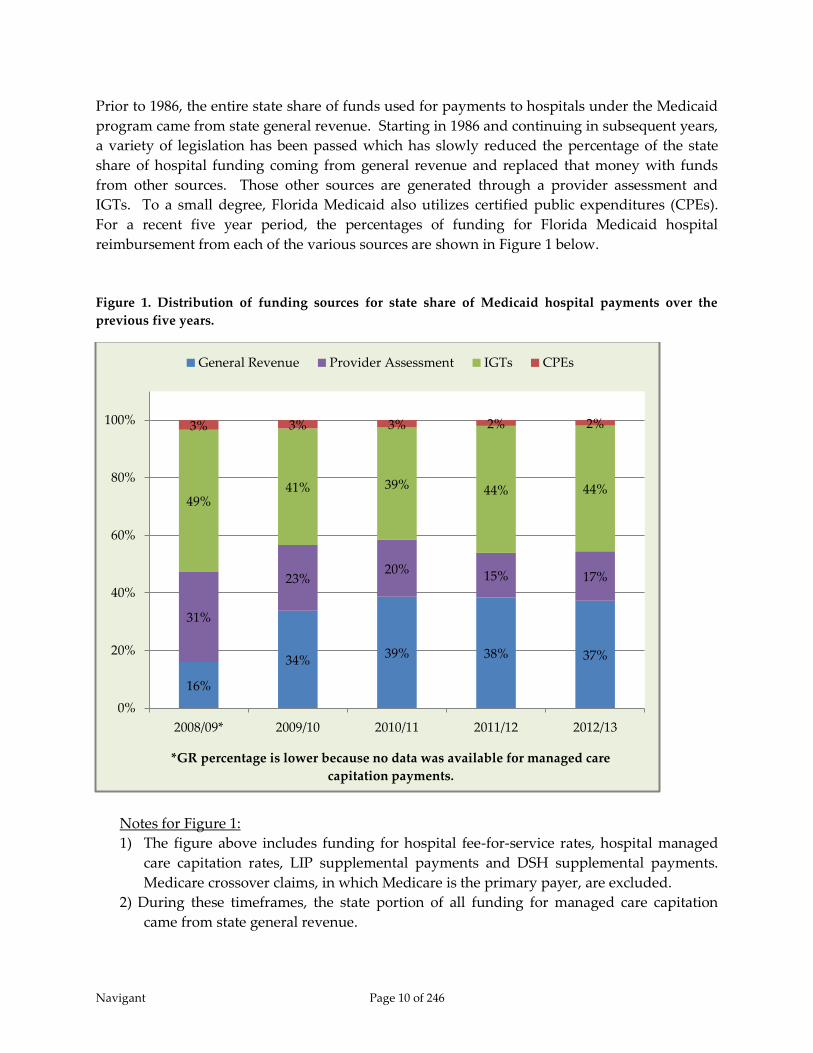
Figure 1. Distribution of funding sources for state share of Medicaid hospital payments over the
previous five years.
Notes for Figure 1:
1) The figure above includes funding for hospital fee-for-service rates, hospital managed
care capitation rates, LIP supplemental payments and DSH supplemental payments.
Medicare crossover claims, in which Medicare is the primary payer, are excluded.
2) During these timeframes, the state portion of all funding for managed care capitation
came from state general revenue.
16%
34% 39% 38% 37%
31%
23% 20%
15% 17%
49% 41% 39% 44% 44%
3% 3% 3% 2% 2%
0%
20%
40%
60%
80%
100%
2008/09* 2009/10 2010/11 2011/12 2012/13
*GR percentage is lower because no data was available for managed care
capitation payments.
General Revenue Provider Assessment IGTs CPEs
Navigant Page 11 of 246
3) Expenditures in SFY 2008/09 are understated because hospital managed care
expenditures were not available for this year.
1.2.1 General Revenue
Funds coming from state general revenue offer Medicaid agencies significant flexibility in how
provider reimbursements can be designed. In addition, federal regulations require at least 40
percent of funding for Medicaid programs come from state general revenue. In the State of
Florida, general revenue constitutes 61 percent, more than half, of the total state share when
looking at the overall Medicaid program, including payment for all health care services, such as
hospital, nursing home, physician, pharmacy, school programs, etc. However specifically for
hospital reimbursement, funds from general revenue constitute 37 percent, less than half, of the
total state share. In SFY 2012/13, general revenue contributed just over $1 billion towards
funding Medicaid hospital reimbursements and $4.9 billion towards funding the entire
Medicaid program, overall.3
The state general revenue used to fund the Medicaid program is not spread evenly across the
various types of providers and types of services offered to Medicaid recipients. General
revenue as a percentage of total state share varies by type of service anywhere from 100 percent
of the funding at the high end of the range down to 23 percent at the low end of the range.
General revenue funding for hospital services is at the low end of the range. This can be seen in
Figure 2 below.
3 Numbers generated from Florida Social Services Estimating Conference, August 2014, “Long-Term Medicaid Services
and Expenditures Forecast,” plus AHCA reports of payments for hospital services provided to Medicaid recipients in
managed care plans.

Navigant Page 12 of 246
Figure 2. Percentage of state share from general revenue by type of service in SFY 2012/13.
Specifically for hospital reimbursements, state general revenue is used primarily to fund
inpatient and outpatient rates, distributed through fee-for-service claim payments, and to fund
managed care capitation payments. General revenue also funds very small portions of
supplemental payments made within the LIP and DSH programs.
1.2.2 Provider Assessment
The provider assessment in Florida is referred to as the Public Medical Assistance Trust Fund
(PMATF), and includes a 1.0 percent assessment of hospital outpatient net operating revenue
and a 1.5 percent assessment of hospital inpatient net operating revenue. This is a mandatory
program, as defined in Florida statute. In SFY 2012/13, nearly $470 million was collected
through the PMATF program, which drew down over $641 million in federal matching funds,
resulting in a total of $1.1 billion in funds available for Medicaid reimbursements. These funds
are combined with general revenue funds and used to reimburse hospitals through fee-for-
service claim rates and managed care capitation rates.
In a majority of cases, the cost of the assessment is paid back to providers through an increase in
the Medicaid reimbursement rate, but consistent with the federal redistributive and hold
harmless provisions of health care-related tax programs, not all hospitals get back all that they
were assessed. Hospitals with very low Medicaid volume may not receive as much in increased
rates as they paid out through the assessment.
0% 10% 20% 30% 40% 50% 60% 70% 80% 90% 100%
Managed Care
Supplemental Medical Insurance
Therapies
Other Outpatient Services
Physician
Miscellaneous
Specialty Mental Health
Nursing Home
Pharmacy
Home and Cmnty Based Svcs
Other Assisted Care Services
Hospital

Navigant Page 13 of 246
1.2.3 Inter-Governmental Transfers
Inter-governmental transfers (IGTs) are transfers of funds from a non-Medicaid governmental
entity (e.g., counties, hospital taxing districts, providers operated by state or local government)
to the Medicaid agency. As long as the funds collected through IGTs are used in ways that
comply with federal regulations, they may be used to draw down federal matching funds.
“Federal policy regarding both the permissible sources of non-federal Medicaid expenditures
and federal contributions toward those expenditures dates to Medicaid’s 1965 enactment. Prior
to 1965, health care services for low-income individuals were provided primarily through a
patchwork of programs sponsored by state and local governments, charities, and community
hospitals. … While the administration of each state’s Medicaid program was required to be
centralized at the state level, federal provisions allowed the pre-existing patchwork of programs
to maintain primary responsibility for service delivery and non-federal financing of services
that now qualified for federal payments.”4
In Florida, IGTs are used to help fund hospital rate payments (inpatient and outpatient), the LIP
program, the DSH program, and the physician supplemental payment program. In SFY
2014/15, for example, AHCA anticipates receiving a little over $1.3 billion5 in IGTs resulting in
nearly $3.3 billion in reimbursements when combined with federal matching funds. 43 non-
Medicaid governmental entities are expected to contribute IGTs, and the State plans to spread
these funds (along with related federal matching funds) across approximately 140 hospitals, 7
medical schools, and 60 non-hospital facilities (primarily FQHCs and CHDs).
Despite the significant sums of money and numbers of health care facilities benefiting from IGT
funds, IGTs are optional contributions. Generally, governmental agencies cannot be legally
obligated to contribute IGTs towards the state Medicaid program. To ensure continued
contribution of IGT funds, payment methods are devised in ways that ensure a return on
investment for funds contributed. IGT contributors, most of which are county governments and
hospital taxing districts, contribute money in the names of hospitals within their jurisdiction.
Medicaid payment methods ensure payments to these named hospitals offer more value than
would be afforded through keeping the funds within their local districts. This is possible
because of the fact that the IGT funds draw down federal matching funds resulting in enough
total dollars to offer a return on investment to the named hospitals and still have additional
funds available to distribute amongst other hospitals and some non-hospital providers.
In previous years and in the current year (SFY 2014/15), IGTs fund nearly the entire state share
of the traditional $1 billion LIP program and over 60 percent of the state share of the DSH
program. Prior to SFY 2014/15, IGTs also funded approximately 40 percent of fee-for-service
claim payments and did not fund any managed care capitation payments. Beginning in SFY
4 Medicaid and CHIP Payment and Access Commission (MACPAC), “Report to the Congress on Medicaid and CHIP,”
(March 2012). 5 The Florida Legislature, “Medicaid Hospital Funding Programs Fiscal Year 2014-2015 – Final Conference Report for House
Bill 5001,” (April 29, 2014).

Navigant Page 14 of 246
2014/15, these percentages changed. Self-funded IGTs were moved from claim payments into
the LIP program. In addition, funds collected through IGTs for automatic rate enhancements
now fund both fee-for-service rates and managed care capitation rates. As a result of these
changes, in SFY 2014/15 IGTs fund approximately 27 percent of hospital fee-for-service rates,
and approximately 27 percent of the hospital portion of managed care capitation rates. In
addition, IGTs fund 100 percent of the state share of LIP-6, which was formerly known as self-
funded IGTs. Also, beginning on January 1, 2014, IGTs fund the state share for the teaching
physician supplemental payment program.
The payment methods designed to incent contribution of IGTs have evolved over time to be
relatively complicated within the State of Florida. The payment methods are discussed in
section 1.3 – Hospital Payments of the Executive Summary and discussed in greater detail in
section 4.4 – Claim and Supplemental Payments. It should be noted that, although the
distribution of IGT funds benefits many health care facilities whose local governments do not
contribute any IGTs, by far, greater financial benefit is provided to hospitals located in regions
in which local government agencies are contributing IGTs.
Not all IGTs are contributed by hospitals. Many are contributed by local governmental
agencies. However, the IGTs contributed for the LIP program, automatic rate enhancements,
and self-funded rate enhancements are all donated in the names of specific hospitals. In this
study, those IGTs are treated as donations from the named hospitals under the assumption that
the local governments would find ways to contribute those funds directly to the named
hospitals if they were not contributed as IGTs to the Medicaid agency.
1.2.4 Certified Public Expenditures
Certified public expenditures (CPEs) are expenditures made by a governmental entity,
including a provider operated by state or local government, under the state’s approved
Medicaid state plan, for health care services provided to Medicaid recipients. The public
provider of service certifies the uncompensated cost of services rendered to eligible individuals.
The Medicaid agency records the certified expenditures and draws the Federal share of the
expenditure from CMS.
Florida Medicaid utilizes CPEs to help fund Medicaid payments for school-based services,
hospital disproportionate share payments, and historically for physician supplemental
payments. In SFY 2012/13, CPEs comprised 100 percent of the state share of funding for school-
based Medicaid services, 34 percent of the state share for DSH payments and 100 percent of the
state share for physician supplemental payments. In terms of hospital reimbursements overall,
CPEs comprised two percent of total state funding. Beginning January 1, 2014, this percentage
has dropped slightly as funding for the physician supplemental payment program has shifted
from CPEs to IGTs.
Navigant Page 15 of 246
1.3 Hospital Payments
Payments to hospitals are generally made by the Florida Medicaid Agency in four forms, 1)
claim payments for health care services provided to Medicaid fee-for-service recipients; 2)
capitation payments to Medicaid managed care organizations, which in turn, pay hospitals for
services provided to Medicaid managed care recipients; 3) quarterly supplemental payments
determined through the LIP program; and 4) quarterly DSH payments determined through the
DSH program. Fee-for-service claim payments and Medicaid managed care capitation
payments are both intended to compensate providers for services offered to recipients eligible
for Medicaid health benefits. In contrast, DSH payments are intended to compensate providers
for costs associated with caring for a high proportion of uninsured recipients (often referred to
as “uncompensated care”) and Medicaid shortfall. Similarly, payments made through the LIP
program are intended to compensate providers for both services offered to uninsured and
underinsured recipients as well as help cover shortfalls between Medicaid payments and
provider costs incurred from caring for Medicaid eligible recipients.
Fee-for-service hospital claim payments and managed care capitation rates are funded through
a combination of general revenue, provider assessment revenue, and automatic rate
enhancement IGTs. Payments made through the LIP program are funded almost entirely
through IGTs. Funding for the DSH program is a combination of IGTs and CPEs.
As mentioned previously, Florida Medicaid has developed payment methods which ensure
return on investment for contributors of IGTs. This is done primarily in two ways. First, most
IGT funds collected for the traditional $1 billion LIP program and for automatic rate
enhancements are summed together. Hospitals in whose names these funds are contributed
receive supplemental payments through the traditional $1 billion LIP program that equal 108.5
percent of the contribution amounts (8.5 percent return on investment). This return on
investment is documented within the LIP program as the “LIP Allocation Distribution,” and
comprises a majority of the funds distributed through the traditional $1 billion LIP program.
For example in SFY 2014/15, approximately $745 million will be contributed through IGTs to
help fund the LIP program and automatic rate enhancements. Of this amount, $689 million was
considered “above the line” and eligible for the 108.5% LIP Allocation Factor. This results in
$748 million expected to be allocated through the LIP Allocation Distribution, which means
only $252 million is available through the waiver program to fund safety net hospitals,
uncompensated care, and various initiatives intended to improve the delivery of health care to
Florida Medicaid recipients. Thus, despite being a $1 billion program, only 25 percent of that
money has been made available for discretionary distribution.
The second guaranteed return on investment occurs for LIP-6 funds, which were referred to as
self-funded IGTs prior to SFY 2014/15. IGT contributors have the option to designate their

Navigant Page 16 of 246
funds to be applied to traditional LIP and automatic IGT rate enhancements or to LIP-66. Funds
designated to LIP-6 provide contributors approximately 147 percent return on investment as the
hospitals named for these contributions receive back the IGT contribution (the state share) plus
all of the associated federal matching funds.
The total amount of money Florida Medicaid may spend within each of these programs is finite.
Each is controlled through federal regulation or state regulation, or both. The state share, total
funds payable (total computable), distribution determination, and funding limitation for each
program are depicted in Figure 3 below.
Figure 3. Distribution of IGT funds by Florida Medicaid.
Traditional7 $1 Billion LIP Program
IGTs available for LAD: $350 million
IGTs not available for LAD8: $56 million
State share from general rev: $9 million
Total state share for LIP: $415 million
Total computable: $1 billion
Funding Limitation(s): 1115 demonstration
waiver
The $1 billion is distributed as follows:
LIP Allocation Distr. (LAD): $748 million
Distribution Determination: 108.5 percent of IGT
contributions for
rate enhancements
and a portion of LIP
($689 million)9
Discretionary Distribution: $252 million
Distribution Determination: LIP Council and
Florida Legislature
Rate Enhancements
State Share from IGTs:
IGTs for “auto” rate enh.: $312 million
IGTs for “Statewide issues”: $23 million
IGTs for Liver global fee: $4 million
Total IGTs for rate enh.: $339 million
State GR for rate enh.: $10 million
Total state share for rt enh: $349 million
Total Computable: $863 million
Distribution Determination: LIP Council and
Florida Legislature
Funding Limitation(s): UPL regulations and
Florida Legislative
authority
6 IGT contributors also have the option to designate their funds be applied to the DSH program, the teaching
physician supplemental payment program, or two other smaller sub-programs within the traditional $1 billion LIP
program. 7 In this document, the “traditional $1 billion LIP program,” refers to the LIP program originally defined in the 2005
1115 demonstration waiver. 8 IGTs which contribute to Alternative LIP programs are considered “below the line” and are not eligible for the LIP
Allocation Distribution. 9 IGTs contributed for rate enhancements plus IGTs contributed for all portions of LIP except Alternative LIP are
consider “above the line” and are eligible for the LIP Allocation Distribution.

Navigant Page 17 of 246
LIP-6 (Formerly Self-Funded IGTs)
IGTs: $390 million
Total computable: $963 million
Distribution Determination: All IGT and federal
matching funds paid
to named hospital
Funding Limitation(s): 1115 demonstration
waiver and Florida
Legislative authority
DSH Program
State share: $146 million
Total computable: $362 million
Distribution Determination: Formula defined in
State Plan
Funding Limitation(s): Federal Medicaid
DSH cap for State of
Florida and
individual hospital
DSH limits
Teaching Physician Supplemental Program
IGTs: $82 million
Total Funds in SFY 2014/15: $204 million
Distribution Determination: Based on historical
number of Medicaid
encounters
Funding Limitation(s): 1115 demonstration
waiver
Legend:
- state share affecting LIP Allocation Distribution
- funds distributed through the 1115 waiver
In addition to the guaranteed returns mentioned above, some hospitals and, to a smaller extent,
FQHCs and CHDs receive additional benefit from funds contributed to the traditional $1 billion
LIP program and to automatic rate enhancements. Funds that are not paid out through the LIP
Allocation Distribution are distributed to these health care facilities a through complex set of
policies and regulations designed to provide benefit for facilities considered to be most critical
to the Medicaid program. In recent years, just under $900 million has been available annually
for more discretionary distribution designed to promote Medicaid program goals.
In SFY 2014/15, fee-for-service and managed care claim payments, which are utilization based,
constitute roughly two-thirds of the Medicaid payments made to hospitals. The other third of
hospital reimbursements come from supplemental payments, primarily through the LIP
program (a total of nearly $2.2 billion in SFY 2014/15). In addition, the distribution of funds
originating from IGTs is designed in such a way that those hospitals with access to an IGT
contributor are clearly reimbursed at higher levels than those who do not have access to IGTs.
1.4 Evaluation of Florida Medicaid Hospital Funding and Payment
1.4.1 Introduction
One of the most fundamental and commonly quoted regulations within the Social Security Act
is section 1902(a)(30)(A) which says,

Navigant Page 18 of 246
“A state plan for medical assistance must provide such methods and procedures relating
to the utilization of, and the payment for, care and services available under the plan … as
may be necessary to safeguard against unnecessary utilization of such care and services
and to assure that payments are consistent with efficiency, economy, and quality of care
and are sufficient to enlist enough providers so that care and services are available under
the plan at least to the extent that such care and services are available to the general
population in the geographic area.”10
This regulation indicates Medicaid agencies must define policies and payment levels in a way
that balances competing goals of access to care along with efficiency and economy with
safeguards against unnecessary utilization.
One seemingly reasonable measure of adequate payment would be a comparison of payments
to the cost to render care to a Medicaid recipient. In order to remain in operation, hospitals, like
any other businesses, must receive enough income to cover all expenses including items such as
labor, facilities, and equipment. In addition, it is critical for all hospitals to be able to generate
some margin over the cost of operations – for-profit hospitals need to satisfy investors and stock
holders, and both for-profit and not-for-profit hospitals need to fund the replenishment of
operating infrastructure and capital. Thus, paying hospitals an amount equal to their costs or at
least equal to reasonable market value for services provided, if such a number can be defined,
would be one way to measure payments. In fact, in Medicaid Upper Payment Limit analyses,
for example, hospital cost is accepted as a proxy for Medicare payment and can be used as the
Upper Payment Limit or maximum allowable reimbursement amount. Note however, that
CMS does not consider operating margin to be a reasonable and necessary cost of providing
services. In addition, payment levels simply based on cost offer no incentive for hospitals to
control costs. Thus, purely cost-based payments do not promote efficiency and economy.
In truth, defining adequate payment levels is not a precise science. Medicaid agencies
commonly pay less than full hospital cost and, yet, hospitals remain open and continue to
accept Medicaid patients. Traditionally, the assumption has been that hospitals are able to
achieve or maintain sufficient operating margin by balancing relatively low revenues received
from Medicaid with higher revenues received from commercial insurance companies. This
phenomenon is referred to as “cost-shifting,” and is more of a theoretical exercise than an actual
function performed by hospital accountants. Cost shifting is relatively easy to do for hospitals
with a small amount of their business coming from Medicaid and uninsured patients. On the
opposite side, cost shifting is more difficult for hospitals with a relatively high percentage of
their business coming from Medicaid and uninsured patients. Note also that while it is CMS’
intent that the Medicare program pay for the reasonable and necessary costs of providing
services to the Medicare population, critics of the Medicare program argue that such is not the
case. As such, the Medicare program also contributes to the need for hospitals to “cost-shift.”
10 The Social Security Act, section 1902(a)(30)(A).

Navigant Page 19 of 246
1.4.2 Florida Medicaid Aggregate Hospital Pay-to-Cost
Overall pay-to-cost ratios for hospital services provided to Medicaid and uninsured recipients
in Florida in SFY 2012/13 are shown in Table 1 below. As shown in this table, we compare
payments to costs in two ways for the Medicaid program by itself, and in two ways for a
combination of the Medicaid program combined with care for uninsured and underinsured
patients (referred to in the table as “uncompensated care”). For the Medicaid program alone,
aggregate pay-to-cost ratios were calculated with and without inclusion of LIP payments. For
the combination of Medicaid recipients and the uninsured, pay-to-cost ratios were calculated
with and without inclusion of provider assessment fees and IGTs subtracted for hospital
payments to estimate net hospital revenue. Under guidelines defining upper payment limit and
DSH limit calculations, provider assessment fees and IGT contributions are not considered to be
valid hospital costs. At the same time, provider assessment fees and IGTs coming from
hospitals are included in Medicaid payments back to hospitals. Thus, true net revenue to
hospitals should take these hospital outlays into consideration.
Navigant Page 20 of 246
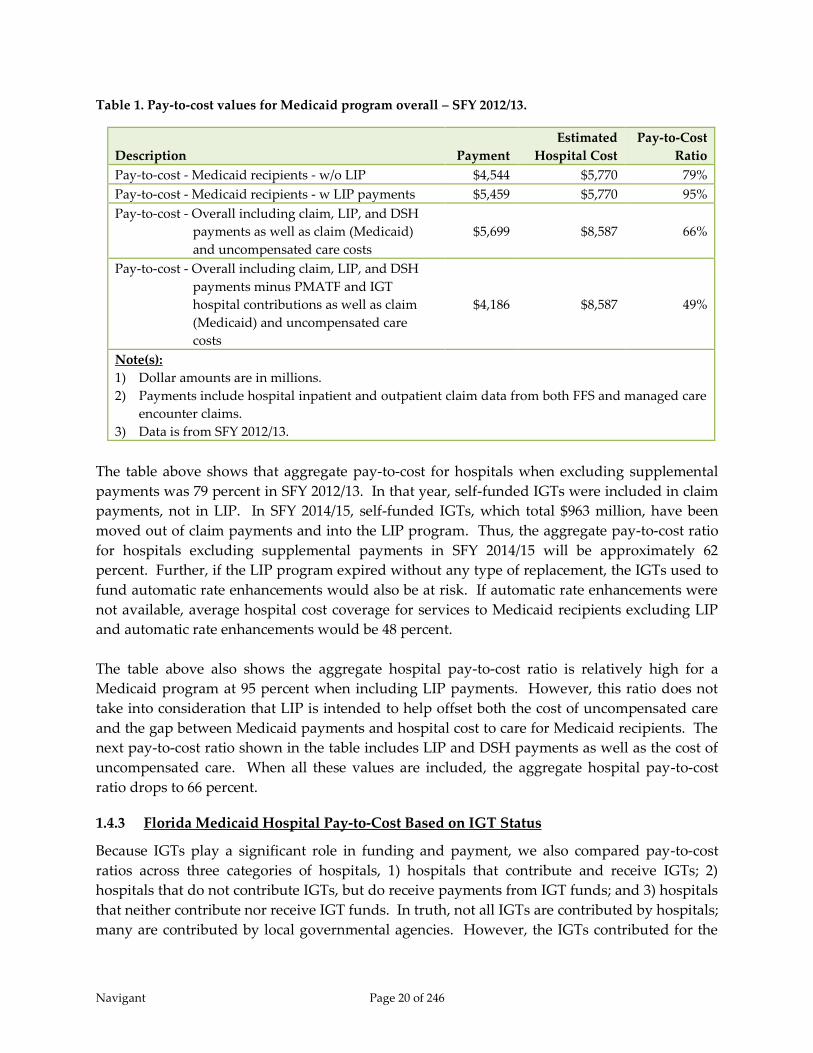
Table 1. Pay-to-cost values for Medicaid program overall – SFY 2012/13.
Description Payment
Estimated
Hospital Cost
Pay-to-Cost
Ratio
Pay-to-cost - Medicaid recipients - w/o LIP $4,544 $5,770 79%
Pay-to-cost - Medicaid recipients - w LIP payments $5,459 $5,770 95%
Pay-to-cost - Overall including claim, LIP, and DSH
payments as well as claim (Medicaid)
and uncompensated care costs
$5,699 $8,587 66%
Pay-to-cost - Overall including claim, LIP, and DSH
payments minus PMATF and IGT
hospital contributions as well as claim
(Medicaid) and uncompensated care
costs
$4,186 $8,587 49%
Note(s):
1) Dollar amounts are in millions.
2) Payments include hospital inpatient and outpatient claim data from both FFS and managed care
encounter claims.
3) Data is from SFY 2012/13.
The table above shows that aggregate pay-to-cost for hospitals when excluding supplemental
payments was 79 percent in SFY 2012/13. In that year, self-funded IGTs were included in claim
payments, not in LIP. In SFY 2014/15, self-funded IGTs, which total $963 million, have been
moved out of claim payments and into the LIP program. Thus, the aggregate pay-to-cost ratio
for hospitals excluding supplemental payments in SFY 2014/15 will be approximately 62
percent. Further, if the LIP program expired without any type of replacement, the IGTs used to
fund automatic rate enhancements would also be at risk. If automatic rate enhancements were
not available, average hospital cost coverage for services to Medicaid recipients excluding LIP
and automatic rate enhancements would be 48 percent.
The table above also shows the aggregate hospital pay-to-cost ratio is relatively high for a
Medicaid program at 95 percent when including LIP payments. However, this ratio does not
take into consideration that LIP is intended to help offset both the cost of uncompensated care
and the gap between Medicaid payments and hospital cost to care for Medicaid recipients. The
next pay-to-cost ratio shown in the table includes LIP and DSH payments as well as the cost of
uncompensated care. When all these values are included, the aggregate hospital pay-to-cost
ratio drops to 66 percent.
1.4.3 Florida Medicaid Hospital Pay-to-Cost Based on IGT Status
Because IGTs play a significant role in funding and payment, we also compared pay-to-cost
ratios across three categories of hospitals, 1) hospitals that contribute and receive IGTs; 2)
hospitals that do not contribute IGTs, but do receive payments from IGT funds; and 3) hospitals
that neither contribute nor receive IGT funds. In truth, not all IGTs are contributed by hospitals;
many are contributed by local governmental agencies. However, the IGTs contributed for the

Navigant Page 21 of 246
LIP program, automatic rate enhancements, and self-funded rate enhancements (now part of
the LIP program) are all donated in the names of specific hospitals. We treat those IGTs as
donated by the named hospitals under the assumption that the local governments would find
ways to contribute those funds directly to the named hospitals if they were not contributed as
IGTs to the Medicaid agency.
Pay-to-cost ratios are shown in Figure 4 for the four different methods we used to calculate the
ratios. With each method, hospitals that contribute IGTs and receive payments from IGT funds
are paid the highest relative to cost. Hospitals that neither contribute IGTs nor receive
payments from IGT funds are paid lowest relative to cost.
Figure 4. Hospital pay-to-cost ratios based on IGT status.
Figure 4 above shows that payments within the Florida Medicaid program are not the same
relative to cost when compared across hospitals. However the hospitals that receive relatively
higher payments are those that treat the majority of Medicaid patients. This is shown in Figure
5 below and is consistent with the state’s goal stated in the SFY 2005 1115 demonstration
waiver, “The state will continue to foster and protect its safety net providers.”11
11 Florida Agency for Health Care Administration, Application for 1115 Research and Demonstration Waiver, (August
2005).
89%
62%
45%
112%
64%
45%
77%
48%
31%
55%
42%
22%
0%
20%
40%
60%
80%
100%
120%
Hospitals
Contributing and
Receiving IGTs
104 Hospitals
Hospitals Receiving
but not
Contributing IGTs
29 Hospitals
Non-IGT Hospitals
88 Hospitals
Claims Payments Only
Claim and LIP Pymts
Mcd and Uncomp Care Excl Hosp
Contributions
Mcd and Uncomp Care Incl Hosp
Contributions

Navigant Page 22 of 246
Figure 5. Percentage of Medicaid business based on IGT status.
Notes for Figure 5 :
1) Data is based on claim payments and cost from SFY 2012/13. Both fee-for-service
and managed care program claims for hospital inpatient and outpatient services
are included. In addition, LIP payments, DSH payments, and the cost of
uncompensated care are included.
2) Data is limited to in-state hospitals with at least one submitted claim in SFY
2012/13.
1.5 Options for Future Hospital Funding and Payment
1.5.1 Interaction between Funding and Payment
In general, we categorized the funding options available to Florida Medicaid as either broad-
based or qualified. The broad-based funding options include increasing the provider
assessment (PMATF), creating a managed care assessment, and increasing general revenue for
the Medicaid program. The more qualified funding options include continued use of IGTs and,
potentially, expansion of CPEs. These categorizations have as much to do with how the funds
are allocated across hospitals in Florida as they are related to who is contributing the funding.
With the broad-based funding methods, Florida Medicaid would have significantly more
flexibility with how the funds are ultimately distributed to providers. IGTs tend to restrict how
payers distribute the federal funds they are used to generate – generally obligating payers to
return more than the IGT contribution, in amounts that provide enough financial return for the
entity to make the contribution in the first place. Without the dependence on providers to make
IGT contributions to replace the State’s share of funding, there could be less of an obligation to
tie payments to the funding sources. Payment allocations could be focused on achieving
Florida Medicaid’s overall policy priorities, such as rewarding those providers who make a
70%
18% 12%
0%
10%
20%
30%
40%
50%
60%
70%
80%
90%
Hospitals Contributing
and Receiving IGTs
104 Hospitals
Hospitals Receiving but
not Contributing IGTs
29 Hospitals
Non-IGT Hospitals
88 Hospitals

Navigant Page 23 of 246
commitment to serving Medicaid and uninsured patients, or improving the health of Medicaid
patients.
In contrast, we made the assumption that any payment allocation for IGTs must ensure a return
on investment for those public hospitals and local governments contributing the State’s share of
funding. Thus, payment methods that rely on this type of funding must be designed in a way
that takes into consideration who contributed money to fund the Medicaid program, as is the
case today in Florida. In addition, CPEs are limited to public institutions and the federal
matching funds generated through CPEs generally must be paid to the entity that incurred the
health care costs. This tie between funding mechanism and payment flexibility is summarized
in the following table:
Table 2. Tie between funding source and payment flexibility.
Funding Sources
Health Care-
related Tax
(New or
Expand Existing
Managed
Care
Assessment IGTs CPEs
General
Revenue
Funds
Payment
Distribution
Models
Delivery System
Reform Incentive
Payment (DSRIP)
Program
XX XX X X XX
Broad Based Rate
Increases (FFS and
PMPM)
XX XX XX
UPL/Targeted
Supplemental XX XX X X XX
GME Payments
(limited to qualified
providers)
X X X X X
DSH Payments
(limited to qualified
providers)
XX XX X X XX
Uncompensated Care
Pool Distributions XX XX X X XX
Physician
Supplemental
Payment Program
XX XX X X XX
Legend:
XX = generally would work for all provider types.
X = would generally work only for hospitals that actually fund the state dollars.

Navigant Page 24 of 246
1.5.2 Combination Funding and Payment Options Offered in this Study
In this study, we define three very broad options that combine type of funding and payment
distribution approaches. These options all assume the LIP program, in its current form, has
been discontinued, as that is a supposition defined in the requirements of this study. The
options are:
1) Fully replace the funds currently used for the LIP program with a broad-based funding
source and an increase in fee-for-service and capitation rates;
2) Continue current level of IGTs, design, and implement a large Delivery System Reform
Incentive Payment (DSRIP) program;
3) Expand the Florida Medicaid program through the ACA combined with either a broad-
based funding source or IGTs for funding for the existing Medicaid population.
For illustrative purposes, these non-LIP options describe all-encompassing funding methods for
the funds currently used within the LIP program. One option replaces all of the LIP funds,
which are almost entirely IGTs, with a broad-based funding method. Another option continues
to use IGTs as the source for all of the funds. In reality, there are a multitude of variations that
could be applied related to these combinations of funding and payment. Of course, if both
types of funding are implemented the benefits and limitations of each method will apply. For
example, a hybrid option that moves a portion of LIP-6 into fee-for-service and capitation rates
might need to reserve some amount, such as 110 or 120 percent of IGT contributions, for
supplemental payments back to the hospitals named by the IGT contributors. The
supplemental payments would be needed to guarantee some return on investment for the IGT
contributors.
1.5.3 Modifying the Low Income Pool Program
In addition to the options above which replace LIP, we believe continuation of a modified
version of LIP should be a consideration. Like the DSH program, the LIP program, to a degree,
helps offset Florida’s relatively low federal DSH allotment by providing other funding that
helps offset hospital costs for care to the uninsured. However, the LIP program does not go
through the same level of program oversight as the DSH program. Both the LIP and DSH
programs have a requirement that total reimbursement to hospitals should not exceed hospital
cost to treat Medicaid and uninsured recipients. Under the DSH program, states are required to
prepare annual DSH reports comparing total payments to costs, and annual independent audits
of those reports are performed to ensure this requirement is met. Audits are not performed for
the LIP program. Instead, costs self-reported by hospitals are used to ensure total
reimbursement is within applicable hospital costs. If more program oversight and control is
added to the LIP program, and greater transparency is provided related to the levels of funding
and payment occurring through the LIP program and IGT-funded rate enhancements, perhaps
continuation of the LIP program would be considered a viable option by CMS.
In addition program oversight and transparency could be increased by developing reports
which document a combination of claim payments and supplemental payments. Separately,

Navigant Page 25 of 246
AHCA monitors claim payments and supplemental payments in detail. However, few, if any
standard reports show the combination of both at the individual hospital level. Creating such
reports would be relatively easy for AHCA as they already monitor both types of payments.
Combining more comprehensive payment reports with data on the source of funding at the
hospital level, would significantly increase transparency within the program.
Any change in funding and/or payment method will likely result in shifting Medicaid
reimbursement levels between providers – particularly with a change as large as a replacement
for the LIP program. If a modified version of the LIP program would be acceptable to CMS,
then this would likely generate the least amount of changes to the Florida Medicaid program.
In addition, given the lead time required to design and implement many of the other options
described in this report, being able to preserve much of what already is in place with the current
LIP program makes it an attractive option.
1.5.4 Delivery System Reform Incentive Payment Program
A Delivery System Reform Incentive Payment (DSRIP) program is offered as an option for
Florida Medicaid because DSRIP projects could, in theory, be developed in ways that allow
contributors of IGTs to experience a return on investment. DSRIP programs allow states to
make incentive payments that are linked to performance-based incentive initiatives, or
“projects,” aimed at improving health care processes, clinical outcomes, and otherwise
positively transform health service delivery. Generally, progress on these projects is tracked
and payments are adjusted based on providers’ successes in meeting agreed-upon milestones.
DSRIP programs are designed to advance CMS’s “Triple Aim” of improving the health of the
population, enhancing the experience and outcomes of the patient and reducing the per capita
cost of care. The overarching goal is transformation of the Medicaid payment and delivery
system in an effort to achieve measureable improvements in quality of care and overall
population health.
If a DSRIP program was implemented in place of LIP, payments would not be guaranteed as
they are under LIP. Hospitals would be required to document successes against predetermined
measurable objectives specifically related to improving quality of care and overall population
health. Those that meet the objectives would receive incentive payments. In addition, recently
approved DSRIP programs have included initiatives that include multiple types of providers in
addition to hospitals. Thus, it is safe to assume reimbursements to individual hospitals would
be different from those currently provided under the LIP program.
In addition, it should be noted that the DSRIP landscape is rapidly changing. Program design
and related terms and conditions developed for states with currently approved DSRIP
programs should not necessarily be indicative of CMS’ willingness to approve similar terms
and conditions in other states considering DSRIP. Consistent with the intent of 1115
Demonstration Waivers, CMS is looking for innovative models intended to transform health
care delivery. Simply replicating another state’s model may not be consistent with CMS’ overall
objectives in this regard.
Navigant Page 26 of 246
1.5.5 Medicaid Expansion
To a degree, the LIP program helps compensate hospitals for cost of care to the uninsured and
under-insured (often referred to as uncompensated care). This is particularly important in
Florida because the State was not a heavy user of DSH funds at the time DSH funding became
capped based on historical usage. As a result, Florida’s program-wide Medicaid DSH limit is
relatively low in comparison to the size of its uninsured population. Expiration of the LIP
program without any type of replacement would be detrimental to Florida hospitals for many
reasons, one of which would be loss of compensation helping to cover the costs of
uncompensated care.
The decision whether or not to expand Medicaid is of particular concern to hospitals because
the ACA can affect both payment increases and reductions for hospitals. The ACA offers
increases in hospital revenue through expanded Medicaid eligibility and new subsidies to help
low and moderate income households buy coverage through health insurance exchanges.
Accompanying this are planned reductions in Medicaid and Medicare DSH funding as well as a
reduction on Medicare hospital fee-for-service payments through reductions or removals of
planned future increases.12
States that do not expand Medicaid receive their regular FMAP (around 59 percent for Florida)
for new enrollment of recipients eligible for Medicaid. In addition, federal subsidies are offered
to families with incomes between 100 percent and 400 percent of the federal poverty level (FPL)
to help them purchase commercial insurance coverage through a Health Information Exchange
(which is now referred to as the “Marketplace”). In contrast, for states that do expand their
Medicaid program, federal subsidies are offered to families with incomes between 138 percent
and 400 percent of the FPL to help them purchase commercial insurance coverage through the
Marketplace. Also in expanding states, Medicaid coverage is offered to all families up to 138
percent of the FPL. For recipients receiving Medicaid coverage under the expanded eligibility
rules, states will receive 100 percent federal matching for costs in 2014 through 2016. Between
2017 and 2020, the federal matching percentage gradually decreases down to 90 percent and
continues at 90 percent thereafter.13 There are two exceptions where states who had waiver
programs covering childless adults for FPL percentages up to or over 100 percent prior to
enactment of the ACA may receive the new, higher FMAP for these recipients. However, we do
not believe these exceptions apply to any existing programs within Florida Medicaid.
Expansion would increase the number of Florida residents with medical insurance, bring a
significant amount of federal funds into the state, and help offset planned reductions in DSH
payments and Medicare fee-for-service payments to hospitals. Of course, all of these benefits
would only be achieved with some additional cost to the State. After 2016, Florida would need
to find a way to increase its state share of funding for the Medicaid program.
12 Urban Institute, The Financial Benefit to Hospitals from State Expansion of Medicaid. (March, 2013) 13 Kaiser Family Foundation, A Guide to the Supreme Court’s Decision on the ACA’s Medicaid Expansion, (August, 2012).
Navigant Page 27 of 246
Estimating the impact of Medicaid expansion in any state is not an exact science; a variety of
assumptions must be made. With that said, estimates adopted by the Florida Social Services
Estimating Conference (SSEC) in March 2013 indicate Medicaid expansion would have a
steady-state cost of just under $1 billion per year in additional non-federal funds when the
FMAP drops to 90 percent. For that additional cost, Florida would receive approximately $7.8
billion in additional federal funds annually.14 Of course, if the federal government drops the
FMAP percentage below 90 percent, the costs of Medicaid expansion to the state of Florida
would increase above this estimate.
If Medicaid expansion is to be implemented, there may be options as to how it can be
implemented. A standard implementation enrolls the uninsured below 138 percent of the FPL
into Medicaid. In addition, CMS has approved a few other implementations, some of which
include offering premium assistance to help low income individuals and families buy
commercial insurance through Marketplace Qualified Health Plans (QHPs). These premium
assistance programs may include other stipulations such as healthy behavior incentives, flexible
spending accounts, and other tools designed to increase recipient impact in the costs of health
care.
There are four states with approved 1115 waivers related to Medicaid expansion – Arkansas,
Iowa, Michigan and Pennsylvania. In addition, CMS is currently reviewing Indiana’s waiver,
while Utah and Tennessee are working toward alternative proposals. CMS approved Arkansas
and Iowa utilizing premium assistance programs. Following Arkansas’ and Iowa’s approval,
other states began developing similar approaches. Common themes among the alternatives
include:
Reliance on the private insurance market
Exemptions from current Medicaid rules on cost-sharing, benefits, time limits and work
requirements
An emphasis on healthy behaviors and personal responsibility — in all states mandating
premiums, the premiums will be eliminated or reduced for compliance with health
behaviors15
Limits or contingencies on the expansion, including ending the expansion program if the
federal government reduces its enhanced matching rate16
We do not believe that a decision to expand Medicaid in Florida would be sufficient as a full
replacement of the LIP program. The LIP program funds some of the gap between Medicaid
payments and the Medicare Upper Payment Limit (UPL). This has been true throughout the
14 Retrieved from a presentation from the Florida Agency for Healthcare Administration (AHCA), available at
http://edr.state.fl.us/Content/conferences/medicaid/FederalAffordableHealthCareActEstimates.pdf, (March, 2013). 15 Kaiser Commission on Medicaid and the Uninsured, The ACA and Recent Section 1115 Medicaid Demonstration
Waivers, November, 2014. 16 Center for Health Care Strategies, Inc., Alternative Medicaid Expansion Models: Exploring State Options, February,
2014.

Navigant Page 28 of 246
life of the LIP program, and is particularly true in SFY 2014/15 in which self-funded IGTs have
been moved into LIP. In addition in SFY 2014/15 the LIP program contains supplemental
payments to teaching physicians that would not get replaced by expanding Medicaid. In the
SFY 2014/15 LIP program, self-funded IGTs were estimated to equal $963 million (total
computable) and supplemental payments to teaching physicians were estimated to equal $204
million (total computable). Also, increasing the number of recipients enrolled in Medicaid will
increase the volume of patients for which hospitals receive payments below cost. Thus, even
with Medicaid expansion, we believe continuation of the LIP program, or some form of
replacement for the LIP program will still be needed.
1.5.6 Constraints for the Various Options
In the discussion of various options, we consider current federal and state regulations as well as
precedent related to what CMS has approved recently in 1115 demonstration waivers. We also
consider the ability of each option to maintain current program-wide payment levels to
hospitals and teaching physicians. In addition, we consider the potential to maintain payment
levels for individual hospitals and teaching physicians similar to what is provided today. (For
teaching physicians, discussion in this study relates only to the supplemental payments made
through the LIP program. There is no consideration of physician fee-for-service rates.) With
the exception of uncompensated care pools, all payment methods have constraints that will
likely result in placing limits on how funds are distributed at the individual hospital level.
Even so, there are ways in which each option could be implemented to help mitigate changes in
reimbursement for individual facilities.
All options discussed could, in theory, maintain an overall Medicaid funding level at or above
what exists today. However, to do so, a federal waiver will be needed for distribution of some
of the funds. The current level of payments exceeds the Medicare upper payment limit and is
helping reimburse costs not only for care of Medicaid recipients, but also for care of uninsured
patients. Maintaining a payment level above the UPL and/or reimbursing some costs for the
uninsured outside of DSH would require a federal waiver. Although the UPL only applies to
the fee-for-service program, we assume payments reaching the upper payment limit are also the
maximum that would be considered actuarially sound within the Medicaid managed care
program.
1.6 Conclusion
As defined in CMS’s STCs for the 2014 renewal of Florida’s 1115 demonstration waiver, the
intent of this study is to suggest “sustainable, transparent, equitable, appropriate, accountable,
and actuarially sound Medicaid payment systems and funding mechanisms that will ensure
quality health care services to Florida’s Medicaid beneficiaries throughout the state without the
need for Low Income Pool (LIP) funding.”17 (emphasis added by Navigant)
17 Centers for Medicare and Medicaid Services, Special Terms and Conditions for Florida Medicaid Reform Section 1115
Demonstration, Document number 11-W-00206/4, STC number 69, (2014).

Navigant Page 29 of 246
In SFY 2014/15, the LIP program will distribute just under $2.2 billion, approximately $1.3
billion18 of which is federal funds. Thus, expiration of the LIP program without any sort of
replacement would take $1.3 billion out of Medicaid payments to Florida hospitals, which is
over 15 percent of their total Medicaid reimbursement. This would be enough to create
financial hardship for hospitals, particularly those with a high utilization from Medicaid and
uninsured patients.
We believe that funding and payment options do exist that can preserve the aggregate funding
levels that have historically been achieved through the LIP program. However, in the absence
of a federal waiver, the UPL limitations in payments simply restrict how much funding can be
federally matched. This appears to be one of the unintended, but common consequences
associated with a transition to a capitated managed care model. Shifting the financial risk from
the State to the Medicaid managed care plans also means that the State is passing substantial
control of how payments are made over to the plans. None of the options included in this study
will likely afford the State the same flexibility to maintain the payment levels currently made to
individual hospital providers.
This study provides context in which decisions can be made about the future of hospital
funding and payment within the Florida Medicaid program. In this study, we provide
background on the Florida Medicaid program, description of applicable federal and state
regulations, and description of trade-offs for various individual funding and payment options.
The study also describes combinations of funding and payment that will likely work well
together. Unfortunately, given the size, complexity, and variety of stakeholders involved with
the Florida Medicaid program, no single option or combination thereof is void of drawbacks.
Thus, there are no clear and obvious answers. Ultimately, final decisions will come down to
matching available options with the priorities of the Florida Medicaid program and of CMS.
For example, implementation of Medicaid expansion would significantly reduce the amount of
uncompensated care in the state. However, the State may not want to absorb the additional
costs of Medicaid expansion, including the risk that the FMAP gets reduced below 90 percent at
some point in the future. Similarly, the State may prefer an option that continues current levels
of IGT funding. However, if current IGT funding is maintained, payment methods will need to
be developed that meet CMS requirements while still allowing sufficient incentives for IGT
contributors. CMS would likely prefer a shift to more broad-based funding, however, this may
not be the preference of the State of Florida or the entities that contribute a portion of the State’s
share of funding. In addition, an option including IGT funding for a DSRIP program will need
to balance meeting CMS’s goals for health care delivery transformation with the need to
provide return on investment to IGT contributors.
18 The $1.3 billion estimate is based on the federal share of the total estimated LIP-based payments of approximately
$2.168 billion. The assumed FMAP for this calculation is 59.56 percent.

Navigant Page 30 of 246
Whatever the course of action selected by the State of Florida, we strongly recommend that
Florida maintain an open dialogue with CMS in determining how to best move forward, and
use CMS as a partner in determining the best solutions.
Navigant Page 31 of 246
2 Introduction
In fiscal year 2012, the Medicaid and the State Children’s Health Insurance Program (CHIP)
were sources of health coverage for 80 million people, just over one quarter of the population of
the United States. Those served by these programs included one-third of all children, many
low-wage workers and their families, persons who have physical and mental disabilities, and
seniors with Medicare. Together, the Medicaid and CHIP programs accounted for 15 percent,
approximately $434 billion, of total U.S. health care spending. In Florida, Medicaid consumed
nearly 22 percent of state general revenue, approximately $8.3 billion in state fiscal year (SFY)
2012. With federal matching funds, this resulted in a little over $19 billion spent by the Florida
Medicaid program.19
Governance and financing for Medicaid programs is a shared responsibility of the federal
government and the states. States that operate their Medicaid programs within federal
guidelines are entitled to federal reimbursement for a share of their total program costs. States
incur these costs by making payments to health care providers and managed care plans and by
performing administrative tasks such as making eligibility determinations, enrolling and
monitoring providers, and paying claims. They then submit quarterly expense reports in order
to receive federal matching dollars.
Part of the challenge in setting policies for Medicaid and CHIP is balancing federal and state
interests. Both the federal and state governments have a financial stake in the programs and
reconciling their sometimes different and conflicting priorities can be difficult, particularly
under stressful fiscal circumstances such as during a national and/or state recession. States are
incented to maximize flow of federal funds into the state, but must do so while maintaining a
balanced state budget. Medicaid and CHIP provide an important source of revenue for the
health care industry that affects economic activity throughout each state. They are major
sources of federal financing for costs that might otherwise be borne by state and local
governments, and by individuals and providers. However, being a jointly financed program,
states must increase their own contributions in order to increase federal contributions.
From a federal perspective, Medicaid and CHIP represent a growing portion of the federal
budget, having increased from 1.4 percent of federal outlays in fiscal year (FY) 1970 to 8.1
percent in FY 2010. In comparison, Medicare increased from 3.0 percent of federal outlays to
12.3 percent over the same period. However, unlike Medicare, an exclusively federal program
for which a substantial portion of spending is financed by dedicated revenue sources that
include payroll taxes and enrollee premiums, federal spending for Medicaid and CHIP is
financed by general revenues.20 The federal government has a fiscal responsibility to control
costs of the Medicaid program, much the same as the states’ fiscal responsibility.
19 MACPAC. Report to the Congress on Medicaid and CHIP, (March 2014) 20 MACPAC. Report to the Congress on Medicaid and CHIP, (March 2011).

Navigant Page 32 of 246
To control costs and ensure access to quality care, the Centers for Medicare and Medicaid
Services (CMS), the federal agency responsible for coordinating Medicaid, monitors each state
Medicaid program. CMS oversees the approval of state plan amendments, waivers, and
demonstrations and provides guidance to states through State Medicaid Director (SMD) and
State Health Official (SHO) letters. As a condition of receiving federal Medicaid funds, Section
1902 of the Social Security Act requires states to have an approved state plan on file with CMS
that demonstrates an understanding of all federal Medicaid requirements. States are required
to submit state plan amendments (SPAs) to CMS for review and approval prior to making
program modifications.
In addition to SPAs, CMS works with state Medicaid agencies to review and approve waivers.
The Social Security Act (the Act) contains multiple waiver authorities that provide states
flexibility in certain areas to operate their programs outside of standard federal requirements
that would otherwise apply. In particular, Section 1115 of the Act gives broad authority to the
Secretary to authorize “any experimental, pilot or demonstration project likely to assist in
promoting the objectives of the programs” specified in that section of the Act. Under Section
1115 research and demonstration authority, states may waive certain provisions of the Medicaid
and CHIP statutes related to state program design. Provisions that may be waived under
Section 1115 include Medicaid eligibility criteria, covered services, and service delivery and
payment methods used by the state to administer the program. Section 1115 demonstrations
include a research or evaluation component and usually are approved for a five-year period,
with a possible three-year renewal period after the first five years. The ability to waive certain
aspects of the Medicaid statute gives states flexibility to experiment with different approaches
to program operation, service delivery, and financing in terms of both program expansion and
contraction. Approval of states’ waiver applications is at the discretion of the Secretary of
federal Health and Human Services (HHS).21
All states operate one or more Medicaid waivers. In Florida, an 1115 demonstration waiver was
negotiated between the Florida Agency for Health Care Administration (AHCA) and CMS
which allowed for a transition from a fee-for-service (FFS) to Medicaid managed care model.
The waiver program began in SFY 2006/07 and was renewed in 2011 and again in 2014. In
addition to conversion from FFS to Medicaid managed care models, the waiver included
development of a new program called the Low Income Pool (LIP). The goal of the LIP program
is to provide government support for safety net hospitals that furnish health care to the
Medicaid, underinsured and uninsured populations. The LIP program is also designed to
establish new, or enhance existing, innovative programs that meaningfully enhance the quality
of care and the health of low income populations. In addition, the LIP program allowed for
supplemental payments to hospitals to continue even with the transition to Medicaid managed
care.
21 MACPAC. Report to the Congress on Medicaid and CHIP, (March 2011).

Navigant Page 33 of 246
CMS’ renewal of Florida’s 1115 demonstration waiver in 2014 included a three-year extension
on Medicaid managed care (known as the Managed Medical Assistance (MMA) program in
Florida), but only included a one year extension of the LIP program. Also included in the 2014
Special Terms and Conditions (STCs) accompanying approval of the 1115 waiver was a
mandate requiring AHCA to contract with an independent consultant to conduct a review of
the state’s funding and payment mechanisms. The intent of this study is to suggest
“sustainable, transparent, equitable, appropriate, accountable, and actuarially sound Medicaid
payment systems and funding mechanisms that will ensure quality health care services to
Florida’s Medicaid beneficiaries throughout the state without the need for Low Income Pool
(LIP) funding.”22 (emphasis added by Navigant) To do this the STC’s outlined several key
requirements. The report must:
Include detailed information on the historical methods of funding hospital payments,
the interaction between state funded payments and provider funded payments, and
describe the composition of payments, including base and supplemental payments.
Analyze the adequacy of current payment levels for Medicaid providers, and the
adequacy, equity, accountability and sustainability of the state’s funding mechanisms
for these payments. The report must primarily focus on the types of providers
supported by IGT or LIP funds.
Include an analysis of how future changes in Medicaid, including possible Medicaid
expansion would affect Medicaid payment amounts and structure, including fee-for-
service payments, managed care, and LIP.
Recommend reforms to the Florida Medicaid financing system that can allow the state,
beginning in state fiscal year 2015-2016, to move toward Medicaid fee-for-service and
managed care payments to providers that ensure access and quality of care for Medicaid
beneficiaries without the need for LIP funds. These payments should be based on a
rationalized, non-facility specific payment mechanism, which can be applicable to future
changes in Medicaid including Medicaid expansion. This type of rationalized payment
mechanism would not include payment based on facility specific costs or local tax
revenue and would discontinue incentive payments through the LIP.
In addition, the 2014 Legislature included proviso language in the 2014/15 General
Appropriations Act stating additional requirements of the report including:
Identify federal regulations on the following: inter-governmental transfers (IGTs),
including their sources, uses, and allowable repayment arrangements; supplemental
hospital payments, including allowable types, purposes, and payees; and direct provider
22 Centers for Medicare and Medicaid Services, Special Terms and Conditions for Florida Medicaid Reform Section 1115
Demonstration, Document number 11-W-00206/4, STC number 69, (2014).
Navigant Page 34 of 246
payments that are allowed within Medicaid programs that are based primarily on risk-
bearing managed care plans.
Identify other states’ uses of IGTs and supplemental hospital payments, including:
arrangements for incenting or requiring IGTs; methods of payment, particularly in states
with high managed care penetration; and specific federal waiver terms and conditions
that apply to IGTs and supplemental hospital payments.
AHCA engaged Navigant Consulting, Inc. (Navigant) to perform this study. A draft of the
resulting report is due to CMS no later than January 15, 2015 with the final report due March 1,
2015.
In the first eight years of the LIP, a combination of state and federal funding resulted in $1
billion distributed to health care providers in Florida, with the majority of the funds going to
hospitals. In the ninth year of the LIP program, the one-year renewal for state fiscal year (SFY)
2014/15, additional funding and payment mechanisms were added into the LIP program – self-
funded IGTs and physician supplemental payments. In SFY 2014/15, the LIP program will
distribute almost $2.2 billion with the following broad distribution:
$1.9 billion to hospitals
$200 million to medical school teaching physicians
$42 million to Federally Qualified Health Centers (FQHCs) and County Health
Departments (CHDs)
Overall, the LIP program will distribute almost 10 percent of total Florida Medicaid spending in
SFY 2014/15 and approximately one-third of Medicaid hospital reimbursements. In addition to
distributing a very significant amount of funds, the LIP program has been a primary vehicle
used by Florida Medicaid in recent years to incent donations of inter-governmental transfers
(IGTs) from local governments, taxing districts, and public hospitals. If the LIP program is
terminated in the future, other options will need to be developed to help fund and distribute
Medicaid reimbursements, otherwise Florida hospitals, particularly those treating large
percentages of Medicaid recipients, risk financial hardship.
This study offers a set of options available to Florida Medicaid to maintain current funding and
payment levels without use of the LIP program. The discussion focuses primarily on hospital
funding and payment as hospitals are the provider type most affected by the LIP program.
Before offering options for the future, the study begins by describing applicable federal and
state regulations related to funding and payment of Medicaid programs. On the funding side,
this includes a discussion of inter-governmental transfers (IGTs), general revenue, certified
public expenditures and health care provider assessments. On the payment side, fee-for-service
claim payments, managed care capitation payments, non-Disproportionate Share Hospital (non-
DSH) supplemental payments and DSH supplemental payments are discussed. Note that for

Navigant Page 35 of 246
purposes of this report, we use the term “supplemental payment” to mean any payment made
outside of the traditional claims-based payment process, and made directly from the state to the
provider. Such “supplemental payments” include DSH supplemental payments, UPL-based
supplemental payments, graduate medical education supplemental payments, and incentive
payments (such as those designed to create incentives under Delivery System Reform Incentive
Payment, or DSRIP programs).
To further define context, the study goes on to describe the LIP program and the current Florida
Medicaid funding mechanisms and payment methods, particularly related to hospitals. This is
followed with an analysis of the current funding and payment methods with a focus on topics
mentioned in the STCs – adequacy, sustainability, accountability, and equity. Navigant used
Medicaid payments as compared to hospital costs as a measure of payment adequacy. To
assess sustainability, Navigant determined the likelihood that funding will continue at current
levels and that payment will be sufficient to incent hospitals to accept Medicaid and uninsured
patients. Navigant then reviewed the level of transparency and simplicity within the current
system to evaluate accountability. The final analysis looked at equity and to do this Navigant
concentrated on funding and payment levels across providers in the state of Florida and across
Medicaid programs in the United States.
The study then provides background on two significant and complex potential options for
Florida Medicaid – Medicaid expansion and a Delivery System Reform Incentive Payment
(DSRIP) program. This is followed by a description of funding and payment mechanisms
utilized by other Medicaid agencies, all with similar challenges as those faced by Florida
Medicaid, including finding ways to control costs, maintain access, and improve quality of
health care for Medicaid recipients. Navigant conducted research on several states that have
similar characteristics to Florida, and states that have unique funding and payment approaches.
This study then goes on to identify and describe individual options for Florida Medicaid for
both funding for and payment to hospitals. Each option offers some benefits and contains some
limitations, both of which are discussed. We then discuss a small number of combinations of
individual options that have potential to offer the best set of benefits with the least drawbacks.
To help develop these options, Navigant conducted numerous interviews with key stakeholders
across the State gathering opinions on how Florida should reform its current system. Navigant
had conversations with representatives from the following organizations: Florida Hospital
Association, Safety Net Hospital Alliance of Florida, Florida Association of Health Plans,
Hospital Corporation of America, Florida children’s hospitals, The Council of Florida Medical
School Deans, AHCA, and CMS. Navigant also spoke with staff representing the state
legislature and the Executive Office of the Governor.
Following discussion of the options, the study includes an evaluation of selected option
combinations based on a predetermined set of evaluation criteria. Our goal was to provide an
Navigant Page 36 of 246
objective evaluation of what might best maintain access and ensure quality health care for
Florida Medicaid recipients if the LIP program is no longer acceptable to CMS.
Note that as we present a set of options that should be considered by Florida Medicaid, we have
attempted to put forth solutions that have been successfully implemented in other states with
the approval of CMS. However, as with any such program design, the devil is always in the
details. The details of the program design must be consistent not only with current CMS
regulations, but in the case of waiver programs, consistent with CMS goals and objectives
related to such waiver programs. In other words, the fact that a waiver or other type of
program has been established and successful in another state is no guarantee that CMS will
approve a similar program in Florida.

Navigant Page 37 of 246
3 Applicable Federal and State Regulations
3.1 Regulatory Summary
A variety of federal and state regulations establish the requirements and provide guidelines
regarding how Florida Medicaid may collect and distribute funds in operation of the Florida
Medicaid program. As long as a Medicaid Agency operates its program in a way that is
compliant with these regulations, it is eligible to receive federal matching funds toward
allowable Medicaid expenditures. Any funding or payment practices that are not compliant
with these regulations may result in denial of federal financial participation for the portion of
funding that is not compliant. Because of this, all options for changes in the Florida Medicaid
program suggested in this paper were developed with these guidelines in mind.
Since the Medicaid program’s inception in 1965, flexibility in financing the non-federal share
has allowed states to use local sources of health care financing while making these local funds
eligible for federal match. Section 1902(a)(2) of the Act, included in the original statute, has a
provision requiring at least forty (40) percent of the “state share” to come from the state while
allowing up to sixty (60) percent to come from local sources.23 The most common sources of
local funding are inter-governmental transfers (IGTs), certified public expenditures (CPEs), and
health care related taxes, often referred to as provider assessments. IGTs and CPEs must
originate from a governmental agency such as a non-Medicaid state agency or local government
such as a county or municipality. Medicaid providers such as county hospitals or school
districts also qualify as units of local government. Provider assessments are defined by federal
statute as taxes in which at least 85 percent of the tax burden falls on health care providers.24
A recent report from the Government Accountability Office entitled “Medicaid Financing
States’ Increased Reliance on Funds from Health Care Providers and Local Governments
Warrants Improved CMS Data Collection” detailed the sources of non-federal share of
Medicaid expenditures for state fiscal year 2012. As shown in Figure 6, about 70 percent of non-
federal share of Medicaid funding (also known as “the state share”) comes from state general
revenue. Other sources including local governments and health care providers (through
provider assessments) also contribute significant funds towards the state share of Medicaid
programs.
23 The Social Security Act, Section 1902(a)(2). 24 The Social Security Act, Section 1903(w)(3)(A).
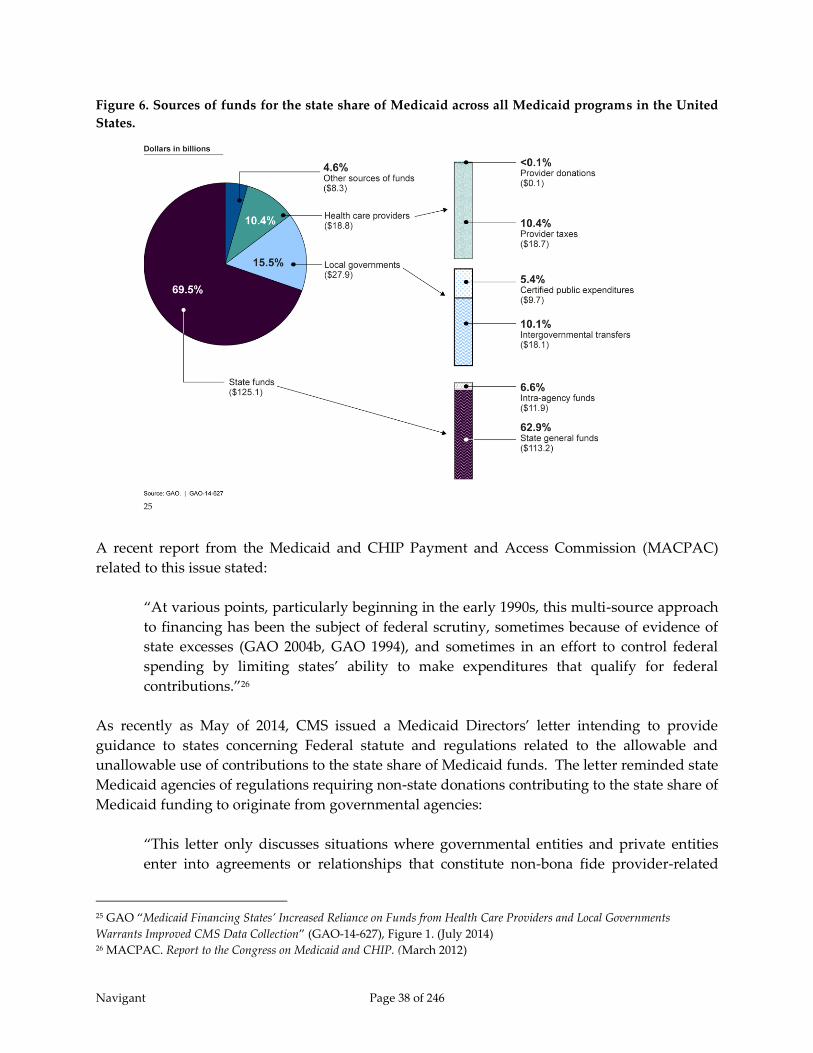
Navigant Page 38 of 246
Figure 6. Sources of funds for the state share of Medicaid across all Medicaid programs in the United
States.
25
A recent report from the Medicaid and CHIP Payment and Access Commission (MACPAC)
related to this issue stated:
“At various points, particularly beginning in the early 1990s, this multi-source approach
to financing has been the subject of federal scrutiny, sometimes because of evidence of
state excesses (GAO 2004b, GAO 1994), and sometimes in an effort to control federal
spending by limiting states’ ability to make expenditures that qualify for federal
contributions.”26
As recently as May of 2014, CMS issued a Medicaid Directors’ letter intending to provide
guidance to states concerning Federal statute and regulations related to the allowable and
unallowable use of contributions to the state share of Medicaid funds. The letter reminded state
Medicaid agencies of regulations requiring non-state donations contributing to the state share of
Medicaid funding to originate from governmental agencies:
“This letter only discusses situations where governmental entities and private entities
enter into agreements or relationships that constitute non-bona fide provider-related
25 GAO “Medicaid Financing States’ Increased Reliance on Funds from Health Care Providers and Local Governments
Warrants Improved CMS Data Collection” (GAO-14-627), Figure 1. (July 2014) 26 MACPAC. Report to the Congress on Medicaid and CHIP. (March 2012)

Navigant Page 39 of 246
donations, in which private entities provide a governmental entity with funds or other
consideration and receive in return additional Medicaid payments typically in the form
of a supplemental payment. … Government entities are free to enter into agreements
with private entities; however such agreements may affect the allowability of Medicaid
funding if there is a hold harmless provision or practice. A hold harmless practice exists
if there is a positive correlation between the agreement and the Medicaid payments,
Medicaid payments are conditioned upon the receipt of a donation from a private entity,
or if there is a guarantee that the private entity will see a return of some, or all, of that
donation through a Medicaid payment.”27
Within traditional fee-for-service Medicaid, payments are generally made in three forms, 1) on a
claim-by-claim basis for services rendered to Medicaid recipients; 2) through non-DSH28
supplemental payments29; and, 3) through DSH supplemental payments. Non-DSH
supplemental payments may be distributed for a variety of reasons, most common of which are
Graduate Medical Education (GME) payments, Upper Payment Limit (UPL) payments, and
incentive payments. GME payments, made to teaching hospitals, help offset hospitals’ costs for
operating Graduate Medical Education programs. UPL payments offset some or all of the
difference between total traditional claims-based Medicaid payments for services and the
maximum payment level allowed under the Medicare Upper Payment Limit regulations for
those services. Incentive payments, which we also describe generally as supplemental
payments, are made to hospitals for achieving certain incentive goals related to patient quality
or access, and can be made directly by states to providers related to services provided to
patients who are served through the FFS program or are enrolled with a Medicaid managed
care plan.
The UPL regulations establish the maximum amounts of payments for Medicaid services that
are eligible for federal matching funds. The maximum total payment is generally calculated as
an approximation of what Medicare would pay for these same services, or as an approximation
of hospital costs to provide these services following Medicare allowable cost rules.
UPL regulations establish limits on the federal portion of Medicaid outlays for recipients paid
under Medicaid FFS programs. In contrast, federal matching funds for Medicaid managed care
programs are limited by a different set of regulations which require capitation rates paid by
Medicaid to managed care organizations to be actuarially sound. In addition, federal
regulations dictate that services covered by Medicaid managed care plans must be considered
“paid in full” through the rate paid to the plan.30 Based on this regulation, non-DSH
supplemental payments for services provided to Medicaid recipients are generally prohibited
27 Centers for Medicare and Medicaid Services (CMS). SMDL#14-004 RE: Accountability #2: Financing and Donations.
(May 9, 2014) 28 DSH stands for Disproportionate Share Hospital 29 As mentioned previously, the term “supplemental payments” is used broadly in this report, and includes incentive
payments made directly from a state to a provider as part of a DSRIP or other waiver program. 30 Code of Federal Regulations, Title 42, Section 438.60 (October 2014)

Navigant Page 40 of 246
from being paid directly by Medicaid agencies to hospitals, unless they are explicitly approved
through a waiver program, such as incentive payments made through an approved DSRIP
program. Further, Medicaid agencies are generally not allowed to dictate how Medicaid
managed care plans pay for services with contracted hospitals, which also means that Medicaid
agencies cannot direct the plans to pass through or otherwise distribute supplemental
payments. A recent MACPAC report stated “CMS considers strategies that require MCOs to
‘pass through’ supplemental payments to contracted providers to be inconsistent with the
statute that requires capitation rates to be actuarially sound.”31 Thus, traditional UPL
supplemental payments are not an acceptable payment mechanism under a Medicaid managed
care model.
One exception to this rule is that states are allowed to make GME supplemental payments to
hospitals in a Medicaid managed care model because they are tied to costs of maintaining
Graduate Medical Education programs, not to the cost of care for Medicaid recipients.
Similarly, DSH payments are allowed under both fee-for-service and Medicaid managed care
programs. Federal Fund Participation (FFP) for Medicaid DSH payments is controlled by two
limitations. For FFP, one limit requires the total Medicaid payment to an individual hospital to
be no greater than the cost of care for Medicaid recipients, uninsured, and underinsured. The
other limit caps total FFP to each state for DSH at values pre-set within federal regulation.
These values were based on historical DSH payments increased annually by an inflation factor.
The total federal DSH allotment for Florida Medicaid is relatively low when compared to those
of other large states.
In recent years, states have explored alternative ways to maintain supplemental payments to
hospitals when converting to capitated Medicaid managed care models. The LIP program in
Florida, as an example, was created in 2006 as part of Florida’s managed care waiver and was
created specifically to allow supplemental payments to continue while transitioning much of
the Medicaid population from traditional FFS to a Medicaid managed care model. If the LIP
program is terminated, as CMS is suggesting would be their preference, Florida Medicaid will
be left in a difficult position trying to find ways to maintain current funding levels. In addition,
any replacement for the LIP program will require some form of waiver in order to maintain
current payment levels as those levels (when including the LIP program) are above the UPL
limits. In addition, current funding for the Medicaid program is heavily dependent on IGTs,
which have been forthcoming in the past because the LIP program ensured all IGT contributors
would receive back more than if they kept their IGT funds within their local jurisdiction.
3.2 State Plans and Waivers
Each state operates its Medicaid program in accordance with a state plan submitted to and
approved by CMS that describes the nature and scope of the program (e.g., administrative
structure and operations, eligibility, covered benefits, payment methods). Section 1902 of the
Social Security Act requires states to have a state plan on file with CMS as a condition of
31 MACPAC. Report to the Congress on Medicaid and CHIP. (March 2014)
Navigant Page 41 of 246
receiving federal Medicaid funds. The state plan demonstrates states’ understanding of all
federal Medicaid requirements. When states make changes to the Medicaid program in areas
documented in the state plan, states are required to submit state plan amendments (SPAs) to
CMS for review and approval prior to making the program modifications. Included in state
plans is a description of how payments are made in traditional Medicaid fee-for-service
programs.
The Social Security Act also contains multiple waiver authorities that provide states flexibility in
certain areas by allowing them to operate their programs without regard to federal
requirements that would otherwise apply. For example, the Act provides the authority to
waive certain provisions of the Medicaid and CHIP statutes such as eligibility and benefits in
order to explore new approaches to the delivery of and payment for health care and long-term
services and supports. This flexibility has enabled states to make fundamental changes to their
programs. All states operate one or more Medicaid waivers, which are generally referred to by
the section of the Act granting the waiver authority. Those waivers are categorized as program
waivers or research and demonstration projects. Regardless of the type of waiver, estimated
federal spending over the period for which the waiver is in effect cannot be greater than it
would have been without the waiver. Approval of states’ waiver applications is at the
discretion of the Secretary of HHS.32
Section 1915(b) waivers permit states to implement service delivery models (e.g., those
involving primary care case management programs or managed care plans) that restrict
beneficiaries’ choice of providers other than in emergency circumstances. Section 1915(c) of the
Medicaid statute authorizes states to provide home and community-based services as an
alternative to institutional care in nursing homes, intermediate care facilities for individuals
with mental retardation (ICF-MRs), and hospitals. Section 1115 of the Social Security Act gives
broad authority to the Secretary to authorize “any experimental, pilot or demonstration project
likely to assist in promoting the objectives of the programs” specified in that section of the Act.
Under Section 1115 research and demonstration authority, states may waive certain provisions
of the Medicaid and CHIP statutes related to state program design. Provisions that may be
waived under Section 1115 include Medicaid eligibility criteria, covered services, and service
delivery and payment methods used by the state to administer the program. Section 1115
demonstrations include a research or evaluation component and usually are approved for a
five-year period, with possible three-year renewal periods after the first five years. The ability
to waive certain aspects of the Medicaid statute gives states flexibility to experiment with
different approaches to program operation, service delivery, and financing in terms of both
program expansion and contraction. Section 1115 authority has been used in a variety of ways
and for an array of purposes.33 In Florida, an 1115 demonstration waiver has been created to
enable the use of Medicaid managed care and the LIP program.
3.3 Regulations Related to Medicaid Funding 32 MACPAC. Report to the Congress on Medicaid and CHIP. (March 2011). 33 Ibid.

Navigant Page 42 of 246
Medicaid programs are jointly funded by the federal government and the state government.
The Social Security Act Section 1902(a)(2) and 42 CFR §433.53(b) require that a state must use at
least 40 percent of state funds as the non-federal share of total Medicaid expenditures. The
minimum 40 percent is typically generated from general tax revenue. Florida primarily receives
its general tax revenue from property taxes and sales and gross receipt taxes and currently
funds approximately 60 percent of the Medicaid program through general funds – well above
the minimum requirement.
Because the program is jointly funded by federal and state governments, the federal
government contributes funds to each state Medicaid program using a percentage referred to as
the Federal Medical Assistance Percentage (FMAP). FMAP values vary by state and are
computed using a formula that takes into account the average per capita income for each state
relative to the national average. Also, each state receives multiple FMAP values. For the cost of
health care services, one FMAP is assigned for the traditional Medicaid program and another is
assigned for the State Children’s Health Insurance Program (CHIP). For states that expand
Medicaid, there is a separate FMAP for the expansion population and there are additional
FMAPs assigned for the cost of administrating the Medicaid program and for making upgrades
to the program. The non-expansion health care services Medicaid average state FMAP is 57%,
but FMAPs range from 50% in wealthier states up to 75% in states with lower per capita
incomes. Florida’s blended Medicaid and CHIP FMAP for SFY 2014/15 is 40.44 percent and the
federal share percentage is 59.56 percent. This means for every dollar spent by the Medicaid
Agency in SFY 2014/15, 40.44 cents come from state resources and 59.56 cents come from federal
resources. Another way to think of this is that $1.00 in state funds in SFY 2014/15 yields $2.47 in
total funds for the Medicaid program (1 / 0.4044 = $2.47).
In addition to general revenue, there are three common forms of revenue used to fund the state
share of a Medicaid program. These are inter-governmental transfers, certified public
expenditures, and provider taxes/assessments. The statutes and regulations related to each are
discussed in the following sections.
3.3.1 Inter-governmental Transfers
3.3.1.1 Federal Regulations
States have used inter-governmental transfers (IGTs) for decades as a tool to fund the non-
federal share of allowable Medicaid expenditures. A recent study by the Government
Accountability Office reports that 10.1 percent of the non-federal share of Medicaid
expenditures was funded with inter-governmental transfers.34 The Department of Health and
Human Services (HHS), Office of Inspector General (OIG), CMS, and the Government
Accounting Office (GAO) have been suspect of this funding tool through the years. In 2002, the
GAO stated that “IGTs are a legitimate state budget tool and not problematic in themselves …
[b]ut when they are used to carry out questionable financial transactions that inappropriately
34 Government Accountability Office. “States’ Increased Reliance on Funds from Health Care Providers and Local
Governments Warrant Improved CMS Data Collection” (GAO-14-627), (July 2014)

Navigant Page 43 of 246
shift state Medicaid costs to the federal government, they become problematic.”35 The Office of
Inspector General has been critical of the IGT funding mechanism as well. On one occasion, the
OIG stated the “use of the IGT as part of the supplemental payment program is a financing
mechanism designed solely to maximize Federal Medicaid reimbursements without providing
either additional funds to the participating county nursing facilities or additional medical
services to their Medicaid residents.”36
Despite the concerns of CMS, OIG, and GAO, the use of IGTs is allowable for the purposes of
funding the non-federal share based on Social Security Act Section 1903(w)(6) and 42 CFR
§433.51 – “Public Funds” as the State share of financial participation.
42 CFR §433.51 – “Public Funds as the State Share of Financial Participation” states the
following:
(a) Public Funds may be considered as the State's share in claiming FFP if they meet the
conditions specified in paragraphs (b) and (c) of this section.
(b) The public funds are appropriated directly to the State or local Medicaid agency, or
are transferred from other public agencies (including Indian tribes) to the State or
local agency and under its administrative control, or certified by the contributing
public agency as representing expenditures eligible for FFP under this section.
(c) The public funds are not Federal funds, or are Federal funds authorized by Federal
law to be used to match other Federal funds.
However as stated previously, CMS requires IGTs to originate from public entities in order to
be eligible for FFP. As stated in the CMS state Medicaid directors letter entitled “SMD 14-004 –
“Accountability #2: Financing and Donations” and released on May 9, 2014, funds that do not
originate from a public entity are deemed “non-bona fide” and are not subject to federal
matching:
“This letter only discusses situations where governmental entities and private entities
enter into agreements or relationships that constitute non-bona fide provider-related
donations, in which private entities provide a governmental entity with funds or other
consideration and receive in return additional Medicaid payments typically in the form
of a supplemental payment.”
35 GAO report entitled Intergovernmental Transfers Have Facilitated State Financing Schemes, (May 2004). 36 OIG report entitled “Review of Commonwealth of Pennsylvania’s Use of Intergovernmental Transfers to Finance
Medicaid Supplemental Payments to County Nursing Facilities.” (A-03-00-00203), (February 9, 2001).

Navigant Page 44 of 246
3.3.1.2 State Regulations
The State of Florida also has several statutes dictating collection and use of IGTs for the non-
federal share Medicaid funds. The allowance for additional funds from local governmental
entities for hospital services is detailed in Florida Statute 409.908 – “Reimbursement of
Medicaid Providers.” This statute states the following:
“The agency may receive funds from state entities, including, but not limited to, the
Department of Health, local governments, and other local political subdivisions, for the
purpose of making special exception payments, including federal matching funds,
through the Medicaid inpatient reimbursement methodologies.”
“The agency is authorized to receive funds from state entities, including, but not limited
to, the Department of Health, the Board of Governors of the State University System,
local governments, and other local political subdivisions, for the purpose of making
payments, including federal matching funds, through the Medicaid outpatient
reimbursement methodologies.”
Further, Florida Statute 409.017(2) indicates that IGTs are voluntary and may be used to replace
state funds for the Medicaid program (Title XIX):
(c) It is the intent of the Legislature that participation in revenue maximization is to be
voluntary for local political subdivisions.
(d) Except for funds expended pursuant to Title XIX of the Social Security Act, it is the
intent of the Legislature that certified local funding for federal matching programs not
supplant or replace state funds. Beginning July 1, 2004, any state funds supplanted or
replaced with local tax revenues for Title XIX funds shall be expressly approved in the
General Appropriations Act or by the Legislative Budget Commission pursuant to
chapter 216.
3.3.2 Certified Public Expenditures
3.3.2.1 Federal Regulations
As with IGTs, CPEs are governed by Social Security Act Section 1903(w)(6) and 42 CFR §433.51
– “Public Funds.” A recent study by the Government Accountability Office reported that 5.4
percent of non-federal share of Medicaid expenditures for Federal fiscal year 2012 was in the
form of certified public expenditures.37
The major difference between IGTs and CPEs is that IGTs are considered a funding source
while CPEs are actual expenditures resulting from providing care to patients eligible under the
37 Government Accountability Office. “States’ Increased Reliance on Funds from Health Care Providers and Local
Governments Warrant Improved CMS Data Collection” (GAO-14-627), (July 2014).

Navigant Page 45 of 246
Medicaid program. The public provider of service certifies the uncompensated cost of services
rendered to eligible individuals. The Medicaid agency records the certified expenditures and
draws the Federal share of the expenditure from its grant award authorized by CMS.
3.3.2.2 State Regulations
From a broad perspective, authority to collect federal matching funds through the use of CPEs
is covered under Florida State statute 409.017(2)(a) which states that it “is the intent of the
Legislature to authorize the use of certified local funding for federal matching programs to the
fullest extent possible to maximize federal funding of local preventive services and local child
development programs in this state.” In practice, CPEs are used in Florida primarily to fund
school based services and a portion of the DSH program. Specifically, statute 409.9071 –
“Medicaid Provider Agreements for School Districts Certifying State Match” contains the
following text:
Subject to any limitations provided for in the General Appropriations Act, the agency, in
compliance with appropriate federal authorization, shall develop policies and
procedures and shall allow for certification of state and local education funds which
have been provided for school-based services as specified in s. 1011.70 and authorized
by a physician’s order where required by federal Medicaid law.
3.3.3 Health Care-Related Taxes
3.3.3.1 Federal Regulations
The third category of alternative funding sources for non-federal share of Medicaid
expenditures is the use of health care-related taxes or assessments. A recent study by the GAO
reported that 10.4 percent of non-federal share of Medicaid expenditures for Federal fiscal year
2012 was paid for using these taxes or assessments.38 The Federal statute governing this source
of funding is the Social Security Act, Section 1903(w)(3).
42 CFR §433.55 – “Health Care-Related Taxes Defined” establishes the regulations for health
care-related taxes under the Act. This regulation allows for the use of a tax/assessment levied
on health care providers as a source of funding for non-federal share of expenditures. The main
conditions for which a tax imposed by government can be considered a health care-related tax
are addressed 42 CFR §433.55 (a) through (c) as follows:
(a) A health care-related tax is a licensing fee, assessment, or other mandatory payment
that is related to —
(1) Health care items or services;
38 Government Accountability Office. “States’ Increased Reliance on Funds from Health Care Providers and Local
Governments Warrant Improved CMS Data Collection” (GAO-14-627), (July 2014)
Navigant Page 46 of 246
(2) The provision of, or the authority to provide, the health care items or services; or
(3) The payment for the health care items or services.
(b) A tax will be considered to be related to health care items or services under paragraph
(a)(1) of this section if at least 85 percent of the burden of the tax revenue falls on
health care providers.
(c) A tax is considered to be health care related if the tax is not limited to health care items
or services, but the treatment of individuals or entities providing or paying for those
health care items or services is different than the tax treatment provided to other
individuals or entities.
A key item in the above conditions is the 85% burden in paragraph (b). A tax imposed on all
businesses is not considered a health care-related tax and no limitations exist on use of the
funds. For example, sales tax paid by a hospital is not considered a health care-related tax.
Only certain health care providers may be taxed under a health care-related tax and have the
tax be permissible as a source of non-federal share of Medicaid expenditures. These classes of
health care items or services are outlined in 42 CFR §433.56 – “Classes of Health Care Services
and Providers Defined” as follows:
a. For purposes of this subpart, each of the following will be considered as a separate class
of health care items or services:
(1) Inpatient hospital services;
(2) Outpatient hospital services;
(3) Nursing facility services (other than services of intermediate care facilities for
individuals with intellectual disabilities);
(4) Intermediate care facility services for individuals with intellectual disabilities, and
similar services furnished by community-based residences for individuals with
intellectual disabilities, under a waiver under section 1915(c) of the Act, in a State in
which, as of December 24, 1992, at least 85 percent of such facilities were classified as
ICF/IIDs prior to the grant of the waiver;
(5) Physician services;
(6) Home health care services;
(7) Outpatient prescription drugs;
Navigant Page 47 of 246
(8) Services of managed care organizations (including health maintenance
organizations, preferred provider organizations);
(9) Ambulatory surgical center services, as described for purposes of the Medicare
program in section 1832(a)(2)(F)(i) of the Social Security Act. These services are
defined to include facility services only and do not include surgical procedures;
(10) Dental services;
(11) Podiatric services;
(12) Chiropractic services;
(13) Optometric/optician services;
(14) Psychological services;
(15) Therapist services, defined to include physical therapy, speech therapy, occupational
therapy, respiratory therapy, audiological services, and rehabilitative specialist
services;
(16) Nursing services, defined to include all nursing services, including services of nurse
midwives, nurse practitioners, and private duty nurses;
(17) Laboratory and x-ray services, defined as services provided in a licensed, free-
standing laboratory or x-ray facility. This definition does not include laboratory or x-
ray services provided in a physician's office, hospital inpatient department, or
hospital outpatient department;
(18) Emergency ambulance services; and
(19) Other health care items or services not listed above on which the State has enacted a
licensing or certification fee, subject to the following:
(i) The fee must be broad based and uniform or the State must receive a waiver of
these requirements;
(ii) The payer of the fee cannot be held harmless; and
(iii) The aggregate amount of the fee cannot exceed the State's estimated cost of
operating the licensing or certification program.
Navigant Page 48 of 246
b. Taxes that pertain to each class must apply to all items and services within the class,
regardless of whether the items and services are furnished by or through a Medicaid-
certified or licensed provider.
Further requirements related to a permissible health care-related tax are outlined in 42 CFR
§433.68 – “Permissible health care-related taxes.” Paragraph (b) of this regulation states the
following:
Subject to the limitations specified in §433.70, a State may receive, without a reduction in
FFP, health care-related taxes if all of the following are met:
(1) The taxes are broad based, as specified in paragraph (c) of this section;
(2) The taxes are uniformly imposed throughout a jurisdiction, as specified in
paragraph (d) of this section; and
(3) The tax program does not violate the hold harmless provisions specified in
paragraph (f) of this section.
Paragraph (c)(1) of the regulation defines broad based as meaning “the tax is imposed on at
least all health care items or services in the class or providers of such items or services furnished
by all non-federal , non-public providers in the State, and is imposed uniformly, as specified in
paragraph (d) of this section.”39 The uniformity provision requires that the unit of government
that imposes the tax applies the tax to “all items or services or providers (or all providers in a
class) in the area” that the unit of government has jurisdiction.40 42 CFR §433.68(c)(3) does
allow for waivers to the broad based and uniformity requirements. Further explanation of the
waiver process is included as Appendix F.
One of the reasons for identifying a tax as a health care-related tax is that the taxpayer cannot be
held harmless for the tax. 42 CFR §433.68(f) outlines how a taxpayer might be held harmless:
A taxpayer will be considered to be held harmless under a tax program if any of the
following conditions applies:
(1) The State (or other unit of government) imposing the tax provides for a direct or
indirect non-Medicaid payment to those providers or others paying the tax and the
payment amount is positively correlated to either the tax amount or to the difference
between the Medicaid payment and the tax amount. A positive correlation includes
any positive relationship between these variables, even if not consistent over time.
39 Code of Federal Regulations, Title 42, Section §433.68(c)(1) 40 Code of Federal Regulations, Title 42, Section §433.68(c)(2)
Navigant Page 49 of 246
(2) All or any portion of the Medicaid payment to the taxpayer varies based only on the
tax amount, including where Medicaid payment is conditional on receipt of the tax
amount.
(3) The State (or other unit of government) imposing the tax provides for any direct or
indirect payment, offset, or waiver such that the provision of that payment, offset, or
waiver directly or indirectly guarantees to hold taxpayers harmless for all or any
portion of the tax amount.
(i)(A) An indirect guarantee will be determined to exist under a two prong
“guarantee” test. If the health care-related tax or taxes on each health care class
are applied at a rate that produces revenues less than or equal to 6 percent of the
revenues received by the taxpayer, the tax or taxes are permissible under this
test. The phrase “revenues received by the taxpayer” refers to the net patient
revenue attributable to the assessed permissible class of health care items or
services. However, for the period of January 1, 2008 through September 30, 2011,
the applicable percentage of net patient service revenue is 5.5 percent.
Compliance in State fiscal year 2008 will be evaluated from January 1, 2008
through the last day of State fiscal year 2008. Beginning with State fiscal year
2009 the 5.5 percent tax collection will be measured on an annual State fiscal year
basis.
(B) When the tax or taxes produce revenues in excess of the applicable percentage of
the revenue received by the taxpayer, CMS will consider an indirect hold
harmless provision to exist if 75 percent or more of the taxpayers in the class
receive 75 percent or more of their total tax costs back in enhanced Medicaid
payments or other State payments. The second prong of the indirect hold
harmless test is applied in the aggregate to all health care taxes applied to each
class. If this standard is violated, the amount of tax revenue to be offset from
medical assistance expenditures is the total amount of the taxpayers' revenues
received by the State.
The exception to the hold harmless provision is that “the indirect guarantee test does not apply
if the tax rate falls within a “safe harbor” established under regulation” which is the 6 percent of
net patient revenue described above.41
3.3.3.2 State Regulations
State authority to impose a health-care related tax on hospitals is included in statute 395.701(2)
which states:
41 MACPAC. “Health Care Related Taxes in Medicaid.” (August 2012)

Navigant Page 50 of 246
(a) There is imposed upon each hospital an assessment in an amount equal to 1.5
percent of the annual net operating revenue for inpatient services for each hospital,
such revenue to be determined by the agency, based on the actual experience of the
hospital as reported to the agency.
(b) There is imposed upon each hospital an assessment in an amount equal to 1 percent
of the annual net operating revenue for outpatient services for each hospital, such
revenue to be determined by the agency, based on the actual experience of the
hospital as reported to the agency.
3.4 Regulations Related to Medicaid Payment
One of the most fundamental and commonly quoted regulations within the Social Security Act
dictates that provider payment be adequate to ensure access to care for the Medicaid
population.42 More detailed regulations exist separately for the Medicaid fee-for-service
program, which has to be documented in the State Plan, and Medicaid managed care programs,
which is documented through a demonstration waiver. In addition, some payments, are
allowable in both fee-for-service and managed care. These are Disproportionate Share Hospital
(DSH) payments and Graduate Medical Education (GME) payments. DSH payments help cover
Medicaid shortfall and help cover hospital costs for care to the uninsured, who are by
definition, not enrolled in the Medicaid program. GME payments help cover the costs of
operating medical schools and training medical residents.
3.4.1 Fee for Service Regulatory Environment
3.4.1.1 Federal Regulations
The traditional delivery methodology for payments under a Medicaid system was a FFS model.
Inpatient and outpatient hospital services under FFS typically receive payments in the following
forms:
1. Claim payments for services rendered
2. Supplemental payments received under Upper Payment Limit (UPL) regulations
3. Disproportionate Share Hospital (DSH) payments
4. Graduate Medical Education (GME) payments (less common and also governed by UPL
regulations)
Claim payments made through the Medicaid Management Information System (MMIS)
typically are based on a specified payment methodology that is applied to claims for all
hospitals. States typically fund the non-federal share of claim payments from general revenue.
Florida uses a combination of general revenue funds, IGTs, and a provider assessment to fund
the state share of claim payments.
42 The Social Security Act, section 1902(a)(30)(A)
Navigant Page 51 of 246
UPL supplemental payments are most often funded by IGTs and are designed to offset some or
all of the difference between total base Medicaid FFS payments for services and the maximum
payment level allowed under the regulatory UPL for those services. At the federal level, the
upper payment limit for inpatient hospital services is governed by 42 CFR 447.272 – “Inpatient
Services: Application of Upper Payment Limits,” and outpatient hospital services fall under 42
CFR 447.321 – “Outpatient Hospital and Clinic Services: Application of Upper Payment Limits.”
These regulations allow states to maximize Medicaid fee-for-service payments to hospitals. In
addition to the claims paid through the MMIS system, supplemental payments can be made to
hospitals to allow a maximum payment that is generally calculated as an approximation of
Medicare payment for these same services, or as an approximation of hospital costs to provide
these services.
The UPL limit is aggregated over each provider type (hospitals, nursing homes, clinics, etc…)
and class (state-owned, non-state government owned, and private). State payments to any
individual hospital may exceed that hospital’s upper payment limit as long as the aggregated
payments to hospitals in that provider class are within the overall Medicare UPL. Also, UPL
limits are calculated separately for hospital inpatient and outpatient care. The result is six UPL
limits for hospital reimbursement, made up of three provider classes for two different
categories of service.
UPL limits apply only to payments made within the parameters and authority established by
each state’s State Plan. This includes FFS payments (both claim-based and supplemental
payments), but in many cases does not include Medicaid managed care payments. Medicaid
managed care programs are generally established and defined under a waiver and thus are
considered to be separate from the scope established in the state plan. This is the case in
Florida, although it is not always the case. Some states have implemented Medicaid managed
care programs that are defined within their state plans.
In addition, UPL calculations apply only to Medicaid recipients. Uncompensated care
payments made through approved DSH programs are not limited by UPL regulations.43 Based
on recent regulation changes from CMS, Medicaid agencies are required to submit UPL
analyses for hospital reimbursement (as well as other provider types) at the beginning of each
fiscal year predicting whether or not Medicaid FFS payments, including claim and
supplemental payments, will be within upper payment limits.
As Florida Medicaid continues to move more Medicaid recipients into a managed care model,
the volume of Medicaid FFS business declines and the amount available to fund and pay out
through the UPL becomes smaller and smaller. As a simplified example, if total gap between
Medicaid FFS payments and Medicare payments for the same services is $100 million prior to
the migration to Medicaid managed care and 60 percent of the FFS business is moved to
43 In contrast, DSH limits are calculated individually for each hospital and include payments and costs for care of
Medicaid recipients (both FFS and managed care) plus uncompensated care.
Navigant Page 52 of 246
Medicaid managed care, then the remaining fee-for-service gap available for UPL supplemental
payments reduces to $40 million ($100 million times (100 percent – 60 percent)).
In Florida, CMS has approved a one-year renewal of the LIP program for SFY 2014/15 that
allows supplemental payments from the traditional $1 billion LIP program, LIP 6 (formerly self-
funded IGTs), and physician supplemental payments. The LIP program is established through
an 1115 waiver and limits on payments distributed through the LIP program are subject to the
hospital-specific limits established under federal DSH regulations (discussed in a later section),
but not governed by UPL limits. If these funds were subject to UPL limits, the amount of funds
paid to hospitals that would be allowable for FMAP purposes would be a small fraction of what
is paid today. Even before considering the reduction in the UPL gap created by Florida
Medicaid’s migration to Medicaid managed care, the LIP program paid out more money to
some hospital classes than was available under the UPL. With the continued migration of the
program to Medicaid managed care in 2014, the amount that payments would exceed the UPL
has only increased. Current LIP payments are well above what would be allowable if the
standard UPL regulations were to be applied.
DSH and GME payments are acceptable with both FFS and Medicaid managed care programs,
and are discussed in a later section.
3.4.1.2 State Regulations
State regulations for setting of hospital inpatient FFS rates are summarized below:
409.905(5) – “Hospital Inpatient Services”
The agency shall pay for all covered services provided for the medical care and
treatment of a recipient who is admitted as an inpatient by a licensed physician or
dentist to a hospital licensed under part I of chapter 395. However, the agency shall limit
the payment for inpatient hospital services for a Medicaid recipient 21 years of age or
older to 45 days or the number of days necessary to comply with the General
Appropriations Act. Effective August 1, 2012, the agency shall limit payment for hospital
emergency department visits for a nonpregnant Medicaid recipient 21 years of age or
older to six visits per fiscal year.
409.905(5)(c) – “Hospital Inpatient Services”
The agency shall implement a prospective payment methodology for establishing
reimbursement rates for inpatient hospital services. Rates shall be calculated annually
and take effect July 1 of each year. The methodology shall categorize each inpatient
admission into a diagnosis-related group and assign a relative payment weight to the
base rate according to the average relative amount of hospital resources used to treat a
patient in a specific diagnosis-related group category. … The agency shall establish a
single, uniform base rate for all hospitals unless specifically exempt pursuant to s.
409.908(1).
Navigant Page 53 of 246
409.908(1)(a) – “Reimbursement of Medicaid providers”:
1. If authorized by the General Appropriations Act, the agency may modify
reimbursement for specific types of services or diagnoses, recipient ages, and
hospital provider types.
2. The agency may establish an alternative methodology to the DRG-based prospective
payment system to set reimbursement rates for:
a. State-owned psychiatric hospitals.
b. Newborn hearing screening services.
c. Transplant services for which the agency has established a global fee.
d. Recipients who have tuberculosis that is resistant to therapy who are in need
of long-term, hospital-based treatment pursuant to s. 392.62.
State regulations for setting of hospital outpatient fee-for-service rates are summarized below:
409.905(6) – “Hospital Outpatient Services”
(a) The agency shall pay for preventive, diagnostic, therapeutic, or palliative care
and other services provided to a recipient in the outpatient portion of a hospital
licensed under part I of chapter 395, and provided under the direction of a
licensed physician or licensed dentist, except that payment for such care and
services is limited to $1,500 per state fiscal year per recipient, unless an exception
has been made by the agency, and with the exception of a Medicaid recipient
under age 21, in which case the only limitation is medical necessity.
(b) The agency shall implement a methodology for establishing base reimbursement
rates for outpatient services for each hospital based on allowable costs, as
defined by the agency. Rates shall be calculated annually and take effect July 1
of each year based on the most recent complete and accurate cost report
submitted by each hospital.
The Upper Payment Limit program within Florida Medicaid was discontinued at the end of
SFY 2005/06 in favor of the LIP program which was included as part of the Medicaid managed
care demonstration waiver. State regulations related to the LIP program are mentioned in the
following section.
3.4.2 Managed Care Regulatory Environment
3.4.2.1 Federal Regulations
Upper Payment Limit regulations control federal Medicaid outlays for recipients paid within
Medicaid FFS programs. In contrast, federal matching funds for Medicaid managed care
programs are limited by a different set of regulations regarding capitation rates paid by
Medicaid to Medicaid managed care organizations. Federal regulation 42 CFR §438.6(c)(2)(i)
dictates that “all payments under risk contracts and all risk-sharing mechanisms in contracts

Navigant Page 54 of 246
must be actuarially sound.” In addition, regulation 42 CFR §438.60 dictates that services
covered by Medicaid managed care plans must be considered “paid in full” through the rate
paid to the plan. Based on this regulation, UPL supplemental payments made directly from a
state to providers for services provided to Medicaid recipients enrolled in Medicaid managed
care plans are generally not allowed. “CMS considers strategies that require MCOs to ‘pass
through’ supplemental payments to contracted providers to be inconsistent with the statute that
requires capitation rates to be actuarially sound.”44
In recent years, states have explored alternative ways to maintain supplemental payments to
hospitals when converting to risk-sharing capitated programs. Social Security Act Section 1115
and 42 CFR §431.400 – “Basis and Purpose” allow states to establish a demonstration project for
CMS approval. Conversion from a FFS environment to a managed care environment is an
example project that has been approved through 1115 waivers in several states. In many cases,
these waiver projects have included transitional payments that allow providers time to adjust to
changes in Medicaid reimbursement, although there is no specific stipulation requiring
transitional payments in either 42 CFR §431.400 or Section 1115 of the Act. Another option to
make additional payments to hospitals is discussed in a recent issue brief by the Kaiser
Commission on Medicaid and the Uninsured. In the Kaiser brief, the use of Delivery System
Reform Incentive Payment (DSRIP) programs are discussed as follows:
DSRIP initiatives are part of broader Section 1115 Waiver programs and provide states
with significant funding that can be used to support hospitals and other providers in
changing how they provide care to Medicaid beneficiaries. Originally, DSRIP initiatives
were more narrowly focused on funding for safety net hospitals and often grew out of
negotiations between states and HHS over the appropriate way to finance hospital care.
Now, however, they increasingly are being used to promote a far more sweeping set of
payment and delivery system reforms.45
DSRIP programs have justification under the Social Security Act Sections 1115, and are
discussed in much more detail later in this report.
3.4.2.2 State Regulations
AHCA makes capitation payments to managed care plans which then make claim payments to
hospitals based on Medicaid utilization. Claim payments between the managed care
organizations and hospitals are governed by Florida Statute 409.968(1) – “Managed care plan
payments” which says,
Prepaid plans shall receive per-member, per-month payments negotiated pursuant to
the procurements described in s. 409.966. Payments shall be risk-adjusted rates based on
44 MACPAC. Report to the Congress on Medicaid and CHIP. (March 2014) 45 Kaiser Commission on Medicaid and Uninsured, “An Overview of Delivery System Reform Incentive Payment (DSRIP)
Waivers.” (October 2014)

Navigant Page 55 of 246
historical utilization and spending data, projected forward, and adjusted to reflect the
eligibility category, geographic area, and clinical risk profile of the recipients. In
negotiating rates with the plans, the agency shall consider any adjustments necessary to
encourage plans to use the most cost-effective modalities for treatment of chronic
disease such as peritoneal dialysis.
Payments between managed care organizations and providers are governed by Florida Statute
409.975(6) – “Provider Payment” which sets minimum and maximum rates based on agency fee
for service rates.
Managed care plans and hospitals shall negotiate mutually acceptable rates, methods,
and terms of payment. For rates, methods, and terms of payment negotiated after the
contract between the agency and the plan is executed, plans shall pay hospitals, at a
minimum, the rate the agency would have paid on the first day of the contract between
the provider and the plan. Such payments to hospitals may not exceed 120 percent of
the rate the agency would have paid on the first day of the contract between the
provider and the plan, unless specifically approved by the agency. Payment rates may
be updated periodically.
This statute along with experience of Medicaid managed care plans in other states suggest that
rates negotiated between managed care organizations and providers will align relatively closely
with Medicaid fee-for-service rates.
When Florida Medicaid began migration to managed care in 2006, the LIP program was created
specifically to allow supplemental payments to continue while transitioning much of the
Medicaid population from traditional FFS to Medicaid managed care programs. Authorization
for the low income pool is described in the Special Terms and Conditions (STCs) document
associated with approval of the 1115 demonstration waiver in 2006. Specifically, STC 91 says:
Low Income Pool Definition. A Low Income Pool (LIP) will be established to ensure
continued government support for the provision of health care services to Medicaid,
underinsured and uninsured populations. The low-income pool consists of a capped
annual allotment of $1 billion total computable for each year of the 5-year demonstration
period.
In addition, section 409.91211(1)(c) of the Florida Statutes, states that the LIP program goals are:
Assure a broad and fair distribution of available funds based on the access provided by
Medicaid participating hospitals, regardless of their ownership status, through their
delivery of inpatient or outpatient care for Medicaid beneficiaries and uninsured and
underinsured individuals;
Assure accessible emergency inpatient and outpatient care for Medicaid beneficiaries
and uninsured and underinsured individuals;

Navigant Page 56 of 246
Enhance primary, preventive, and other ambulatory care coverages for uninsured
individuals;
Promote teaching and specialty hospital programs;
Promote the stability and viability of statutorily defined rural hospitals and hospitals
that serve as sole community hospitals;
Recognize the extent of hospital uncompensated care costs;
Maintain and enhance essential community hospital care;
Maintain incentives for local governmental entities to contribute to the cost of
uncompensated care;
Promote measures to avoid preventable hospitalizations;
Account for hospital efficiency; and
Contribute to a community’s overall health system.
If the LIP program is terminated as CMS is suggesting would be their preference, Florida
Medicaid will be left in a difficult position trying to find ways to maintain current funding
levels, which are heavily based on IGTs, and current payment levels, which include significant
non-DSH supplemental payments and succeed in reimbursing hospitals for IGTs contributed in
their name.
3.4.3 Disproportionate Share Hospital Payments
3.4.3.1 Federal Regulations
DSH payments are intended to make Medicaid payment adjustments for hospitals that serve a
disproportionate share of low income patients with special needs. As such, DSH funds help to
cover hospital costs for Medicaid shortfall and for care of the uninsured. Medicaid shortfall is
the difference between non-DSH Medicaid payments and hospital cost to provide care to
Medicaid recipients. The cost of care for uninsured is defined as hospital costs to care for
recipients who have no health insurance or other source of third party coverage or whose health
insurance does not cover any of the services related to an entire episode of care (such as a
hospital admission). DSH supplemental payments may be made directly from the Medicaid
agency to hospitals completely independent of capitation payments made to managed care
organizations. Total Medicaid payments to a hospital, including FFS, managed care, and DSH
payments, may not exceed the hospital’s cost for care of Medicaid recipients and the uninsured.
To enforce this limitation, the Medicare Prescription Drug, Improvement and Modernization
Act of 2003 defined a requirement for annual auditing and standard reporting of state DSH
payments in comparison to hospital costs.
Section 1902(a)(13)(A)(iv) of the Social Security Act states that,
A State plan for medical assistance must provide for a public process for determination
of rates of payment under the plan for hospital services, nursing facility services, and
services of intermediate care facilities for the mentally retarded under which in the case
of hospitals, such rates take into account (in a manner consistent with section 1923) the

Navigant Page 57 of 246
situation of hospitals which serve a disproportionate number of low-income patients
with special needs.
Sections 1923(b) and (d) of the Social Security Act specify the requirements to qualify as a DSH
hospital. Section 1923(c) – “Payment Adjustment” provides a variety of ways to calculate the
allowable amount of DSH payment per hospital. Most importantly, sections 1923(f)(2) and (3)
freeze federal Medicaid DSH allotments per state based on historical levels. Medicaid
Voluntary Contribution and Provider-Specific Tax Amendments of 1991 (P.L. 102-234) capped
federal funding for Medicaid DSH payments as of 1993. The original state DSH allotments
provided in FFY 1993 were based on each state’s FFY 1992 DSH payments. In FFY 1992, some
states provided relatively more DSH payments to hospitals, and, as a result, these states locked
in relatively higher Medicaid DSH allotments. Other states made relatively fewer DSH
payments, and these states locked in relatively lower DSH allotments.
Efforts have been made over time to reduce the disparity in DSH allotments by providing larger
annual increases to DSH allotments for states that initially made fewer DSH payments and
limiting the growth of DSH allotments for states that initially provided relatively more DSH
payments.
In FY 1992, Florida was not a heavy user of the DSH program, so its federal DSH allotment was
capped at a relatively low level. Even with adjustments that have occurred since the early
1990’s the disparity remains, and Florida is considered “a low DSH state” in relation to other
states with similarly large uninsured populations. Florida’s federal DSH allotment for FFY 2014
is $213 million resulting in a total computable disbursement of $362 million.46
3.4.3.2 State Regulations
Florida’s primary regulation governing the DSH program is 409.911 – “Disproportionate Share
Program” which states,
Subject to specific allocations established within the General Appropriations Act and
any limitations established pursuant to chapter 216, the agency shall distribute, pursuant
to this section, moneys to hospitals providing a disproportionate share of Medicaid or
charity care services by making quarterly Medicaid payments as required.
Notwithstanding the provisions of s. 409.915 counties are exempt from contributing
toward the cost of this special reimbursement for hospitals serving a disproportionate
share of low-income patients.
Subsections 409.911(6) and (7) further defines DSH payments and funding as follows:
46 Kaiser Family Foundation, Federal Medicaid Disproportionate Share Hospital (DSH) Allotment, downloaded from
http://kff.org/medicaid/state-indicator/federal-dsh-allotments/ in December, 2014.

Navigant Page 58 of 246
(6) In no case shall total payments to a hospital under this section, with the
exception of public non-state facilities or state facilities, exceed the total amount
of uncompensated charity care of the hospital, as determined by the agency
according to the most recent calendar year audited data available at the
beginning of each state fiscal year.
(7) The agency is authorized to receive funds from local governments and other
local political subdivisions for the purpose of making payments, including
federal matching funds, through the Medicaid disproportionate share program.
Funds received from local governments for this purpose shall be separately
accounted for and shall not be commingled with other state or local funds in any
manner.
3.4.4 Graduate Medical Education Payments
3.4.4.1 Federal Regulations
Federal regulations 413.75 through 413.83, establish a methodology for determining Medicare
payments to hospitals for the costs of approved graduate medical education (GME) programs.
There are no federal regulations that dictate if or how Medicaid agencies must compensate
hospitals for the costs of GME programs.
3.4.4.2 State Regulations
The Florida Medicaid Agency makes supplemental payments to help hospitals cover the costs
of training new physicians through a program called the Statewide Medicaid Residency
Program. This program is defined in Florida Statute 409.909 and specifics of the payment
calculation are defined in subsections (3) and (4) as follows:
(3) The agency shall use the following formula to calculate a participating hospital’s
allocation fraction:
HAF = [0.9 x (HFTE/TFTE)] + [0.1 x (HMP/TMP)]
Where:
HAF = A hospital’s allocation fraction.
HFTE = A hospital’s total number of FTE residents.
TFTE = The total FTE residents for all participating hospitals.
HMP = A hospital’s Medicaid payments.
TMP = The total Medicaid payments for all participating hospitals.
(4) A hospital’s annual allocation shall be calculated by multiplying the funds
appropriated for the Statewide Medicaid Residency Program in the General
Appropriations Act by that hospital’s allocation fraction. If the calculation results in
an annual allocation that exceeds $50,000 per FTE resident, the hospital’s annual
allocation shall be reduced to a sum equaling no more than $50,000 per FTE resident.

Navigant Page 59 of 246
The funds calculated for that hospital in excess of $50,000 per FTE resident shall be
redistributed to participating hospitals whose annual allocation does not exceed
$50,000 per FTE resident, using the same methodology and payment schedule
specified in this section.

Navigant Page 60 of 246
4 Description of Current Funding and Payment Methods
4.1 Introduction
The Florida Medicaid program, like most Medicaid programs in the United States is funded and
disburses payments for medical care in a variety of ways. This chapter of the report documents
current funding and payment mechanisms and offers a history of how these have changed in
recent years. In particular, our discussion concentrates on funding and payment mechanisms
used by Florida Medicaid for hospital services, including both inpatient and outpatient services.
In addition, we examine the funding and payment mechanisms related to LIP waiver currently
in effect and DSH disbursements. DSH payments are made exclusively to hospitals. LIP
payments, in contrast, are made primarily to hospitals, but are also distributed to other health
care institutions such as County Health Departments (CHDs) and Federally Qualified Health
Centers (FQHCs). Generally however, this report focuses on payments made to hospitals.
Funding for payment of hospital services provided to Medicaid recipients, including those
made through the FFS and Medicaid managed care programs, the LIP program, and the DSH
program generally come from five sources: 1) Florida state general revenue funds; 2) IGTs from
local governmental agencies such as counties and taxing districts; 3) CPEs; 4) a hospital
provider assessment; and 5) federal matching funds provided through CMS.
Payments are made by the state Medicaid Agency in four forms, 1) claim payments for health
care services provided to Medicaid fee-for-service recipients; 2) capitation payments to
Medicaid managed care organizations, which in turn, pay hospitals for services provided to
Medicaid managed care recipients; 3) quarterly supplemental payments determined through
the LIP program; and 4) quarterly DSH payments determined through the DSH program. Fee-
for-service claim payments and Medicaid managed care capitation payments are both intended
to compensate providers for services offered to recipients eligible for Medicaid health benefits.
DSH payments are intended to compensate providers for costs associated with caring for a high
proportion of low-income individuals including Medicaid, uninsured and underinsured
recipients. Similarly, payments made through the LIP program are intended to compensate
providers for both services offered to uninsured and underinsured recipients as well as help
cover shortfalls between Medicaid payments and provider costs incurred from caring for
Medicaid eligible recipients.
4.2 Low Income Pool Program
4.2.1 Overview
The LIP program is authorized as part of Florida's Medicaid Reform section 1115
Demonstration Waiver, and is a significant funding source for Medicaid participating hospitals
and several non-hospital safety net health care providers. The goal of the LIP program is to
provide government support for safety net hospitals that furnish health care to the Medicaid,
underinsured and uninsured populations. The LIP program is also designed to establish new,

Navigant Page 61 of 246
or enhance existing, innovative programs that meaningfully enhance the quality of care and the
health of low income populations.
As originally defined in House Bill 3B in the December 2005 special session of the Florida
Legislature and carried over to Section 409.91211(1)(c) of the Florida Statutes, the LIP program
goals are:
“Assure a broad and fair distribution of available funds based on the access provided by
Medicaid participating hospitals, regardless of their ownership status, through their
delivery of inpatient or outpatient care for Medicaid beneficiaries and uninsured and
underinsured individuals;
Assure accessible emergency inpatient and outpatient care for Medicaid beneficiaries
and uninsured and underinsured individuals;
Enhance primary, preventive, and other ambulatory care coverages for uninsured
individuals;
Promote teaching and specialty hospital programs;
Promote the stability and viability of statutorily defined rural hospitals and hospitals
that serve as sole community hospitals;
Recognize the extent of hospital uncompensated care costs;
Maintain and enhance essential community hospital care;
Maintain incentives for local governmental entities to contribute to the cost of
uncompensated care;
Promote measures to avoid preventable hospitalizations;
Account for hospital efficiency; and
Contribute to a community’s overall health system.”47
The LIP program authorizes supplemental Medicaid payments to hospitals serving Medicaid
recipients receiving benefits through both the FFS and the Medicaid managed care programs.
The LIP program was implemented in conjunction with a pilot migration of Florida Medicaid
FFS to Medicaid managed care. The LIP program allowed for the expansion of managed care in
Florida without reducing Federal matching funds to providers.48 Some of these funds were
previously made available through CMS’s UPL policy which allows states to claim
supplemental UPL Federal matching funds to cover the difference between Medicaid payments
and what Medicare payments would have been for the same services.
Within the 1115 waiver’s Special Terms and Conditions (STCs), controls were put in place to
limit the types of expenditures reimbursable through the LIP program. Below is the definition
of permissible expenditures reimbursable through LIP funds as defined in the 2014 STCs, which
is relatively unchanged from the definition included in the original 2005 STCs:
47 Florida general laws, Section 409.91211(1)(c), Retrieved August 19, 2014 from http://www.leg.state.fl.us/statutes/,
Chapter 409. 48 The Lewin Group, Medicaid Upper Payment Limit Policies: Overcoming a Barrier to Managed Care Expansion, November
13, 2006. Downloaded from the web on August 19, 2014.

Navigant Page 62 of 246
“Funds from the LIP may be used for health care costs (medical care costs or premiums)
that would be within the definition of medical assistance in Section 1905(a) of the Act.
These health care costs may be incurred by the state, by hospitals, clinics, or by other
provider types to furnish medical care for the uninsured and underinsured for which
compensation is not available from other payers, including other federal or state
programs. Such costs may include premium payments, payments for provider access
systems (PAS) and insurance products for such services provided to otherwise
uninsured individuals, as agreed upon by the state and CMS. These health care costs
may also include costs for Medicaid services that exceed Medicaid payments (after all
other Title XIX payments are made, including disproportionate share hospital
payments).”49
This definition of allowable expenses expanded upon the standard UPL program it replaced in
that it included costs to furnish medical care for uninsured and underinsured recipients. In
addition, the LIP program allowed for reimbursements to provider types other than hospitals,
which is typically outside the scope of a standard UPL program.
The total computable dollar limit for LIP expenditures in waiver demonstration year (DY) 9
(7/1/14-6/30/15) is $2,167,718,341. This is a total from three separate elements:
1. $1 billion (for DY 1 - DY 8, LIP funding had a capped allotment of $1 billion disbursed in
quarterly payments to providers. In DY 9, the two following supplemental payments
were made a part of LIP funds);
2. $963,184,508 (historical spending amount for self-funded hospital rate exemptions and
buybacks, conditional on the state’s assurance that no such rate exemptions or buybacks
will be executed apart from LIP in DY 9);
3. $204,533,833 (historical supplemental payment amount for physician groups with
medical school affiliation, conditional on the state’s assurance that no such supplemental
payments will be made apart from LIP in DY 9).
Distribution of the “traditional” LIP funds, i.e. $1 billion, to Florida health care providers is
determined by the Florida Legislature based on recommendations from the LIP Council, which
was established with the implementation of the LIP program. The LIP Council existed for the
purpose of making recommendations on the financing and distribution of funds for the LIP and
DSH programs. In addition, the Council was charged with advising the Florida Medicaid on
the inpatient rates, rebased rates, or other exemptions for hospitals from reimbursement limits
as financed by automatic IGTs. (Please see a section later in this document for a detailed
49 Centers for Medicare and Medicaid Services, Special Terms and Conditions for Florida Medicaid Reform Section 1115
Demonstration, Document number 11-W-00206/4, STC number 51. (June 2014)

Navigant Page 63 of 246
description of IGTs.) For LIP demonstration years one through eight, the 24-member Council
submitted a report of findings and recommendations to the Governor and the Legislature no
later than February 1st of each year. For DY 9, State Fiscal Year (SFY) 2014/15, the LIP Council
was disbanded. The distributions being made in SFY 2014/15 are reflective of the SFY 2013/14
core distribution of $1 billion, and incorporate Physician Supplemental funding and LIP 6
(formerly self-funded IGTs).
4.2.2 History
The LIP program was initially approved on October 19, 2005, as a part of Florida's Medicaid
Reform 1115 Research and Demonstration Waiver for a five-year demonstration period. The
LIP program has been renewed twice since; once in 2011 and recently awarded a one-year
extension in 2014 for SFY 2014/15.
Florida's Medicaid Reform 1115 Research and Demonstration Waiver is primarily intended to
shift much of Florida Medicaid service delivery from a FFS model to a capitated managed care
model. The final decision and authority to pursue this waiver came from Senate Bill 838 passed
during the normal legislative session in the spring of 2005. Once the 1115 waiver was approved
by CMS, House Bill 3B was created and passed in a special session in December 2005 to further
define AHCA’s direction for reforming Medicaid primarily through migration to managed care.
Managed care implementation was planned to be done in phases, the first being
implementation in two counties in SFY 2006/07, Broward and Duval; the second being roll-out
to three additional counties in SFY 2007/08, Baker, Clay and Nassau. State wide
Implementation of managed care was originally planned to occur in state fiscal years 2008/09
and 2009/10 as stated in STC number 27 from CMS’s 2005 Special Terms and Conditions for the
1115 waiver:
“Implementation of Phase III will occur over the course of the following 2 State fiscal
years, with near or full geographic implementation of Medicaid Reform expected by
June 2010. Phase III geographic expansion is targeted to culminate in Medicaid Reform
plans being operational statewide. This will be accomplished in stages, again with
mandatory and voluntary populations enrolled on a staggered basis.”50
In reality, implementation of Medicaid managed care to the entire state was not approved until
2013 and was implemented in the summer of 2014. Implementation began on May 1, 2014 and
was completed by August 1, 2014.
Although Medicaid managed care was not implemented statewide until eight years after the
initial pilot counties were converted, policy makers were considering full state wide
implementation when developing Senate Bill 838 and negotiating the Demonstration Waiver
approval back in 2005. With this in mind, there was considerable concern over ensuring
50 Centers for Medicare and Medicaid Services, Special Terms and Conditions for Florida Medicaid Reform Section 1115
Demonstration, Document number 11-W-00206/4, STC number 51. (2005)

Navigant Page 64 of 246
hospitals receive reimbursements at a level similar to what they received under the fee-for-
service program. Language from Senate Bill 838, which became part of Florida Statute Section
409.91211(1)(a), states approval to seek a Medicaid managed care Demonstration Waiver
pursuant to section 1115 of the Social Security Act is, “… contingent upon federal approval to
preserve the upper-payment-limit funding mechanism for hospitals, including a guarantee of a
reasonable growth factor … provisions to preserve the state’s ability to use inter-governmental
transfers, and provisions to protect the disproportionate share program …”51 Reasons for
concern over the DSH program are unclear as this program is independent of the design of the
Medicaid program. However, concerns over the UPL program were certainly valid as these
payments have traditionally only applied to hospitals’ Medicaid FFS business.
During the negotiation of the 1115 Demonstration Waiver between the State of Florida and
CMS, protection of hospital reimbursement levels became a key fiscal issue. “As noted above,
SB 838 required that these programs [UPL and DSH] be protected and preserved in any
demonstration program approved by waiver. On the other hand, Section 1115 waivers must be
‘budget neutral’ from a federal perspective, meaning that approval could not put the federal
government at risk for higher contributions to a state’s Medicaid program than those which
would be expected to occur in the absence of the waiver. Protecting Florida’s UPL/DSH
financing for safety-net hospitals while implementing the other proposed changes to Medicaid
in a manner acceptable to CMS became difficult. The establishment and allocation of funding
($1.0 billion) to a Low-Income Pool (LIP) became the solution.”52
The resulting LIP program is defined in STC 91 for the Demonstration Waiver from 2005 as, “A
Low Income Pool (LIP) … established to ensure continued government support for the
provision of health care services to Medicaid, underinsured and uninsured populations. The
low-income pool consists of a capped annual allotment of $1 billion total computable for each
year of the five-year demonstration period.” Text within STC 100 for the Demonstration Waiver
from 2005 goes on to say, “The state agrees not to establish any new inpatient or outpatient UPL
programs for the duration of the demonstration.”
Although originally conceived as a replacement for the UPL funding mechanism, the definition
of the program included payment for services to the uninsured and underinsured which are
considered outside the scope of a traditional UPL program. In addition, the LIP program was
considered a step above a standard UPL program because it allowed for distribution of funds to
providers other than hospitals. Given this broad definition, the LIP program has evolved
considerably since its inception.
In DY 1, LIP was strictly a $1 billion annual disbursement to providers that helped fund health
care services for the Medicaid, underinsured and uninsured populations, with the amounts
51 Florida general laws, Section 409.91211(1)(b), Retrieved August 19, 2014 from http://www.leg.state.fl.us/statutes/
Chapter 409. 52 Department of Health Services Research, Management and Policy – University of Florida, Evaluating Medicaid
Reform in Florida – Summary Report on Section 1115 Waiver Process. (July 2006)

Navigant Page 65 of 246
decided by a newly formed LIP Council. Included in the Demonstration Waiver renewal in
2011 were additional provisions regarding the definition of the LIP program. The additional
provisions specified:
“The LIP is also designed to establish new, or enhance existing, innovative programs
that meaningfully enhance the quality of care and the health of low income populations.
Initiatives must broadly drive from the three overarching goals of CMS’ Three-Part Aim
as described in paragraph 61(a).”53
In addition, terms and conditions were added defining new requirements for the State and
providers to access portions of LIP funding through the establishment of programs that enhance
the quality of care and health of low income populations and fulfill the goals of CMS’s Three-
Part Aim:
1. Better care for individuals including safety, effectiveness, patient centeredness,
timeliness, efficiency, and equity;
2. Better health for populations by addressing areas such as poor nutrition, physical
inactivity, and substance abuse; and,
3. Reducing per-capita costs.
These requirements are defined as “Tier – One Milestones” and “Tier – Two Milestones.” These
milestones tie portions of reimbursement through the LIP to measurable improvements in the
delivery of health care, very much like DSRIP programs which have been developed in recent
years. Under STC 61 in the 2011 STCs (Tier – One Milestones), CMS mandated that the state
allocate “$50 million in total LIP funding in Demonstration Years 7 and 8 to establish new, or
enhance existing, innovative programs that meaningfully enhance the quality of care and the
health of low income populations. These initiatives must broadly drive from the three
overarching goals of CMS’ Three- Part Aim.”54 Of the $50 million available in Tier – One
Milestones funding, $35 million is designated to support primary care initiatives ($20 million
dedicated to the start-up of new primary care initiatives and the remaining $15 million
designated to enhance existing primary care programs). The projects selected for these funds
are based on the program’s capability to achieve the following goals:
Reduce potentially avoidable emergency room visits by developing initiatives to identify
persons inappropriately using hospital emergency rooms or other emergency care
services and provide care coordination and referral to primary care providers.
Reduce potentially avoidable hospitalizations for ambulatory care sensitive conditions,
which involve admissions that evidence suggests could have been avoided.
Expansion of primary care infrastructure to treat patients.
53 Centers for Medicare and Medicaid Services, Special Terms and Conditions for Florida Medicaid Reform Section 1115
Demonstration, Document number 11-W-00206/4, STC number 51. (December 2011) 54 Centers for Medicare and Medicaid Services, Special Terms and Conditions for Florida Medicaid Reform Section 1115
Demonstration, Document number 11-W-00206/4, STC number 61. (December 2011)

Navigant Page 66 of 246
Expansion of primary care through expanded service hours (e.g., evening or weekend
hours).
Provide the services most needed by the local community, such as the following:
o Additional physicians
o Dental care
o Nurse practitioners
o Pharmaceutical services
The remaining $15 million in Tier – One Milestones falls under the Special LIP Provider Access
System category. This $15 million is distributed to hospitals based on the hospitals meeting
Quality Measures collected by AHCA and Core Measures collected by CMS.
As defined in STC 62 of the 2011 renewal (Tier – Two Milestones), AHCA required each of the
top 15 hospitals (based on the largest allocation of LIP funds) to propose three initiatives that
follow the guidelines of the Three-Part Aim. These hospitals had to implement new, or enhance
existing health care initiatives, investments, or activities with the goal of meaningfully
improving the quality of care and the health of populations served. The three initiatives
focused on: infrastructure development; innovation and redesign; and population-focused
improvement. The 2011 STCs did not allocate additional money for Tier – Two Milestones. The
STCs stated that 3.5 percent of the LIP funds allocated to each of these hospitals are at risk
pending evidence of progress or completion of each pre-defined milestone.
In DY 6 (SFY 2011/12), AHCA received the required proposals and worked with CMS to grant
approval for 44 of the 45 initiatives. CMS granted an exemption for the 45th, which was the
third initiative for Indian River Memorial Hospital in Vero Beach, Florida. Included with each
proposal, also referred to as a “milestone plan,” was a description of the specific health care
initiative, investment, and activities, and the applicable standards, measures, and evaluation
measures and protocols that will allow for implementation and monitoring. In DY 6, approval
by CMS of each milestone plan was required for the participating hospitals to receive associated
LIP funds. In DY 7 and DY 8, participating hospitals submitted to AHCA quarterly reports
describing and measuring progress on the initiatives.
During DY 7 and DY 8, monitoring of the milestone reports has been relatively light. Hospitals
have been given credit for submitting a report. Very little review has been performed by
AHCA to ensure hospitals have reached outcome targets defined in their milestone plans. To
date, no hospital has been refused payment of LIP funds for failure to reach targeted milestones.
Also, LIP Tier – Two Milestone projects were designed to operate in DYs 7 – 8, and to reach
their target goals by the end of Demonstration Year 8, June 30, 2014. The LIP Tier – Two
Milestone projects were not extended in the one-year extension of the LIP.
In the 2014 renewal of Florida’s 1115 demonstration waiver, the LIP program was given a one
year extension with the intent of providing stability for providers for a limited time during

Navigant Page 67 of 246
Florida’s transition to statewide Medicaid managed care and a significantly reformed Medicaid
payment system. The LIP may be funded only through existing state and local funding
arrangements. The total amount of LIP funding may not exceed $2,167,718,341 (total
computable).
4.3 Hospital Claim and Supplemental Payment Funding
4.3.1 Background
At a high level, funds that pass through a Medicaid program for payment for health care
services for Medicaid recipients, the uninsured, and the underinsured, are categorized as either
“state share” or “federal share.” For every dollar spent, a certain percentage of that dollar
comes from the state share and the rest from the federal share. For the state of Florida, the
blended state share percentage has been in the low forties or high thirties over the last few
years. The federal share has been in the high fifties or low sixties over that same time period. In
state fiscal year 2014/15, for example, the state share percentage is 40.44 percent and the federal
share percentage is 59.56 percent. This means for every dollar spent by the Medicaid Agency in
SFY 2014/15, 40.44 cents come from state resources and 59.56 cents come from federal resources.
Another way to think of this is that $1.00 in state funds in SFY 2014/15 yields $2.47 in total funds
for the Medicaid program (1 / 0.4044 = $2.47).
Unfortunately, all Medicaid agencies struggle with a fundamental contradiction. The stronger
the economy, the more money available in state general revenue which can be used to fund the
Medicaid program and the fewer recipients in need of Medicaid support for health care
services. In contrast, when the economy is weaker, as it has been in recent years, state general
revenue decreases yet the number of recipients in need of Medicaid support for health care
services increases. In addition, as in other states, Medicaid costs are rising at a rate that may not
be sustainable. State governments and the federal government must find ways to control the
costs of Medicaid.
To help cover the cost of the Medicaid program, Florida, like many states, funds the state share
of Medicaid through a combination of general tax revenue, a hospital provider assessment,
IGTs, and CPEs. Each of these is discussed in more detail in the following sections.
4.3.2 Historical Mix of Funds
4.3.2.1 Introduction
Prior to 1986, the entire state share of funds used for payments to hospitals under the Medicaid
program came from state general revenue. Starting in 1986 and continuing in subsequent years,
a variety of legislation has been passed which has slowly reduced the percentage of the state
share of hospital funding coming from general revenue and replaced that money with funds
from other sources. Those other sources are generated through a provider assessment and
IGTs.

Navigant Page 68 of 246
4.3.2.2 Hospital Rate Reductions
The first such legislation was a provider assessment, referred to in Florida as the Public Medical
Assistance Trust Fund (PMATF), which began in 1986. The provider assessment applies to all
hospitals in Florida and is a gross receipts tax. Initially, it was implemented as a 1.5 percent
assessment on all inpatient and outpatient revenue. The PMATF has since been reduced to 1.0
percent for outpatient revenue and continues to be 1.5 percent for inpatient revenue.
Starting in July 1990, the state legislature began applying reimbursement ceilings in order to
slow the steady increase in hospital inpatient and outpatient per diem rates which were based
on hospital cost. For SFY 1990/91, the ceiling was set at 3.3 percent, meaning a hospital’s per
diem was allowed to increase by no more than 3.3 percent of the previous year’s rate, regardless
of the increase called for by the cost-based methodology. In subsequent years, the ceiling has
been set each year based on a formula using inflation factors.55
From the onset of rate ceilings, select hospitals have been designated as exempt. Initially, rural
hospitals, teaching hospitals, and certain specialized hospitals were designated as exempt from
the rate ceilings. Over the years, other hospitals have been made exempt from rate ceilings as
described below:
• In 1991, hospitals whose charity and Medicaid days exceeded 15 percent of their overall
days were exempted. (That percentage has been lowered over the years and now stands
at 11 percent, which allows more hospitals to qualify for the exemption.)
• In 2000, teaching hospitals, Community Hospital Education Program (CHEP) hospitals,
children’s hospitals and certain specialized hospitals were made exempt.
• In 2001, trauma centers whose percentage of Medicaid days exceeded 9.6 percent were
made exempt. (This percentage has also been reduced to 7.3 percent, which allows more
hospitals to qualify for the exemption.)
• In 2004 and 2005, certain hospitals with neonatal intensive care units were made exempt.
• In 2008, more hospitals were made exempt, including hospitals experiencing an increase
in Medicaid caseload by more than 25 percent in any year and hospitals whose Medicaid
per diem rate is at least 25 percent below the Medicaid per patient cost for the year.56
Exemptions for rural hospitals are funded with state general revenue. However, the other
exemptions described above are funded through county and local tax dollars that are
transferred to the state through IGTs and used to draw federal match. The IGTs are voluntary
and are contributed by some, but not all, of the counties and taxing districts in the state. These
IGTs, along with federal match, allow the state to continue to pay exempt hospitals higher
Medicaid rates without expending state general revenue. The IGTs used for these exemptions
became what is known today as automatic IGTs.
55 The Florida State Senate, Bill Analysis and Fiscal Impact Statement for SB 1988 (SPB 7094), (February 15, 2012). 56 Ibid.
Navigant Page 69 of 246
Over time, the annual ceiling on rate increases widened the gap between Medicaid rates and
hospital cost to treat Medicaid recipients. The automatic IGTs became insufficient to cover this
gap. In response, Florida Medicaid started a UPL supplemental payment program in the year
2000 that allows IGTs to be contributed, federally matched, and paid to hospitals to fund the
gap between Medicaid fee-for-service payment and hospital cost. This option was only
available to hospitals with access to a local government or taxing district willing to contribute
IGT funds. In general, this provided a worthwhile benefit to public and safety net hospitals, but
was of little help to private hospitals.
Beginning in 2005, one year prior to approval of the Medicaid managed care demonstration
waiver, the Florida Legislature began reducing rates for many Medicaid providers, including
hospitals, to help balance the overall state budget. New cuts have been applied nearly every
year between 2005 and 2012 resulting in an average of 4 percent each year with the greatest
reduction equaling approximately 12.5 percent. According to AHCA, these cuts have
collectively amounted to over 25 percent in reductions to hospital rates. In its rate-setting
methodology, AHCA refers to these cuts as “Medicaid Trend Adjustments.”57
The historical rate cuts, exemptions, and buy-backs described above applied to both hospital
inpatient and outpatient per diem rates. Since July 1, 2013, Florida Medicaid has converted to
DRG reimbursement for hospital inpatient services. The rate cuts do not directly apply to DRG
reimbursement. However, the DRG payment method was implemented in a budget neutral
fashion. As a result, the effects of the rate cuts were carried over into the current inpatient claim
payment methodology. In addition, during the conversion to DRG pricing, automatic and self-
funded IGT calculations and disbursement were held consistent with the rules followed under
the per diem payment methodology.
4.3.2.3 Introduction of the LIP Program
Beginning in SFY 2006/07, the UPL program was terminated in favor of the new LIP program.
The new LIP program was included as part of Florida’s 1115 Demonstration Waiver. The
Waiver involved shifting some of the Medicaid recipients into managed care with a plan of
eventually moving most Medicaid recipients into managed care. Without the LIP program, this
would have resulted in limitations on the UPL program, which by definition, could only take
advantage of the UPL gap associated with the remaining Medicaid fee-for-service business. By
that time, the UPL program was distributing about $630 million each year. From the state’s
point of view, the LIP program offered a way for hospitals to continue to receive supplemental
payments from IGT funds even when the amount of Medicaid fee-for-service business declined.
From CMS’s point of view, the LIP program continued the level of funding for the safety net
hospitals and offered additional funds for the creation and continuous improvement of
provider access and quality.
57 The Florida State Senate, Bill Analysis and Fiscal Impact Statement for SB 1520, (April 3, 2013).

Navigant Page 70 of 246
4.3.2.4 Self-Funded Inter-Governmental Transfers
Beginning in 2008, the Legislature began including language in the General Appropriations Act
(GAA) allowing certain hospitals to use additional IGTs (above and beyond the IGTs used to
fund exemptions) to “buy-back” all or a portion of the rate cuts imposed by the GAA in the
2008/09 fiscal year and in prior years. In this way, certain hospitals would not be paid less due
to the Legislative rate cuts if local IGTs could be secured to offset the effect of the rate cuts. In
the first year that “buy-backs” were implemented (2008/09), they were applied to the following
hospitals:
• Hospitals that were part of a system that operates a provider service network (PSN),
including Jackson Memorial, hospitals in Broward Health, hospitals in Memorial
Healthcare System, Shands Jacksonville, and Shands Gainesville;
• Children’s specialty hospitals whose Medicaid and charity days equaled or exceeded 30
percent;
• Rural hospitals; and
• Public hospitals, teaching hospitals that had 70 or more resident physicians, and
hospitals whose Medicaid and charity days exceeded 25 percent.58
In SFY 2009/10, designated trauma hospitals were added to the list of hospitals allowed to use
IGTs to buy-back their rate cuts. In SFY 2010/11, hospitals with graduate medical education
positions that did not otherwise qualify were added to the list. Finally for SFY 2011/12, proviso
was included to allow all other hospitals to get involved in the self-funded IGT program, as
long as they could secure IGTs for this purpose. Each year the proviso has included a limit on
the amount of self-funded IGTs. In SFY 2011/12, this limit was $187 million. In subsequent
years, as the state learned there were donors willing to contribute, the Legislature has
continuously increased the self-funded IGT limit. In SFY 2014/15, this limit is just under $390
million in state share which translates to approximately $960 million total computable (total
when adding federal matching funds).
4.3.2.5 Mix of Funding in Recent Years
Over the most recent five years for which complete data are available, the sources of funding for
the state share of Medicaid hospital reimbursement have been fairly consistent. In addition, the
relative contribution from each source has been consistent. For hospital reimbursements, the
bulk of state funding comes from state general revenue and IGTs, with a sizeable amount also
coming from the PMATF provider assessment, and a very small portion of the funds coming
from CPEs. This is shown in Figure 7 below:
58 The Florida State Senate, Bill Analysis and Fiscal Impact Statement for SB 1988 (SPB 7094), (February 15, 2012).

Navigant Page 71 of 246
Figure 7. Distribution of funding sources for state share of Medicaid hospital payments over the
previous five years.
Notes for Figure 7:
1) The figure above includes funding for hospital fee-for-service rates, hospital managed
care capitation rates, LIP supplemental payments and DSH supplemental payments.
Medicare crossover claims, in which Medicare is the primary payer, are excluded.
2) During these timeframes, the state portion of all funding for managed care capitation
came from state general revenue.
3) Expenditures in SFY 2008/09 are understated because hospital managed care
expenditures were not available for this year.
16%
34% 39% 38% 37%
31%
23% 20%
15% 17%
49% 41% 39% 44% 44%
3% 3% 3% 2% 2%
0%
20%
40%
60%
80%
100%
2008/09* 2009/10 2010/11 2011/12 2012/13
*GR percentage is lower because no data was available for managed care
capitation payments.
General Revenue Provider Assessment IGTs CPEs

Navigant Page 72 of 246
The sources of funds for SFY 2012/13 are shown in the following figure:
Figure 8. Sources of state share of Medicaid funding for hospitals in SFY 2012/13.
Specifically for hospital reimbursement, funds from general revenue constitute less than half of
the total state share. However, general revenue constitutes more than half of the total state
share when looking at the overall Medicaid program, including payment for all health care
services, such as hospital, nursing home, physician, pharmacy, school programs, etc. Using
values from SFY 2012/13, this is depicted in Figure 9 below. Comparing the previous and
following figures, general revenue funds 37 percent of the non-federal share of Medicaid
hospital reimbursements and 61 percent of the non-federal portion of Medicaid reimbursements
overall.
General Revenue
37%
Provider
Assessment
17%
CPEs
2%
IGTs
44%

Navigant Page 73 of 246
Figure 9. Sources of state share of Medicaid funding for all health care services in SFY 2012/13.
4.3.3 General Revenue
In SFY 2012/13, Florida raised over $23.7 billion through its General Fund, the predominant
fund for financing a state’s operations, with revenue received from broad-based state taxes.59
Florida primarily receives its general revenue through property taxes and sales and gross
receipt taxes, accounting for 43 and 47 percent of state tax revenue respectively (FY 2010 data).60
These funds help finance various state programs such as elementary and secondary education,
higher education, public assistance, corrections, transportation, and Medicaid.
In most states, Medicaid is the largest or second largest line item in the state budget. This is
true in Florida as well. When looking at state share only in Florida, Medicaid was the second
largest budget line item behind education (when including elementary, secondary, and higher
education) in SFY 2011/12. However, Medicaid receives significantly more federal funds than
education. When looking at total expenditures, including state and federal share, Medicaid was
the largest expenditure item in Florida in SFY 2011/12.61 In addition, total Medicaid expenses
are continually increasing as a percentage of total state outlays. For example, in Florida in SFY
59 NASBO, State Expenditure Report 2012,
http://www.nasbo.org/sites/default/files/State%20Expenditure%20Report%20%28Fiscal%202011-
2013%20Data%29.pdf 60 Tax Foundation. The Sources of State and Local Tax Revenue. (January 29, 2013)
http://taxfoundation.org/sites/taxfoundation.org/files/docs/ff354.pdf 61 NASBO, State Expenditure Report 2012.
General Revenue
61%
Provider
Assessment
6%
IGTs
26%
CPEs
7%
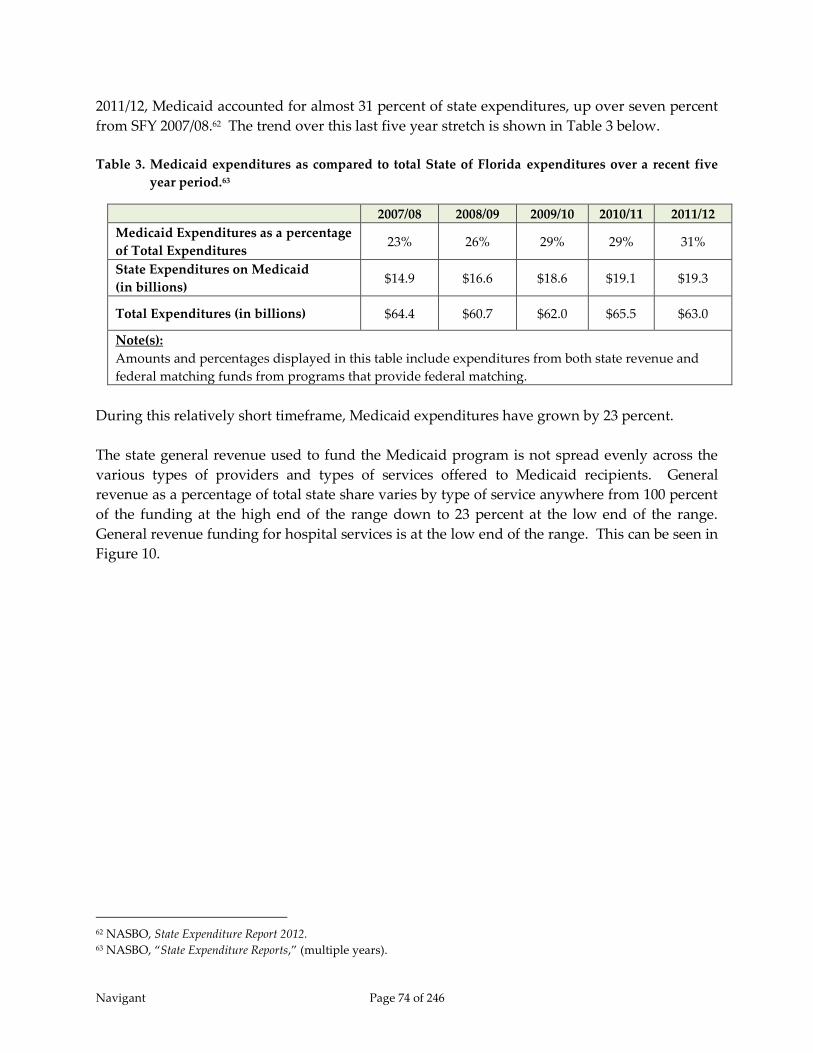
Navigant Page 74 of 246
2011/12, Medicaid accounted for almost 31 percent of state expenditures, up over seven percent
from SFY 2007/08.62 The trend over this last five year stretch is shown in Table 3 below.
Table 3. Medicaid expenditures as compared to total State of Florida expenditures over a recent five
year period.63
2007/08 2008/09 2009/10 2010/11 2011/12
Medicaid Expenditures as a percentage
of Total Expenditures 23% 26% 29% 29% 31%
State Expenditures on Medicaid
(in billions) $14.9 $16.6 $18.6 $19.1 $19.3
Total Expenditures (in billions) $64.4 $60.7 $62.0 $65.5 $63.0
Note(s):
Amounts and percentages displayed in this table include expenditures from both state revenue and
federal matching funds from programs that provide federal matching.
During this relatively short timeframe, Medicaid expenditures have grown by 23 percent.
The state general revenue used to fund the Medicaid program is not spread evenly across the
various types of providers and types of services offered to Medicaid recipients. General
revenue as a percentage of total state share varies by type of service anywhere from 100 percent
of the funding at the high end of the range down to 23 percent at the low end of the range.
General revenue funding for hospital services is at the low end of the range. This can be seen in
Figure 10.
62 NASBO, State Expenditure Report 2012. 63 NASBO, “State Expenditure Reports,” (multiple years).
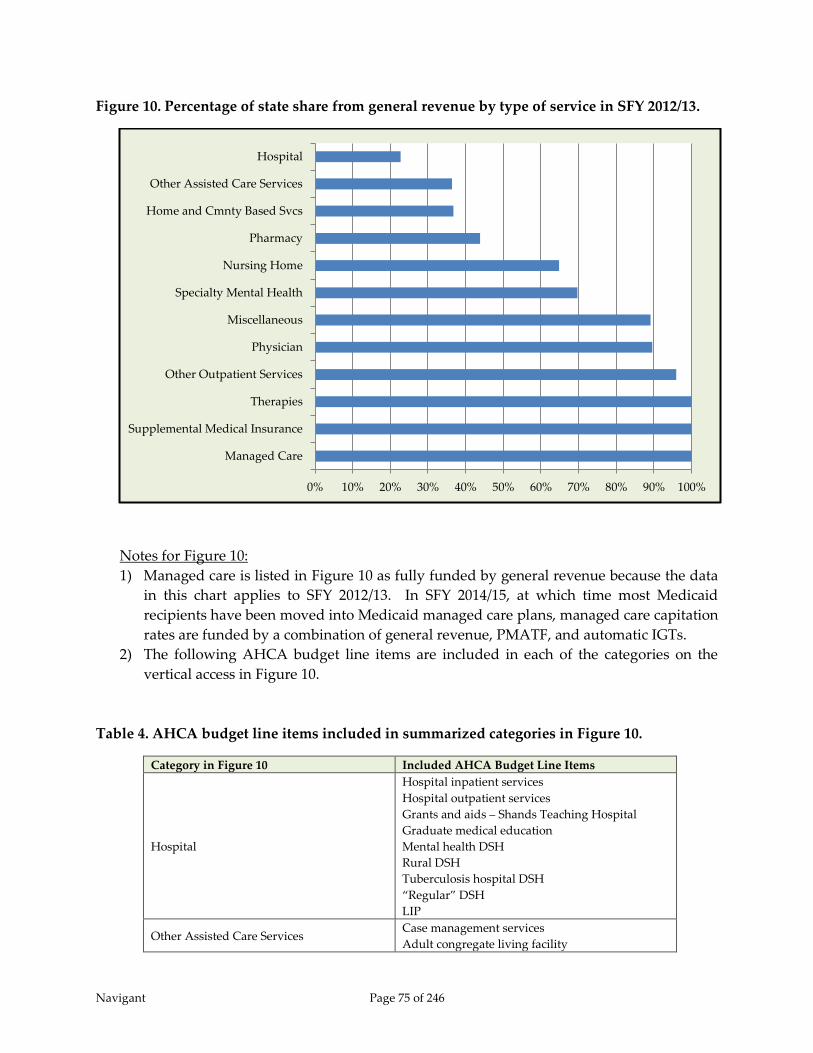
Navigant Page 75 of 246
Figure 10. Percentage of state share from general revenue by type of service in SFY 2012/13.
Notes for Figure 10:
1) Managed care is listed in Figure 10 as fully funded by general revenue because the data
in this chart applies to SFY 2012/13. In SFY 2014/15, at which time most Medicaid
recipients have been moved into Medicaid managed care plans, managed care capitation
rates are funded by a combination of general revenue, PMATF, and automatic IGTs.
2) The following AHCA budget line items are included in each of the categories on the
vertical access in Figure 10.
Table 4. AHCA budget line items included in summarized categories in Figure 10.
Category in Figure 10 Included AHCA Budget Line Items
Hospital
Hospital inpatient services
Hospital outpatient services
Grants and aids – Shands Teaching Hospital
Graduate medical education
Mental health DSH
Rural DSH
Tuberculosis hospital DSH
“Regular” DSH
LIP
Other Assisted Care Services Case management services
Adult congregate living facility
0% 10% 20% 30% 40% 50% 60% 70% 80% 90% 100%
Managed Care
Supplemental Medical Insurance
Therapies
Other Outpatient Services
Physician
Miscellaneous
Specialty Mental Health
Nursing Home
Pharmacy
Home and Cmnty Based Svcs
Other Assisted Care Services
Hospital

Navigant Page 76 of 246
Category in Figure 10 Included AHCA Budget Line Items
Assistive care services waiver
Healthy start waiver
Capitated nursing home diversion
Program care for the elderly (PACE)
Personal care services
Home and Community Based Services
Home and Community Based Services (HCBS)
Private duty nursing services
Home health services
Pharmacy Prescribed medicine
Medicare Part D
Nursing Home Nursing Home
Specialty Mental Health
State mental health hospitals
ICF-MR Sunland
ICF-MR community
Community mental health services
Miscellaneous
Patient transportation
Hospice
School based services
Developmental evaluation and intervention
Medipass – program expired with the full
migration to Managed Medical Assistance in
the summer of 2014
Physician
Physician services
Physician assistant services
Adult dental
Adult vision and hearing
EPSDT
Other Outpatient Services
Other lab and x-ray
Family planning services
Clinic services
Dialysis center
Rural health clinics
Birthing center services
Nurse practitioner services
Therapies
Physical therapy services
Occupational therapy services
Speech therapy services
Respiratory therapy services
Therapy for children
Supplemental Medical Insurance Supplemental Medical Insurance
Managed Care Prepaid health plan
4.3.4 Inter-governmental Transfers
4.3.4.1 Introduction – IGTs
The primary way hospitals contribute money to fund the Medicaid program is through Inter-
governmental Transfers (IGTs). The IGT program in Florida is an optional program for which
government-owned hospitals, counties, and taxing districts may choose to participate. For

Navigant Page 77 of 246
those that do participate, the IGT contributors have an option of five types of programs to
which they may contribute:
1) LIP and automatic IGTs (automatic IGTs are rate buy-backs which enhance the inpatient
and outpatient claim payments for hospitals that qualify)
2) Alternative LIP - various small programs which are included within the $1 billion LIP
waiver and are listed below (a short description of each of these programs is given in
Appendix B):
a. $4.5 million County Health Department Initiatives
b. $7.2 million for FQHCs and CHDs
c. $2 million for primary care within CHDs
d. $11 million for FQHCs
e. $3.2 million for poison control programs
f. $34 million for primary care awards
g. Premium assistance for Palm Beach and Miami-Dade counties
h. $3 million for hospital-based primary care initiatives – $750,000 for each hospital
i. $35 million for quality initiatives described in STC 61a – split into $20 million for
new initiatives and $15 million to expand existing initiatives
j. Manatee ER Diversion program
3) Disproportionate Share Hospital (DSH)
4) Self-funded rate enhancements (referred to as “LIP 6” in SFY 2014/15 and moved under
the LIP program)
Local governments may specify how their IGT dollars should be applied to the above programs.
Because of this, AHCA cannot definitively predict the budgets for each program until annual
commitment letters are submitted by the IGT contributors. The annual commitment letters are
referred to as “letters of agreement (LOAs)” and are received by AHCA during the first quarter
of each state fiscal year – between July and September. In recent years, enough IGTs have been
received to fund over 99 percent of the LIP and Alternative LIP programs.
The programs comprise a significant portion of hospital Medicaid and uninsured funding each
year. In SFY 2012/13, for example, these programs made up 46 percent of payments to
hospitals. Some of these are paid out as supplemental payments (LIP and DSH) while others
have traditionally been distributed through claim payments as rate enhancements (automatic
and self-funded rate enhancements). In SFY 2014/15, automatic rate enhancements continue,
and also affect the managed care capitation rates. Self-funded rate enhancements, in contrast,
have been moved to supplemental payments in the form of LIP 6 and are paid directly from
AHCA to the participating hospitals.
4.3.4.2 LIP, Alternative LIP and Automatic IGTs
For SFY 2012/13, budgeted contributions towards LIP and rate buy-backs total $750 million in
IGTs, which comprise the state share and $1.025 billion in federal matching for a total of $1.775
billion available for distribution. Of this, $996 million was paid out through the LIP Waiver

Navigant Page 78 of 246
program and the remainder, $779 million, was paid out via enhanced rates for inpatient and
outpatient services for select hospitals in the form of automatic rate enhancements.
Hospitals with access to IGTs and who choose to contribute to the LIP and automatic rate
enhancement programs are given a guarantee of receiving back their IGT money plus an 8.5
percent usage fee at a minimum through a category of LIP disbursements referred to as “LIP
Allocation Distribution.” In addition, IGT funds are used to draw down federal matching funds
which contribute to LIP, alternative LIP, and automatic rate enhancements. Using the federal
matching funds, hospitals that contribute to LIP and automatic rate enhancements may, and
generally do, receive back more than the 8.5 percent usage fee through the allocation of LIP and
automatic rate enhancements whose distribution is determined by the Florida Legislature (with
recommendations from the LIP Council). In addition, some of the federal matching funds are
made available through LIP and alternative LIP to hospitals which do not contribute IGTs and
to some health care providers that are not hospitals at all. Thus with these two programs, some
health care providers who have not contributed IGTs are able to receive financial benefit.
The LIP Allocation Distribution, which refunds hospitals their IGT contributions plus an 8.5
percent usage fee, is refunding money used to fund more than just the $1 billion LIP Waiver
program. This money is also used to fund rate enhancements through automatic IGTs. Thus,
the more rate enhancements are funded through this program, the more money gets paid out
through the LIP Allocation Distribution, leaving less money for discretionary distribution under
the $1 billion LIP Waiver program. In SFY 2012/13, for example, $711 million was contributed
through IGTs to help fund the LIP program and automatic rate enhancements. This resulted in
$772 million was allocated through the LIP Allocation Distribution, which meant only $228
million was available through the Waiver to fund safety net hospitals, uncompensated care, and
various initiatives intended to improve the delivery of health care to Florida Medicaid
recipients through the Alternative LIP program. Thus, despite being a $1 billion program, only
23 percent of that money is made available for discretionary distribution. The discretionary
distribution funds all of the sub-programs listed previously as being part of Alternative LIP.
There are numerous local governmental programs that contribute IGTs to fund LIP and
automatic IGT rate enhancements. In SFY 2012/13, for example, there were 43 local government
contributors. However, a striking majority of the IGTs come from three specific agencies,
Miami-Dade County, North Broward Hospital District, and South Broward Hospital District.
82 percent of the funds collected in SFY 2012/13 came from these three local governments.
4.3.4.3 Disproportionate Share Hospital Funding
Florida pays out relatively little in DSH payments as compared to other state Medicaid
agencies. Despite being the fifth64 (5th) largest Medicaid program in FFY 2012, Florida Medicaid
64 The Kaiser Family Foundation, State Health Facts, Federal Medicaid Disproportionate Share Hospital (DSH) Allotments.
Available at http://kff.org/medicaid/state-indicator/total-medicaid-spending.
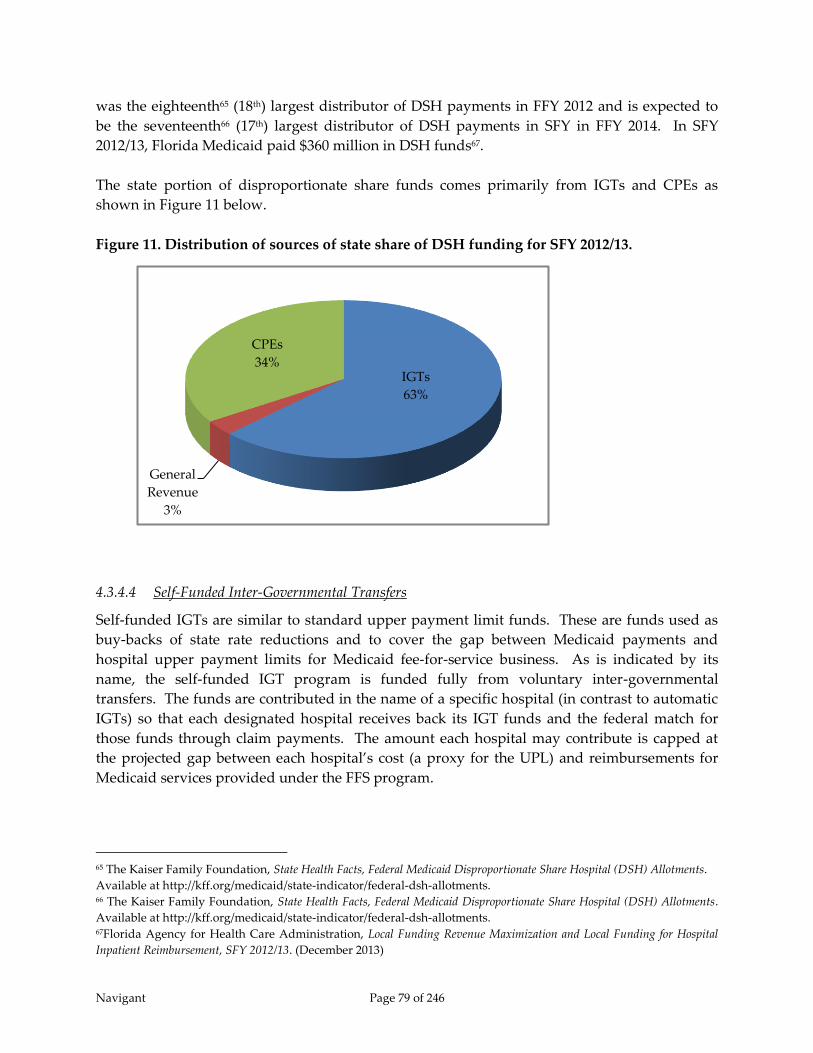
Navigant Page 79 of 246
was the eighteenth65 (18th) largest distributor of DSH payments in FFY 2012 and is expected to
be the seventeenth66 (17th) largest distributor of DSH payments in SFY in FFY 2014. In SFY
2012/13, Florida Medicaid paid $360 million in DSH funds67.
The state portion of disproportionate share funds comes primarily from IGTs and CPEs as
shown in Figure 11 below.
Figure 11. Distribution of sources of state share of DSH funding for SFY 2012/13.
4.3.4.4 Self-Funded Inter-Governmental Transfers
Self-funded IGTs are similar to standard upper payment limit funds. These are funds used as
buy-backs of state rate reductions and to cover the gap between Medicaid payments and
hospital upper payment limits for Medicaid fee-for-service business. As is indicated by its
name, the self-funded IGT program is funded fully from voluntary inter-governmental
transfers. The funds are contributed in the name of a specific hospital (in contrast to automatic
IGTs) so that each designated hospital receives back its IGT funds and the federal match for
those funds through claim payments. The amount each hospital may contribute is capped at
the projected gap between each hospital’s cost (a proxy for the UPL) and reimbursements for
Medicaid services provided under the FFS program.
65 The Kaiser Family Foundation, State Health Facts, Federal Medicaid Disproportionate Share Hospital (DSH) Allotments.
Available at http://kff.org/medicaid/state-indicator/federal-dsh-allotments. 66 The Kaiser Family Foundation, State Health Facts, Federal Medicaid Disproportionate Share Hospital (DSH) Allotments.
Available at http://kff.org/medicaid/state-indicator/federal-dsh-allotments. 67Florida Agency for Health Care Administration, Local Funding Revenue Maximization and Local Funding for Hospital
Inpatient Reimbursement, SFY 2012/13. (December 2013)
IGTs
63%
General
Revenue
3%
CPEs
34%

Navigant Page 80 of 246
Prior to SFY 2014/15, self-funded IGTs were distributed as rate enhancements. Because of this,
hospitals are at risk of losing money if their Medicaid utilization is unexpectedly low.
However, given a federal matching percentage over 59 percent this risk is not significant. As
long as a hospital’s Medicaid utilization in the rate year is at least 41 percent of its anticipated
volume, the hospital receives back all of its self-funded IGT contributions. In addition, not all
hospitals have access to contribute IGT funds. IGTs must come from a governmental agency
and cannot be sent directly from a private hospital to the Medicaid Agency. Hospitals without
access to IGTs have no other option than to rely on the automatic IGTs distributed by the LIP
Council and Florida Legislature to help cover the gap between Medicaid payment and hospital
cost. As stated earlier, only about 23 percent of the $1 billion in total computable LIP dollars is
available for discretionary distribution, which includes hospitals without access to IGTs.
In SFY 2014/15, self-funded IGTs were abolished in their previous form, and were incorporated
into the LIP program. They became what are referred to as the “LIP-6” program.
4.3.5 Certified Public Expenditures
Florida Medicaid utilizes Certified Public Expenditures (CPEs) to help fund Medicaid payments
for school-based services, hospital disproportionate share payments, and physician
supplemental payments. In SFY 2012/13, CPEs comprised 100 percent of the state share of
funding for school-based Medicaid services, 34 percent of the state share for DSH payments and
100 percent of the state share for physician supplemental payments. In terms of hospital
reimbursements overall, CPEs comprised two percent of total state funding.
No CPEs are used to help fund Medicaid payments to the four state-owned psychiatric specialty
hospitals.
A total of $96 million in CPEs were identified in SFY 2012/13 for school based services. Another
$52 million was identified for the DSH program and was spread across three DSH categories,
mental health DSH, “regular” DSH, and specialty hospital DSH. $79 million in CPEs were
identified for the physician supplemental payment program, which provides for “supplemental
payments for services provided by doctors of medicine and osteopathy as well as other licensed
health care practitioners employed by or under contract with either (1) and medical school that
is part of the public university system (Florida State University, The University of Florida, and
The University of South Florida; (2) a private medical school that places over 50 percent of their
residents with a public hospital (The University of Miami); (3) Nova Southeastern University.”68
In SFY 2014/15, the physician supplemental program moved under the LIP program. In
addition, the funding for the physician supplemental program changed from CPEs to IGTs.
4.3.6 Hospital Assessment
Florida Medicaid has had a hospital assessment, otherwise known as a provider tax, in place for
over 20 years. As mentioned previously, the hospital assessment is referred to as the “Public
68 Florida State Plan, Attachment 4.19-B, effective for SFY 2013/14.

Navigant Page 81 of 246
Medical Assistance Trust Fund.” The assessment collects from each hospital an amount equal
to 1.5 percent of the annual net operating revenue for inpatient services and one percent of the
annual net operating revenue for outpatient services. Net operating revenue is defined as gross
operating revenue minus revenue not collected. In this formula, gross operating revenue is
defined as “the sum of daily hospital service charges, ambulatory service charges, ancillary
service charges, and other operating revenue.”69 In addition, revenue not collected is defined as
“bad debts; contractual adjustments; uncompensated care; administrative, courtesy, and policy
discounts and adjustments; and other such revenue deductions, but also includes the offset of
restricted donations and grants for indigent care.”70 Lastly, a hospital is defined in section
395.002 (12) of the Florida Statues as any facility in Florida meeting the following criteria:
(a) “Offers services more intensive than those required for room, board, personal
services, and general nursing care, and offers facilities and beds for use beyond
24 hours by individuals requiring diagnosis, treatment, or care for illness, injury,
deformity, infirmity, abnormality, disease, or pregnancy; and
(b) Regularly makes available at least clinical laboratory services, diagnostic X-ray
services, and treatment facilities for surgery or obstetrical care, or other definitive
medical treatment of similar extent, except that a critical access hospital, as
defined in s. 408.07, shall not be required to make available treatment facilities
for surgery, obstetrical care, or similar services as long as it maintains its critical
access hospital designation and shall be required to make such facilities available
only if it ceases to be designated as a critical access hospital.”71
As shown previously in Figure 7, funds collected through the provider assessment each state
fiscal year have been relatively constant despite the fact that no hospital assessment funds were
paid out in SFY 2010/11 and two years of hospital assessment funds were distributed in SFY
2011/12. Money from the hospital assessment, both state and federal share, contributes to
hospital inpatient and outpatient rates and is distributed through claim payments. In SFY
2012/13, nearly $470 million was collected, which drew down over $641 million in federal
matching funds, resulting in a total of $1.1 billion in funds contributing to hospital rates. In a
majority of cases, the cost of the assessment is paid back to providers through an increase in the
Medicaid reimbursement rate, but consistent with the federal redistributive and hold harmless
provisions of health care-related tax programs, not all hospitals get back all that they were
69 Florida Statutes, Section 395.701 (1)(b), Retrieved August 25, 2014 from
http://www.leg.state.fl.us/statutes/index.cfm?mode=View%20Statutes&SubMenu=1&App_mode=Display_Statute&Se
arch_String=395.701&URL=0300-0399/0395/Sections/0395.701.html. 70 Florida Statutes, Section 395.701 (1)(e), Retrieved August 25, 2014 from
http://www.leg.state.fl.us/statutes/index.cfm?mode=View%20Statutes&SubMenu=1&App_mode=Display_Statute&Se
arch_String=395.701&URL=0300-0399/0395/Sections/0395.701.html. 71 Florida Statutes, Section 395.002 (12), Retrieved August 25, 2014 from
http://www.leg.state.fl.us/statutes/index.cfm?mode=View%20Statutes&SubMenu=1&App_mode=Display_Statute&Se
arch_String=395.701&URL=0300-0399/0395/Sections/0395.701.html.

Navigant Page 82 of 246
assessed. Hospitals with very low Medicaid volume may not receive as much in increased rates
as they paid out through the assessment.
4.4 Claim and Supplemental Payments
AHCA reimburses hospitals in two general forms – claim payments, which are directly tied to
Medicaid utilization, and supplemental payments distributed on a periodic basis. For services
provided under the FFS program, claim payments are made directly to hospitals from AHCA.
For services provided under the Medicaid managed care waiver, AHCA makes capitation
payments to managed care plans that in turn, make claim payments to hospitals based on
Medicaid utilization. LIP and DSH payments are considered separate from FFS claims based
payments and managed care capitation payments, and are paid by AHCA to hospitals on a
quarterly basis.
In SFY 2012/13, the distribution between claim payments (including those made through
capitation arrangements) and supplemental payments – LIP and DSH payments, was as shown
in Figure 12 below.
Figure 12. Source of Medicaid payments to hospitals in SFY 2012/13.
Historically, Florida Medicaid has paid for hospital services primarily through a fee-for-service
program. However, a major shift to Medicaid managed care occurred in calendar year 2014 at
which time approximately 75 percent of the Medicaid program moved to managed care.
Because of this migration, self-funded IGTs and physician supplemental payments were moved
into the LIP program for SFY 2014/15.
FFS Claims
60%
LIP
16%
DSH
5%
MC Cap Rates
19%

Navigant Page 83 of 246
4.4.1 Claim Payments
Historically, Florida Medicaid has paid for hospital inpatient and outpatient services in the FFS
program through cost-based rates. Each hospital was assigned its own unique inpatient per
diem and outpatient procedure rate. The rates were based on available unaudited Medicare
cost report data, which includes historical hospital allowable cost information and lags behind
present day. Over time, often two or three years after a rate year, hospital cost reports are
audited or otherwise finalized, and the cost-based rates are adjusted based on the audited or
finalized cost data. If a hospital’s rates change as a result of a cost report audit, then the
historical claims get adjusted so that they pay out at the new rate.
As of SFY 2014/15, cost-based rates continue to be used by Florida Medicaid to reimburse
hospital outpatient services. In contrast, the method for paying for FFS hospital inpatient
services has been modified, and payments were established using a DRG-based prospective
payment method starting July 1, 2013. The DRG-based payment method has only five hospital-
based rates, instead of separate hospital-specific rates as were present under the legacy per
diem payment method. The five categories of hospitals with their own DRG base rate are rural
hospitals, long term acute care hospitals, free-standing rehabilitation hospitals, hospitals with
very high Medicaid utilization and very high outlier payments, and all other hospitals. These
categories were selected because of general differences in cost structures across the categories
and to help minimize losses at hospitals with a significant percentage of their business coming
from Medicaid recipients. The DRG payment method is a prospective payment method that is
much less tied to costs at individual hospitals. Because of this, rates are not adjusted and claims
are not reprocessed after cost reports are audited or finalized.
In all of the hospital payment methods, inpatient per diem, inpatient DRG payment, outpatient
average procedure rate and capitation, money from general revenue, the provider assessment
and IGTs are used to fund the non-federal share of reimbursements. Historically the rules for
how much each hospital received from the various funding sources varied based on an evolving
set of rate cuts, rate ceilings, and exemptions to the cuts and the ceilings. The cuts, ceilings, and
exemptions were defined through a series of rules set by the Florida Legislature over the last 20
years. This resulted in a relatively complicated process for setting rates in which different rules
applied to various categories of hospitals. With the move DRG payment, and the move to
Medicaid managed care, the rate setting process has been simplified.
However, the funding sources have remained the same, with funds from IGTs making up a
significant portion of the overall budget. Prior to SFY 2014/15, the IGT funds were categorized
as either automatic IGTs or self-funded IGTs. Automatic IGTs were distributed across hospitals
by the Florida Legislature with recommendations made by the Low Income Pool Council which
used an extensive set of criteria to allocate the money. The LIP Council allocated automatic
IGTs to many hospitals due to their specialty designation, even some in counties which did not
contribute any funds through IGTs. In SFY 2012/13, for example, 99 hospitals received rate
enhancements from automatic IGT funds. That left 122 hospitals without the benefit of rate
enhancement from automatic IGT funds.

Navigant Page 84 of 246
Historically, rate enhancements were also available through self-funded IGTs. Self-funded IGTs
are contributed in the name of a specific hospital (in contrast to automatic IGTs) so that
hospitals receive back their IGT funds and the federal matching on those funds through claim
payments. However, not all hospitals have the capacity to contribute IGT funds. IGTs must
come from a governmental agency and cannot be sent directly from a private hospital to the
Medicaid Agency. In SFY 2012/13, 80 hospitals received rate enhancements from self-funded
IGTs. Combining automatic and self-funded rate enhancements, a total of 132 hospitals
received rate enhancements from IGT funds. The remaining 89 Florida hospitals who saw
Medicaid patients during that fiscal year did not receive rate enhancements from IGT funds.
The result is a rather strong disparity in the average pay-to-cost values for hospitals receiving
IGTs versus those that do not when looking at claim payments alone. This disparity is shown in
Figure 13 when looking at the Medicaid FFS program (not considering uncompensated care).
Figure 13. Claim payment pay-to-cost ratios for hospitals who receive IGT funds versus
hospitals that do not.
The fact that the LIP Council determined distribution of funds for both the LIP program and for
automatic IGTs had the benefit of allowing both sets of funds to be distributed across more than
just hospitals in counties which contributed IGT funds. However, to date, automatic IGTs have
been used solely for hospital rate enhancements and have not been tied to any quality measures
or programs designed to improve health care delivery in Florida.
83%
45%
0%
10%
20%
30%
40%
50%
60%
70%
80%
90%
IGT Rate Enhancements No IGT Rate Enhancements
132
Hospitals 89
Hospitals
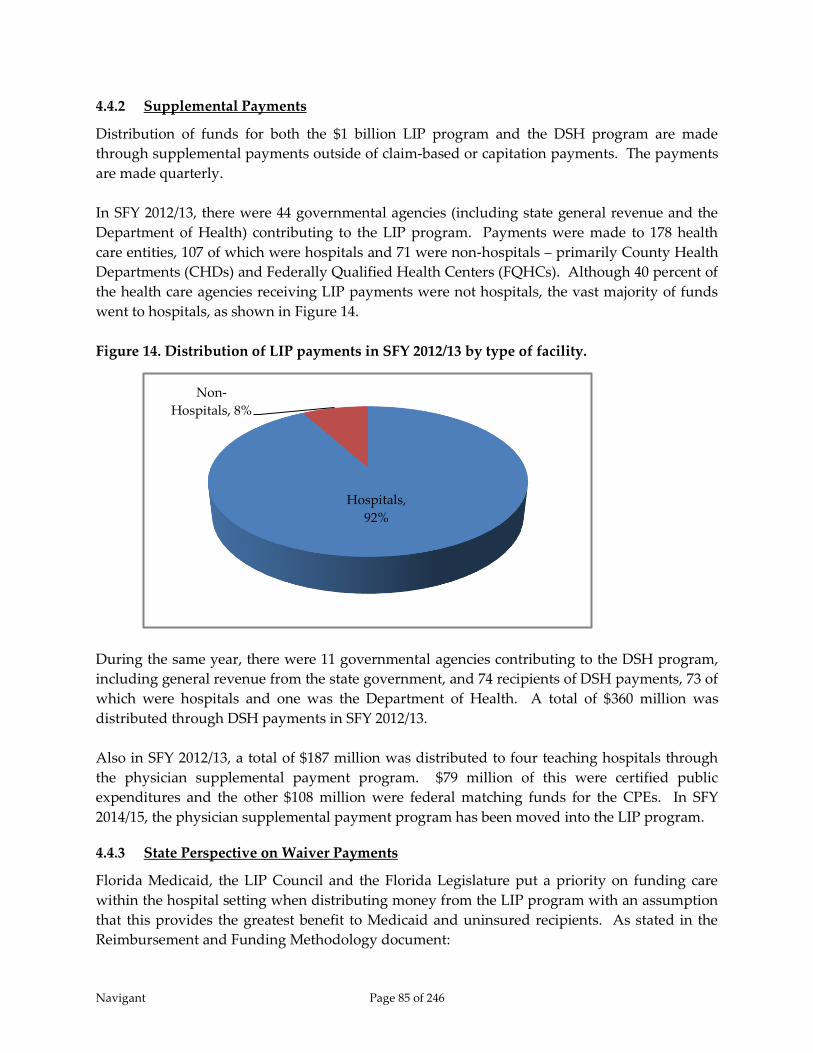
Navigant Page 85 of 246
4.4.2 Supplemental Payments
Distribution of funds for both the $1 billion LIP program and the DSH program are made
through supplemental payments outside of claim-based or capitation payments. The payments
are made quarterly.
In SFY 2012/13, there were 44 governmental agencies (including state general revenue and the
Department of Health) contributing to the LIP program. Payments were made to 178 health
care entities, 107 of which were hospitals and 71 were non-hospitals – primarily County Health
Departments (CHDs) and Federally Qualified Health Centers (FQHCs). Although 40 percent of
the health care agencies receiving LIP payments were not hospitals, the vast majority of funds
went to hospitals, as shown in Figure 14.
Figure 14. Distribution of LIP payments in SFY 2012/13 by type of facility.
During the same year, there were 11 governmental agencies contributing to the DSH program,
including general revenue from the state government, and 74 recipients of DSH payments, 73 of
which were hospitals and one was the Department of Health. A total of $360 million was
distributed through DSH payments in SFY 2012/13.
Also in SFY 2012/13, a total of $187 million was distributed to four teaching hospitals through
the physician supplemental payment program. $79 million of this were certified public
expenditures and the other $108 million were federal matching funds for the CPEs. In SFY
2014/15, the physician supplemental payment program has been moved into the LIP program.
4.4.3 State Perspective on Waiver Payments
Florida Medicaid, the LIP Council and the Florida Legislature put a priority on funding care
within the hospital setting when distributing money from the LIP program with an assumption
that this provides the greatest benefit to Medicaid and uninsured recipients. As stated in the
Reimbursement and Funding Methodology document:
Hospitals,
92%
Non-
Hospitals, 8%

Navigant Page 86 of 246
“An evaluation of services typically covered within a coverage model generally results
in a broad array of services that vary in cost per unit and the financial risk for the
insured related to the use of such services. An individual may be able to afford a dental
visit or a single pharmaceutical, but would incur significant financial risk if a lengthy or
acute hospital stay was required. Therefore, consistent with the prioritization of covered
services in Medicare Part A and the general insurance market, the State recognizes a
priority of services subject to coverage from the LIP. Just as Medicare and commercial
coverage attempt to cover hospital services first, the LIP recognizes that the uninsured
must have their hospital risk addressed first. Subsequent to addressing the hospital risk,
the LIP can then address subsequent services such as physician services, clinic services,
drugs or limited benefit packages as they present lower risks than critical hospital
services.”72
The distribution of LIP funds also takes into consideration the originators of the state share of
the funds, many of which name specific hospitals in their jurisdictions for which the local
governments wish their funds to be applied. Florida Medicaid feels this is necessary to ensure
continued local government support in funding the Medicaid program.
“Although the State is not promoting a predetermined benefit for the local governments
providing funding, the State does recognize that it is inappropriate to require a local
government to assist with the funding of a benefit for providers outside that local
government’s area without consideration of the benefits received by providers within its
political subdivision. The State believes it is sound public policy to provide each local
government the assurance that its providers will not receive less from LIP than if the
local government provided direct financial assistance to its providers.”73
At the same time, controls exist to ensure LIP funding does not exceed the costs of services
provided to uninsured, underinsured, and Medicaid recipients. The LIP Council and Florida
Legislature use the following set of priorities when distributing funds within the LIP Waiver:
1. Hospital services are prioritized in the distribution methodology;
2. Providers within a local area will not receive less than they would have received if
they were to obtain funding directly from their local governments for services
related to Medicaid, the uninsured, and the underinsured; and
3. Payments to providers will not exceed the cost of services for the uninsured,
underinsured, and Medicaid shortfalls.
72 Florida Agency for Health Care Administration, Reimbursement and Funding Methodology – Florida Medicaid Reform
Section 1115 Waiver – Low Income Pool. (February 2014) 73 Ibid.
Navigant Page 87 of 246
4.4.4 Review of CMS-64 Reports
CMS-64 reports, entitled “Quarterly Medicaid Statement of Expenditures” are completed
quarterly by each state Medicaid agency and are submitted to CMS. These reports are used to
document and communicate state expenditures made through the Medicaid program and to
define the amount of funds due to states from CMS for the federal share of Medicaid costs.
Thus CMS-64 reports, while routine and produced as part of standard operating practice, are
very important as they affect transfer of extremely large sums of money from the federal
government to state governments. Because of the importance of these reports, the specifications
for this study included a request for a review to be performed of the data included in recent
CMS-64 reports versus Medicaid payments documented via other sources.
We performed the review of Medicaid payments made during state fiscal year 2012/13 as this
was the most recent complete state fiscal year for which data was available at the time of this
study. Florida SFY 2012/13 runs from July 1, 2012 through June 30, 2013. Because CMS-64
reports are produced quarterly, this included CMS-64 reports for quarters ending September 30,
2012, December 31, 2012, March 31, 2013, and June 30, 2013. In addition, the scope of this study
focuses on providers receiving payments through the LIP program, which are primarily acute
care hospitals, so our payment comparisons focused on those related to acute care hospitals.
Overall payments reported through CMS-64 reports aligned relatively closely with Medicaid
payments reported through other sources. This comparison is shown in Table 5 below. For
hospital inpatient and outpatient claim data, we used claim extracts from the Florida MMIS to
validate against payments reported on the CMS-64 reports. The total of $3.635 billion shown in
Table 5 matches the sum of total inpatient and outpatient fee-for-service payments displayed in
Appendix D – Hospital Payments.74 For disbursements within the LIP and DSH programs, we
used data reported in AHCA’s annual “Local Funding Revenue Maximization and Local
Funding for Hospital Inpatient Reimbursement” report which is submitted to both the Florida
Legislature and CMS each year.
74 Managed care capitation payments are not included in this section because they are typically reported as a single
line item, not broken out by type of provider.

Navigant Page 88 of 246
Table 5. Medicaid payments reported for SFY 2012/13.
CMS-64
Other
Reporting
Percentage
Difference Source of Other Reporting
FFS Hospital Claims $3,718 $3,635 -2.2% Claim data from FL MMIS
LIP $1,019 $996 -2.3% AHCA Revenue Maximization Report
DSH – Inpatient
Hospitals $244 $241 -1.2% AHCA Revenue Maximization Report
DSH – Mental Health
Facilities $86 $74 -14.0% AHCA Revenue Maximization Report
DSH Total $330 $315 -4.5% AHCA Revenue Maximization Report
Overall Total $5,067 $4,946 -2.4%
Notes:
1) Data from SFY 2012/13.
2) Dollar amounts are in millions.
3) Claim payments in CMS-64 reports were retrieved from reporting categories 1A and 6A.
4) LIP payments in CMS-64 reports were retrieved from reporting category 1C.
5) DSH payments in CMS-64 reports were retrieved from reporting categories 1B and 2B.
Differences between payment amounts reported in the CMS-64 reports versus other sources can
be attributed to the fact that the timeframes for payments selected in each reporting method
differ slightly. CMS-64 reports include payments based on actual date of payment. In contrast,
our MMIS claim data was selected based on date of service because this is the way claim data is
typically selected for rate setting. Because there is some lag between first date of service and the
date in which an individual claim is submitted by the provider and paid by Medicaid, claims
included in the CMS-64 reports will not exactly match claims selected based on first date of
service. Also, our claim data included only billings from in-state hospitals, not out of state
hospitals. The CMS-64 includes payments to out-of-state hospitals. In addition for claim data,
differences between payment amounts in the CMS-64 versus claim data retrieved from the
MMIS may be caused by claim adjustments performed after the end of the fiscal year. Claim
adjustments are recorded in CMS-64 reports as “prior period adjustments” and are reported in
the report applying to the time frame in which the adjustment was performed. In our analysis,
if the adjustment occurred outside of SFY 2012/13, it would be included in a future CMS-64
report, not in any of the four reports used in this analysis. However, the claim extract retrieved
for this analysis was generated well after the end of SFY 2012/13 and does reflect any claim
adjustments performed up through the data extract date for claims with date of service in SFY
2012/13.
When considering supplemental payments, data included in the Revenue Maximization report
documents payments applicable to a state fiscal year. This is true because the report is intended
to demonstrate that AHCA’s payments utilizing IGT funds stay within the limits defined within
the Legislature’s annual General Appropriations Act. However, operationally, payments
Navigant Page 89 of 246
applicable to a state fiscal year may not always occur within that fiscal year. This will generate
differences between numbers included in the Revenue Maximization report versus numbers in
the CMS-64 reports. For example, payments made just after the end of the state fiscal year and
applicable to the appropriation for that fiscal year would not be included in the CMS-64 reports,
but would be included in the Revenue Maximization report. The Revenue Maximization
reports are completed six months after the end of a state fiscal year, in contrast to CMS-64
reports, which are generated immediately after the end of each quarter. These differences in
payment reporting criteria could explain two or three percent difference in amounts reported.
The DSH payments to Mental Health Facilities differed by more than three percent. We believe
this larger difference is due to the fact that expenditures certified by non-Medicaid
governmental agencies (CPEs) are included in the CMS-64 reports, but are not included in the
Revenue Maximization report. CPEs are included in CMS-64 reports because they affect the
determination of federal matching funds due to the state. CPEs are not included in the Revenue
Maximization report because they are not expenditures incurred by AHCA.
A more detailed review of payments in the CMS-64 reports could be performed to align timing
of data selection more thoroughly within all data sources. This should allow for the payment
reconciliations to tie within a much tighter tolerance. However, such an effort would be very
time consuming and is outside the scope of this study.

Navigant Page 90 of 246
5 Analysis of Hospital Funding and Payment Methods
5.1 Introduction
The previous chapter of this report described current policies and processes related to funding
and payment of hospital services by Florida Medicaid. This chapter of the report analyzes and
evaluates current funding and payment based on four fundamental criteria – adequacy,
sustainability, accountability, and equity. Payment adequacy is measured primarily in
comparison to hospital cost. Program-wide pay-to-cost ratios are the focus of this section. The
sustainability section considers the likelihood that funding will continue at current levels and
that payment will be sufficient to incent hospitals to accept Medicaid and uninsured patients.
The section on accountability discusses the level of transparency and simplicity within current
funding and payment mechanisms. Finally, the equity section concentrates on funding and
payment levels across providers in the state of Florida and across Medicaid programs in the
United States.
5.2 Methodology
In Section 5.3, regarding Adequacy, and Section 5.6, regarding Equity, we present a variety of
numbers and figures, many related to pay-to-cost ratios. This section describes the general
methodology used to calculate these numbers.
Unless otherwise noted, all payment and cost values are derived from SFY 2012/13 data,
which spans the period from July 1, 2012 through June 30, 2013, and represents the most
recent complete state fiscal year of data available at the time of this study. In addition,
unless otherwise noted, claim payment and cost include those for services provided through
both the fee-for-service and managed care programs, and include hospital inpatient and
outpatient services.
We calculated the cost of hospital services provided to Medicaid recipients by determining
two cost-to-charge ratios (CCRs) for each hospital, one for inpatient services and one for
outpatient services. We then multiplied the applicable cost-to-charge ratio times the charges
on each claim. We determined the cost-to-charge ratios using information provided by
AHCA which they extracted from hospital Medicare cost reports for the purpose of
determining inpatient cost per diems (no longer used)75 and outpatient cost per-service
average payment rates. Separately for inpatient and outpatient services for each hospital,
CCRs were calculated by dividing Medicaid costs by Medicaid charges. The only exception
to this calculation is for hospitals with less than 200 Medicaid days included on their cost
reports. For these hospitals, we calculated the inpatient CCR by dividing total hospital
inpatient cost by total hospital inpatient charges. For the outpatient CCR, no such minimum
75 AHCA converted its inpatient payment methodology from cost-based per diems reimbursement to APR-DRG
reimbursement effective July 1, 2013.

Navigant Page 91 of 246
volume rule was applied. This logic is consistent with the way AHCA has historically
calculated cost-based per diems.
For all hospitals reimbursed by Medicare through the Inpatient Prospective Payment
System (IPPS), we extracted hospital cost for uncompensated care from Schedule S-10 of the
Medicare cost report. For each hospital, we selected the most recent cost report available
with hospital fiscal year end less than or equal to 2013. The time periods represented in
these cost reports do not perfectly overlap with state fiscal year 2012/13 in all cases, but will
overlap with at least some portion of the state fiscal year. For hospitals that are not
reimbursed through the Medicare IPPS, and thus, do not submit a Schedule S-10, but do
receive funds through the LIP program, we retrieved uncompensated care costs from SFY
2011/12 LIP Cost Limit reports provided by AHCA and which we inflated to SFY 2012/13.
Uncompensated care costs were not available for hospitals that are not reimbursed by the
Medicare IPPS and do not receive supplemental payments through LIP funds. The
hospitals in this category tended to be low-volume Medicaid hospitals, mostly private, and
mostly free-standing rehabilitation and free-standing long term acute care facilities.
When comparing Medicaid payments to cost, we included LIP payments only when
comparing to costs that also include the costs associated with uncompensated care. LIP is
defined as a program to help ensure access to care for the uninsured as well as cover or
partially cover shortfalls between Medicaid payments and hospital cost for providing health
care to Medicaid enrollees. In the disbursement of LIP funds, there are no distinctions made
between reimbursements for uncompensated care versus reimbursements for Medicaid
recipients. Thus, there is no way to identify the proportion of LIP payments between
uncompensated care and Medicaid shortfalls. As a result, we do not compare payments to
costs using all or part of the LIP payments unless we also included each hospital’s
uncompensated care costs.
In the section 5.6.3.3.3, in which provider assessment fees and IGT contributions are
subtracted from hospital payments to determine net hospital revenue, only inpatient IGT
contributions are included. This is because only inpatient IGTs are contributed in the name
of specific hospitals. IGTs contributed to outpatient rate enhancements, referred to by
AHCA as “statewide issues” and IGTs contributed to fund the DSH program are not
submitted in the name of individual hospitals. As a result, they could not be divided into
the provider categories defined in this report.
In the figures showing the percentage of Medicaid business for each IGT category, the
percentage is calculated based on hospital costs instead of days or admissions because it
includes inpatient and outpatient claim data, for which admissions and days are not
necessarily comparable. In addition, some charts presented in this document include
uncompensated care, for which counts of admissions and days are not available. Using cost
as the unit of measure here allows all similar charts to use the same unit of measure.
Navigant Page 92 of 246
5.3 Adequacy
In this report, we express the relationship between payment and cost in the form of a calculated
pay-to-cost ratio which is one of the metrics that can be used to understand the adequacy of
hospital payments. In order to remain in operation, hospitals, like any other businesses, must
receive enough income to cover all expenses including items such as labor, facilities, and
equipment. In addition, it is critical for all hospitals to be able to generate some margin over the
cost of operations – for-profit hospitals need to satisfy investors and stock holders, and not-for-
profits need to fund the replenishment of operating infrastructure and capital. Thus, paying
hospitals an amount equal to their costs or at least equal to reasonable market value for services
provided, if such a number can be defined, would seem to be a reasonable definition of
adequate reimbursement. In fact, in Medicaid Upper Payment Limit analyses, for example,
hospital cost is accepted as a proxy for Medicare payment and can be used as the Upper
Payment Limit or maximum allowable reimbursement amount. Note however, that CMS does
not consider operating margin to be a reasonable and necessary cost of providing services.
It is important to note, however, that defining adequate payment levels is not a precise science
as Medicaid agencies commonly pay less than full hospital cost and, yet, hospitals remain open
and continue to accept Medicaid patients. Traditionally, the assumption has been that hospitals
are able to achieve or maintain sufficient operating margin by balancing relatively low revenues
received from Medicaid with higher revenues received from commercial insurance companies.
This phenomenon is referred to as “cost-shifting,” and is more of a theoretical exercise than an
actual function performed by hospital accountants. Cost shifting is relatively easy to do for
hospitals with a small amount of their business coming from Medicaid and uninsured patients.
On the opposite side, cost shifting is more difficult for hospitals with a relatively high
percentage of their business coming from Medicaid and uninsured patients. Note also that
while it is CMS’ intent that the Medicare program pay for the reasonable and necessary costs of
providing services to the Medicare population, critics of the Medicare program argue that such
is not the case. As such, the Medicare program also contributes to the need for hospitals to
“cost-shift.”
Overall pay-to-cost ratios for hospital services provided to Medicaid and uninsured recipients
in Florida in SFY 2012/13 are shown in Table 6 below. As shown in this table, we calculated
payment versus cost for the Medicaid program by itself, and then display the ratios for a
combination of the Medicaid program combined with payments and costs associated with
uninsured and underinsured patients (referred to in the table as “uncompensated care”). We
also display the combined Medicaid and uncompensated care results two ways – one in which
hospital provider assessment fees and contributions to IGTs used to fund the Medicaid program
are not considered, and the other with assessment fees and IGTs subtracted from hospital
payments to estimate net hospital revenue. Under guidelines defining upper payment limit and
DSH limit calculations, provider assessment fees and IGT contributions are not considered to be
valid hospital costs. At the same time, provider assessment fees and IGTs coming from
hospitals are included in Medicaid payments back to hospitals. Thus, true net revenue to
hospitals should take these hospital outlays into consideration.
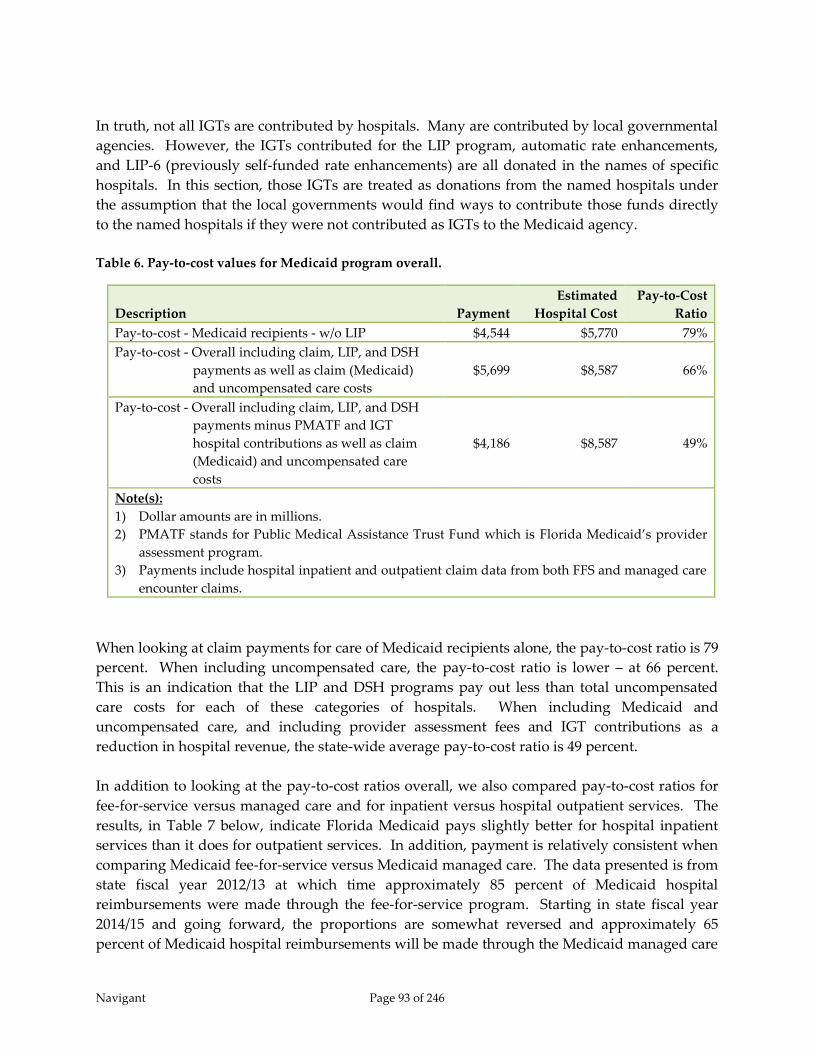
Navigant Page 93 of 246
In truth, not all IGTs are contributed by hospitals. Many are contributed by local governmental
agencies. However, the IGTs contributed for the LIP program, automatic rate enhancements,
and LIP-6 (previously self-funded rate enhancements) are all donated in the names of specific
hospitals. In this section, those IGTs are treated as donations from the named hospitals under
the assumption that the local governments would find ways to contribute those funds directly
to the named hospitals if they were not contributed as IGTs to the Medicaid agency.
Table 6. Pay-to-cost values for Medicaid program overall.
Description Payment
Estimated
Hospital Cost
Pay-to-Cost
Ratio
Pay-to-cost - Medicaid recipients - w/o LIP $4,544 $5,770 79%
Pay-to-cost - Overall including claim, LIP, and DSH
payments as well as claim (Medicaid)
and uncompensated care costs
$5,699 $8,587 66%
Pay-to-cost - Overall including claim, LIP, and DSH
payments minus PMATF and IGT
hospital contributions as well as claim
(Medicaid) and uncompensated care
costs
$4,186 $8,587 49%
Note(s):
1) Dollar amounts are in millions.
2) PMATF stands for Public Medical Assistance Trust Fund which is Florida Medicaid’s provider
assessment program.
3) Payments include hospital inpatient and outpatient claim data from both FFS and managed care
encounter claims.
When looking at claim payments for care of Medicaid recipients alone, the pay-to-cost ratio is 79
percent. When including uncompensated care, the pay-to-cost ratio is lower – at 66 percent.
This is an indication that the LIP and DSH programs pay out less than total uncompensated
care costs for each of these categories of hospitals. When including Medicaid and
uncompensated care, and including provider assessment fees and IGT contributions as a
reduction in hospital revenue, the state-wide average pay-to-cost ratio is 49 percent.
In addition to looking at the pay-to-cost ratios overall, we also compared pay-to-cost ratios for
fee-for-service versus managed care and for inpatient versus hospital outpatient services. The
results, in Table 7 below, indicate Florida Medicaid pays slightly better for hospital inpatient
services than it does for outpatient services. In addition, payment is relatively consistent when
comparing Medicaid fee-for-service versus Medicaid managed care. The data presented is from
state fiscal year 2012/13 at which time approximately 85 percent of Medicaid hospital
reimbursements were made through the fee-for-service program. Starting in state fiscal year
2014/15 and going forward, the proportions are somewhat reversed and approximately 65
percent of Medicaid hospital reimbursements will be made through the Medicaid managed care
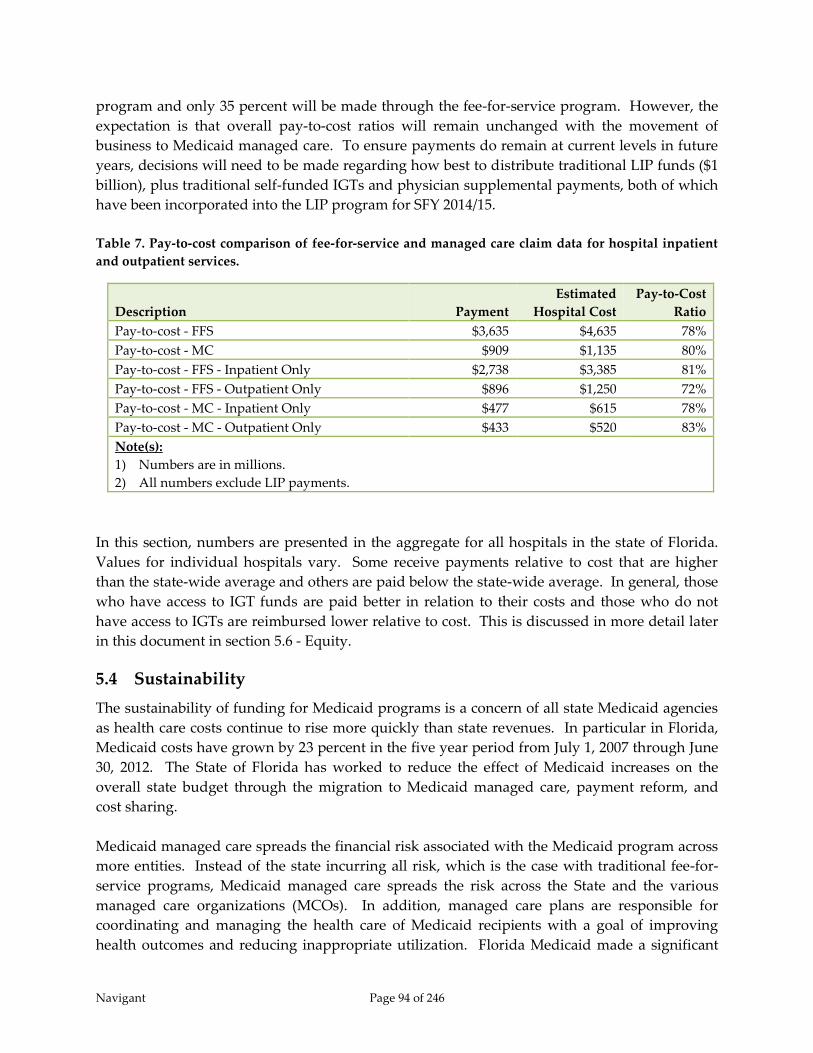
Navigant Page 94 of 246
program and only 35 percent will be made through the fee-for-service program. However, the
expectation is that overall pay-to-cost ratios will remain unchanged with the movement of
business to Medicaid managed care. To ensure payments do remain at current levels in future
years, decisions will need to be made regarding how best to distribute traditional LIP funds ($1
billion), plus traditional self-funded IGTs and physician supplemental payments, both of which
have been incorporated into the LIP program for SFY 2014/15.
Table 7. Pay-to-cost comparison of fee-for-service and managed care claim data for hospital inpatient
and outpatient services.
Description Payment
Estimated
Hospital Cost
Pay-to-Cost
Ratio
Pay-to-cost - FFS $3,635 $4,635 78%
Pay-to-cost - MC $909 $1,135 80%
Pay-to-cost - FFS - Inpatient Only $2,738 $3,385 81%
Pay-to-cost - FFS - Outpatient Only $896 $1,250 72%
Pay-to-cost - MC - Inpatient Only $477 $615 78%
Pay-to-cost - MC - Outpatient Only $433 $520 83%
Note(s):
1) Numbers are in millions.
2) All numbers exclude LIP payments.
In this section, numbers are presented in the aggregate for all hospitals in the state of Florida.
Values for individual hospitals vary. Some receive payments relative to cost that are higher
than the state-wide average and others are paid below the state-wide average. In general, those
who have access to IGT funds are paid better in relation to their costs and those who do not
have access to IGTs are reimbursed lower relative to cost. This is discussed in more detail later
in this document in section 5.6 - Equity.
5.4 Sustainability
The sustainability of funding for Medicaid programs is a concern of all state Medicaid agencies
as health care costs continue to rise more quickly than state revenues. In particular in Florida,
Medicaid costs have grown by 23 percent in the five year period from July 1, 2007 through June
30, 2012. The State of Florida has worked to reduce the effect of Medicaid increases on the
overall state budget through the migration to Medicaid managed care, payment reform, and
cost sharing.
Medicaid managed care spreads the financial risk associated with the Medicaid program across
more entities. Instead of the state incurring all risk, which is the case with traditional fee-for-
service programs, Medicaid managed care spreads the risk across the State and the various
managed care organizations (MCOs). In addition, managed care plans are responsible for
coordinating and managing the health care of Medicaid recipients with a goal of improving
health outcomes and reducing inappropriate utilization. Florida Medicaid made a significant

Navigant Page 95 of 246
move to Medicaid managed care in SFY 2006/07. At that time, a pilot program began in which
most recipients in two counties, Broward and Duval, were transitioned to managed care. A
year later, three smaller counties, Baker, Clay, and Nassau, were also transitioned to managed
care. Then in the summer of 2014, the rest of the state was transitioned to managed care as part
of a program AHCA refers to as Managed Medical Assistance (MMA). Currently, AHCA has
moved just under three million Medicaid beneficiaries from fee-for-service to capitated or
premium-based managed care programs, thus adding another level of stability in service
delivery, which should contribute to increases in the overall cost effectiveness of the program.
Provider payment reform is one method used by state Medicaid agencies to enhance cost
effectiveness and program fiscal stability. States have moved providers from cost-based
reimbursement systems, where providers are incented to increase utilization, to acuity-based
and quality of care systems of reimbursement. Florida’s implementation in July 2013 of a
Diagnosis Related Group (DRG) payment methodology, which replaced a cost-based per diem
methodology for inpatient hospital payments, generated greater incentives for hospitals to
control costs. In addition, it is good first step towards future value-based strategies that pay
incentives for improved processes and outcomes.
The bulk of the cost sharing implemented by the state has been in the form of county billing, a
provider assessment, and collection of inter-governmental transfers. These cost sharing
measures have been concentrated on expenditures to hospital and nursing home providers
which combine for approximately 45 percent of the total state share of Medicaid funding in SFY
2012/13. County billing and the provider assessment are mandatory programs and are
relatively reliable. IGTs are optional and as such are a less dependable funding source.
Medicaid IGTs in Florida are voluntary, yet comprise a significant portion of overall funding.
Specifically in the area of hospital funding, IGTs comprised 44 percent of the state share in SFY
2012/13. The IGTs help fund inpatient and outpatient rates, the LIP program, and the DSH
program. In total for hospital reimbursements, there were 55 contributors in SFY 2012/13
including 54 local governmental agencies and the Florida State Department of Health. Of these,
a small number contribute a vast majority of the funds. The top three contributors donate 66
percent of the funds; the top five donate 75 percent of the funds and the top ten donate 86
percent of the funds. These funds are substantial, totaling over $1.1 billion dollars in SFY
2012/13. The unevenness of the IGT contributions is depicted in Figure 15.

Navigant Page 96 of 246
Figure 15. Distribution of IGT contributions across donors.
To date, reimbursement methodologies have been defined to ensure contributors of IGTs
receive back at least as much as they donate. In practice, thanks to the addition of federal
matching funds, the contributors ultimately receive significantly more than they donate.
However, any change in reimbursement methodology that offers a more broad-based
distribution of funds will offer less benefit to those contributing IGTs. This will decrease the
incentive for local governments to provide IGTs and risks lowering overall funding of the
Medicaid program. Certainly, if the reimbursement methodology reached a point in which
local governments felt they could obtain greater benefit from keeping their funds internal to
their geographic area versus donating them to AHCA for federal matching, IGT contributions to
the state Medicaid program would suffer significantly.
5.5 Accountability
Accountability consists of equal measures of compliance and transparency. Compliance means
the establishment of state programs meeting the full requirements of the federal regulations.
Transparency means thorough documentation that is both accessible to the general public and
capable of withstanding scrutiny.
Accountability is the joint responsibility of state and federal governments for the Medicaid
program. They share the mutual obligations for operating the Medicaid program in each
respective state consistent with the Title XIX of the Social Security Act and various regulations.
CMS provides the regulations, financing, technical assistance, and other tools while states fund
their share of financing, operate the program within areas of enrolling beneficiaries, registering
providers, paying for medical services rendered to Medicaid recipients, and reporting. The
partnership is central to the success of the Medicaid program.
An area in which CMS provides regulations and technical assistance is funding sources and
payment methods. A specific area of regulations and guidance is supplemental payment
Top 3 Contributors Top 5
Contributors
Top 10
Contributors
All 55
Contributors
66%
75%
86%
100%
Navigant Page 97 of 246
programs, i.e. UPL payments, DSH payments, and specialized programs, such as the LIP
program. The Florida LIP program is funded primarily through IGTs matched with federal
funds and payments to hospitals.
The state operates the Medicaid program with all of the complexities of federal and state
regulations. Operationally, states are required to report funding sources and payments.
Quarterly and annual reports to state leaders and CMS are one method the partnership is held
accountable. Various reports required by either the Florida Legislature and/or CMS contain
detailed information, particularly related to inter-governmental transfers used to help fund the
program. In particular, the Local Funding Revenue Maximization and Local Funding for Hospital
Inpatient Reimbursement document generated annually by AHCA contains very detailed
information on the collection and distribution of IGT funds. In addition, the Reimbursement and
Funding Methodology - Florida Medicaid Reform Section 1115 Waiver - Low Income Pool document,
also generated annually, provides detailed descriptions of allowable costs under the LIP
program. Associated with this document are spreadsheets hospitals submit annually to
communicate their total costs of care to Medicaid, uninsured, and underinsured recipients.
These spreadsheets are used to confirm that total reimbursement paid by the Medicaid agency
does not exceed total hospital cost.
During interviews with various stakeholders while researching this report, we learned there is a
concern about lack of transparency available within the current Florida Medicaid hospital
funding and payment mechanisms. Our conclusion, in contrast, is that documentation on the
program is readily available and plentiful. However, the program is complicated and this
complexity likely contributes to stakeholder impression that it is not transparent. Any
modifications to the program that provide simplification will likely increase stakeholder
comfort level. In addition, modifications could be made to AHCA’s end of year financial
reporting to help improve transparency of funding and payment. For example, the documents
mentioned above give excellent detail of funding and payment of inter-governmental transfers.
But little or no documentation exists that combines that information with claim payments or
hospital cost in order to show a full picture of reimbursement for the program.
5.6 Equity
5.6.1 Introduction
Equity within a Medicaid program can be defined in a variety of ways. One measure is the
consistency of payment for services independent of where the services are performed. A
second measure is the level of payment relative to cost across hospitals. Equity across Medicaid
programs may also be reviewed in terms of the level of federal funding provided relative to the
size of Medicaid programs. Each of these measures of equity is discussed in further detail in the
sections that follow.

Navigant Page 98 of 246
5.6.2 Equity in Payments by Service
One definition of equity in Medicaid hospital reimbursements can be considered in the context
of whether or not there is consistency of payment for the same service independent of where the
service is performed. However, there are some scenarios in which payment rates may be varied
while still maintaining a sense of equity. Medicaid agencies may vary from identical pay across
hospitals to account for legitimately varying costs structures within categories of hospitals. For
example, payments to teaching hospitals may be set higher to help cover the costs of graduate
medical education programs. Or, a Medicaid agency may keep payments for medical services
the same and offer supplemental payments to teaching hospitals as a way to maintain equity of
utilization-based payments. Medicaid agencies may also choose to set higher payment rates for
specific services for which Medicaid is a major player in the market. For example, some
Medicaid agencies choose to set a higher pay-to-cost ratio for obstetrical services and newborn
care, because Medicaid generally pays for about half of the births in each state. With that kind
of volume, Medicaid rates have a significant impact on financial viability of those services
within hospitals, thus higher rates can increase or maintain the likelihood that sufficient
capacity exists to care for Medicaid recipients.
Specifically within Florida Medicaid hospital reimbursement, outpatient services are
reimbursed through a cost-based methodology that pays an average rate per revenue code
based on each hospital’s individual cost structure and anticipated volume of outpatient services
provided to Medicaid recipients. This method clearly does not pay the same amount for the
same service independent of where the service is provided. In addition, the variation in rates is
not based on category of provider or otherwise related to the impact the Medicaid rate may
have on access to these services across the state. Instead, a unique rate is assigned to each
hospital based on the individual hospital’s costs of care. Critics of this type of payment model
believe that it can provide inappropriate incentives for hospitals in managing their costs.
However, these potential incentives are somewhat mitigated by a relatively small proportion of
Medicaid outpatient services when compared to all other services provided in a hospital setting.
AHCA, the Florida Governor’s Office, and the Florida Legislature have considered making a
change to the outpatient payment methodology to get away from connection with individual
hospital costs. The Florida Governor’s original proposed budget for state fiscal year 2014/15
included a proposal to move away from cost-based reimbursement of hospital outpatient
services. However, with conversion to Medicaid managed care ongoing and conversion to DRG
reimbursement for hospital inpatient services still in its infancy, this change was not approved
for SFY 2014/15. It may be considered in future years.
Inpatient services, in contrast, were recently converted from an individual hospital cost based
per-diem payment methodology to a Diagnosis Related Grouping (DRG) payment
methodology. This payment model generally pays a fixed amount for each discharge based on
the assigned DRG (which is determined using a preset algorithm that considers primarily the
patient’s diagnoses, surgical procedures performed, gender, age, and for newborn cases,
birthweight). In the Florida Medicaid DRG payment methodology, AHCA and the Florida

Navigant Page 99 of 246
Legislature chose to increase payments for specific services for which Medicaid is a significant
payer. Payment increases are made to services provided to sick newborns and to children with
complex medical conditions. This is done by applying a payment multiplier, referred to as a
“policy adjustor” to claims for applicable recipients in which the severity of illness of the DRG
is high.
In addition to service adjustors, AHCA and the Florida Legislature chose to adjust payment for
specific categories of providers. Five different provider categories have been defined within the
DRG payment method and are listed below:
a) Rural hospitals
b) Hospitals with a very high percentage of Medicaid utilization and a very high
percentage of claims reaching outlier payment status
c) Free-standing long-term acute care hospitals
d) Free-standing rehabilitation hospitals
e) All other hospitals.
The first four categories of hospitals listed above receive a policy adjustor which increases their
payment on each admission. The fifth category, all other hospitals, is not given a payment
multiplier. Rural hospitals and hospitals with significant Medicaid business and numerous
claims reaching outlier status were separated out to help ensure continued viability of these
hospitals and thus access to care for Medicaid recipients. Rural hospitals have lower patient
volume across which to spread their fixed costs. High Medicaid utilization and high outlier
hospitals have less commercial business available for cost shifting and are seeing Medicaid
recipients with very significant medical needs (which is indicated by the number of admissions
reaching outlier payment status). Free-standing rehabilitation and long term acute care (LTAC)
hospitals were separated out because of the existing discrepancy between hospitals with access
to IGTs and those without access. Nearly all rehabilitation and LTAC hospitals are without
access to IGTs and were paid considerably lower rates under the per diem payment method
used through the end of SFY 2012/13. With the conversion to DRG reimbursement, AHCA and
the Florida Legislature decided to offer assistance to these hospitals to compensate for the lack
of IGT revenue. Free-standing rehabilitation and LTAC hospitals have relatively low volume in
the Florida Medicaid program, so this was done without shifting significant amounts of money
away from other hospitals.
As mentioned above, within each provider category in the inpatient DRG payment
methodology, payment is the same for the same service, independent of the hospital in which
the service is performed. The elements which determine payment for a particular service,
hospital base rate, hospital policy adjustor, and DRG relative weight are the same for each
hospital within a provider category. Thus, all hospitals within a provider category receive the
same DRG payment for admissions assigned the same DRG code – that is, admissions for the
same type of patient, requiring the same types of health care services.
Navigant Page 100 of 246
However, “pure” DRG payment, which is the sum of DRG base payment and outlier payment,
only constituted about 55 percent of total inpatient reimbursements for Florida Medicaid
recipients in SFY 2013/1476. The other 45 percent comes from supplemental payments made
using funds received through IGTs. And these funds are distributed primarily to hospitals that
have access to contribute IGTs. As a result, full inpatient payment for specific services is not
consistent across different providers even within the same provider category. In general,
hospitals with access to IGTs are paid more per admission because of the supplemental
payments they receive. This is discussed in more detail in section 5.6.3 – Equity in Payments
Across Hospitals.
5.6.3 Equity in Payments Across Hospitals
5.6.3.1 Introduction
In addition to measuring equity within a Medicaid program by comparing payments for similar
services across hospitals, equity can also be measured by comparing overall payment levels
across hospitals. A variety of definitions exist as to what is defined as a payment and what is
defined as an allowable cost. Because of this, we chose to compare hospital Medicaid pay-to-
cost ratios in a variety of ways, including:
a) Services rendered to Medicaid recipients as identified through paid claims – payment
and cost include fee-for-service and managed care claims (both inpatient and outpatient)
and exclude the provider assessment and IGTs contributed to fund the Medicaid
program as a reduction in hospital net revenue.
b) Services rendered to Medicaid, uninsured, and underinsured recipients – payments
include claim payments for both fee-for-service and managed care claims (both inpatient
and outpatient) as well as LIP and DSH supplemental payments. Costs include claim
costs for both fee-for-service and managed care claims (both inpatient and outpatient),
and cost of uncompensated care. Hospital contributions to the provider assessment and
IGTs contributed to fund the Medicaid program are not considered.
c) Services rendered to Medicaid, uninsured, and underinsured recipients with PMATF
and IGTs subtracted from hospital payments – payments include claim payments for
both fee-for-service and managed care claims (both inpatient and outpatient) as well as
LIP and DSH supplemental payments. Costs include claim costs for both fee-for-service
and managed care claims (both inpatient and outpatient), and cost of uncompensated
care. Hospital contributions to the provider assessment and IGTs contributed to fund
the Medicaid program are subtracted from hospital payments to determine net hospital
revenue.
76 SFY 2013/14 is the first year of DRG payment, and includes both automatic and self-funded IGTs in inpatient rate
enhancements distributed with claim payments. In SFY 2014/15, only automatic IGTs are used as a rate
enhancement. Self-funded IGTs are included in the LIP program and distributed as quarterly supplemental
payments.

Navigant Page 101 of 246
Claim payments and costs referenced above may also be referred to as service payments or
utilization payments as they are specifically tied to services provided to Medicaid, uninsured
and underinsured recipients. We did not include a fourth option of calculating pay-to-cost
ratios for claim payments when the provider assessment and IGT contributions are subtracted
from payment. This is because there is no clear way to determine how much of a hospital’s
IGTs contributed to automatic IGT rate enhancements, which are included in claim payments,
versus LIP payments, which are supplemental to claim payments.
Because IGTs play a significant role in funding and payment, we decided to compare pay-to-
cost ratios across three categories of hospitals, 1) hospitals that contribute and receive IGTs; 2)
hospitals that do not contribute IGTs, but do receive payments from IGT funds; and 3) hospitals
that neither contribute nor receive IGT funds. In truth, not all IGTs are contributed by hospitals;
many are contributed by local governmental agencies. However, the IGTs contributed for the
LIP program, automatic rate enhancements, and self-funded rate enhancements (which were
moved into the LIP program in SFY 2014/15) are all donated in the names of specific hospitals.
In this section, those IGTs are treated as donated by the named hospitals under the assumption
that the local governments would find ways to contribute those funds directly to the named
hospitals if they were not contributed as IGTs to the Medicaid agency.
In addition to the three hospital categories mentioned above, pay-to-cost ratios are also
compared for public versus private hospitals. This is done because public hospitals generally
have access to IGTs while private hospitals generally do not. We wanted to identify any
inequities in reimbursement for public versus private hospitals.
In fact, the pay-to-cost ratios we calculated do indicate that hospitals with access to IGTs receive
significantly higher levels of reimbursement than hospitals without access to IGTs. This is
because individual hospital overall reimbursement in the Florida Medicaid program is heavily
tied to the hospital’s access to contribute inter-governmental transfer funds into the Medicaid
program.
5.6.3.2 Equitable Pay-to-cost Ratios
Medicaid does not necessarily need a goal of making the pay-to-cost ratios for each hospital
equal. Ideally, the reimbursement methodology contains incentives for hospitals to control
costs and provide high quality care. In terms of hospital cost, this is often done by basing
payments on the average costs for a category of hospitals so that the hospitals are incented to
control costs. Those most successful in controlling costs will receive better margins from
Medicaid reimbursements, and, thus, will have higher pay-to-cost ratios.
As described in the previous section, Medicaid agencies may choose to define certain categories
of hospitals and review payment levels within these categories. This is because certain
hospitals are determined to have unique cost structures or because certain hospitals are
determined to be critical to the Medicaid program. Critical access hospitals and rural hospitals
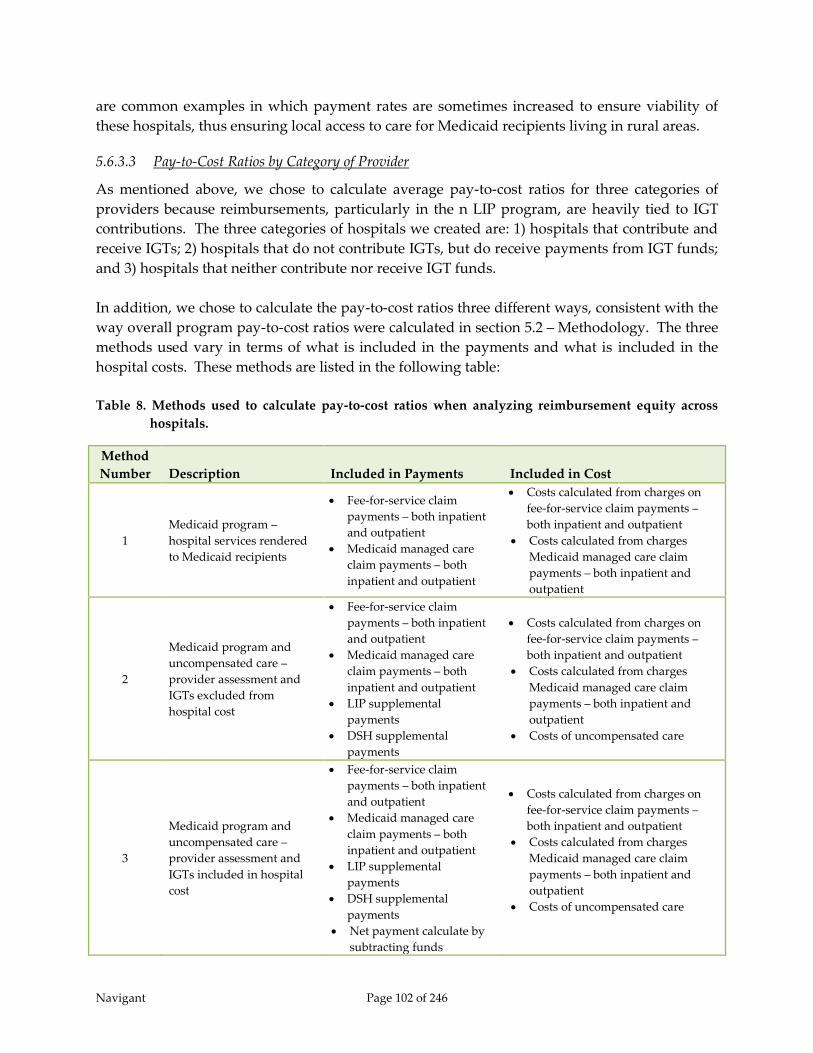
Navigant Page 102 of 246
are common examples in which payment rates are sometimes increased to ensure viability of
these hospitals, thus ensuring local access to care for Medicaid recipients living in rural areas.
5.6.3.3 Pay-to-Cost Ratios by Category of Provider
As mentioned above, we chose to calculate average pay-to-cost ratios for three categories of
providers because reimbursements, particularly in the n LIP program, are heavily tied to IGT
contributions. The three categories of hospitals we created are: 1) hospitals that contribute and
receive IGTs; 2) hospitals that do not contribute IGTs, but do receive payments from IGT funds;
and 3) hospitals that neither contribute nor receive IGT funds.
In addition, we chose to calculate the pay-to-cost ratios three different ways, consistent with the
way overall program pay-to-cost ratios were calculated in section 5.2 – Methodology. The three
methods used vary in terms of what is included in the payments and what is included in the
hospital costs. These methods are listed in the following table:
Table 8. Methods used to calculate pay-to-cost ratios when analyzing reimbursement equity across
hospitals.
Method
Number Description Included in Payments Included in Cost
1
Medicaid program –
hospital services rendered
to Medicaid recipients
Fee-for-service claim
payments – both inpatient
and outpatient
Medicaid managed care
claim payments – both
inpatient and outpatient
Costs calculated from charges on
fee-for-service claim payments –
both inpatient and outpatient
Costs calculated from charges
Medicaid managed care claim
payments – both inpatient and
outpatient
2
Medicaid program and
uncompensated care –
provider assessment and
IGTs excluded from
hospital cost
Fee-for-service claim
payments – both inpatient
and outpatient
Medicaid managed care
claim payments – both
inpatient and outpatient
LIP supplemental
payments
DSH supplemental
payments
Costs calculated from charges on
fee-for-service claim payments –
both inpatient and outpatient
Costs calculated from charges
Medicaid managed care claim
payments – both inpatient and
outpatient
Costs of uncompensated care
3
Medicaid program and
uncompensated care –
provider assessment and
IGTs included in hospital
cost
Fee-for-service claim
payments – both inpatient
and outpatient
Medicaid managed care
claim payments – both
inpatient and outpatient
LIP supplemental
payments
DSH supplemental
payments
Net payment calculate by
subtracting funds
Costs calculated from charges on
fee-for-service claim payments –
both inpatient and outpatient
Costs calculated from charges
Medicaid managed care claim
payments – both inpatient and
outpatient
Costs of uncompensated care
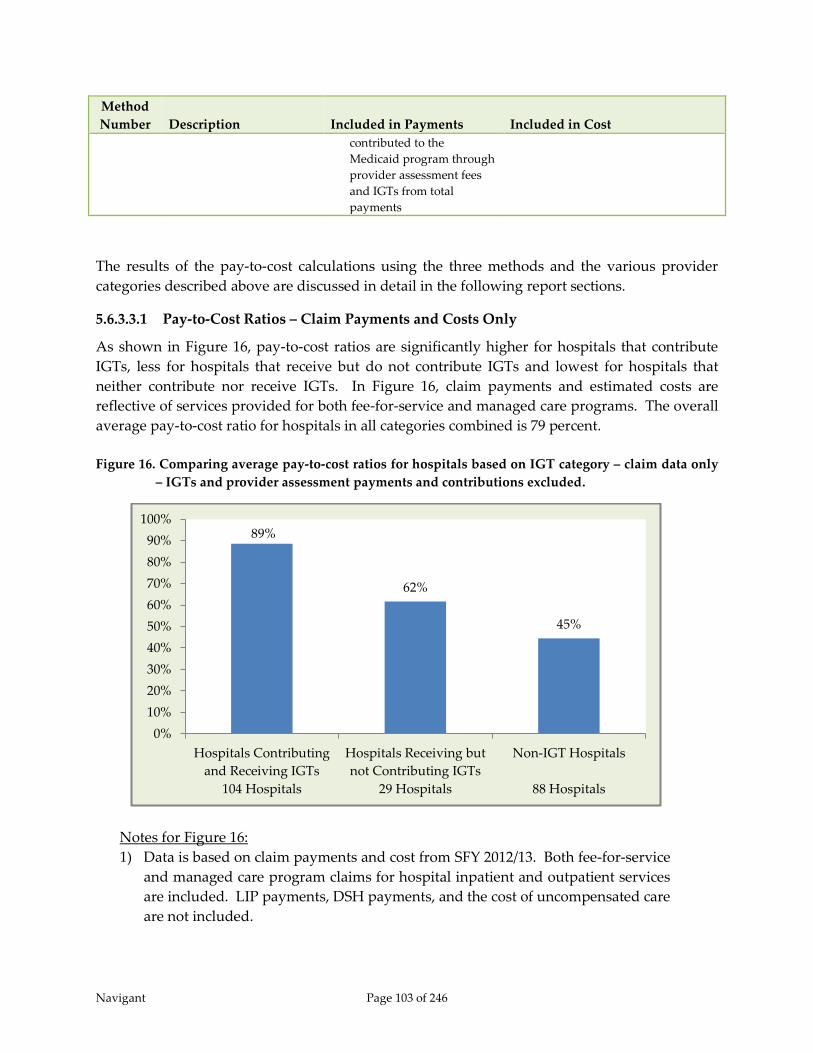
Navigant Page 103 of 246
Method
Number Description Included in Payments Included in Cost
contributed to the
Medicaid program through
provider assessment fees
and IGTs from total
payments
The results of the pay-to-cost calculations using the three methods and the various provider
categories described above are discussed in detail in the following report sections.
5.6.3.3.1 Pay-to-Cost Ratios – Claim Payments and Costs Only
As shown in Figure 16, pay-to-cost ratios are significantly higher for hospitals that contribute
IGTs, less for hospitals that receive but do not contribute IGTs and lowest for hospitals that
neither contribute nor receive IGTs. In Figure 16, claim payments and estimated costs are
reflective of services provided for both fee-for-service and managed care programs. The overall
average pay-to-cost ratio for hospitals in all categories combined is 79 percent.
Figure 16. Comparing average pay-to-cost ratios for hospitals based on IGT category – claim data only
– IGTs and provider assessment payments and contributions excluded.
Notes for Figure 16:
1) Data is based on claim payments and cost from SFY 2012/13. Both fee-for-service
and managed care program claims for hospital inpatient and outpatient services
are included. LIP payments, DSH payments, and the cost of uncompensated care
are not included.
89%
62%
45%
0%
10%
20%
30%
40%
50%
60%
70%
80%
90%
100%
Hospitals Contributing
and Receiving IGTs
104 Hospitals
Hospitals Receiving but
not Contributing IGTs
29 Hospitals
Non-IGT Hospitals
88 Hospitals

Navigant Page 104 of 246
2) Data is limited to in-state hospitals with at least one submitted claim in SFY
2012/13.
Although the 104 hospitals that contributed IGTs and received IGT payments in SFY 2012/13
comprise only 47 percent of the in-state hospitals, they account for 77 percent of the Medicaid
business77 in SFY 2012/13. Thus, payments are better for providers who do a significant amount
of Medicaid business. This is consistent with the state’s goal stated in the SFY 2005 1115
demonstration waiver, “The state will continue to foster and protect its safety net providers.”78
The percentage of total Medicaid business by these three hospital categories is shown in Figure
17.
Figure 17. Percentage of Medicaid business based on IGT category – claim data only – IGT and
provider assessment payments and contributions excluded.
Notes for Figure 17:
1) Data is based on claim payments and cost from SFY 2012/13. Both fee-for-service
and managed care claims for both hospital inpatient and outpatient services are
included. LIP payments, DSH payments, and the cost of uncompensated care are
not included.
2) Data is limited to in-state hospitals with at least one submitted claim in SFY
2012/13.
77 Percentage of Medicaid business is determined using hospital cost.
78 Florida Agency for Health Care Administration, Application for 1115 Research and Demonstration Waiver. (August
2005)
77%
16%
7%
0%
10%
20%
30%
40%
50%
60%
70%
80%
90%
Hospitals Contributing
and Receiving IGTs
104 Hospitals
Hospitals Receiving but
not Contributing IGTs
29 Hospitals
Non-IGT Hospitals
88 Hospitals
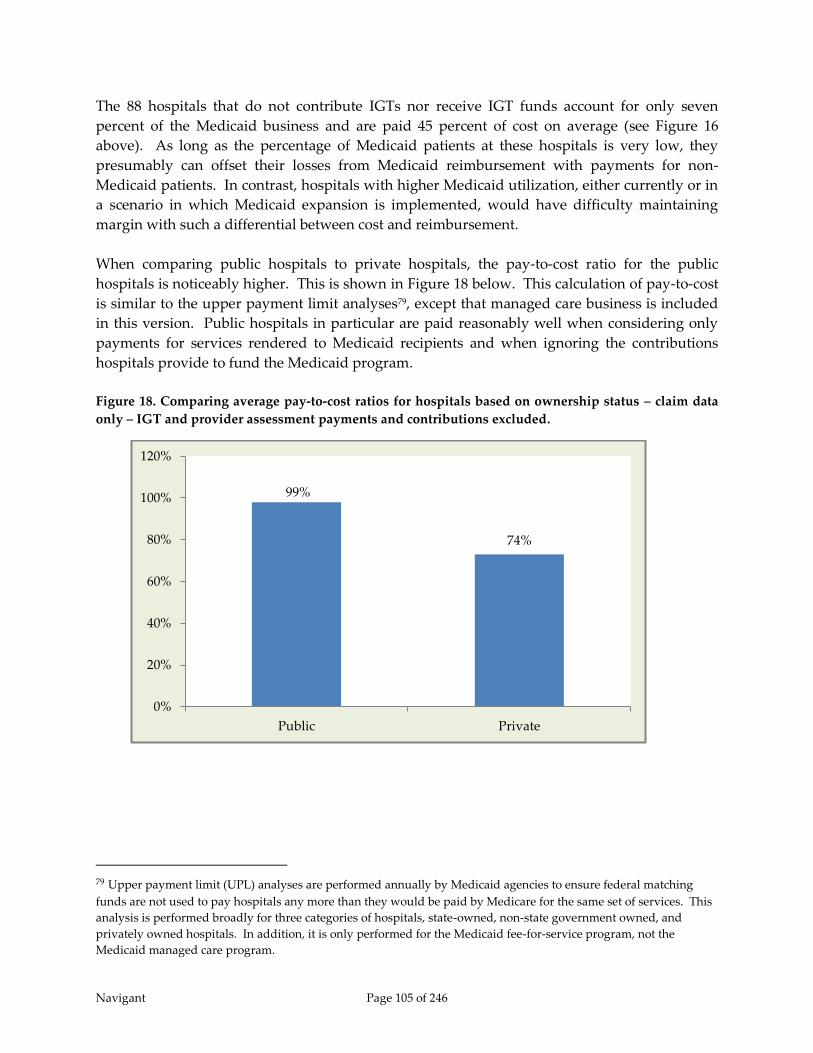
Navigant Page 105 of 246
The 88 hospitals that do not contribute IGTs nor receive IGT funds account for only seven
percent of the Medicaid business and are paid 45 percent of cost on average (see Figure 16
above). As long as the percentage of Medicaid patients at these hospitals is very low, they
presumably can offset their losses from Medicaid reimbursement with payments for non-
Medicaid patients. In contrast, hospitals with higher Medicaid utilization, either currently or in
a scenario in which Medicaid expansion is implemented, would have difficulty maintaining
margin with such a differential between cost and reimbursement.
When comparing public hospitals to private hospitals, the pay-to-cost ratio for the public
hospitals is noticeably higher. This is shown in Figure 18 below. This calculation of pay-to-cost
is similar to the upper payment limit analyses79, except that managed care business is included
in this version. Public hospitals in particular are paid reasonably well when considering only
payments for services rendered to Medicaid recipients and when ignoring the contributions
hospitals provide to fund the Medicaid program.
Figure 18. Comparing average pay-to-cost ratios for hospitals based on ownership status – claim data
only – IGT and provider assessment payments and contributions excluded.
79 Upper payment limit (UPL) analyses are performed annually by Medicaid agencies to ensure federal matching
funds are not used to pay hospitals any more than they would be paid by Medicare for the same set of services. This
analysis is performed broadly for three categories of hospitals, state-owned, non-state government owned, and
privately owned hospitals. In addition, it is only performed for the Medicaid fee-for-service program, not the
Medicaid managed care program.
99%
74%
0%
20%
40%
60%
80%
100%
120%
Public Private

Navigant Page 106 of 246
5.6.3.3.2 Pay-to-cost Ratios – All Payments – Assessment and IGTs Excluded from Net
Revenue
The next two figures include consideration of not only Medicaid recipients, but also
uncompensated care for the uninsured and underinsured. In these measurements of average
pay-to-cost ratios, claim payments and supplemental payments from the LIP program and the
DSH program are included. In addition, each hospital’s cost of uncompensated care is
included. This version is similar to the way DSH payment limit and Florida LIP payment limit
calculations are performed, and provides a picture that includes both the Medicaid program
and uncompensated care. However, hospitals would argue it is still not a complete picture as it
does not account for hospital funds contributing to the state share through the provider
assessment and through contribution of IGTs.
The resulting average pay-to-cost ratios are shown in Figure 19. For each category of hospitals,
the ratio has decreased from the values shown in Figure 16. This is an indication that the LIP
and DSH programs pay out less than total uncompensated care costs for each of these categories
of hospitals. This finding is expected, as the LIP and DSH programs were never intended to
cover all uncompensated care costs. In addition, DSH audits ensure federal Medicaid matching
funds are not used to pay any individual hospital more than the cost of care for its Medicaid
and uninsured patients.
Under this analysis, the overall average pay-to-cost for hospitals in all three categories
combined is 66 percent.
Figure 19. Comparing average pay-to-cost ratios for hospitals based on IGT category – all payments
and cost, including LIP, DSH and uncompensated care – IGT and provider assessment
contributions excluded.
77%
48%
31%
0%
10%
20%
30%
40%
50%
60%
70%
80%
90%
Hospitals Contributing
and Receiving IGTs
104 Hospitals
Hospitals Receiving but
not Contributing IGTs
29 Hospitals
Non-IGT Hospitals
88 Hospitals
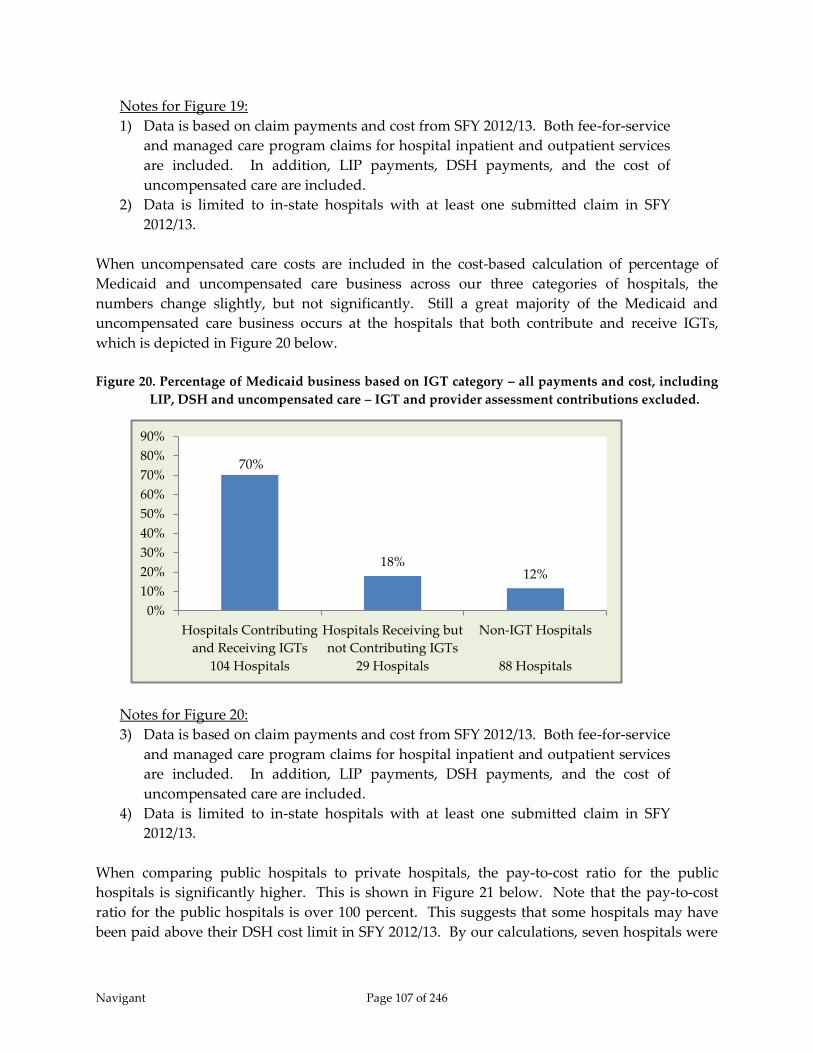
Navigant Page 107 of 246
Notes for Figure 19:
1) Data is based on claim payments and cost from SFY 2012/13. Both fee-for-service
and managed care program claims for hospital inpatient and outpatient services
are included. In addition, LIP payments, DSH payments, and the cost of
uncompensated care are included.
2) Data is limited to in-state hospitals with at least one submitted claim in SFY
2012/13.
When uncompensated care costs are included in the cost-based calculation of percentage of
Medicaid and uncompensated care business across our three categories of hospitals, the
numbers change slightly, but not significantly. Still a great majority of the Medicaid and
uncompensated care business occurs at the hospitals that both contribute and receive IGTs,
which is depicted in Figure 20 below.
Figure 20. Percentage of Medicaid business based on IGT category – all payments and cost, including
LIP, DSH and uncompensated care – IGT and provider assessment contributions excluded.
Notes for Figure 20:
3) Data is based on claim payments and cost from SFY 2012/13. Both fee-for-service
and managed care program claims for hospital inpatient and outpatient services
are included. In addition, LIP payments, DSH payments, and the cost of
uncompensated care are included.
4) Data is limited to in-state hospitals with at least one submitted claim in SFY
2012/13.
When comparing public hospitals to private hospitals, the pay-to-cost ratio for the public
hospitals is significantly higher. This is shown in Figure 21 below. Note that the pay-to-cost
ratio for the public hospitals is over 100 percent. This suggests that some hospitals may have
been paid above their DSH cost limit in SFY 2012/13. By our calculations, seven hospitals were
70%
18% 12%
0%
10%
20%
30%
40%
50%
60%
70%
80%
90%
Hospitals Contributing
and Receiving IGTs
104 Hospitals
Hospitals Receiving but
not Contributing IGTs
29 Hospitals
Non-IGT Hospitals
88 Hospitals
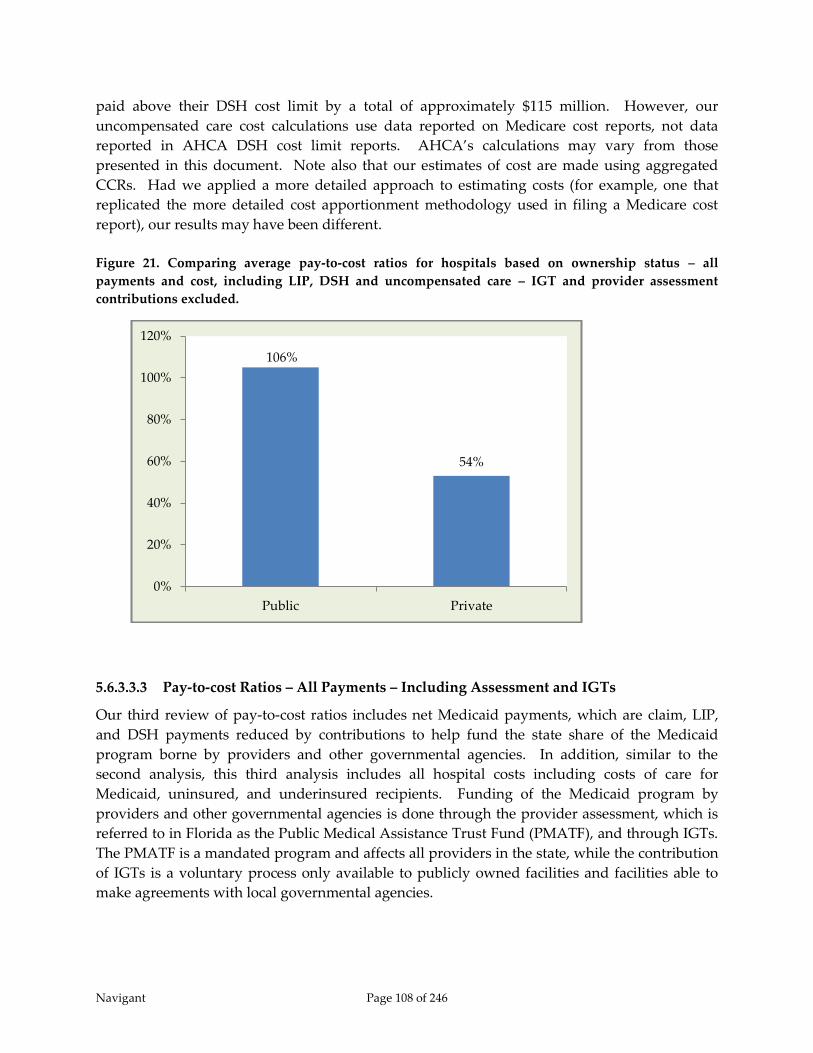
Navigant Page 108 of 246
paid above their DSH cost limit by a total of approximately $115 million. However, our
uncompensated care cost calculations use data reported on Medicare cost reports, not data
reported in AHCA DSH cost limit reports. AHCA’s calculations may vary from those
presented in this document. Note also that our estimates of cost are made using aggregated
CCRs. Had we applied a more detailed approach to estimating costs (for example, one that
replicated the more detailed cost apportionment methodology used in filing a Medicare cost
report), our results may have been different.
Figure 21. Comparing average pay-to-cost ratios for hospitals based on ownership status – all
payments and cost, including LIP, DSH and uncompensated care – IGT and provider assessment
contributions excluded.
5.6.3.3.3 Pay-to-cost Ratios – All Payments – Including Assessment and IGTs
Our third review of pay-to-cost ratios includes net Medicaid payments, which are claim, LIP,
and DSH payments reduced by contributions to help fund the state share of the Medicaid
program borne by providers and other governmental agencies. In addition, similar to the
second analysis, this third analysis includes all hospital costs including costs of care for
Medicaid, uninsured, and underinsured recipients. Funding of the Medicaid program by
providers and other governmental agencies is done through the provider assessment, which is
referred to in Florida as the Public Medical Assistance Trust Fund (PMATF), and through IGTs.
The PMATF is a mandated program and affects all providers in the state, while the contribution
of IGTs is a voluntary process only available to publicly owned facilities and facilities able to
make agreements with local governmental agencies.
106%
54%
0%
20%
40%
60%
80%
100%
120%
Public Private

Navigant Page 109 of 246
The pay-to-cost ratios in this section demonstrate a more complete look at hospital payment and
cost for Medicaid and uncompensated care in Florida. As stated in the MACPAC report to
Congress dated March 2014, “… provider contributed financing, such as health care related
taxes, has significant effects on the net amount of Medicaid payments that providers receive.”80
This report also concludes “without data on both health care related taxes and supplemental
payments, it is not possible to meaningfully compare Medicaid payments across providers and
states.”81
Under this analysis, the overall average pay-to-cost for hospitals in all three categories
combined is 49 percent.
Figure 22. Comparing average pay-to-cost ratios for hospitals based on IGT category – all payments
and cost, including LIP, DSH and uncompensated care – IGT and provider assessment contributions
subtracted from payments.
Notes for Figure 22:
1) Data is based on claim payments and cost from SFY 2012/13. Both fee-for-service
and managed care claims for both hospital inpatient and outpatient services are
included. In addition, LIP payments, DSH payments, and the cost of
uncompensated care are included.
2) Data is limited to in-state hospitals with at least one submitted claim in SFY
2012/13.
80 Medicaid and CHIP Payment Access Commission (MACPAC), Report to the Congress on Medicaid and CHIP. (March
2014) 81 Ibid.
55%
42%
22%
0%
10%
20%
30%
40%
50%
60%
Hospitals Contributing
and Receiving IGTs
104 Hospitals
Hospitals Receiving but
not Contributing IGTs
29 Hospitals
Non-IGT Hospitals
88 Hospitals
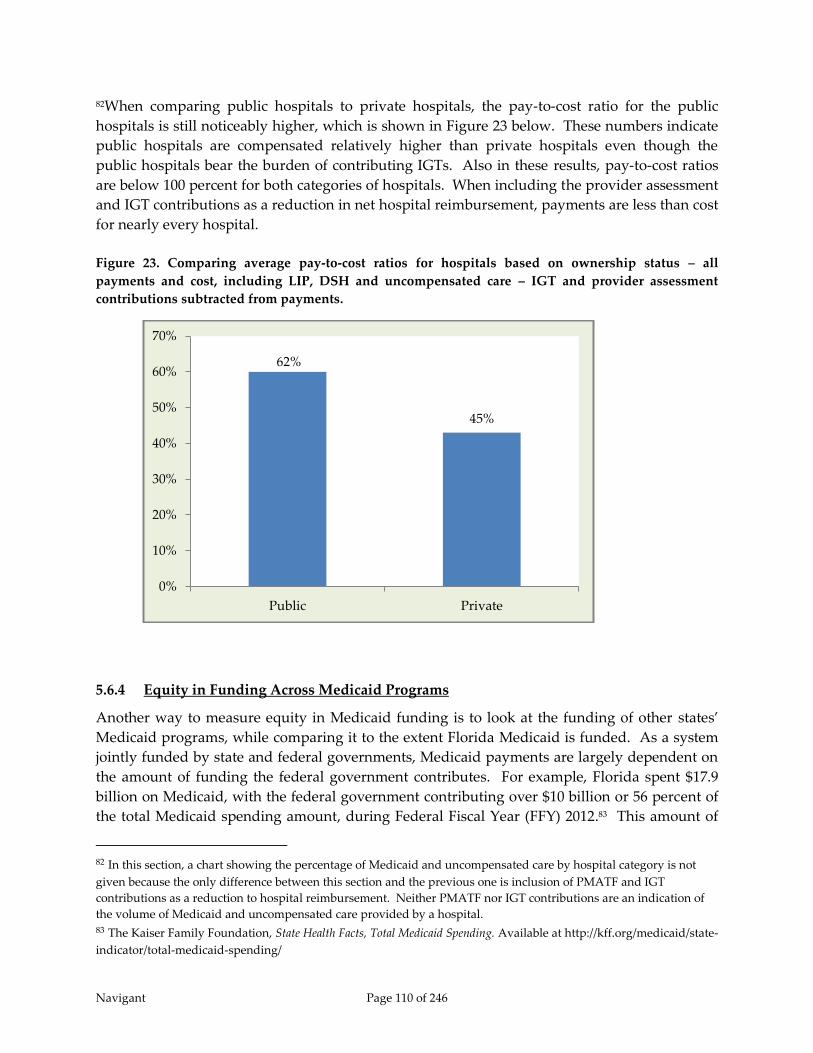
Navigant Page 110 of 246
82When comparing public hospitals to private hospitals, the pay-to-cost ratio for the public
hospitals is still noticeably higher, which is shown in Figure 23 below. These numbers indicate
public hospitals are compensated relatively higher than private hospitals even though the
public hospitals bear the burden of contributing IGTs. Also in these results, pay-to-cost ratios
are below 100 percent for both categories of hospitals. When including the provider assessment
and IGT contributions as a reduction in net hospital reimbursement, payments are less than cost
for nearly every hospital.
Figure 23. Comparing average pay-to-cost ratios for hospitals based on ownership status – all
payments and cost, including LIP, DSH and uncompensated care – IGT and provider assessment
contributions subtracted from payments.
5.6.4 Equity in Funding Across Medicaid Programs
Another way to measure equity in Medicaid funding is to look at the funding of other states’
Medicaid programs, while comparing it to the extent Florida Medicaid is funded. As a system
jointly funded by state and federal governments, Medicaid payments are largely dependent on
the amount of funding the federal government contributes. For example, Florida spent $17.9
billion on Medicaid, with the federal government contributing over $10 billion or 56 percent of
the total Medicaid spending amount, during Federal Fiscal Year (FFY) 2012.83 This amount of
82 In this section, a chart showing the percentage of Medicaid and uncompensated care by hospital category is not
given because the only difference between this section and the previous one is inclusion of PMATF and IGT
contributions as a reduction to hospital reimbursement. Neither PMATF nor IGT contributions are an indication of
the volume of Medicaid and uncompensated care provided by a hospital. 83 The Kaiser Family Foundation, State Health Facts, Total Medicaid Spending. Available at http://kff.org/medicaid/state-
indicator/total-medicaid-spending/
62%
45%
0%
10%
20%
30%
40%
50%
60%
70%
Public Private

Navigant Page 111 of 246
funding is relatively low compared to other states considering the high number of Medicaid
and uninsured beneficiaries in Florida. A major reason for Florida’s lower funding for its
Medicaid program is the small amount of federal funds allotted for its supplemental programs.
Supplemental funding is an avenue many states use to draw down considerable federal funds
to help reduce the Medicaid shortfall and cover the cost of uncompensated care. Florida
Medicaid receives and distributes supplemental funds for uncompensated care through its DSH
and LIP programs. When looking at other similarly-sized Medicaid programs, Florida’s
supplemental funding is rather low.
When examining the volume of uninsured individuals, Florida ranks 3rd among all states with
25 percent of its non-elderly population without health insurance, equating to approximately
3.8 million people.84 While it may not necessarily be the State’s obligation to fund health care
services for the uninsured population, this high percentage should not be ignored. Uninsured
patients present to hospitals, and in many instances, hospitals are legally obligated to provide
care. This presents a financial burden on the hospitals that can affect the overall financial
viability of the hospitals, which are critical to maintaining access to care for the Medicaid
population. Health services provided to the combined Medicaid and uninsured populations in
the State of Florida comprise 45 percent of those provided to all of the State’s non-elderly
residents. As one of the largest Medicaid programs in the country, responsible for paying for a
large percentage of its population’s health care, Florida requires a significant amount of funding
to adequately pay providers for the care administered to Medicaid and uninsured patients.
With so many Florida residents dependent on the Medicaid system, adequate funding from the
federal government is critical for providers to continue to have the ability to provide necessary
care. Florida ranks 33rd among all states in regards to the percentage of federal funding it
receives compared to the total amount spent on Medicaid.85 The amount contributed by the
federal government is largely dependent on the amount of the non-federal share the state is able
to contribute to the program and on the state’s individual Federal Medical Assistance
Percentage (FMAP). The FMAP determines the federal government’s share of the cost of
covered services in state Medicaid programs and is calculated annually by assessing a state’s
average personal income relative to the national average. States with a lower average personal
income have higher FMAPs. For FFY 2012, Florida’s FMAP was 56 percent, which is lower than
average for the 50 states. Section 1905(b) of the Social Security Act specifies the formula for
calculating FMAPs as follows:
“’Federal medical assistance percentage’ for any State shall be 100 per centum less the
State percentage; and the State percentage shall be that percentage which bears the same
ratio to 45 per centum as the square of the per capita income of such State bears to the
square of the per capita income of the continental United States (including Alaska) and
84 The Kaiser Family Foundation, State Health Facts, Nonelderly Uninsured. Available at http://kff.org/uninsured/state-
indicator/rate-by-gender/ 85 The Kaiser Family Foundation, State Health Facts, Total Medicaid Spending. Available at http://kff.org/medicaid/state-
indicator/total-medicaid-spending/

Navigant Page 112 of 246
Hawaii; except that the federal medical assistance percentage shall in no case be less
than 50 per centum or more than 83 per centum.”
In addition to having a relatively low FMAP percentage, another reason for the comparatively
low amount of federal funds contributed to Florida Medicaid is the discrepancy in funding for
supplemental programs when comparing Florida with other similar states such as California
and Texas. Florida receives funds for both DSH and non-DSH supplemental programs. DSH
payments are a common way for states to provide supplemental funds to hospitals. States
receive an annual DSH allotment to cover the costs of DSH hospitals that provide care to low-
income patients that are not paid by other payers, such as Medicare, Medicaid, the Children’s
Health Insurance Program (CHIP), or other health insurance. In FFY 2013, Florida was allotted
a little over $200 million in federal dollars for its DSH program. This amount fails to
compensate for the substantial size of Florida’s uninsured population. Even with the addition
of Florida’s $1 billion LIP program, the funds available to reimburse hospitals for
uncompensated care are less than the hospitals’ costs.
In order to put this amount of supplemental funding into context, Florida can be compared to
Medicaid programs of similar size, such as California and Texas. Each of these three states
submitted a Medicaid Reform Section 1115 demonstration waiver that addressed supplemental
funding during the post-ACA era. Each waiver affected hundreds of thousands of Medicaid
beneficiaries, involved billions of federal dollars and was meant to provide better care, improve
population health and reduce costs. However, there is a large disparity in the state and federal
dollars that were allocated to achieve these goals. The average annual waiver pools and DSH
funding for Florida, California, and Texas were $1.37 billion, $5.06 billion, and $7.48 billion,
respectively.
A contributing factor to California and Texas receiving significantly more supplemental
funding than Florida is their access to funds through their Delivery System Reform Incentive
Payment (DSRIP) Programs. DSRIP is used to reward hospital systems for improving access to
care and the health of the Medicaid and uninsured patients they serve.86 California and Texas
were both granted approval of DSRIP programs resulting in additional funding of $1.3 billion
and $3.1 billion, respectively, amounting to a large portion of both states supplemental funds.
In addition, Florida lags significantly behind in the amount of DSH funding it receives. The
$200 million Florida receives in federal funds for DSH payments fail to compare to the $1.2
billion California receives and the $1.0 billion Texas receives. These numbers are depicted in
Figure 24 below.
86 Sellers Dorsey, Review of Medicaid Reform 1115 Demonstration Waiver: Comparing California, Texas and Florida at the
request of The Safety Net Hospital Alliance of Florida, (February 12, 2012.)

Navigant Page 113 of 246
Figure 24. Comparison of average annual DSH and waiver program funding for Florida, Texas, and
California.
The numbers in Figure 24 reflect average annual supplemental funding outlined in each state’s
1115 demonstration waiver87. While California and Texas have larger Medicaid programs, the
amount of funding they receive for their supplemental programs is disproportionately higher
than what Florida receives. When examining the size of the Medicaid and uninsured
population, Florida’s population is 69 percent the size of the equivalent population in Texas.
However, the amount of supplemental funding Florida receives is only 18 percent of what
Texas receives. The same disparity arises when comparing with California. Florida’s Medicaid
and uninsured population is 41 percent the size of California’s, but Florida only receives 27
percent of the funding California receives. When considering the total population that
Medicaid funding will cover, California and Texas are both receiving substantially more
supplemental funding than Florida.
87Sellers Dorsey, Review of Medicaid Reform 1115 Demonstration Waiver: Comparing California, Texas and Florida at the
request of The Safety Net Hospital Alliance of Florida, (February 12, 2012).
$0
$1
$2
$3
$4
$5
$6
$7
$8
FloridaTexas
California
Florida Texas California
DSRIP $- $3.08 $1.30
DSH Payments $0.37 $1.68 $2.24
Non-DSH/Uncompensated
Care Pools$1.00 $2.72 $1.51
Average Annual DSH and Waiver Program
Funding
DSRIP
DSH Payments
Non-DSH/Uncompensated
Care Pools
$ in Billions

Navigant Page 114 of 246
Figure 25. DSH and Waiver program funding disparity when comparing Florida to Texas and
California.
The combination of low federal assistance and high Medicaid and uncompensated care costs
puts a strain on Florida to produce sufficient payments to hospitals to care for this population.
This has resulted in lower payments to hospitals, as illustrated both by the pay-to-cost ratios
documented in Sections 5.3 and 5.6 of this chapter and by Florida’s low Medicaid-to-Medicare
Fee Index. The Medicaid-to-Medicare fee index measures each state's physician fees relative to
Medicare fees in each state. In 2012, Florida ranked 45th with a fee index of 0.57 with the
national average at 0.66.88 In addition, the lack of funding contributes to low Medicaid
payments per enrollee. Florida spends on average $4,66089 on each enrollee per year, over $1,000
less than the national average, ranking Florida 46th among Medicaid programs. Low Medicaid
funding is directly related to this lack in provider payment adequacy.
88 The Kaiser Family Foundation, State Health Facts, Medicaid & Chip, Available at http://kff.org/state-
category/medicaid-chip/. 89 The Kaiser Family Foundation, Medicaid Spending Per Enrollee, Available at http://kff.org/medicaid/state-
indicator/medicaid-spending-per-enrollee/#, downloaded in January 2015 – Data is from FFY 2011, includes both
state and federal funds, and does not include DSH payments.
0.00%
10.00%
20.00%
30.00%
40.00%
50.00%
60.00%
70.00%
Texas California
Florida as a Percentage of Other States
Supplemental Funding Disparity
Medicaid and Uninsured
Population
Supplemental Funds
Total Florida as a % of Other State Total Florida as a % of Other State
Florida 7,537,088 - 1,370,000,000$ -
Texas 11,010,937 68.45% 7,480,000,000$ 18.32%
California 18,421,211 40.92% 5,060,000,000$ 27.08%
StateMedicaid and Uninsured Population Average Annual Supplemental Funds

Navigant Page 115 of 246
When addressing equity in funding between Medicaid programs, the amount of federal
funding allocated to each state is a major factor. Even though Florida is ranked 3rd in the
amount of uninsured individuals and has an additional 20 percent of its population covered by
Medicaid, it receives a federal assistance percentage that is less than the national average. This
results in lower payments to providers and potentially less access to care for Medicaid
recipients. In addition, Florida is receiving substantially less in supplemental funding than
states of similar size, as other states have taken advantage of additional opportunities to pull
down federal funds. Florida’s Medicaid program is not funded to the level that programs of
similar size across the nation are, resulting in below average payments to providers throughout
the state.
5.7 Conclusion
Given the size of the Medicaid program and the amount of uninsured in the State of Florida,
there is room to provide greater compensation to hospitals while staying within CMS’s
standard limit of paying no more than hospital cost. Increasing funding for the program to
enable greater compensation will require agreement from AHCA, the Florida Legislature, the
Florida hospital community, and CMS. AHCA, the Florida Legislature, and the Florida hospital
community would need to develop methods for increasing the state share of funds contributing
to the Medicaid program. CMS would need to agree that the spending of federal matching
funds remains within federal guidelines. Finding options all parties can agree to will be no easy
task.
Even maintaining current funding levels within the program will require effort. The current
method has inherit inequities based on hospitals’ access to IGTs. The method also relies on a
significant amount of supplemental payments, which are traditionally considered unacceptable
by CMS for services delivered under Medicaid managed care models, and Florida Medicaid
recently shifted most of the beneficiaries into Medicaid managed care. In addition, the method
relies, to a relatively small degree, on DSH payments which the federal government is planning
to decrease as part of the Patient Protection and Affordable Care Act (PPACA).
Navigant Page 116 of 246
6 Medicaid Expansion
6.1 Introduction
CMS’s specifications for this study of hospital funding and payment made two specific
references to Medicaid expansion. These references are shown below:
“The report must also include an analysis of how future changes in Medicaid, including
possible Medicaid expansion would affect Medicaid payment amounts and structure,
including fee-for-service payments, managed care, and LIP.
Finally, the report must recommend reforms to the Florida Medicaid financing system
that can allow the state, beginning in state fiscal year 2015-2016, to move toward
Medicaid fee-for-service and managed care payments to providers that ensure access
and quality of care for Medicaid beneficiaries without the need for LIP funds. These
payments should be based on a rationalized, non-facility specific payment mechanism,
which can be applicable to future changes in Medicaid including Medicaid expansion.“90
Because of these specifications, we have included in this study a discussion of the potential for
Medicaid expansion. For a variety of reasons, we do believe Medicaid expansion is an option
worthy of consideration by the State of Florida. Expansion would increase the number of
Florida residents with medical insurance, bring a significant amount of federal funds into the
state, and help offset planned reductions in DSH payments and Medicare fee-for-service
payments to hospitals. Of course, all of these benefits would only be achieved with some
additional cost to the State. After 2016, Florida would need to find a way to increase its state
share of funding for the Medicaid program.
We do not, however, believe that a decision to expand Medicaid in Florida would be sufficient
as a full replacement of the LIP program. The LIP program funds some of the gap between
Medicaid payments and the Medicare Upper Payment Limit (UPL). This has been true
throughout the life of the LIP program, and is particularly true in SFY 2014/15 in which self-
funded IGTs have been moved into LIP. In addition in SFY 2014/15 the LIP program contains
supplemental payments to teaching physicians that would not get replaced by expanding
Medicaid. In the SFY 2014/15 LIP program, self-funded IGTs were estimated to equal $963
million (total computable) and supplemental payments to teaching physicians were estimated
to equal $204 million (total computable).
In terms of the traditional $1 billion LIP program (total computable), there is no distinction
made in terms of what portion is used to fund the gap between Medicaid payments and the
UPL versus the portion intended to help fund the costs of services provided to uninsured
patients. From its inception in SFY 2006/07 through SFY 2010/11, the $1 billion LIP program
90 Centers for Medicare and Medicaid Services, Special Terms and Conditions for Florida Medicaid Reform Section 1115
Demonstration, Document number 11-W-00206/4, STC number 69. (June 2014)

Navigant Page 117 of 246
primarily funded the gap between Medicaid reimbursements and the UPL. (This statement
assumes payments from the LIP program are applied first to the UPL gap and secondly to
uncompensated care.) In SFY 2011/12, the Florida Legislature authorized the use of self-funded
IGTs to all hospitals who could contribute IGTs, and the amount of money distributed by the
State from self-funded IGTs increased by 370 percent in two years.91 Thus, in more recent years,
the gap between Medicaid payment and the UPL has been relatively well covered by self-
funded IGTs for those hospitals who are able to contribute self-funded IGTs. For example,
when looking at the UPL calculations for SFY 2013/14, which was the last year Florida Medicaid
was primarily a fee-for-service program, the Non-State, Government Owned hospital category
had a UPL gap of only $18 million, whereas the Privately Owned hospital category had a UPL
gap of $480 million. Although no formal distinction is made, one might imply from these
numbers that payments from the traditional $1 billion LIP program to Non-State, Government
Owned hospitals primarily contribute to those hospitals’ costs of caring for the uninsured.
Payments from the traditional $1 billion LIP program to Privately Owned hospitals primarily
contribute to the gap between Medicaid reimbursement and the UPL. (Again, this statement
assumes payments from the LIP program are applied first to the UPL gap and secondly to
uncompensated care.)
6.2 Background on Medicaid Expansion
One of Congress’ goals in enacting the Patient Protection and Affordable Care Act (“ACA”) was
to reduce the number of uninsured Americans by expanding access to affordable health
insurance coverage. Congress sought to achieve this goal through a variety of means, including
expansion of eligibility for Medicaid benefits. The ACA’s Medicaid expansion originally
required that, beginning in 2014, states cover nearly all people under age 65, who are not
entitled to Medicare, not described in an existing mandatory Medicaid coverage group, and
who have incomes at or below 13892 percent of the Federal poverty level (FPL).
In June 2012, the U.S. Supreme Court ruled as unconstitutional, the provisions of the ACA
denying federal matching funds to states that refuse to extend Medicaid eligibility to 138
percent of the FPL. The challenge to the ACA’s Medicaid expansion raised questions about the
proper balance of power between the federal government and the states. The court ruled that
Medicaid expansion is unconstitutionally coercive of states because states lacked adequate
notice to voluntarily consent and the secretary could withhold all existing Medicaid funds.
Chief Justice Roberts along with Justices Breyer and Kagan emphasized that states, as
independent sovereigns, must have a “genuine choice” about whether to accept offers of federal
funds that have conditions attached.93 As a result, Florida and other states now have the
opportunity to compare the costs and benefits of expanding Medicaid eligibility.
91 $247 million was distributed in SFY 2010/11 and $912 million was distributed in SFY 2012/13. 92 138 percent of FPL represents the maximum gross income level for Medicaid eligibility as defined in the PPACA.
However, in determining “net income” 5 FPL percentage points are subtracted from household income.
Accordingly, the net or nominal income threshold for expanded Medicaid is 133 percent of the FPL. 93 National Center for Policy Analysis, An Economic and Policy Analysis of Florida Medicaid Expansion, (March, 2013).

Navigant Page 118 of 246
States that do not expand Medicaid receive their regular FMAP (around 59 percent for Florida)
for new enrollment of recipients eligible for Medicaid. In addition, federal subsidies are offered
to families with incomes between 100 percent and 400 percent of the FPL to help them purchase
commercial insurance coverage through a Health Insurance Exchange (which is now referred to
as the “Marketplace”). In contrast, for states that do expand their Medicaid program, federal
subsidies are offered to families with incomes between 138 percent and 400 percent of the FPL
to help them purchase commercial insurance coverage through the Marketplace. Also in
expanding states, Medicaid coverage is offered to all families up to 138 percent of the FPL. For
recipients receiving Medicaid coverage under the expanded eligibility rules, states will receive
100 percent federal matching for costs in 2014 through 2016. Between 2017 and 2020, the federal
matching percentage gradually decreases down to 90 percent and continues at 90 percent
thereafter.94 There are two exceptions where states who had waiver programs covering
childless adults for FPL percentages up to or over 100 percent prior to enactment of the ACA
may receive the new, higher FMAP for these recipients. However, we do not believe these
exceptions apply to any existing programs within Florida Medicaid.
The decision whether or not to expand Medicaid is of particular concern to hospitals because
the ACA can affect both payment increases and reductions for hospitals. The ACA offers
increases in hospital revenue through expanded Medicaid eligibility and new subsidies to help
low and moderate income households buy coverage through health insurance exchanges.
Accompanying this are planned reductions in Medicaid and Medicare DSH funding as well as a
reduction on Medicare hospital fee-for-service payments through reductions or removals of
planned future increases.95
6.3 Florida’s Current Stance on Medicaid Expansion
As of December 1, 2014, 28 states and the District of Columbia have opted to expand Medicaid
in their state, allowing more than 10.5 million low-income Americans to now have access to
health coverage. The remaining 22 states, including Florida, have refrained from expanding
Medicaid. In 2012, Gov. Rick Scott spoke publicly against the idea of Medicaid expansion in the
State of Florida. Since then his stance on the topic has evolved and more recent comments have
been guardedly in favor of some form of Medicaid expansion for Florida. In February of 2014 in
a public statement, Scott indicated he is in favor of Medicaid expansion in Florida:
“To be clear - our options are either having Floridians pay to fund this program in other
states while denying health care to our citizens – or – using federal funding to help some
of the poorest in our state with the Medicaid program as we explore other health care
reforms... We will support a three-year expansion of our Medicaid program under the
94 Kaiser Family Foundation, A Guide to the Supreme Court’s Decision on the ACA’s Medicaid Expansion, (August, 2012). 95 Urban Institute, The Financial Benefit to Hospitals from State Expansion of Medicaid, (March, 2013).
Navigant Page 119 of 246
new health care law, as long as the federal government meets their commitment to pay
100 percent of the cost during this time.”96
However, Gov. Scott does not have unilateral authority to implement Medicaid expansion in
Florida. A decision to expand Medicaid and the method in which expansion would be
implemented must be approved by the Florida State Legislature. This topic was discussed by
the Florida State Legislature in both the 2013 and 2014 sessions, and in both sessions, the
Legislature voted against expanding Medicaid.
6.4 Proposed Medicaid Expansion Outcomes
There are many different views on Medicaid expansion and its effects on each state from both a
financial and health outcomes perspective. Outlined below are important issues at the heart of
the decision to implement Medicaid expansion.
In a July 2014 report from the White House, The Council of Economic Advisers (CEA)
summarized the negative consequences of states deciding to forego Medicaid expansion. Prior
to the CEA report, the National Center for Policy Analysis (NCPA) published a report in March
of 2013 that expressed the negative repercussions for the state of Florida if they were to expand
Medicaid. An examination of these differing viewpoints allows for a more thorough
understanding of the issues at hand for this important policy decision.
6.4.1 Access to and Use of Medical Care
Improving access to care for low income populations was one of the pillars of the ACA.
According to the CEA, Medicaid expansion would provide a great opportunity to accomplish
this. The CEA used the Oregon Health Insurance Experiment (OHIE) as a comparison to what
is expected to happen under Medicaid expansion. The OHIE arose from Oregon’s decision in
2008 to reopen enrollment under an earlier Medicaid expansion that had extended coverage to
uninsured adults under 100 percent of the FPL. However, the state could not accommodate all
interested applicants and decided to allocate the opportunity to enroll in Medicaid by lottery.
By comparing those who were awarded coverage under Medicaid to those who lost the lottery,
it is possible to isolate the causal effect of having or not having Medicaid coverage. Citing the
OHIE results, the CEA expects access to care will dramatically improve for Medicaid patients
under proposed Medicaid expansion. During the OHIE, Medicaid coverage increased the
probability that individuals reported receiving all needed medical care over the prior 12 months
by 11.4 percentage points. Forecasting this increase in access to care to Florida’s population, the
CEA believes if Medicaid is fully expanded as originally proposed in the ACA, there will be an
additional 201,000 Floridians with a usual source of clinic care (ex. primary care physician). In
addition, the CEA projects there will be an additional 2,290,000 physician visits per year. The
CEA cites an additional observation from the OHIE, an increase in preventative care. The CEA
projects that if Florida expands Medicaid, the amount of cholesterol-level screenings,
96 Rick Scott, “We Must Protect the Uninsured and Florida Taxpayers with Limited Medicaid Expansion,” PolitiFact Florida
(February 25, 2014).

Navigant Page 120 of 246
mammograms, and papanicolaou tests per year will increase by 123,600; 35,300; 52,200
respectively.97 The CEA considers Medicaid expansion for Florida a huge step in the right
direction towards improving access and use of care.
The NCPA, on the other hand, believes that the increase in the access to coverage for newly
insured Medicaid patients is overstated. Nationally, according to the NCPA, slightly less than
one-third of physicians will not accept new Medicaid patients. Physicians are four times more
likely to turn away new Medicaid patients than those with no insurance (31 percent versus 8
percent). This practice is especially true of doctors in larger cities or in small practices. More
than one-third of primary care physicians do not accept new Medicaid patients.98
The NCPA presents similar percentages of physicians unwilling to accept Medicaid patients in
the State of Florida. However, their surveys and calculations were performed prior to Florida
Medicaid’s state-wide rollout of mandatory managed care in 2014 that includes much stricter
requirements on the managed care plans to develop provider networks. In addition, the
NCPA’s percentages were based on a survey where Medicaid had not been expanded. These
percentages might be different if a much larger proportion of the population were Medicaid
eligible.
NCPA also suggests the increase in Medicaid patients will have a substantial impact on ER use.
The National Center for Health Statistics (NCHS) found Emergency Room use is closely
associated with Medicaid enrollment. For instance, the agency found that nearly one-third of
Medicaid enrollees used the ER at least once during a 12-month period. Individuals with
private health coverage were only about half as likely as Medicaid enrollees to visit an ER.
Furthermore, Medicaid enrollees are three times as likely (15 percent vs. 5 percent) as the
privately insured, and twice as likely as the uninsured (15 percent vs. 7 percent), to have visited
an ER twice in the previous year.99 While the expansion of Medicaid in Florida would improve
likelihood of gaining access to primary/preventative care for new enrollees, it must be realized
that doctors still have to decide to accept or deny new patients and there could be unintended
consequences, such as increased ER use.
6.4.2 Health Outcomes
As one of the components of CMS’ triple aim, better health for the population is an area that the
CEA believes Medicaid expansion can address. The CEA states the OHIE provides clear
evidence that individuals receiving Medicaid coverage perceived themselves to be in better
health. In results through approximately two years of follow-up, Medicaid coverage increased
97 The Council of Economic Advisers, Missed Opportunities: The Consequences of State Decisions Not to Expand Medicaid.
(July, 2014) 98 National Center for Policy Analysis, An Economic and Policy Analysis of Florida Medicaid Expansion. (March,
2013). Available at: http://www.ncpa.org/pub/st347 99 Tamyra Carroll Garcia, Amy B. Bernstein, and Mary Ann Bush, National Center for Health Statistics, “Emergency
Department Visitors and Visits: Who Used the Emergency Room in 2007?”, NCHS Data Brief No. 38, (May 2010). Available
at http://www.cdc.gov/nchs/data/databriefs/db38.pdf.
Navigant Page 121 of 246
the share of individuals reporting that their health had remained the same or improved over the
prior year by 7.8 percentage points. In earlier results through slightly more than one year of
follow-up, Medicaid also increased the probability that an individual reported that his or her
health was good, very good, or excellent by 13.3 percentage points. The CEA believes Medicaid
expansion will create an additional 113,000 Floridians that will report having “Good, Very
Good, or Excellent Health” and reduce the number of patients reporting having depression by
68,000.
The NCPA is more skeptical about the added health benefit that being enrolled in Medicaid has,
as they indicate that various academic papers have found that Medicaid enrollees sometimes
fare worse than patients with private insurance and often worse than patients with no
insurance. For example:
Post-surgical patients enrolled in Medicaid are almost twice as likely to die as privately-
insured individuals and about 12 percent more likely to die than the uninsured,
according to a University of Virginia study.100
Florida Medicaid enrollees were nearly one-third (31 percent) more likely to be
diagnosed with late-stage breast cancer and 81 percent more likely to be diagnosed with
melanoma at a late stage. Medicaid patients did outperform the uninsured on late-stage
colon cancer.101
Patients in children’s hospitals that rely heavily on Medicaid payments have more
adverse events than those in hospitals caring for predominately privately insured
patients.102
Again, it should be noted that these results are in the absence of a Medicaid expansion in
Florida, and the results might be different if the uninsured were in fact transitioned to
Medicaid. In any case, these results should not imply that being Medicaid eligible would
somehow “cause” poorer health care outcomes, so long as appropriate standards of care are
applied. In other words, we do not believe it is reasonable to conclude that an uninsured
patient’s health outcomes would somehow be compromised by providing them with some form
of insurance.
100 Damien J. LaPar et al., “Primary Payer Status Affects Mortality for Major Surgical Operations,” presentation to the
130th Annual Meeting of the American Surgical Association, 130th Annual Meeting Abstracts, (April 2010).
Available at http://www.americansurgical.info/abstracts/2010/18.cgi. 101 Richard G. Roetzheim et al., Journal of the National Cancer Institute, “Effects of Health Insurance and Race on Early
Detection of Cancer,” (August 18, 1999) Available at
http://jnci.oxfordjournals.org/cgi/content/full/91/16/1409?ijkey=3894238ad956b166ab570c56f9648d625979f6d. 102 Richard B. Smith et al., Health Services Research, “Medicaid, Hospital Financial Stress, and the Incidence of Adverse
Medical Events for Children,” Vol. 47, No 4, (August 2012) Available at
http://www.hsr.org/hsr/abstract.jsp?aid=47903270811.

Navigant Page 122 of 246
6.4.3 Impact on Providers
Uncompensated care creates a large financial strain on many providers, especially those
identified as safety-net hospitals. Researchers at the Urban Institute have estimated that, if all
States expanded Medicaid, reductions in uncompensated care currently financed by State
governments would more than offset any additional Medicaid costs, generating $10 billion in
savings over ten years for all States, while also producing savings for providers at the same
time.103 Our high-level analysis of the Florida Medicaid program suggests some savings would
be available, but without further detailed study it is unclear if the savings would be enough to
offset all of the additional costs to the state when the FMAP for the expansion population
reaches 90 percent.
Also, the increase in Medicaid patients may not always translate into an increase in benefits
provided. The NCPA points out that Florida’s physician supply is relatively inelastic and
cannot increase quickly to accommodate rising demand for medical services. More than 85
percent of Florida physicians have already reached middle age, and many will retire in the
coming years. Florida physicians have little if any excess capacity to treat additional Medicaid
patients. Half of Florida’s doctors already see more than 75 patients per week; nearly one-third
(30.1 percent) see more than 100 patients each week. Florida physicians have little if any
capacity to expand the number of patients they treat and it is an already bad situation for
Florida doctors struggling to keep their office doors open to Medicaid patients. While
decreasing the amount of uncompensated care costs, the increase in Medicaid patients may
create additional problems for Florida to consider.104
6.4.4 Financial/Economic Implications
One of the biggest proposed benefits of Medicaid expansion is the financial stability it gives to
newly insured Floridians. The CEA describes that in the OHIE, Medicaid coverage nearly
eliminated the risk of facing catastrophic out-of-pocket medical costs. Specifically, being
enrolled in Medicaid reduced the probability of experiencing such an outcome by 4.5
percentage points, relative to a baseline risk of 5.5 percent in the uninsured group (catastrophic
costs were defined as out-of-pocket spending in excess of 30 percent of household income).
“By expanding Medicaid, states can pull billions in additional Federal funding into their
economies every year, with no state contribution until FFY 2017 and only a relatively modest
one thereafter for coverage for newly eligible people. If the 24 States that have not yet
expanded Medicaid had done so as of January 1, 2014, those states and their citizens would
103 Kaiser Commission on Medicaid and the Uninsured, Holahan, John, Matthew Buettgens, Stan Dorn, “The Cost of
Not Expanding Medicaid,” (2013). 104 National Center for Policy Analysis, An Economic and Policy Analysis of Florida Medicaid Expansion, (March,
2013). Available at: http://www.ncpa.org/pub/st347

Navigant Page 123 of 246
have received an additional $88 billion in Federal support through calendar year 2016.”105
Florida would take over $15 billion of that share.
By pumping more Federal dollars into their economies, states’ decisions to expand Medicaid
creates jobs. The CEA projects there could be 63,800 additional jobs in Florida by 2017, due to
the expansion.
However, the NCPA is worried the federal government won’t be able to sustain the amount of
funding they are promising to states. Federal and state governments spent $389 billion on
Medicaid in 2010. Medicaid is the largest expense in most state budgets — and it is growing at
unsustainable rates. For instance:
State Medicaid spending was only $84 billion in 2000.
State Medicaid spending is projected to quadruple to $357 billion by 2020 — less than a
decade from now.
Federal spending on Medicaid was about $250 billion in 2009.
Federal spending is projected to more than double by 2020 to $574 billion.
Currently, the federal government pays 59.56 percent of Florida’s Medicaid costs. Medicaid
costs in Florida are likely to rise whether or not Florida expands Medicaid eligibility.
Additional costs for the Medicaid expansion population could be higher than anticipated for
many reasons. Over the past two decades, as Florida’s population grew approximately 50
percent, the Medicaid caseload tripled and expenditures increased approximately 450 percent.
6.5 Enrollment and Cost Estimates for Medicaid Expansion in Florida
Estimating the effect of Medicaid expansion in a state in terms of enrollment and state cost is a
difficult task. It requires applying a large number of assumptions, some of which may prove
true while others may not. In our research, we have found two detailed estimates of the effect
of Medicaid expansion on the State of Florida. One set of estimates was adopted by the Florida
Social Services Estimating Conference (SSEC) and another was produced by the Urban Institute
and documented in a number of articles distributed both by the Urban Institute and by the
Kaiser Commission on Medicaid and the Uninsured. These estimates are summarized in Table
9 below:
105 The Council of Economic Advisers, Missed Opportunities: The Consequences of State Decisions Not to Expand Medicaid,
(July, 2014).
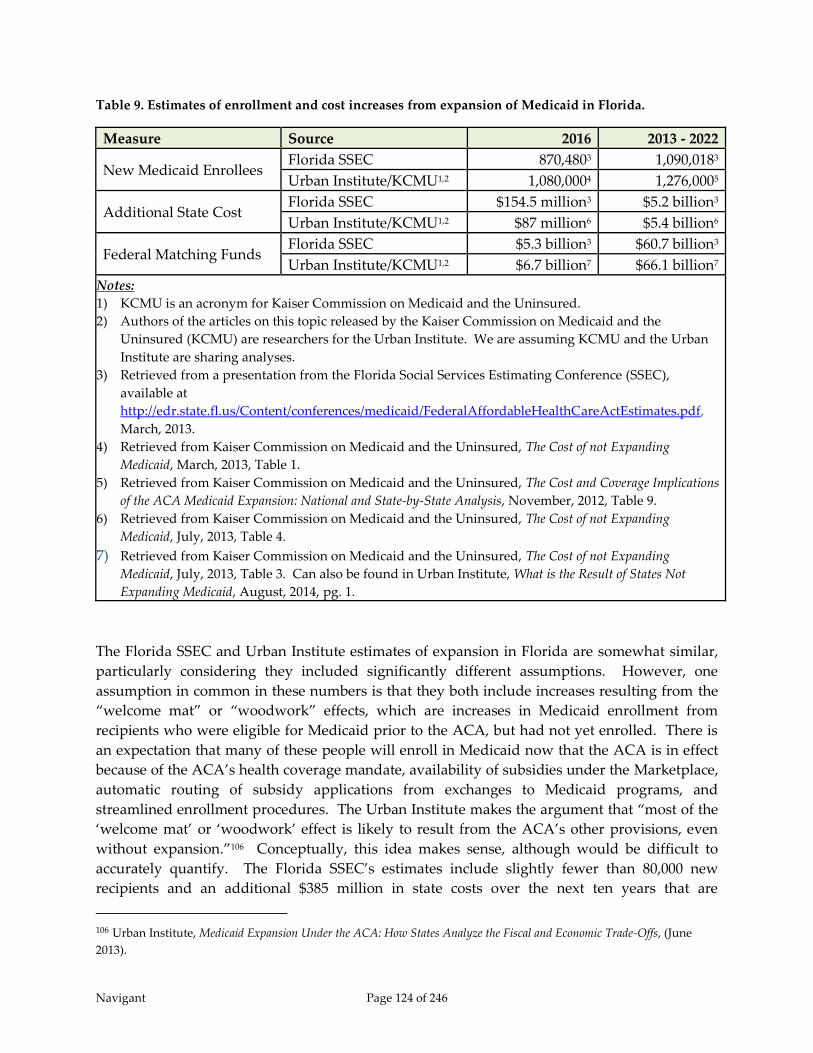
Navigant Page 124 of 246
Table 9. Estimates of enrollment and cost increases from expansion of Medicaid in Florida.
Measure Source 2016 2013 - 2022
New Medicaid Enrollees Florida SSEC 870,4803 1,090,0183
Urban Institute/KCMU1,2 1,080,0004 1,276,0005
Additional State Cost Florida SSEC $154.5 million3 $5.2 billion3
Urban Institute/KCMU1,2 $87 million6 $5.4 billion6
Federal Matching Funds Florida SSEC $5.3 billion3 $60.7 billion3
Urban Institute/KCMU1,2 $6.7 billion7 $66.1 billion7
Notes:
1) KCMU is an acronym for Kaiser Commission on Medicaid and the Uninsured.
2) Authors of the articles on this topic released by the Kaiser Commission on Medicaid and the
Uninsured (KCMU) are researchers for the Urban Institute. We are assuming KCMU and the Urban
Institute are sharing analyses.
3) Retrieved from a presentation from the Florida Social Services Estimating Conference (SSEC),
available at
http://edr.state.fl.us/Content/conferences/medicaid/FederalAffordableHealthCareActEstimates.pdf,
March, 2013.
4) Retrieved from Kaiser Commission on Medicaid and the Uninsured, The Cost of not Expanding
Medicaid, March, 2013, Table 1.
5) Retrieved from Kaiser Commission on Medicaid and the Uninsured, The Cost and Coverage Implications
of the ACA Medicaid Expansion: National and State-by-State Analysis, November, 2012, Table 9.
6) Retrieved from Kaiser Commission on Medicaid and the Uninsured, The Cost of not Expanding
Medicaid, July, 2013, Table 4.
7) Retrieved from Kaiser Commission on Medicaid and the Uninsured, The Cost of not Expanding
Medicaid, July, 2013, Table 3. Can also be found in Urban Institute, What is the Result of States Not
Expanding Medicaid, August, 2014, pg. 1.
The Florida SSEC and Urban Institute estimates of expansion in Florida are somewhat similar,
particularly considering they included significantly different assumptions. However, one
assumption in common in these numbers is that they both include increases resulting from the
“welcome mat” or “woodwork” effects, which are increases in Medicaid enrollment from
recipients who were eligible for Medicaid prior to the ACA, but had not yet enrolled. There is
an expectation that many of these people will enroll in Medicaid now that the ACA is in effect
because of the ACA’s health coverage mandate, availability of subsidies under the Marketplace,
automatic routing of subsidy applications from exchanges to Medicaid programs, and
streamlined enrollment procedures. The Urban Institute makes the argument that “most of the
‘welcome mat’ or ‘woodwork’ effect is likely to result from the ACA’s other provisions, even
without expansion.”106 Conceptually, this idea makes sense, although would be difficult to
accurately quantify. The Florida SSEC’s estimates include slightly fewer than 80,000 new
recipients and an additional $385 million in state costs over the next ten years that are
106 Urban Institute, Medicaid Expansion Under the ACA: How States Analyze the Fiscal and Economic Trade-Offs, (June
2013).

Navigant Page 125 of 246
attributable to new enrollees who were previously eligible for Medicaid but had not enrolled.
Thus, the estimates of additional state cost from Medicaid expansion shown in Table 9 above
are likely to be slightly overstated.
6.6 Potential Savings and Offsetting Revenue Increases from Expansion
Some states are actually seeing a reduction in net cost to the state when they implemented
Medicaid expansion. Most of these states had expanded their Medicaid programs prior to the
enactment of the ACA through waivers or use of state funds. For these states, Medicaid
expansion allowed them to increase the federal matching rate and in some cases, replace state-
only programs with heavily federal-funded ACA expansion for recipients between 100 and 138
percent of the FPL.
Florida Medicaid does not have many programs in this category and is not likely going to see a
net decrease in the state share of Medicaid costs through expansion. Even so, there are areas
where Florida Medicaid’s costs will be reduced through expansion as well as expectations that
Medicaid expansion will increase state tax revenue. These financial benefits from Medicaid
expansion were not included in the Florida SSEC’s estimates of the cost of expansion. Thus, the
estimated cost of expansion predicted by the Florida SSEC in March of 2013 is likely overstated.
In this study, we did not attempt to re-estimate the cost of Medicaid expansion to the State of
Florida based on our assumptions of benefits from expansion, which are detailed below.
6.6.1 Potential Reductions in State Cost from Expansion
There are two eligibility categories in which we believe Medicaid expansion would generate
savings to the State as long as the expansion FMAP percentage remains higher than the
standard Medicaid percentage. These two eligibility categories are medically needy (also
known as spend-down) and disabled adults. Under expansion, medically needy adults with
incomes at or below 138 percent of the FPL will qualify as newly eligible adults, without
incurring any health care costs. Because they will not meet pre-ACA spend-down
requirements, they will not fall within this pre-ACA eligibility category and so can receive
FMAP reserved for newly eligible adults. Medicaid will pay all of covered medical costs for
these recipients, rather than only the costs incurred after spend-down requirements are met.
However, the savings to the State from the increased federal matching percentage is expected to
more than compensate for costs of additional services being covered.107
Also for disabled adults there is potential for the state to benefit from the higher expansion
FMAP for new recipients with incomes at or below 138 percent of the FPL. If expansion is
implemented, low-income adults who would otherwise qualify for eligibility based on disability
might select qualification based on income to avoid the lengthy process of disability
107 Urban Institute, Medicaid Expansion Under the ACA: How States Analyze the Fiscal and Economic Trade-Offs, (June
2013).

Navigant Page 126 of 246
determination. If eligibility is based on income instead of disability, the Medicaid agency may
claim the higher expansion FMAP.108
In addition, an article from the Kaiser Commission on Medicaid and the Uninsured identifies
several other potential scenarios in which a Medicaid agency might experience reductions in
cost from implementation of expansion. We believe these other scenarios are less likely to
apply within the Florida Medicaid program, but there is potential for these to apply:
Limited benefit Medicaid programs: Beneficiaries who received less than full-scope
Medicaid before the ACA can qualify for enhanced FMAP as newly eligible adults.
Pre-ACA coverage of poor adults: States that, before the ACA, extended Medicaid to all
poor adults, including childless adults, can receive special enhanced FMAP for the latter.
Breast and cervical cancer treatment: Almost all state Medicaid programs cover women
whom CDC-affiliated clinics have diagnosed to have breast or cervical cancer. If a state
adopts the Medicaid expansion, these women could qualify as newly eligible adults, at
higher FMAP levels.109 (This scenario would be applicable to Florida if it can be
categorized as a limited benefit program.)
6.6.2 Potential Increases in Revenue from Expansion
In addition to a few possible reductions in state cost based on expansion, there are also several
areas of anticipated increases in state revenue. The Florida SSEC’s estimates show increases in
federal funds into the State reaching a sustained level of over $7 billion annually by SFY
2022/23. This significant increase in funds into the state economy will generate increases in state
general revenue through sales taxes. In addition, the increased reimbursements to hospitals
will result in greater revenue collected by the state through the hospital provider assessment.
Without more detailed analysis it is unknown whether or not the reductions in existing state
share of Medicaid cost and increases in revenue through Medicaid expansion will fully offset
the increases in the state share resulting from expanding the number of recipients covered by
Medicaid. But these factors will certainly help defray new costs resulting from expansion.
6.7 Alternatives to Medicaid Expansion
While most states expanding Medicaid (24 of 28) chose to do so by implementing a State Plan
Amendment (SPA), several states pursued alternative models to expansion through 1115
waivers110. The states that have chosen to expand and their method of expansion are shown in
Figure 26.
108 Kaiser Commission on Medicaid and the Uninsured, The Cost of not Expanding Medicaid, (July, 2013). 109 Kaiser Commission on Medicaid and the Uninsured, The Cost of not Expanding Medicaid, (July, 2013). 110 Kaiser Commission on Medicaid and the Uninsured, The ACA and Recent Section 1115 Medicaid Demonstration
Waivers, (November, 2014).
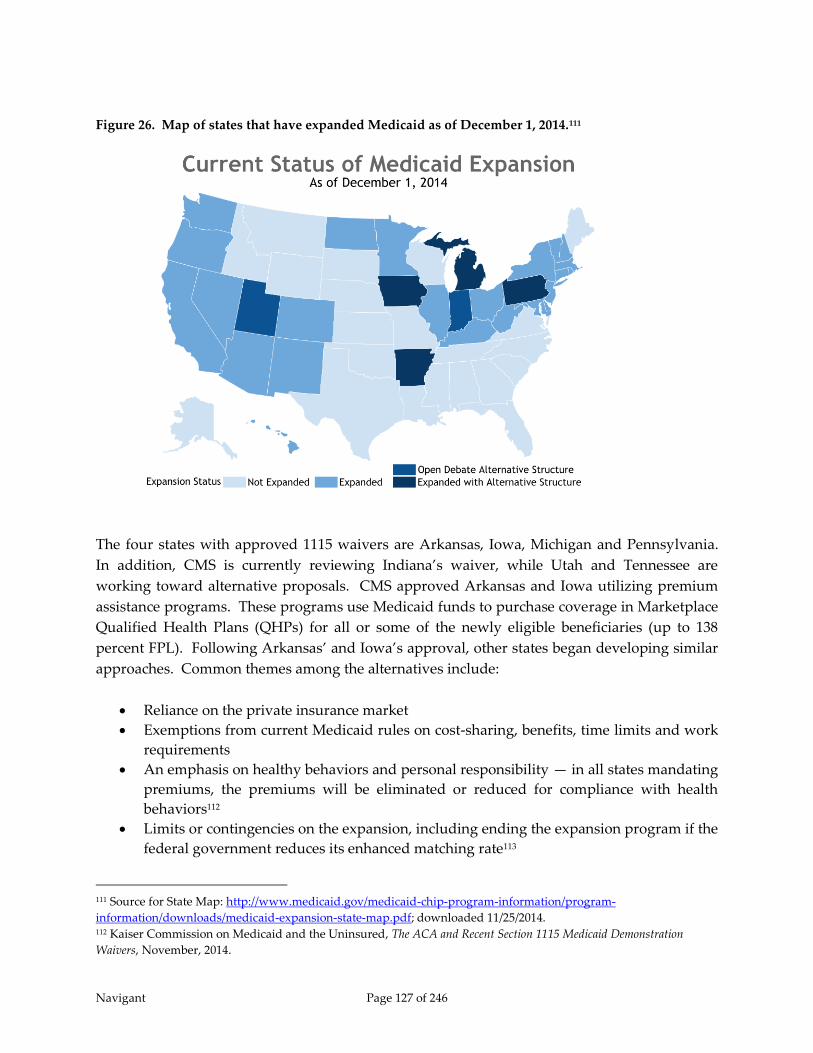
Navigant Page 127 of 246
Figure 26. Map of states that have expanded Medicaid as of December 1, 2014.111
The four states with approved 1115 waivers are Arkansas, Iowa, Michigan and Pennsylvania.
In addition, CMS is currently reviewing Indiana’s waiver, while Utah and Tennessee are
working toward alternative proposals. CMS approved Arkansas and Iowa utilizing premium
assistance programs. These programs use Medicaid funds to purchase coverage in Marketplace
Qualified Health Plans (QHPs) for all or some of the newly eligible beneficiaries (up to 138
percent FPL). Following Arkansas’ and Iowa’s approval, other states began developing similar
approaches. Common themes among the alternatives include:
Reliance on the private insurance market
Exemptions from current Medicaid rules on cost-sharing, benefits, time limits and work
requirements
An emphasis on healthy behaviors and personal responsibility — in all states mandating
premiums, the premiums will be eliminated or reduced for compliance with health
behaviors112
Limits or contingencies on the expansion, including ending the expansion program if the
federal government reduces its enhanced matching rate113
111 Source for State Map: http://www.medicaid.gov/medicaid-chip-program-information/program-
information/downloads/medicaid-expansion-state-map.pdf; downloaded 11/25/2014. 112 Kaiser Commission on Medicaid and the Uninsured, The ACA and Recent Section 1115 Medicaid Demonstration
Waivers, November, 2014.

Navigant Page 128 of 246
“Under the premium assistance approach, states use Medicaid funds to purchase coverage for
some or all newly eligible beneficiaries in Marketplace Qualified Health Plans (QHPs). States
can implement premium assistance programs without a waiver, subject to certain rules.
Arkansas and Iowa received waivers to allow them to mandatorily enroll beneficiaries in
premium assistance. In Arkansas all newly eligible adults, including childless adults between
0-138% FPL and parents between 17-138% FPL, are enrolled in premium assistance. In Iowa,
only newly eligible adults with incomes above 100% up to 138% FPL are enrolled in premium
assistance.”114
When using an 1115 waiver to expand Medicaid, additional options can be chosen as long as the
options are deemed acceptable by CMS. CMS will want to ensure that waivers are used to
“promote the objectives” of the Medicaid program and are budget neutral for the federal
government. In the waivers, these states indicate they are using premium assistance to test how
private coverage works for Medicaid beneficiaries and whether enrolling beneficiaries in
Marketplace coverage will increase provider access and reduce churning between Medicaid and
Marketplace coverage due to income fluctuations. How premium assistance affects continuity
of care, the impact on access to benefits, how well wrap-around coverage will work, how states
will exempt people who are medically frail from their demonstrations, what the impact of
premiums and cost sharing will be, and whether the demonstrations will be cost effective are
key issues to monitor and are included in the evaluation requirements of these waivers. The
various options selected by the four states with currently approved waivers are shown in Table
10.
Table 10. Alternative breaks out provisions from these alternative models.
State
Premium
Assistance
Model
Member Premiums
(101%-138% FPL)
Non-Emergency
Medical
Transportation
(NEMT)
Voluntary work
search program
for Eligibility
Arkansas Yes No In all years No
Iowa Yes Yes ($10/month) Cut in Year 1 No
Michigan No Yes (2% of Income) In all Years Yes
Pennsylvania No Yes (2% of Income) Cut in Year 1 No
In the three states charging premiums to recipients, Iowa, Michigan, and Pennsylvania,
“premiums will not be imposed immediately. Iowa waives premiums in the first year of its
demonstration. Under Michigan’s waiver, premiums were not to be imposed for at least six
months after implementation of its expansion, and Pennsylvania’s waiver calls for premiums
beginning in year 2. All three states would also allow individuals to have premiums waived or
113 Center for Health Care Strategies, Inc., Alternative Medicaid Expansion Models: Exploring State Options, (February,
2014). 114 Kaiser Commission on Medicaid and the Uninsured, The ACA and Recent Section 1115 Medicaid Demonstration
Waivers, (November, 2014).

Navigant Page 129 of 246
reduced based on compliance with healthy behavior incentives. In Iowa, healthy behavior
incentives in year 1 include completing a health risk assessment and obtaining a wellness
examination. In addition, beneficiaries in Iowa have a 90 day grace period to pay past-due
premiums in full before termination of Medicaid coverage, and the state must waive premiums
for beneficiaries who self-attest to financial hardship in paying the premiums. The Michigan
waiver terms and conditions specify that individuals may not lose coverage for failure to pay
premiums (or other copayments). In Pennsylvania, there is a 90-day grace period before
disenrollment for failure to pay premiums, and beneficiaries may re-enroll without a waiting
period.”115, 116
The post-ACA health care landscape makes the establishment of large-scale premium assistance
programs a more affordable and realistic option for states for several reasons. First, state
Medicaid programs have access to a significant influx of new funding: the federal government
will pay 100 percent of the cost of expanding Medicaid between 2014 and 2016, and slowly
reducing down to 90 percent thereafter. Second, the newly operational health insurance
Marketplaces provide the infrastructure necessary to cover large numbers of beneficiaries in
non-employer-based plans. The creation of Marketplaces are especially significant for states
like Arkansas that lack a strong Medicaid managed care presence, as these states previously had
no public or private plans available to cover Medicaid beneficiaries in a cohesive, organized
fashion. Finally, Marketplace plans may cost less than many pre-ACA private options thanks to
greater consumer purchasing power, more plan competition, and narrower networks.117
Each state must take into account all considerations, before deciding to pursue a premium
assistance program approval from CMS. The anticipated benefits and downsides of expansion
through premium assistance include:
Reduced Churn – Research suggests that of the estimated 96 million Americans eligible to
receive Medicaid or Marketplace subsidies during a given year, up to 29 million are
likely to “churn” between coverage options, and seven million are likely to experience
coverage shifts between Medicaid and Marketplace policies. Theoretically, if Medicaid-
eligible individuals are enrolled in Marketplace QHPs instead of traditional Medicaid
and their incomes rise above the Medicaid eligibility ceiling, they can stay in private
coverage rather switch insurance plans and/or providers, resulting in better continuity
of care. The states expanding through QHPs stated they will monitor this issue through
their waiver.
115 Kaiser Commission on Medicaid and the Uninsured, The ACA and Recent Section 1115 Medicaid Demonstration
Waivers, (November, 2014). 116 The Pennsylvania expansion is currently scheduled to go into effect on January 1, 2015, but the newly elected
governor may opt to implement a straight-forward expansion via a state plan change instead of the waiver. 117 Kaiser Commission on Medicaid and the Uninsured, The ACA and Recent Section 1115 Medicaid Demonstration
Waivers, (November, 2014).

Navigant Page 130 of 246
Better Access to Providers – Individuals enrolled in private commercial plans may have
better access to health care than traditional Medicaid beneficiaries, as more providers
accept commercial insurance than Medicaid.
Higher Overall Cost – Medicaid is almost always cheaper than private plans, so any
proposal to cover individuals via private coverage instead of Medicaid should have a
higher immediate price tag. In 2012, the Congressional Budget Office estimated that by
2022, the average person who enrolled in a marketplace plan instead of Medicaid would
cost the federal government about $3,000 more ($9,000 vs. $6,000). Milliman estimated
premium assistance programs to cost 20 percent to 40 percent more than traditional
Medicaid programs, though the amount depends on a state’s provider reimbursement
rates.118
Premium assistance is not the only model states are pursuing to expand Medicaid. Michigan,
for example, will enroll its expansion population in public plans, but plans to require
beneficiaries to deposit money into health accounts to actively participate in paying for their
care, similar to a model used by Indiana. It is also working to create incentives for healthier
behaviors among beneficiaries.
6.8 Medicaid Expansion Conclusion
Because of the 2012 U.S. Supreme Court ruling, Florida is now in the position to make the best
decision for the citizens of their own state, without any financial consequences from the Federal
government. The State must carefully examine the possible advantages and repercussions from
this important policy decision and determine the right course of action. Estimating the impact
of Medicaid expansion in any state is not an exact science; a variety of assumptions must be
made. With that said, by the Florida SSEC’s estimates, Medicaid expansion would have a
steady-state cost of just under $1 billion per year in additional non-federal funds when the
FMAP drops to 90 percent. For that additional cost, Florida would receive approximately $7.8
billion in additional federal funds annually.119 Of course, if the federal government drops the
FMAP percentage below 90 percent, the costs of Medicaid expansion to the state of Florida
would increase above this estimate.
Medicaid expansion would likely benefit hospitals in Florida, many of which are required to
treat uninsured patients. In fact, some hospitals treat a significant number of uninsured
patients, particularly in emergency departments. The ACA offers increases in hospital revenue
through expanded Medicaid eligibility and new subsidies to help low and moderate income
households buy coverage through health insurance exchanges. Accompanying this are planned
118 Center for Health Care Strategies, Inc., Alternative Medicaid Expansion Models: Exploring State Options, (February,
2014). 119 Retrieved from a presentation from the Florida Agency for Healthcare Administration (AHCA), available at
http://edr.state.fl.us/Content/conferences/medicaid/FederalAffordableHealthCareActEstimates.pdf, (March, 2013).

Navigant Page 131 of 246
reductions in Medicaid and Medicare DSH funding as well as a reduction on Medicare hospital
fee-for-service payments through reductions or removals of planned future increases.120
Finally, if Medicaid expansion is to be implemented there may be options as to how it can be
implemented. A standard implementation enrolls the uninsured below 138 percent of the FPL
into Medicaid. In addition, CMS has approved a few other implementations, some of which
include offering premium assistance to help low income individuals and families buy
commercial insurance through the Marketplace. These premium assistance programs may
include other stipulations such as healthy behavior incentives, flexible spending accounts, and
other tools designed to increase recipient impact in the costs of health care.
The decision whether to pull down billions of dollars from the Federal government to extend
coverage to potentially over a million people or to continue searching for alternative approaches
to extend affordable coverage to the uninsured rather than expand Medicaid, the answer is not
simple, and Florida must take into account the various advantages and disadvantages of all
options.
120 Urban Institute, The Financial Benefit to Hospitals from State Expansion of Medicaid. (March, 2013)

Navigant Page 132 of 246
7 Delivery System Reform Incentive Payment Programs
7.1 Introduction
As stated previously, states that migrate from fee-for-service to managed care models have
limited options for continuing to offer supplemental payments to providers. Although it
should not be considered as a substitute for the LIP program, one option that has been
approved in recent years is a Delivery System Reform Incentive Payment (DSRIP) program.
DSRIP programs are available to states through an 1115 demonstration waiver to incentivize
health delivery system transformation. DSRIP programs allow states to make incentive
payments that are linked to performance-based incentive initiatives, or “projects,” aimed at
improving health care processes and clinical outcomes, or otherwise transforming health service
delivery. Generally, progress on these projects is tracked and payments are adjusted based on
providers’ successes in meeting agreed-upon milestones. The overarching goal of state DSRIP
initiatives is transformation of the Medicaid payment and delivery system in an effort to
achieve measureable improvements in quality of care and overall population health.
DSRIP programs are not intended to be mechanisms to distribute funds to cover services
provided to low income populations, as is the case with the current Florida LIP and DSH
programs. At the same time, it may be an option for replacing the aggregate funding that is at
risk in the event that LIP is discontinued. The key difference would be that incentive payments
paid to providers under a DSRIP program would be dependent upon measured successes
against predetermined measurable objectives specifically related to improving quality of care
and overall population health, in support of the overall objectives of a Medicaid program.
Establishing incentive payments around treating higher volumes of uninsured patients would
not meet that criteria, nor would a provider’s ability to fund the non-federal share of payments.
Further, where Florida’s LIP program focuses primarily on payments to hospitals, DSRIP
programs are required to focus on health delivery system transformation, of which hospitals
play only a part. The focus of a DSRIP program is much broader than that of a LIP or DSH
program.
To date, all DSRIP programs have been approved as a component of a larger Medicaid 1115
demonstration waiver. CMS has approved several DSRIP programs that fall within a common
framework, however allows flexibility for states to construct their own individual programs by
accepting various unique design elements. As of September 2014, six states have approved
DSRIP programs and several more states are in the process of applying for approval. The first
DSRIP initiatives were approved and implemented in California and Texas in 2010 and 2011,
followed by New Jersey, Kansas, and Massachusetts in 2012 and 2013 and most recently New
York which was approved in 2014 and will be implemented in 2015.121 Alabama, Illinois, and
New Hampshire all are in various stages of developing DSRIP waivers. In addition, New
121 Kaiser Commission on Medicaid and Uninsured, “An Overview of Delivery System Reform Incentive Payment
(DSRIP) Waivers,” (October 2014).

Navigant Page 133 of 246
Mexico, Oregon, and Florida (the LIP waiver) operate initiatives that share key elements of
DSRIP waivers.
The amount of Medicaid funding available to support DSRIP initiatives varies considerably
across states, and can be substantial. For example, California, New York and Texas each expect
to make several billion dollars in payments (over $6 billion in California and New York and
more than $11 billion in Texas) for their DSRIP initiatives over a five-year period (though the
time period varies across states). Kansas, Massachusetts, and New Jersey have smaller DSRIP
initiatives with less spending.
7.2 Background on 1115 Demonstration Waivers
Section 1115 Medicaid demonstration waivers provide states with an avenue to test new
approaches in Medicaid that differ from federal program rules. These waivers are intended to
allow for “experimental, pilot, or demonstration projects” that, in the view of the HHS
Secretary, “promote the objectives” of the Medicaid program. Section 1115 demonstration
waivers have historically been used for a variety of purposes, including expanding coverage to
populations who were not otherwise eligible, changing benefits packages, and instituting
delivery system reforms. There is long-standing policy that requires 1115 Waivers to be budget
neutral for federal spending meaning the federal government will not spend more with the
waiver than if the waiver were not in place. Setting waiver policies and budget neutrality
typically involve significant negotiations between the states and the federal government.122
7.3 Key Components of DSRIP Programs
In general, DSRIP programs are designed to advance CMS’s “Triple Aim” of improving the
health of the population, enhancing the experience and outcomes of the patient and reducing
the per capita cost of care. There is no official federal guidance regarding what qualifies as a
DSRIP program; instead states review the most recently approved DSRIP programs to
understand current CMS thinking and requirements. The health care environment varies from
state to state and DSRIP is designed to transform the health care environment. As a result,
implementation of several key design elements varies between states to best address health care
needs in the specific state. Key design elements discussed in the following sections include,
eligible providers, projects and organizations, and financing.
7.3.1 Eligible Providers
The number of providers receiving DSRIP funding varies across states. For example, all acute
care hospitals in New Jersey are eligible, resulting in 63 providers participating and eligible to
receive funds. In California, 21 designated public hospitals in 17 hospital systems are eligible,
while 7 hospitals in Massachusetts and only 2 hospitals in Kansas can participate in DSRIP
programs. DSRIP waivers in Texas and New York require that funds be used for a broader set
122 The Kaiser Commission on Medicaid and the Uninsured, An Overview of Delivery System Reform Incentive Payment
(DSRIP) Waivers, (October 2014).
Navigant Page 134 of 246
of providers, and these states are using their DSRIP waivers to promote collaborative provider
networks that consist of an anchor hospital, associated clinics, and other providers or entities.
The Texas and New York DSRIP programs require providers to form partnerships and apply
for DSRIP projects together. The two states differ slightly in this approach in that Texas takes a
prescriptive approach by establishing 20 Regional Health Partnerships (RHPs) that interested
providers may join. Each RHP is led by a public hospital or local governmental entity – such as
a county or district hospital – that is responsible for funding the state match in partnership with
regional health care providers. The larger provider network, however, can include community
health centers, county health departments, and other non-hospital providers. New York allows
the providers to establish their own partnerships based around a lead hospital, which is usually
a public hospital that contributes the State’s share of funding through an IGT. With both
approaches, hospitals and other providers are challenged to connect beyond their walls to foster
improved patient outcomes.
Specifically for hospitals, eligibility to participate in a DSRIP program generally requires
meeting standards for serving a certain proportion of Medicaid and uninsured populations. In
many states, hospitals with larger Medicaid/uninsured populations are eligible to receive higher
funding allocations so that transformation is targeted to these populations. This is consistent
with CMS’ objective that DSRIP programs will help to transform health care for the entire
population, and as such, targeting providers that serve a high number of Medicaid beneficiaries
will serve to better measure the potential benefits of selected DSRIP projects. In addition, a state
may require a hospital to contribute IGTs as a condition of receiving DSRIP funds, as is the case
in California.
7.3.2 Projects and Organization
Each state’s pre-approved projects are meant to drive overall health system transformation
consistent with the CMS triple aim. In addition, states designing DSRIP programs are required
by CMS to perform data analysis to identify areas of greatest need and develop projects to meet
those needs. DSRIP projects primarily fall into four categories (although the terminology differs
across states): process redesign, system redesign, clinical outcome improvements, and
population health focused improvements. In general, DSRIP programs are set up to focus on
achieving metrics and milestones in infrastructure and system redesign (more process oriented
changes) in the earlier years of the waiver and then focus shifts toward reaching clinical and
population health focused metrics and milestones (more outcome based measures) in the later
years of the waiver. Innovative care models that are piloted, tested, and proved successful can
be replicated across the state and potentially to other states.
7.3.2.1 Process and System Redesign Projects
Process improvement projects lay the foundation for delivery system transformation through
investments in tools and human resources that will strengthen the ability of providers to serve
populations and continuously improve services. System redesign projects focus on fostering
new and innovative models of care delivery that expand access and improve quality.

Navigant Page 135 of 246
For example, process improvement projects can focus on any of the following:
Developing training for the primary care workforce
Introducing telemedicine
Implementing disease management or chronic care management registries/systems
Enhancing interpretation services and culturally competent care (including the
collection of accurate Race, Ethnicity and Language (REAL) data)123
Example system redesign projects include the following:
Redesigning primary care models and expanding medical homes
Establishing patient navigation programs
Expanding chronic care management models and medication management programs
Integrating physical and behavioral health care
Creating integrated delivery systems124
The New York DSRIP Planning Protocol is the most recent protocol that was approved, so the
program offers a window into CMS’s current DSRIP strategy. Examples of New York’s systems
transformation projects include:
• Create a medical village using existing hospital infrastructure
• Develop co-located primary care services in the emergency department
• Create care transitions intervention for skilled nursing facility residents
• Develop community-based health navigation services
7.3.2.2 Clinical Care and Population Health Improvement Projects
Clinical care improvements and population health focused improvements are tied to
measurable outcomes and metrics to address patient care and safety, and improvements in
overall health. Some states specify areas for clinical and population health improvement, while
others allow providers flexibility to determine the key areas for improvement. Generally, over
the course of a state’s DSRIP initiative, funding allocations for meeting milestones related to
clinical care and population health receive higher levels of funding than process related
improvements.
Example clinical care improvement metrics tracked under the California DSRIP program
include the following:
Rate of sepsis detection
Effectiveness of stroke management techniques
123 The Kaiser Commission on Medicaid and the Uninsured, An Overview of Delivery System Reform Incentive Payment
(DSRIP) Waivers, (October 2014). 124 Ibid.

Navigant Page 136 of 246
Prevention of Central Line-Associated Bloodstream Infection (CLABSI).
In addition to these standardized requirements, each participating hospital in California must
also select and report on their progress in improving outcomes for high burden conditions such
as HIV/AIDS and asthma.125 Note, however, that California had the first approved DSRIP
program. They are in the process of negotiating a waiver renewal that may include a redesign
of their DSRIP program.
As another example, each DSRIP project in New Jersey has defined outcome measures that are
similar across projects, such as:
Reduced admissions
Reduced emergency department visits
Improvements in care processes
Increases in patient satisfaction
Each project will have specific objectives which are primarily measured using nationally
standardized metrics126. For example, specific metrics for the project to improve cardiac care by
reducing 30-day readmissions requires reporting and progress on several NCQA measures,
such as controlling high blood pressure and compliance with post-discharge appointments.127
In the New York DSRIP program, the clinical care and population health improvement projects
include:
Clinical Improvement Projects
o Integrate primary care and behavioral health services
o Develop evidence-based strategies for disease management in high risk populations
o Expand asthma home-based self-management program
o Increase support programs for maternal and child health (including high-risk
pregnancies)
• Population-wide Projects: New York’s Prevention Agenda
o Prevent Substance Abuse and other Mental Emotional Behavioral Disorders
o Increase access to high quality chronic disease preventive care and management
o Increase early access to, and retention in, HIV care
o Reduce premature births
125 The Kaiser Commission on Medicaid and the Uninsured, An Overview of Delivery System Reform Incentive Payment
(DSRIP) Waivers, (October 2014). 126 Such metrics may be those established by entities such as the National Committee for Quality Assurance (NCQA),
the American Medical Association (AMA) Primary Care Incentive Program (PCIP), the Joint Commission, the
Agency for Healthcare Research and Quality (AHRQ), CMS, or the Health Resources and Services Administration
(HRSA). 127 The Kaiser Commission on Medicaid and the Uninsured, An Overview of Delivery System Reform Incentive Payment
(DSRIP) Waivers, (October 2014).

Navigant Page 137 of 246
7.3.2.3 Statewide DSRIP Metrics
CMS has not released specific guidance for states regarding requirements for DSRIP programs.
However, more recent waiver approvals point to certain trends such as the need for more
accountability and involvement of a broader set of providers. To that point, New York has a
design feature that ties total DSRIP funding for the entire state to statewide performance. In
addition to the metrics and milestones applicable to each Performing Provider System (PPS)
project, New York must meet statewide performance goals and targets to obtain full DSRIP
funding. Failure to achieve these goals and targets will result in the withholding of some DSRIP
funds beginning in year three of the demonstration. We anticipate that CMS would require
some form of statewide accountability in future DSRIP programs.
7.3.3 Financing
States remain obligated to pay for their share of the cost of DSRIP initiatives under Medicaid
financing requirements. As such, they must identify a source of state dollars that can be used to
“match” federal funding. The majority of states with DSRIP programs use IGTs to fund the
state share. A few states use general revenue to draw down federal dollars or use a
combination of IGTs and general revenue. To satisfy budget neutrality requirements, some
states are redirecting federal Medicaid funds that they would have spent on supplemental
payments to hospitals toward new delivery system reform payments. These supplemental
payments can include DSH payments or UPL payments. In the case of Florida, funds currently
going into the LIP program could be made available to fund a DSRIP program if the LIP
program were discontinued. However, in order to ensure IGT funding contributions are
continued by the contributing entities, the DSRIP projects would likely need to be defined in
ways that primarily gave access to DSRIP projects to those hospitals for which IGTs were
contributed. It should be noted, however, that all financing arrangements must be approved by
CMS, and a financing arrangement that directs DSRIP dollars primarily to hospitals does not
appear to be in line with CMS’ desire to involve a broader range of providers in delivery system
transformation. Further, approval of a financing arrangement for an existing DSRIP program in
another state is no guarantee that CMS will approve similar financing approach for a new
DSRIP program.
As discussed previously, one of the requirements of an 1115 demonstration waiver is budget
neutrality. Specifically in the context of DSRIP waivers, it can be challenging to demonstrate
budget neutrality. The cost of making payments to hospitals and other providers for broad-
based delivery system reform is not an expense that the federal government would match in the
absence of the waiver. As a result, states must demonstrate that their waiver will generate
“savings” (i.e., a return on investment, reducing the federal cost of operating Medicaid relative
to the “without waiver” cost). They can then “tap” the expected savings and repurpose them
for new investments in delivery system reform.

Navigant Page 138 of 246
7.4 Challenges with DSRIP Programs
DSRIP programs offer some significant opportunities to state Medicaid agencies, but they also
generate some challenges. On the positive side, DSRIP programs offer a way to maintain IGT-
funded payments (which would be in the form of incentive payments) to flow to hospitals even
after making significant transitions from FFS to managed care models. In addition, DSRIPs
hold the promise of improving the health of the population, enhancing the experience and
outcome of the patient, and reducing the per capita cost of care for Medicaid and uninsured
patients and potentially offer the same benefits to patients with any other type of insurance.
However, these benefits come at a cost. DSRIP programs can be large and complex, and often
require substantial ongoing operational support. They also take a considerable amount of time
to define and implement. In addition, “it is important to note that the future of this program
remains uncertain as CMS has not provided guidance on DSRIPs, nor have they indicated how
many Section 1115 waiver demonstrations they will permit to include a DSRIP.”128 The
potential for these programs to be short-lived makes the decision to implement a DSRIP
program extremely unclear, particularly when considering the fact that these programs are
taking multiple years to define and implement, and require significant effort to monitor.
In the sections that follow, we examine three primary challenges, complexity involved in
defining program requirements, implementation time, and administrative complexity. In these
sections, we offer anecdotal notes that we observed from the discussions during two conference
calls held by the National Association of Medicaid Directors (NAMD) on July 10, 2014 and
September 16, 2014. The primary topic of these calls was DSRIP programs.
7.4.1 Dynamic DSRIP Requirements
CMS has not established formal DSRIP guidance, so the requirements may change in each state.
State officials should be prepared for new or shifting requirements that build upon the
experience of other DSRIP programs and increase the accountability for both the state and its
providers.
The following anecdotal comments were mentioned in recent NAMD conference calls related to
shifting requirements. Also included are anecdotes offered by Medi-Cal administrators during
an interview with Navigant Healthcare consultants working on defining a DSRIP program in
Alabama:
• Medi-Cal personnel indicated that it takes significant infrastructure in the ramp-up
phase. Medi-Cal had to increase its in-house, and academic / private sector capacity.
DSRIP is not easy to understand and needs a particularly skilled team especially during
the evaluation phase. They also reported that CMS required a rigorous midyear
assessment in the first year approval, which took a “grueling” 18 months.
128 National Association of Medicaid Directors (NAMD), Issue Brief – Medicaid Innovation: Delivery System Reform
Incentive Pools, (June 2014).
Navigant Page 139 of 246
• New Jersey reported needing two years overall to obtain approval for their DSRIP
program, including eight months just to define DSRIP protocols. It should be noted that
those protocols have already required revision. New Jersey Medicaid held over 100 calls
with CMS during the definition of the protocols.
7.4.2 Lengthy Implementation Time
“States should anticipate a long runway from conceptualization to implementation. This can be
a multi-year process and will encompass numerous negotiations since federal officials must
approve nearly all facets of the program, including every provider’s projects.”129 The time from
conceptualization to implementation is commonly between 18 months and 2 years. For Florida,
this means a DSRIP program is not likely to be an option for SFY 2015/16 and quite possibly not
an option for SFY 2016/17. Florida’s current 1115 waiver expires at the end of SFY 2016/17. So a
DSRIP program, if chosen as a good option for Florida, might, realistically, be implemented
with the next renewal of the 1115 waiver.
The following anecdotal comments were mentioned in recent NAMD member update
conference calls130 related to implementation time and effort:
• New York required two years to negotiate DSRIP program definition with CMS. There
was a lot of time spent discussing funding which ended up being a mix of Designated
State Health Programs (DSHP) and IGT. There were many false starts. New York
Medicaid had to redeploy resources to keep the DSRIP design process moving.
• Texas reported it generally took six months to approve projects. They also reported that
determination and calculation of pay for performance outcomes is difficult given their
inclusion of a broad spectrum of providers. Similarly, valuation of projects has been
challenging given the mix of providers. Getting to a menu of outcomes took until the
middle of demonstration year 3 and still did not offer a clean tie between project goals
and metrics.
• New Jersey reported that the application process often took more than three months.
Some hospitals required up to 15 revisions to their application. No application was
approved without at least one revision. This is despite New Jersey Medicaid holding
face-to-face meetings with all 55 hospitals who submitted applications. New Jersey
reported the cost of implementing DSRIP turned out to be three times greater than initial
estimates.
129 Navigant Consulting, Center for Healthcare Research and Policy Analysis, John Colleran and Paul Keckley. “Pulse
Alert: The Delivery System Reform Incentive Payment (DSRIP) Program.”. (November 6, 2014). Available at:
http://www.naviganthrp.com/wp-content/uploads/2014/11/FINAL-HC_DSRIPPulseAlert_NSL_1014.pdf 130 The NAMD member update conference calls referenced here occurred on July 10, 2014 and September 16, 2014.

Navigant Page 140 of 246
7.4.3 Administrative Complexity
“DSRIP programs have stringent reporting and evaluation requirements that necessitate
diligent oversight by state officials. Complicating matters is the middleman role that states
play, being the conduit for information and financial exchanges between the federal
government and providers. Due to this complexity, states must identify staff resources to aid in
design, implementation and ongoing administration of DSRIP programs.”131
The following anecdotal comments were mentioned in recent NAMD conference calls related to
administrative complexity:
• California reported having between 10 and 12 state staff along with three or four
consultants monitoring the program.
• Texas has over 300 providers and 1,500 projects to monitor. Texas has 20 state staff
working on DSRIP and is gradually increasing staff. In addition, Texas uses five
external firms to help monitor the program.
• New Jersey has three state staff and 14 consultants involved in monitoring the program.
• New York reported having three state staff currently monitoring the program with a
plan to get up to 15 state staff. In addition, they rely on between 80 and 90 external
consultants.
7.5 Comparison of LIP and DSRIP
7.5.1 LIP Demonstration Years 1 Through 5
The goal of the LIP program is to provide government support for safety net hospitals that
furnish health care to the Medicaid, underinsured and uninsured populations. Like DSRIP
programs, the LIP program allows for IGT-funded payments to be made to providers even with
Florida Medicaid’s migration from FFS to managed care models, although the intent of such
payments are significantly different, the values of such payments would vary significantly, and
the DSRIP incentive payments are more strictly conditioned on the achievement of specific,
measurable milestones and outcomes tied to overall Medicaid transformation objectives. Also
like many DSRIP programs, the LIP program allows for funding to hospitals and non-hospital
provider types. In particular, the LIP program allows for payments to Provider Access Systems
(PASs), which may include hospital and non-hospital providers such as County Health
Departments (CHDs) and Federally Qualified Health Centers (FQHCs). In its first year of
131 Navigant Consulting, Center for Healthcare Research and Policy Analysis, John Colleran and Paul Keckley. “Pulse
Alert: The Delivery System Reform Incentive Payment (DSRIP) Program,” (November 6, 2014). Available at:
http://www.naviganthrp.com/wp-content/uploads/2014/11/FINAL-HC_DSRIPPulseAlert_NSL_1014.pdf
Navigant Page 141 of 246
implementation, SFY 2006/07, the LIP program expanded the list of providers receiving
supplemental funding as compared to the prior year’s UPL program (SFY 2005/06).132
There were 206 PASs that received payments through the LIP program as opposed to 87
hospital providers that received payments through the UPL payments for the previous
year.
The LIP program allowed for 43 non-hospital providers to participate that were not
eligible for payments under the UPL.
In demonstration years 1-3, also similar to DSRIP programs, PASs were required to complete
milestones that required the reporting of specific metrics in order to receive the $1 billion in
allotted funds. The reports were intended to give AHCA an ability to determine the cost-
effectiveness of PASs. These metrics included:133
Unduplicated count of individuals served (separated by Inpatient, Outpatient, and
Total)
Hospital discharges
Case mix index
Hospital inpatient days
Hospital emergency department encounters
Other related measures
7.5.2 LIP Demonstration Years 6 Through 8
In demonstration years 6-8, which were included in the first waiver renewal, the LIP program
evolved to be even more like a DSRIP program. CMS’s Special Terms and Conditions in the
2011 renewal implemented two tiers of milestones that had to be met for the State and providers
to have access to 100 percent of the annual LIP funding. The STCs stated,
“The LIP is also designed to establish new, or enhance existing, innovative programs
that meaningfully enhance the quality of care and the health of low income populations.
Initiatives must broadly drive from the three overarching goals of CMS’ Three-Part Aim
as described in paragraph 61(a).”134
As described in STC 61, Tier – One Milestone allocated $50 million, of which $35 million was
designated to support primary care initiatives ($20 million dedicated to the start-up of new
primary care initiatives and the remaining $15 million designated to enhance existing primary
132 University of Florida Department of Health Services Research Management and Policy, Summary Report on Section
1115 Waiver Process, (July 2006). 133 Florida Agency for Health Care Administration, Florida 1115 Research and Demonstration Waiver Extension Request,
(2010). 134 Centers for Medicare and Medicaid Services, Special Terms and Conditions for Florida Medicaid Reform Section 1115
Demonstration, Document number 11-W-00206/4, STC number 51, (December 2011).
Navigant Page 142 of 246
care programs). The remaining $15 million in Tier – One Milestone funding fell under the
Special LIP Provider Access System category. This $15 million was distributed to hospitals
based on the hospitals meeting Quality Measures collected by AHCA and Core Measures
collected by CMS. As described in STC 62, Tier – Two Milestone mandated that the top 15
hospitals in terms of largest allocation of LIP funds each propose three initiatives that follow the
guidelines of the Three-Part Aim. These hospitals had to implement new, or enhance existing,
health care initiatives, investments, or activities with the goal of meaningfully improving the
quality of care and the health of populations served. The three initiatives focused on:
infrastructure development; innovation and redesign; and population-focused improvement.
The 2011 STCs did not allocate a specific amount of money for Tier – Two Milestones. Instead,
the STCs stated that 3.5 percent of the LIP funds allocated to each of these hospitals are at risk
pending evidence of progress or completion of each pre-defined milestone.
Again, similar to DSRIP programs, approval by CMS of each milestone plan was required for
the participating hospitals to receive associated LIP funds in Demonstration Year (DY) 6. In DY
7 and DY 8, participating hospitals submitted to AHCA quarterly reports describing and
measuring progress on the initiatives.
Where the LIP program may have fallen short of DSRIP programs was in the monitoring of the
milestone reports during DY 7 and DY 8. The monitoring was relatively light; hospitals were
given credit for reaching a milestone simply by submitting a report. Very little review was
performed to ensure hospitals reached outcome targets defined in their milestone plans. In
contrast, DSRIP programs are designed to only distribute incentives to providers when they
meet specific, measurable milestones and outcome targets that are aligned with a State’s
Medicaid transformation objectives. To date, no hospital has been refused payment of LIP
funds for failure to reach target milestones. AHCA maintains the LIP program primarily with
two full time resources. That low level of manpower is insufficient to enable detailed review of
hospital performance against milestones.
7.5.3 AHCA Proposal for LIP Demonstration Years 9 Through 11
In November 2013, AHCA submitted a proposal to CMS to redesign its LIP program into a
“System Access and Transformation Incentive Fund (Incentive Fund)” funded at $4.5 billion
annually for three years. The proposed Incentive Fund, financed by voluntary IGTs, would be
used to support various safety net providers and have two primary components: a Quality
Enhancement Pool and System Transformation Awards. Starting in DY 9, the Quality
Enhancement Pool would constitute 85 percent of the funding, and then decrease to 70 and 60
percent over the next two demonstration years, with the System Transformation Awards
accounting for the remaining funds each year. This proposal was subsequently denied by CMS.
The basic design elements of the program are as follows:
The Quality Enhancement Pool was to be targeted toward providers that have
consistently participated heavily in serving Medicaid and low-income populations. In
order to receive funds from this pool, providers would have to participate in certain
Navigant Page 143 of 246
activities that would further federal and state health delivery system goals, such as
successful contracting with Medicaid managed care organizations and participation in
Event Notification Service activities135. Funding methodologies would have considered
the challenges faced by providers that serve predominantly low-income populations and
the linkage with local funding sources. This would have reflected the principle that
providers in a local area should not receive less than if they were to receive the funding
directly from their local governments.
System Transformation Awards would have been designed to support and reward
collaborative projects that address particular aspects of service delivery that affect
Medicaid recipients and other low-income Floridians. This funding would be balanced
between up front funding and outcome-based incentives. These projects would be
focused around areas such as improving timeliness and appropriate setting for care,
preventing potentially preventable events, or improving birth outcomes.
In addition, a portion of the Incentive Fund would have been allocated to funding an
annual evaluation. The evaluation would have included process measures for looking at
the activities/improvements/interventions that are being put into place and the outcome
measures to see if the process/infrastructure changes resulted in improved outcomes.
This would have allowed the State to identify which projects were resulting in real
improvement.
In the end, CMS rejected this plan and approved a waiver renewal that includes three years for
the managed care portion, but only one year for the LIP program, from July 1, 2014 through
June 30, 2015. “During the one-year extension for the LIP, expenditures are authorized to
provide stability for providers, for a limited time during Florida’s transition to statewide
Medicaid managed care and a significantly reformed Medicaid payment system.”136 Collection
of the quarterly reports will continue in DY 9 for Tier – One Milestones, but not for Tier – Two
Milestones. The Tier - Two Milestones are no longer tied to disbursement of LIP funds as they
were not included in the 2014 STCs.
7.6 DSRIP Conclusion
DSRIP has developed into a way for states to incentivize the transformation from “volume to
value” in their health systems. DSRIPs have also proven, at least temporarily, to be an
acceptable mechanism to provide incentive payments to hospitals and other types of providers
outside of the limitations of the FFS UPL, even after a significant transition to a Medicaid
managed care model. As traditional supplemental funding amounts are increasingly
135 The Event Notification Service (ENS) provides health plans with timely notifications about their members’ hospital
encounters. Information about a member’s visit (including demographic information, information on the source
facility, and primary complaint) securely sent the plans preferred method and schedule. This service offers the
opportunity for health plans to better engage in care coordination and ensure proper follow-up care is received. 136 Centers for Medicare and Medicaid Services, Special Terms and Conditions for Florida Medicaid Reform Section 1115
Demonstration, Document number 11-W-00206/4. (July 2014)

Navigant Page 144 of 246
scrutinized, DSRIP allows states to use those funds as incentives for providers to embrace
CMS’s triple aim of pursuing better care for individuals, better health for the population, and
lower health care related costs through improvements in service delivery. While each state’s
DSRIP program may vary, generally providers are rewarded for meeting designated milestones
and achieving improved clinical outcomes that ultimately improve population health. Only
those participating providers that achieve measureable process and outcome milestones receive
the financial incentive. CMS is looking to see return on investment for the federal funds
provided to state Medicaid agencies, particularly for programs like DSRIP, that are approved as
part of an 1115 demonstration waiver.
Conceptually, there are tremendous potential benefits to DSRIP programs. DSRIP programs
have potential to improve coordination of care across various provider types, fund
development of new and innovative ways to treat chronic health conditions, spur other
innovations that improve overall population health, and reduce per capita health care costs.
However, from a practical point of view, these programs tend to be extremely complex and
require a tremendous amount of operational support from providers, the Medicaid agency, and
CMS. However, even with this uncertainty, and the time and cost required to ramp up a DSRIP
program, such a program may represent a significant opportunity to not only support the
providers of Florida to achieve system transformation through incentives, but to improve the
overall health and wellbeing of all Floridians.

Navigant Page 145 of 246
8 Survey of Other Medicaid Programs
8.1 Introduction
In this section of the report, we discuss Navigant’s surveys of other states’ payment methods
and funding sources. Our objective for these survey efforts was to identify and analyze other
States’ Medicaid programs that have a proven history of effectively managing the Medicaid
program through innovative funding practices, and gain better understanding of options based
on their experiences.
8.1.1 Purpose of Survey
The purpose of these surveys was to gain a better understanding of how other State Medicaid
programs are funding and paying hospital providers for inpatient and outpatient hospital
services, whether through fee-for-service (FFS) programs, Medicaid managed care (or capitated)
programs, and through other funding streams that are outside of traditional FFS or capitation
payments, such as supplemental or UPL payments and DSH payments, including those that are
performance based. We also endeavored to understand the funding sources for all payments –
specifically how the states generated the funds necessary to fulfill the states’ shares of the
funding obligations under the FFP funding regulations. In particular, we reviewed use of state
general revenue, IGTs, CPEs, and provider assessments. Finally, it was our objective to better
understand if and how each of these payment and funding streams have been operationalized
and maintained in states that have made a commitment to transitioning a significant portion of
their Medicaid-eligible populations to capitated Medicaid managed care models.
Ultimately, the goal of this survey process was to identify options for consideration in Florida,
as potential replacements for the current Florida LIP program.
8.1.2 State characteristics reviewed (specifically reviewing and why relevant)
In our survey of other state Medicaid programs, Navigant established goals based on the
Proviso passed by the Florida State Legislature and Terms and Conditions set by CMS during
the waiver application. The goals are listed below:
States that have a significantly large number of Medicaid eligibles
States that have not chosen to expand under ACA
States that have chosen to expand under ACA
States that have converted a large portion or virtually all of their eligible
population to a managed care environment or are in the process doing so
States that have found ways to distribute payments successfully outside of the
traditional managed care capitation fees or traditional FFS
States that have implemented a premium assistance program for the expansion
eligible categories under the ACA
States that have implemented a DSRIP program
States where we could readily obtain the necessary comparison information

Navigant Page 146 of 246
With goals set, Navigant chose nine states to survey.
8.1.3 States selected for Survey
Based on the criteria described above, we selected the following nine states for our survey
process:
Alabama has not chosen to expand Medicaid eligibility under the ACA. The hospitals
self-fund Medicaid hospital reimbursements through IGTs and CPEs. Also, the state is
in the process of implementing Medicaid managed care through Regional Care
Organizations (RCOs), and has submitted a waiver application to CMS to implement a
DSRIP program.
Arizona has chosen to expand Medicaid eligibility with a separate assessment to help
defray the state’s cost associated with meeting the minimum federal standards to
participate in the expansion. Arizona is a managed care state for the majority of its
Medicaid population, and has a safety net hospital pool fund.
California, like Florida, has a very large Medicaid program. The state has expanded the
categories of eligibility under ACA, does have a managed care program, has
implemented a DSRIP program, and has a provider assessment.
Illinois is another state transitioning to managed care with the intent to maintain
supplemental payments funded through a provider assessment, uses CPEs, and has
expanded Medicaid categories of eligibility.
New Jersey was surveyed for its recently approved DSRIP waiver with CMS.
New York was studied for its robust Medicaid program. The state has expanded the
Medicaid eligible population under ACA. It has also transitioned to managed care, and
is implementing a DSRIP waiver.
Pennsylvania was studied for its managed care environment and the state has expanded
Medicaid eligibility under ACA using a premium assistance plan.
Texas is similar to Florida in that it has not expanded eligibility under ACA and has a
large uncompensated care population. Texas has implemented a DSRIP program which
is up for renewal in 2016.
Washington has transitioned quickly into a managed care environment in the past two
years. Recently, CMS approved a physician supplemental payment program funded by
IGTs. The state has also expanded Medicaid eligibility under ACA.
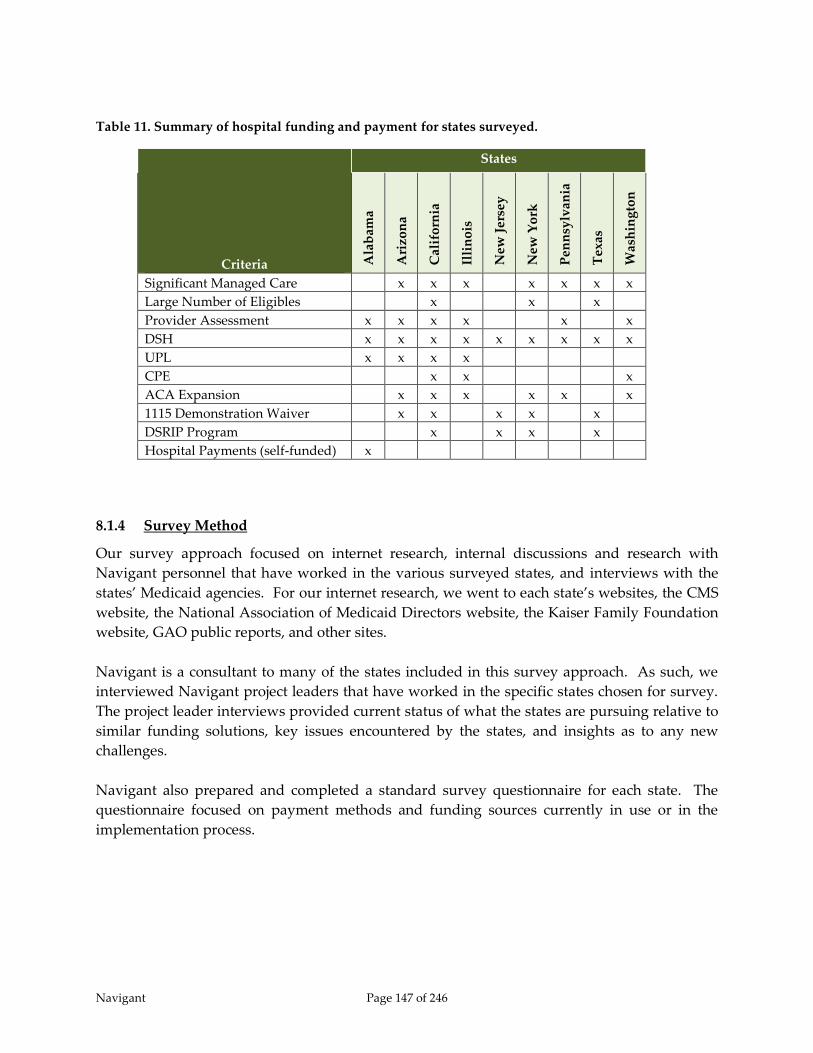
Navigant Page 147 of 246
Table 11. Summary of hospital funding and payment for states surveyed.
Criteria
States
Ala
bam
a
Ari
zon
a
Cal
ifo
rnia
Illi
no
is
New
Jer
sey
New
Yo
rk
Pen
nsy
lvan
ia
Tex
as
Was
hin
gto
n
Significant Managed Care x x x x x x x
Large Number of Eligibles x x x
Provider Assessment x x x x x x
DSH x x x x x x x x x
UPL x x x x
CPE x x x
ACA Expansion x x x x x x
1115 Demonstration Waiver x x x x x
DSRIP Program x x x x
Hospital Payments (self-funded) x
8.1.4 Survey Method
Our survey approach focused on internet research, internal discussions and research with
Navigant personnel that have worked in the various surveyed states, and interviews with the
states’ Medicaid agencies. For our internet research, we went to each state’s websites, the CMS
website, the National Association of Medicaid Directors website, the Kaiser Family Foundation
website, GAO public reports, and other sites.
Navigant is a consultant to many of the states included in this survey approach. As such, we
interviewed Navigant project leaders that have worked in the specific states chosen for survey.
The project leader interviews provided current status of what the states are pursuing relative to
similar funding solutions, key issues encountered by the states, and insights as to any new
challenges.
Navigant also prepared and completed a standard survey questionnaire for each state. The
questionnaire focused on payment methods and funding sources currently in use or in the
implementation process.
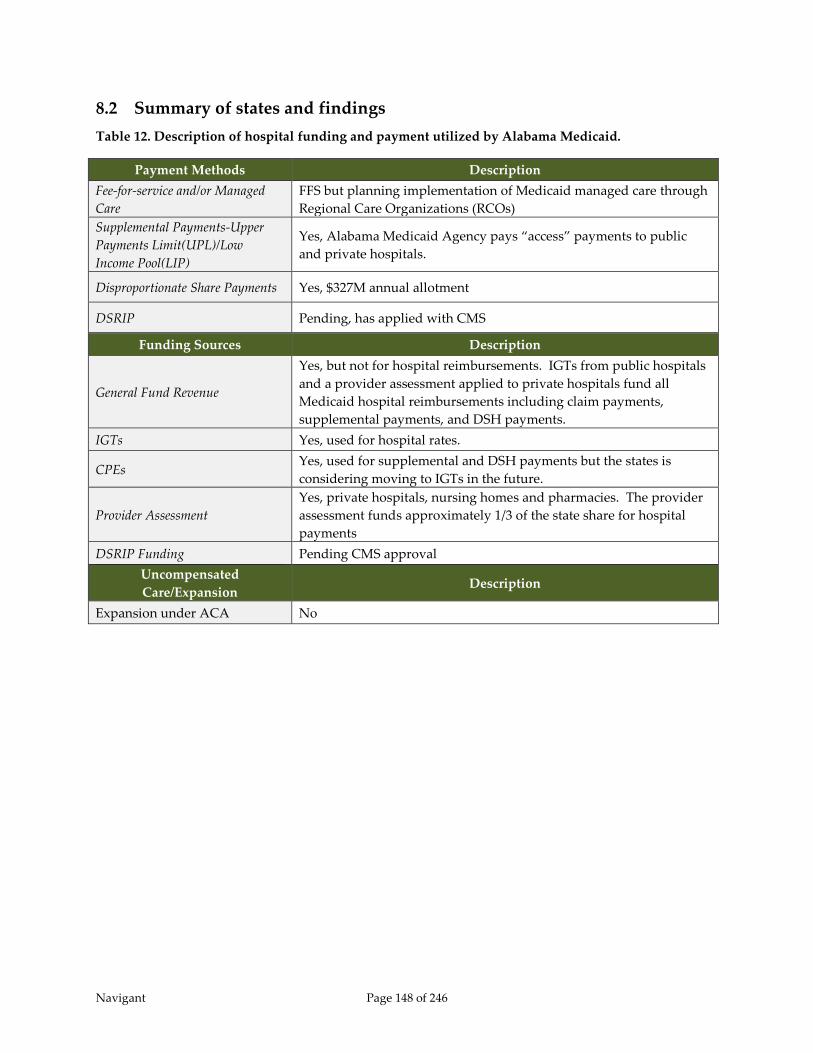
Navigant Page 148 of 246
8.2 Summary of states and findings
Table 12. Description of hospital funding and payment utilized by Alabama Medicaid.
Payment Methods Description
Fee-for-service and/or Managed
Care
FFS but planning implementation of Medicaid managed care through
Regional Care Organizations (RCOs)
Supplemental Payments-Upper
Payments Limit(UPL)/Low
Income Pool(LIP)
Yes, Alabama Medicaid Agency pays “access” payments to public
and private hospitals.
Disproportionate Share Payments Yes, $327M annual allotment
DSRIP Pending, has applied with CMS
Funding Sources Description
General Fund Revenue
Yes, but not for hospital reimbursements. IGTs from public hospitals
and a provider assessment applied to private hospitals fund all
Medicaid hospital reimbursements including claim payments,
supplemental payments, and DSH payments.
IGTs Yes, used for hospital rates.
CPEs Yes, used for supplemental and DSH payments but the states is
considering moving to IGTs in the future.
Provider Assessment
Yes, private hospitals, nursing homes and pharmacies. The provider
assessment funds approximately 1/3 of the state share for hospital
payments
DSRIP Funding Pending CMS approval
Uncompensated
Care/Expansion Description
Expansion under ACA No
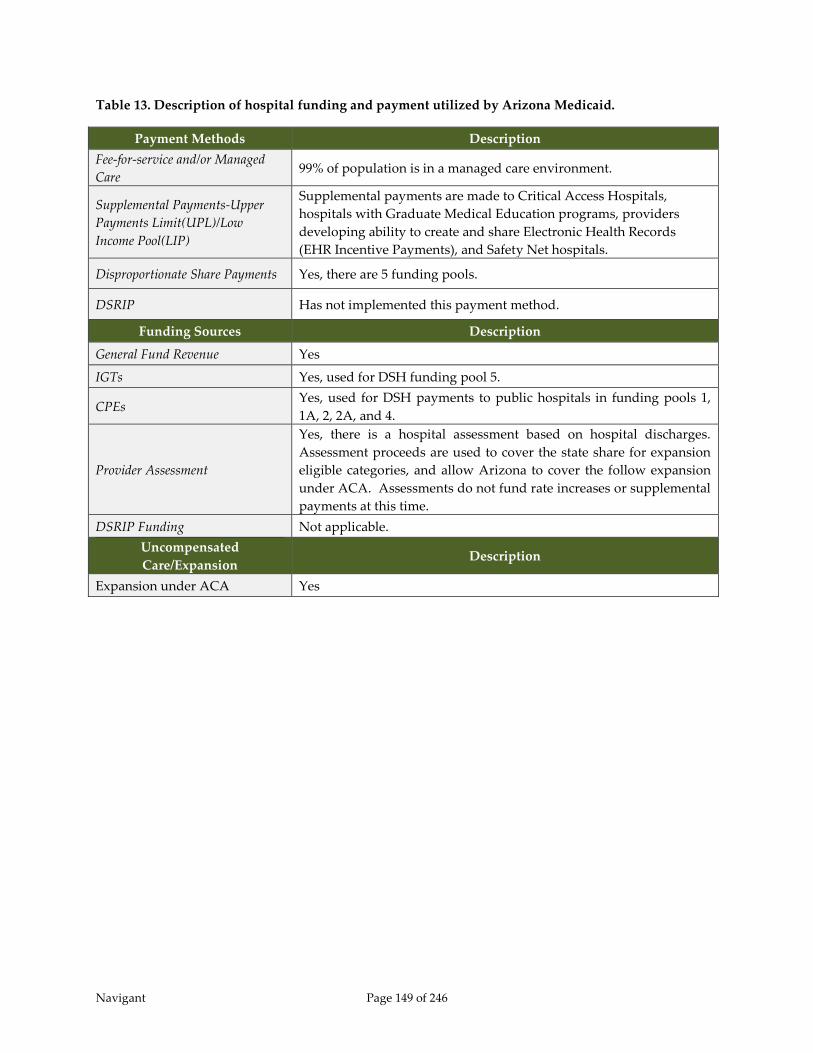
Navigant Page 149 of 246
Table 13. Description of hospital funding and payment utilized by Arizona Medicaid.
Payment Methods Description
Fee-for-service and/or Managed
Care 99% of population is in a managed care environment.
Supplemental Payments-Upper
Payments Limit(UPL)/Low
Income Pool(LIP)
Supplemental payments are made to Critical Access Hospitals,
hospitals with Graduate Medical Education programs, providers
developing ability to create and share Electronic Health Records
(EHR Incentive Payments), and Safety Net hospitals.
Disproportionate Share Payments Yes, there are 5 funding pools.
DSRIP Has not implemented this payment method.
Funding Sources Description
General Fund Revenue Yes
IGTs Yes, used for DSH funding pool 5.
CPEs Yes, used for DSH payments to public hospitals in funding pools 1,
1A, 2, 2A, and 4.
Provider Assessment
Yes, there is a hospital assessment based on hospital discharges.
Assessment proceeds are used to cover the state share for expansion
eligible categories, and allow Arizona to cover the follow expansion
under ACA. Assessments do not fund rate increases or supplemental
payments at this time.
DSRIP Funding Not applicable.
Uncompensated
Care/Expansion Description
Expansion under ACA Yes
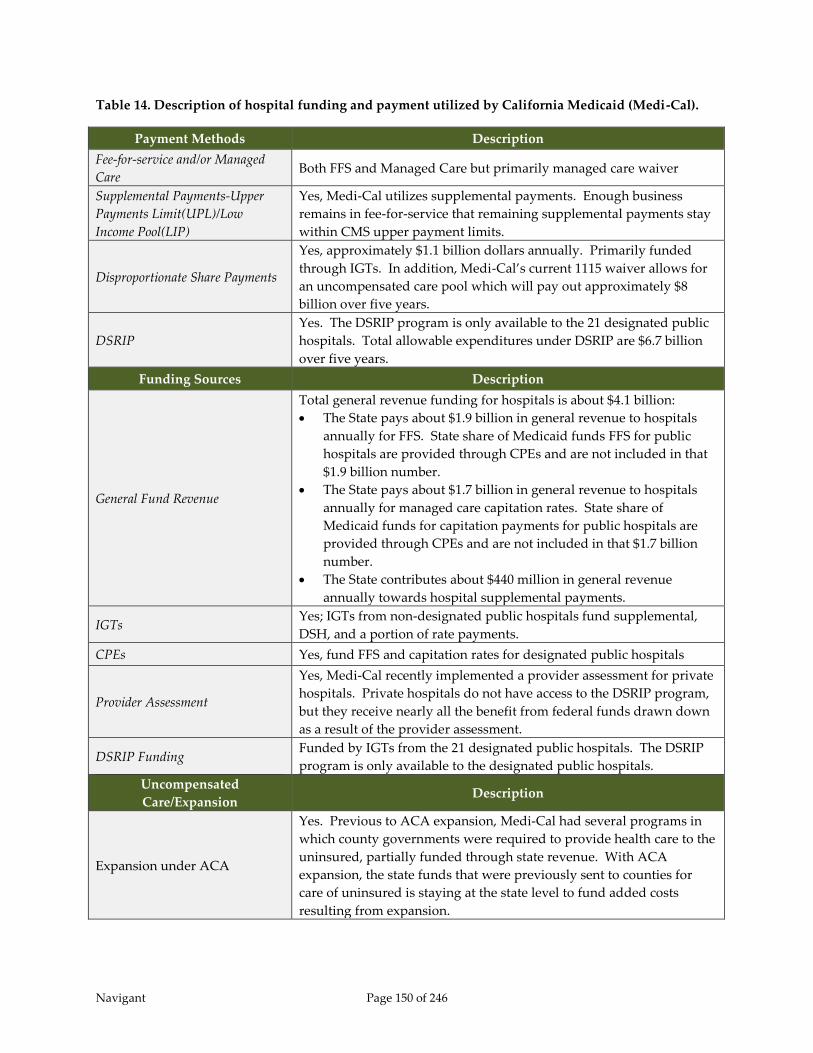
Navigant Page 150 of 246
Table 14. Description of hospital funding and payment utilized by California Medicaid (Medi-Cal).
Payment Methods Description
Fee-for-service and/or Managed
Care Both FFS and Managed Care but primarily managed care waiver
Supplemental Payments-Upper
Payments Limit(UPL)/Low
Income Pool(LIP)
Yes, Medi-Cal utilizes supplemental payments. Enough business
remains in fee-for-service that remaining supplemental payments stay
within CMS upper payment limits.
Disproportionate Share Payments
Yes, approximately $1.1 billion dollars annually. Primarily funded
through IGTs. In addition, Medi-Cal’s current 1115 waiver allows for
an uncompensated care pool which will pay out approximately $8
billion over five years.
DSRIP
Yes. The DSRIP program is only available to the 21 designated public
hospitals. Total allowable expenditures under DSRIP are $6.7 billion
over five years.
Funding Sources Description
General Fund Revenue
Total general revenue funding for hospitals is about $4.1 billion:
The State pays about $1.9 billion in general revenue to hospitals
annually for FFS. State share of Medicaid funds FFS for public
hospitals are provided through CPEs and are not included in that
$1.9 billion number.
The State pays about $1.7 billion in general revenue to hospitals
annually for managed care capitation rates. State share of
Medicaid funds for capitation payments for public hospitals are
provided through CPEs and are not included in that $1.7 billion
number.
The State contributes about $440 million in general revenue
annually towards hospital supplemental payments.
IGTs Yes; IGTs from non-designated public hospitals fund supplemental,
DSH, and a portion of rate payments.
CPEs Yes, fund FFS and capitation rates for designated public hospitals
Provider Assessment
Yes, Medi-Cal recently implemented a provider assessment for private
hospitals. Private hospitals do not have access to the DSRIP program,
but they receive nearly all the benefit from federal funds drawn down
as a result of the provider assessment.
DSRIP Funding Funded by IGTs from the 21 designated public hospitals. The DSRIP
program is only available to the designated public hospitals.
Uncompensated
Care/Expansion Description
Expansion under ACA
Yes. Previous to ACA expansion, Medi-Cal had several programs in
which county governments were required to provide health care to the
uninsured, partially funded through state revenue. With ACA
expansion, the state funds that were previously sent to counties for
care of uninsured is staying at the state level to fund added costs
resulting from expansion.
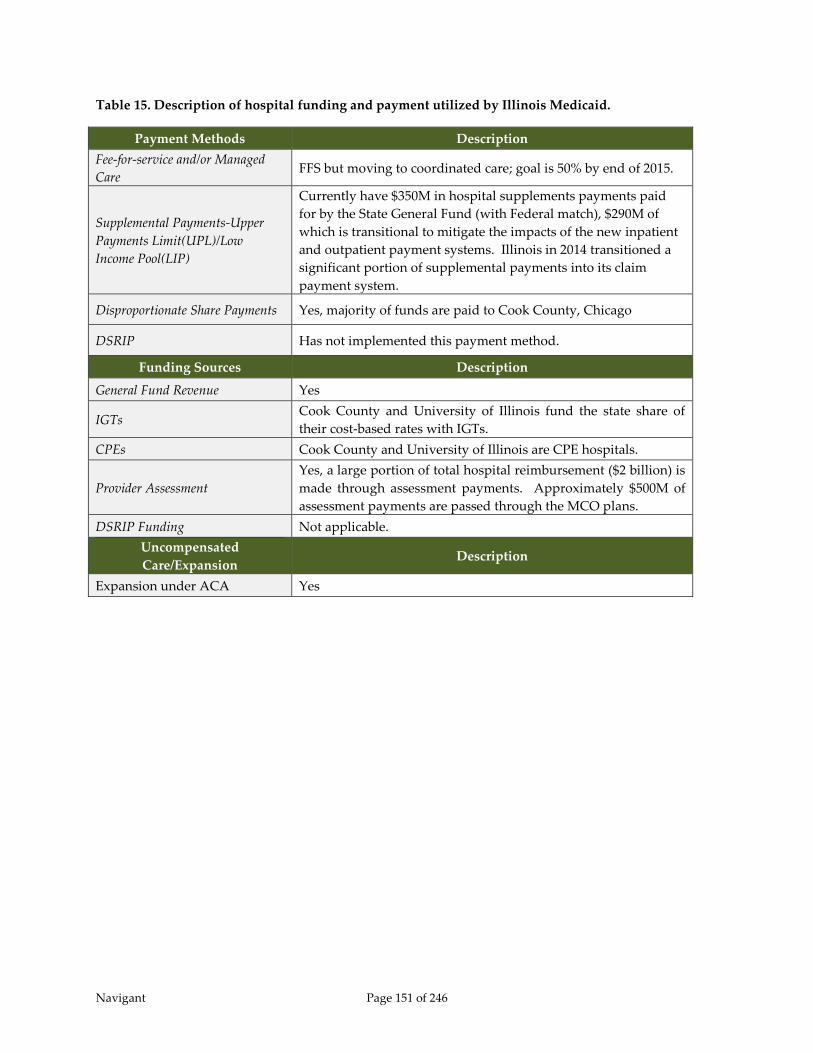
Navigant Page 151 of 246
Table 15. Description of hospital funding and payment utilized by Illinois Medicaid.
Payment Methods Description
Fee-for-service and/or Managed
Care FFS but moving to coordinated care; goal is 50% by end of 2015.
Supplemental Payments-Upper
Payments Limit(UPL)/Low
Income Pool(LIP)
Currently have $350M in hospital supplements payments paid
for by the State General Fund (with Federal match), $290M of
which is transitional to mitigate the impacts of the new inpatient
and outpatient payment systems. Illinois in 2014 transitioned a
significant portion of supplemental payments into its claim
payment system.
Disproportionate Share Payments Yes, majority of funds are paid to Cook County, Chicago
DSRIP Has not implemented this payment method.
Funding Sources Description
General Fund Revenue Yes
IGTs Cook County and University of Illinois fund the state share of
their cost-based rates with IGTs.
CPEs Cook County and University of Illinois are CPE hospitals.
Provider Assessment
Yes, a large portion of total hospital reimbursement ($2 billion) is
made through assessment payments. Approximately $500M of
assessment payments are passed through the MCO plans.
DSRIP Funding Not applicable.
Uncompensated
Care/Expansion Description
Expansion under ACA Yes
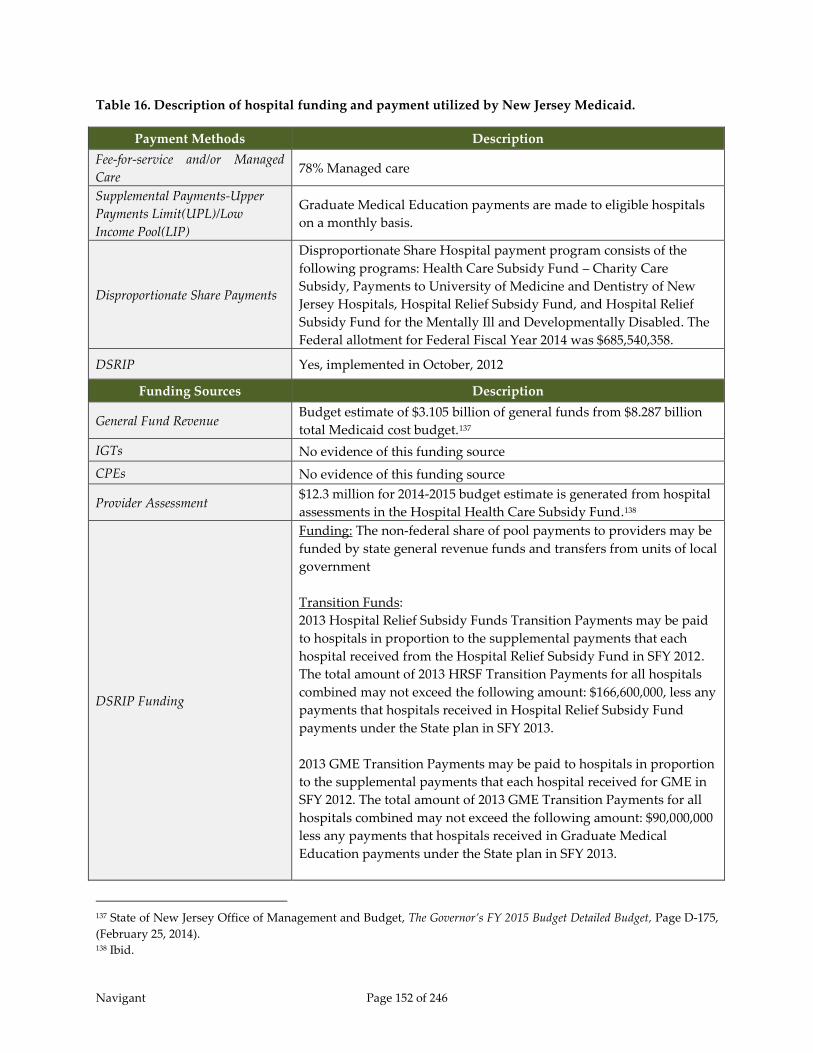
Navigant Page 152 of 246
Table 16. Description of hospital funding and payment utilized by New Jersey Medicaid.
Payment Methods Description
Fee-for-service and/or Managed
Care 78% Managed care
Supplemental Payments-Upper
Payments Limit(UPL)/Low
Income Pool(LIP)
Graduate Medical Education payments are made to eligible hospitals
on a monthly basis.
Disproportionate Share Payments
Disproportionate Share Hospital payment program consists of the
following programs: Health Care Subsidy Fund – Charity Care
Subsidy, Payments to University of Medicine and Dentistry of New
Jersey Hospitals, Hospital Relief Subsidy Fund, and Hospital Relief
Subsidy Fund for the Mentally Ill and Developmentally Disabled. The
Federal allotment for Federal Fiscal Year 2014 was $685,540,358.
DSRIP Yes, implemented in October, 2012
Funding Sources Description
General Fund Revenue Budget estimate of $3.105 billion of general funds from $8.287 billion
total Medicaid cost budget.137
IGTs No evidence of this funding source
CPEs No evidence of this funding source
Provider Assessment $12.3 million for 2014-2015 budget estimate is generated from hospital
assessments in the Hospital Health Care Subsidy Fund.138
DSRIP Funding
Funding: The non-federal share of pool payments to providers may be
funded by state general revenue funds and transfers from units of local
government
Transition Funds:
2013 Hospital Relief Subsidy Funds Transition Payments may be paid
to hospitals in proportion to the supplemental payments that each
hospital received from the Hospital Relief Subsidy Fund in SFY 2012.
The total amount of 2013 HRSF Transition Payments for all hospitals
combined may not exceed the following amount: $166,600,000, less any
payments that hospitals received in Hospital Relief Subsidy Fund
payments under the State plan in SFY 2013.
2013 GME Transition Payments may be paid to hospitals in proportion
to the supplemental payments that each hospital received for GME in
SFY 2012. The total amount of 2013 GME Transition Payments for all
hospitals combined may not exceed the following amount: $90,000,000
less any payments that hospitals received in Graduate Medical
Education payments under the State plan in SFY 2013.
137 State of New Jersey Office of Management and Budget, The Governor’s FY 2015 Budget Detailed Budget, Page D-175,
(February 25, 2014). 138 Ibid.
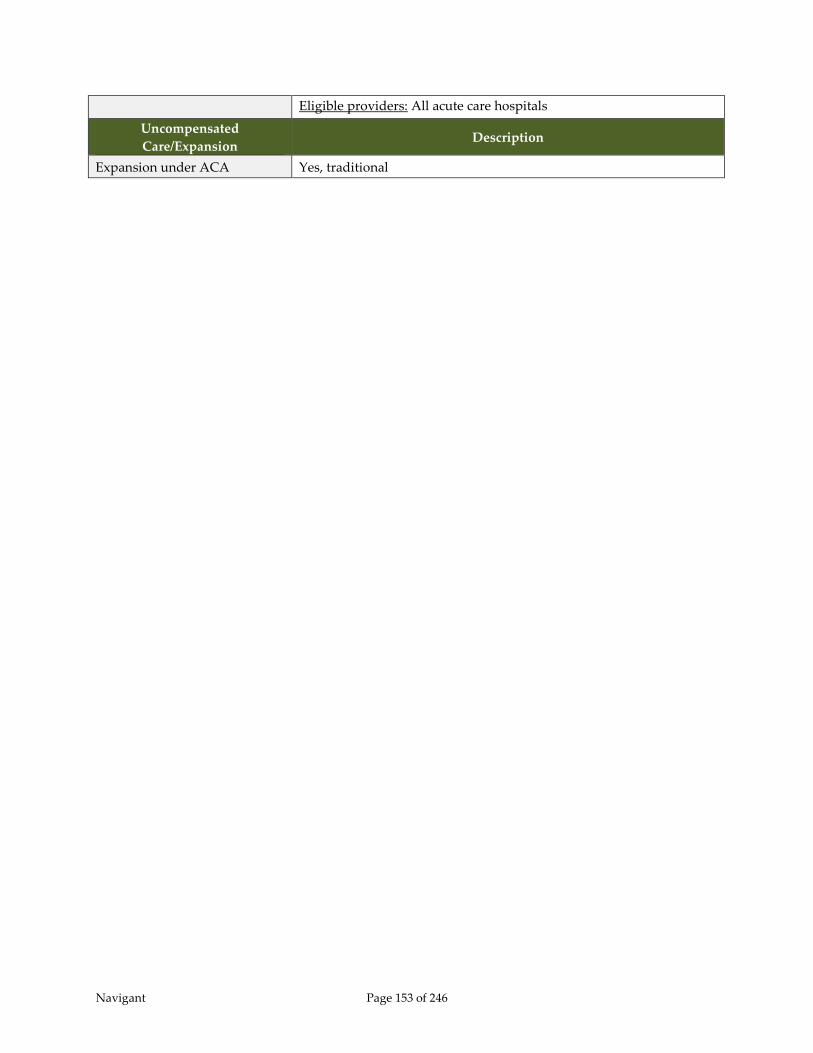
Navigant Page 153 of 246
Eligible providers: All acute care hospitals
Uncompensated
Care/Expansion Description
Expansion under ACA Yes, traditional
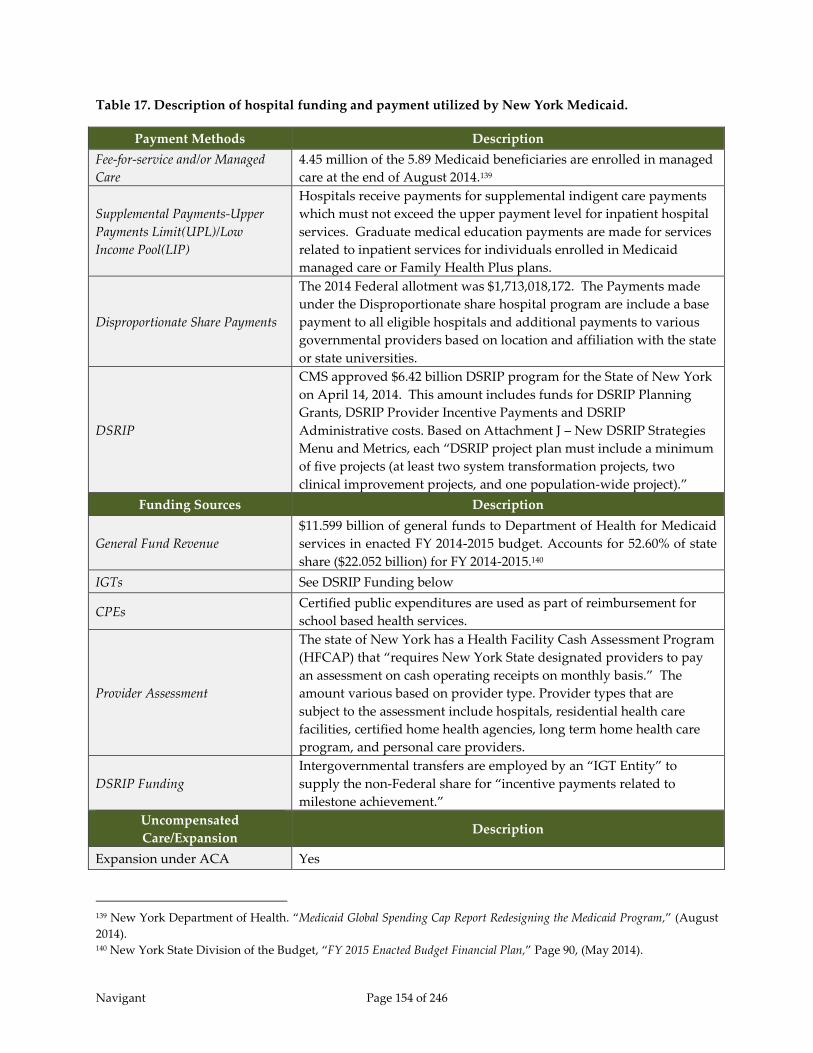
Navigant Page 154 of 246
Table 17. Description of hospital funding and payment utilized by New York Medicaid.
Payment Methods Description
Fee-for-service and/or Managed
Care
4.45 million of the 5.89 Medicaid beneficiaries are enrolled in managed
care at the end of August 2014.139
Supplemental Payments-Upper
Payments Limit(UPL)/Low
Income Pool(LIP)
Hospitals receive payments for supplemental indigent care payments
which must not exceed the upper payment level for inpatient hospital
services. Graduate medical education payments are made for services
related to inpatient services for individuals enrolled in Medicaid
managed care or Family Health Plus plans.
Disproportionate Share Payments
The 2014 Federal allotment was $1,713,018,172. The Payments made
under the Disproportionate share hospital program are include a base
payment to all eligible hospitals and additional payments to various
governmental providers based on location and affiliation with the state
or state universities.
DSRIP
CMS approved $6.42 billion DSRIP program for the State of New York
on April 14, 2014. This amount includes funds for DSRIP Planning
Grants, DSRIP Provider Incentive Payments and DSRIP
Administrative costs. Based on Attachment J – New DSRIP Strategies
Menu and Metrics, each “DSRIP project plan must include a minimum
of five projects (at least two system transformation projects, two
clinical improvement projects, and one population-wide project).”
Funding Sources Description
General Fund Revenue
$11.599 billion of general funds to Department of Health for Medicaid
services in enacted FY 2014-2015 budget. Accounts for 52.60% of state
share ($22.052 billion) for FY 2014-2015.140
IGTs See DSRIP Funding below
CPEs Certified public expenditures are used as part of reimbursement for
school based health services.
Provider Assessment
The state of New York has a Health Facility Cash Assessment Program
(HFCAP) that “requires New York State designated providers to pay
an assessment on cash operating receipts on monthly basis.” The
amount various based on provider type. Provider types that are
subject to the assessment include hospitals, residential health care
facilities, certified home health agencies, long term home health care
program, and personal care providers.
DSRIP Funding
Intergovernmental transfers are employed by an “IGT Entity” to
supply the non-Federal share for “incentive payments related to
milestone achievement.”
Uncompensated
Care/Expansion Description
Expansion under ACA Yes
139 New York Department of Health. “Medicaid Global Spending Cap Report Redesigning the Medicaid Program,” (August
2014). 140 New York State Division of the Budget, “FY 2015 Enacted Budget Financial Plan,” Page 90, (May 2014).

Navigant Page 155 of 246
Table 18. Description of hospital funding and payment utilized by Pennsylvania Medicaid.
Payment Methods Description
Fee-for-service and/or Managed
Care
Managed care capitation payments make up 78.09% of forecasted
expenditures in the Department of Public Welfare’s Medical
Assistance budget for 2014-2015. Total payments made for inpatient
and outpatient hospital services in SFY 2011, under both the managed
care program and FFS program (excluding DSH) totals approximately
$5.11 billion.
Supplemental Payments-Upper
Payments Limit(UPL)/Low
Income Pool(LIP)
Supplemental payments made to hospitals with at least 80% of
inpatient care (fee for service and managed care). Supplemental
payments are also made related to direct graduate medical education,
medical assistance dependency payments, and medical assistance
stability payments. Supplemental payments made for inpatient and
outpatient hospital services in SFY 2011, excluding DSH payments,
totaled approximately $1.02 billion, and remain at approximately 20
percent of non-DSH funding for hospitals.
Disproportionate Share Payments
The allotment for the State of Pennsylvania for 2014 is $598,556,544.
Several different reimbursement programs exist as part of the
Disproportionate Share Hospital Program. These include the
following: Trauma Disproportionate Share Hospital Payments,
hospitals in economically distressed areas, hospitals with qualified
burn centers, small and sole community hospitals, critical access
hospitals, qualified rural hospitals, and enhanced high volume
hospitals.
DSRIP Has not implemented DSRIP.
Funding Sources Description
General Fund Revenue Pennsylvania 2014-2015 Budget for Medical Assistance is $16.9 billion.
$5.3 billion of the budget is forecasted from general funds.
IGTs None – no publicly owned or operated hospitals in Pennsylvania
CPEs None – no publicly owned or operated hospitals in Pennsylvania
Provider Assessment
Pennsylvania has a Statewide Hospital Quality Care Assessment that
has “all inpatient acute care general and freestanding rehabilitation
hospitals located within the Commonwealth of Pennsylvania.”141 This
assessment is used to enhance the inpatient acute care hospital
reimbursement system and allow for enhanced capitation payments
for inpatient hospital services within the managed care environment.142
The city of Philadelphia has implemented a Philadelphia Hospital
Assessment of $157 million is budgeted to assist in payment of
outpatient hospital services.143
DSRIP Funding None
141 PA Department of Public Welfare. “PA DPW Statewide Hospital Quality Care Assessment Frequently Asked Questions,”
(Revised September 23, 2013). 142 PA Department of Public Welfare. “Governor’s 2014-2015 Executive Budget,” Page 125, (February 2014). 143 PA Department of Public Welfare. “Governor’s 2014-2015 Executive Budget,” Page 113, (February 2014).

Navigant Page 156 of 246
Uncompensated
Care/Expansion Description
Expansion under ACA Yes – through a premium assistance program
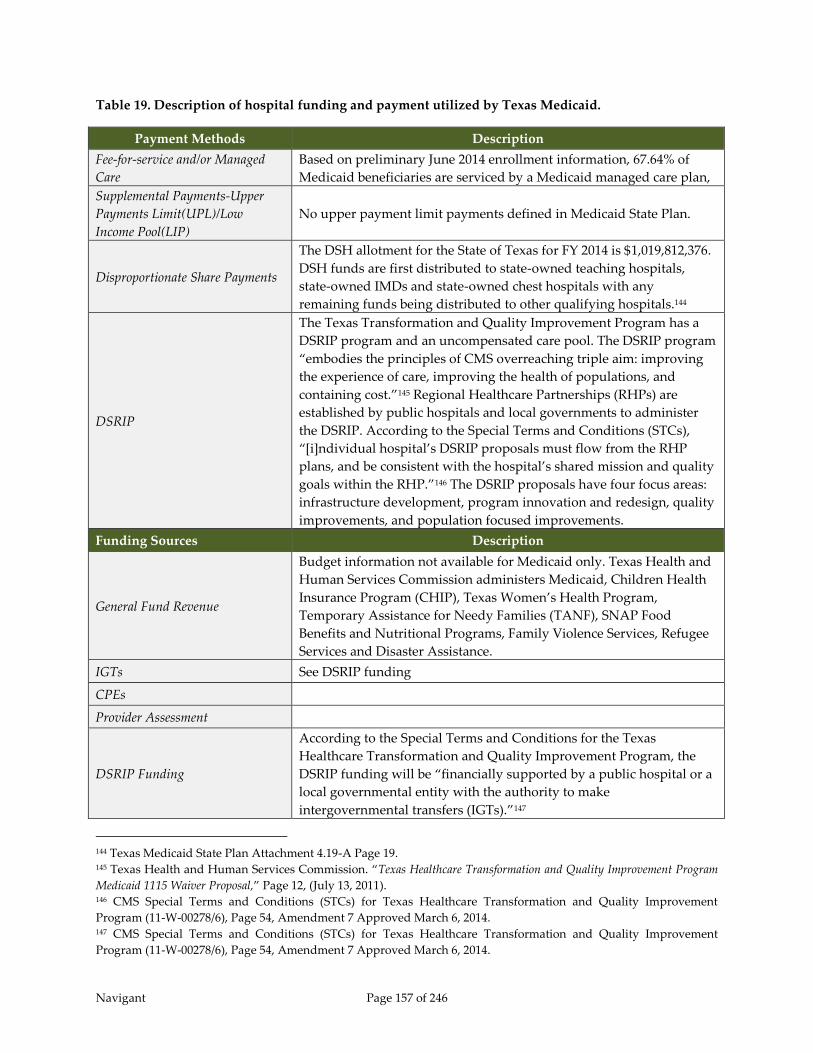
Navigant Page 157 of 246
Table 19. Description of hospital funding and payment utilized by Texas Medicaid.
Payment Methods Description
Fee-for-service and/or Managed
Care
Based on preliminary June 2014 enrollment information, 67.64% of
Medicaid beneficiaries are serviced by a Medicaid managed care plan,
Supplemental Payments-Upper
Payments Limit(UPL)/Low
Income Pool(LIP)
No upper payment limit payments defined in Medicaid State Plan.
Disproportionate Share Payments
The DSH allotment for the State of Texas for FY 2014 is $1,019,812,376.
DSH funds are first distributed to state-owned teaching hospitals,
state-owned IMDs and state-owned chest hospitals with any
remaining funds being distributed to other qualifying hospitals.144
DSRIP
The Texas Transformation and Quality Improvement Program has a
DSRIP program and an uncompensated care pool. The DSRIP program
“embodies the principles of CMS overreaching triple aim: improving
the experience of care, improving the health of populations, and
containing cost.”145 Regional Healthcare Partnerships (RHPs) are
established by public hospitals and local governments to administer
the DSRIP. According to the Special Terms and Conditions (STCs),
“[i]ndividual hospital’s DSRIP proposals must flow from the RHP
plans, and be consistent with the hospital’s shared mission and quality
goals within the RHP.”146 The DSRIP proposals have four focus areas:
infrastructure development, program innovation and redesign, quality
improvements, and population focused improvements.
Funding Sources Description
General Fund Revenue
Budget information not available for Medicaid only. Texas Health and
Human Services Commission administers Medicaid, Children Health
Insurance Program (CHIP), Texas Women’s Health Program,
Temporary Assistance for Needy Families (TANF), SNAP Food
Benefits and Nutritional Programs, Family Violence Services, Refugee
Services and Disaster Assistance.
IGTs See DSRIP funding
CPEs
Provider Assessment
DSRIP Funding
According to the Special Terms and Conditions for the Texas
Healthcare Transformation and Quality Improvement Program, the
DSRIP funding will be “financially supported by a public hospital or a
local governmental entity with the authority to make
intergovernmental transfers (IGTs).”147
144 Texas Medicaid State Plan Attachment 4.19-A Page 19. 145 Texas Health and Human Services Commission. “Texas Healthcare Transformation and Quality Improvement Program
Medicaid 1115 Waiver Proposal,” Page 12, (July 13, 2011). 146 CMS Special Terms and Conditions (STCs) for Texas Healthcare Transformation and Quality Improvement
Program (11-W-00278/6), Page 54, Amendment 7 Approved March 6, 2014. 147 CMS Special Terms and Conditions (STCs) for Texas Healthcare Transformation and Quality Improvement
Program (11-W-00278/6), Page 54, Amendment 7 Approved March 6, 2014.

Navigant Page 158 of 246
Uncompensated
Care/Expansion Description
Expansion under ACA No

Navigant Page 159 of 246
Table 20. Description of hospital funding and payment utilized by Washington Medicaid.
Payment Methods Description
Fee-for-service and/or Managed
Care
Approximately 80% of the Medicaid population is in managed
care.
Supplemental Payments-Upper
Payments Limit(UPL)/Low
Income Pool(LIP)
Yes, supplemental payments occur in FFS and managed care.
Recently, CMS approved supplemental payments through the
managed care plans. A total of $300 million has been legislated
for manage care health plans to increase in their PMPM capitated
payment rates. The supplemental payments are treated as a
100% pass through to providers (no admin. fee) by the managed
care plans. After the state makes the capitation payments, the
health plans make the provider payments. The hospital
association has a 100% participation rate and is very strong in
Washington. It has a strong working relationship with the health
plans.
Disproportionate Share Payments
Approximate total is $197 million for SFY 2014. Payments are
capped in legislation and subject to Federal DSH limit. DSH
payments are categorized as follows:
Low Income DSH (LIDSH) adjustment-appropriated
amounts
Medical Care Services DSH (MCSDSH) per claim payment
Small Rural DSH (SRDSH) paid quarterly
Small Rural Indigent DSH (SRDSH)
Non rural indigent assistance DSH (NRIADSH)
Public Hospital DSH (PHDSH)
Children’s Health Program (CHPDSH) per claim data
Sole Community DSH (SCDSH) (new)
DSRIP Has not implemented this payment method.
Funding Sources Description
General Fund Revenue It is the primary source of the state share in the Medicaid
program.
IGTs
This funding source funds the Physician UPL program. It is a
current program through the University, which has a large
physician’s network.
CPEs
Qualifying hospitals use this funding source to drawdown
federal funds for interim (50%) hospital payments. Interim
settlement occurs usually within six months of state year. During
this settlement, the payment is difference in the DRG rate minus
the interim payment made at time of service. This payment is all
state funds.
Provider Assessment
Yes, safety net hospital assessment restores rate cuts and raises
rates but is set to expire in 2019. The assessment is for all
hospitals except non-governmental hospitals (CPE hospitals).
Used to fund state share of IP/OP services, rate increases, UPL for
FFS and managed care, grants to CPE hospitals, CAH hospitals,
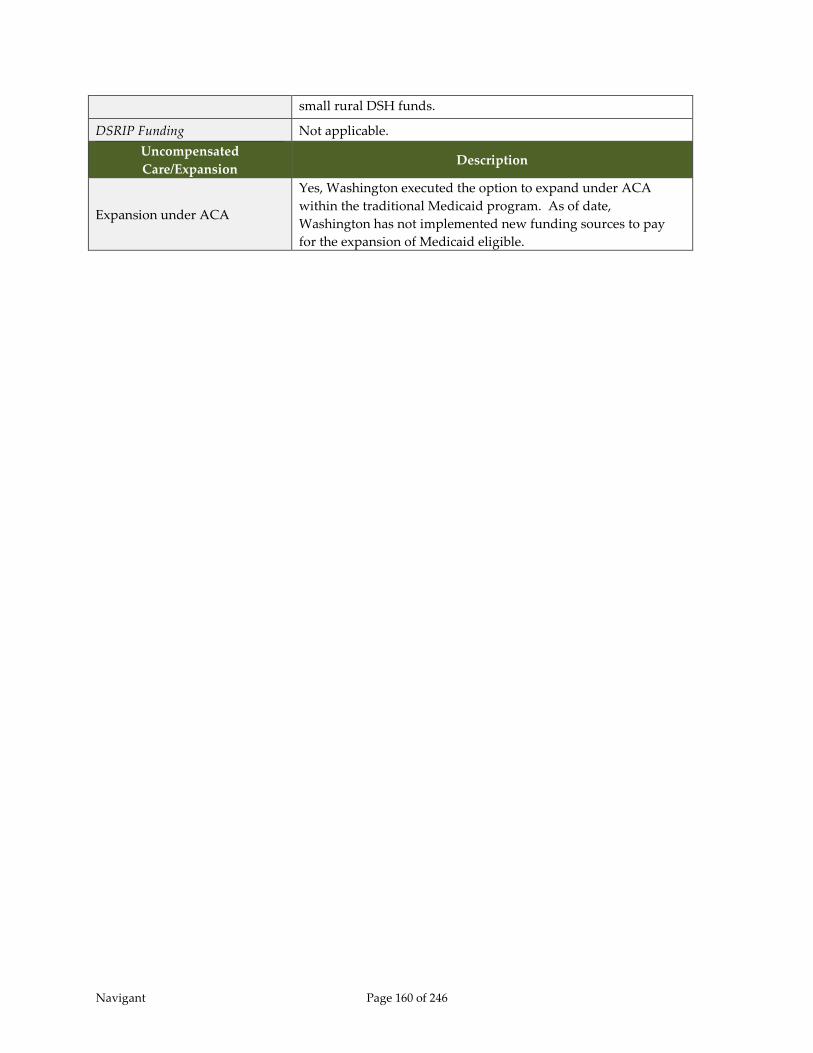
Navigant Page 160 of 246
small rural DSH funds.
DSRIP Funding Not applicable.
Uncompensated
Care/Expansion Description
Expansion under ACA
Yes, Washington executed the option to expand under ACA
within the traditional Medicaid program. As of date,
Washington has not implemented new funding sources to pay
for the expansion of Medicaid eligible.
Navigant Page 161 of 246
9 Options for Florida Medicaid to Consider
9.1 Introduction of Options
This section describes options that could be considered by Florida Medicaid as potential
alternatives to the current LIP program. We describe separately potential alternatives for the
distribution of funds that are currently paid out as part of the LIP program, and alternative
ways for generating the state and federal shares of the funds needed for such distributions.
The federal waiver that allowed the LIP program to operate has historically provided Florida
Medicaid with significant flexibility in generating the state share of funding, and in distributing
those funds plus associated federal matching funds. However, as described previously in
Chapter 3 – Applicable Federal and State Regulations, without such a waiver program, there are
significant limitations on what the State can do from a funding and payment perspective.
The federal UPL regulations described in Chapter 3, place limits on the amounts that can be
paid to hospitals for services provided to individuals in Florida Medicaid’s FFS program.
Because of these limits, as Florida Medicaid transitions from a FFS model to a capitated
Medicaid managed care model, the amounts that can be distributed through the FFS program
will get smaller. At the same time, the flexibility afforded through the FFS program, which
allows states to hold hospitals harmless for their IGT contributions, will continue to diminish.
With a larger proportion of Medicaid funding being channeled through capitated PMPM rates
paid to Medicaid managed care plans, the State has shifted substantial financial risk to the
plans. As a trade-off however, Florida Medicaid has given up some control over how hospitals
are paid. Specifically, the funding and payment options that have been traditionally available
to Florida Medicaid for optimizing the generation of federal matching funds, and Florida
Medicaid’s flexibility in determining how to distribute those funds to hospitals is much more
limited. Florida Medicaid may set the capitated PMPM rates, but does not have authority to
dictate the rates that are negotiated between managed care plans and individual hospitals.
In the context of these limitations, this chapter explores the current options available to Florida
Medicaid on both sides – the payment distribution side and the funding generation side. We
also discuss some of the key advantages and disadvantages of each.
9.2 Current Upper Payment Limit Gap
We make the assumption that the guaranteed return on investment provided through the LIP
program offered sufficient incentive for local governments and taxing districts to execute inter-
governmental transfers contributing funds to the state Medicaid program. As shown in Table
21, just over one billion dollars is planned for collection through IGTs in SFY 2014/15 to fund
hospital payments made through the LIP program (including LIP 6) and automatic IGT rate

Navigant Page 162 of 246
enhancements.148 In return, designated hospitals in the local areas contributing this money
receive back a minimum a 108.5 percent of the amounts they contributed towards automatic
IGTs and the “traditional” $1 billion LIP program. Many of these hospitals receive additional
funds in the form of “traditional” LIP supplemental payments and automatic IGT rate
enhancements. In addition for the LIP 6 funds (previously known as self-funded IGTs),
hospitals receive back 100 percent of the IGT investment plus all of the federal matching funds
drawn down because of that investment.
If the LIP program is discontinued, and is not replaced with some other kind of waiver, then
guaranteed return on investment can only be offered for amounts that are compliant with the
FFS UPL. Estimates of those amounts at a program-wide level are shown in Table 21 for SFY
2013/14 and SFY 2014/15. It should be noted that the FFS UPL is significantly lower in SFY
2014/15 than in SFY 2013/14. The UPL demonstration in SFY 2013/14 is indicative of a program
in the pilot stage of the managed care transition, with approximately 32 percent of Medicaid
expenditures being made to managed care plans. The SFY 2014/15 UPL demonstration was
adjusted to take into consideration the transition to state-wide Medicaid managed care.
Table 21 estimates the amount of IGT funds available to pay through a FFS UPL if the LIP
program did not exist. That is, how much IGT funding could Florida Medicaid payout through
FFS UPL if no money was paid out through the LIP program and no automatic IGT rate
enhancements were applied. This amount of money is labeled “UPL Gap” in Table 21 and
equals the difference between FFS claim payments (without IGT-funded rate enhancements)
and the cost-based upper payment limit. The cost-based upper payment limits used in
determination of UPL gap are those that were submitted to CMS in the UPL demonstrations for
SFY 2013/14 and 2014/15. In addition, Table 21 compares the UPL gap to the amount of funds
generated through federally-matched IGTs.
The data shows that even in SFY 2013/14, Florida Medicaid would have been over the UPL by
approximately $560 million if all the IGT funds (including both state and federal dollars) were
counted as payments that are limited to the UPL. However, the one billion dollars distributed
as part of the LIP program in SFY 2013/14 were considered payments under the current 1115
waiver and were not considered as a payment in the demonstration UPL calculations. Due to
the transition of Medicaid recipients into managed care in SFY 2014/15, the UPL gap shrinks to
approximately $411 million and Florida Medicaid would be spending almost $2.2 billion over
the UPL if these funds were no longer paid out as part of the 1115 waiver program. In other
words, Florida Medicaid would need to cut back spending to hospitals and teaching physicians
by approximately of $2.2 billion if the LIP program was discontinued and no other changes
were made to funding or payment mechanisms.
148 The $1.032 billion value excludes funds contributing to LIP payments for non-hospitals (i.e. FQHCs and CHDs)
because those payments would not affect hospital UPL calculations.
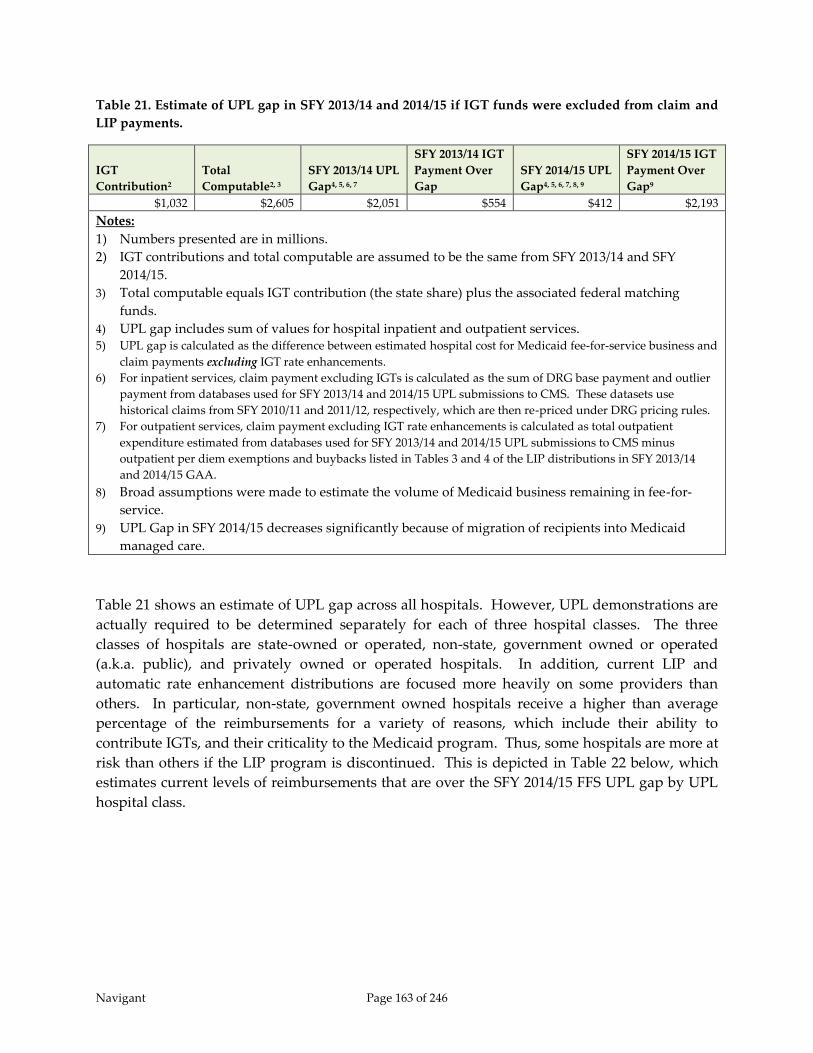
Navigant Page 163 of 246
Table 21. Estimate of UPL gap in SFY 2013/14 and 2014/15 if IGT funds were excluded from claim and
LIP payments.
IGT
Contribution2
Total
Computable2, 3
SFY 2013/14 UPL
Gap4, 5, 6, 7
SFY 2013/14 IGT
Payment Over
Gap
SFY 2014/15 UPL
Gap4, 5, 6, 7, 8, 9
SFY 2014/15 IGT
Payment Over
Gap9
$1,032 $2,605 $2,051 $554 $412 $2,193
Notes:
1) Numbers presented are in millions.
2) IGT contributions and total computable are assumed to be the same from SFY 2013/14 and SFY
2014/15.
3) Total computable equals IGT contribution (the state share) plus the associated federal matching
funds.
4) UPL gap includes sum of values for hospital inpatient and outpatient services. 5) UPL gap is calculated as the difference between estimated hospital cost for Medicaid fee-for-service business and
claim payments excluding IGT rate enhancements.
6) For inpatient services, claim payment excluding IGTs is calculated as the sum of DRG base payment and outlier
payment from databases used for SFY 2013/14 and 2014/15 UPL submissions to CMS. These datasets use
historical claims from SFY 2010/11 and 2011/12, respectively, which are then re-priced under DRG pricing rules.
7) For outpatient services, claim payment excluding IGT rate enhancements is calculated as total outpatient
expenditure estimated from databases used for SFY 2013/14 and 2014/15 UPL submissions to CMS minus
outpatient per diem exemptions and buybacks listed in Tables 3 and 4 of the LIP distributions in SFY 2013/14
and 2014/15 GAA.
8) Broad assumptions were made to estimate the volume of Medicaid business remaining in fee-for-
service.
9) UPL Gap in SFY 2014/15 decreases significantly because of migration of recipients into Medicaid
managed care.
Table 21 shows an estimate of UPL gap across all hospitals. However, UPL demonstrations are
actually required to be determined separately for each of three hospital classes. The three
classes of hospitals are state-owned or operated, non-state, government owned or operated
(a.k.a. public), and privately owned or operated hospitals. In addition, current LIP and
automatic rate enhancement distributions are focused more heavily on some providers than
others. In particular, non-state, government owned hospitals receive a higher than average
percentage of the reimbursements for a variety of reasons, which include their ability to
contribute IGTs, and their criticality to the Medicaid program. Thus, some hospitals are more at
risk than others if the LIP program is discontinued. This is depicted in Table 22 below, which
estimates current levels of reimbursements that are over the SFY 2014/15 FFS UPL gap by UPL
hospital class.
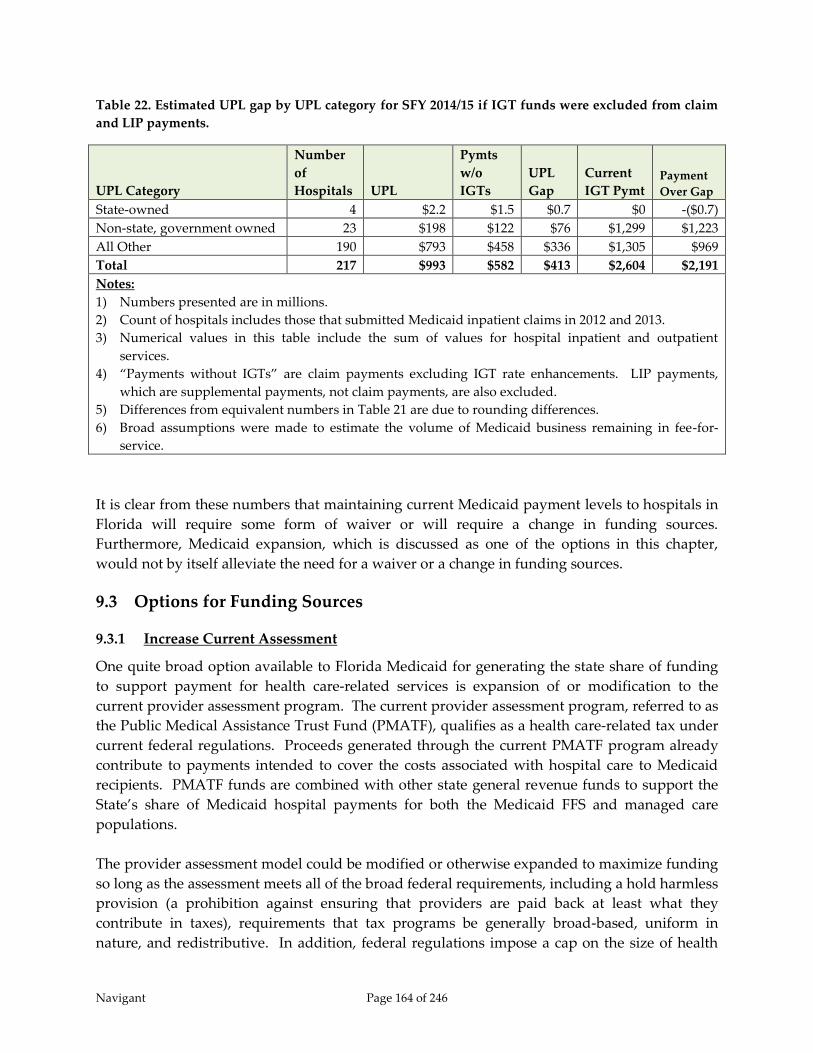
Navigant Page 164 of 246
Table 22. Estimated UPL gap by UPL category for SFY 2014/15 if IGT funds were excluded from claim
and LIP payments.
UPL Category
Number
of
Hospitals UPL
Pymts
w/o
IGTs
UPL
Gap
Current
IGT Pymt Payment
Over Gap
State-owned 4 $2.2 $1.5 $0.7 $0 -($0.7)
Non-state, government owned 23 $198 $122 $76 $1,299 $1,223
All Other 190 $793 $458 $336 $1,305 $969
Total 217 $993 $582 $413 $2,604 $2,191
Notes:
1) Numbers presented are in millions.
2) Count of hospitals includes those that submitted Medicaid inpatient claims in 2012 and 2013.
3) Numerical values in this table include the sum of values for hospital inpatient and outpatient
services.
4) “Payments without IGTs” are claim payments excluding IGT rate enhancements. LIP payments,
which are supplemental payments, not claim payments, are also excluded.
5) Differences from equivalent numbers in Table 21 are due to rounding differences.
6) Broad assumptions were made to estimate the volume of Medicaid business remaining in fee-for-
service.
It is clear from these numbers that maintaining current Medicaid payment levels to hospitals in
Florida will require some form of waiver or will require a change in funding sources.
Furthermore, Medicaid expansion, which is discussed as one of the options in this chapter,
would not by itself alleviate the need for a waiver or a change in funding sources.
9.3 Options for Funding Sources
9.3.1 Increase Current Assessment
One quite broad option available to Florida Medicaid for generating the state share of funding
to support payment for health care-related services is expansion of or modification to the
current provider assessment program. The current provider assessment program, referred to as
the Public Medical Assistance Trust Fund (PMATF), qualifies as a health care-related tax under
current federal regulations. Proceeds generated through the current PMATF program already
contribute to payments intended to cover the costs associated with hospital care to Medicaid
recipients. PMATF funds are combined with other state general revenue funds to support the
State’s share of Medicaid hospital payments for both the Medicaid FFS and managed care
populations.
The provider assessment model could be modified or otherwise expanded to maximize funding
so long as the assessment meets all of the broad federal requirements, including a hold harmless
provision (a prohibition against ensuring that providers are paid back at least what they
contribute in taxes), requirements that tax programs be generally broad-based, uniform in
nature, and redistributive. In addition, federal regulations impose a cap on the size of health

Navigant Page 165 of 246
care-related assessment programs. Currently the limit is six percent – a state may not collect
more than six percent of the aggregated net patient service revenue of the hospitals that are
assessed under the program. Further, any payments generated through the provider tax
program must be made in ways that comply with Medicare UPL regulations and facility-
specific DSH payment limitations. However, CMS has recently changed the requirements for
calculation of UPLs and now allows the Medicaid portion of a hospital assessment to be
included as a hospital cost. Under a cost-based UPL demonstration, this allows a hospital’s
UPL to be calculated a little higher than it would have been without inclusion of the assessment
as a cost.
The current provider assessment program in the State of Florida assesses hospitals, nursing
facilities, and intermediate care facilities for the intellectually disabled. Specifically from
hospitals, the assessment collects an amount equal to 1.5 percent of the annual net operating
revenue for inpatient services and one percent of the annual net operating revenue for
outpatient services. In SFY 2012/13, the provider assessment generated $497 million in funds
for the Medicaid program which generated $679 million in federal matching funds resulting in a
total of $1.176 billion in funds for Medicaid reimbursements. Table 23 below estimates how
these numbers change using hospital SFY 2012/13 revenue, the SFY 2015/16 FMAP value, and
various provider assessment percentages.
Table 23. Estimated increases in Medicaid funds based on increases in provider assessment rates.
Inpatient
Assessment
Percentage
Outpatient
Assessment
Percentage
Assessment
Revenue
Associated
Federal
Matching
Funds
Funds
Available to
Medicaid
Program
Increase in
Funds Above
Current
Level
1.5% 1.0% $497 $761 $1,258 n/a
2.5% 2.0% $873 $1,338 $2,211 $1,036
3.5% 3.0% $1,249 $1,915 $3,164 $1,988
3.75% 3.5% $1,344 $2,059 $3,402 $2,227
Notes:
1) Numbers presented are in millions
2) SFY 2015/16 FMAP percentage of 60.51 percent is used in these calculations. This is
the FMAP used in the December 2014 SSEC.
Table 23 estimates that a provider assessment set at 3.75 percent of hospital inpatient revenue
and 3.25 percent of hospital outpatient revenue would bring in enough funds for the state to
completely replace the funding created by the current LIP program. (Total computable on the
SFY 2015/16 LIP program is $2.168 billion.) In addition, if the Medicaid program was expanded,
hospital revenues would likely increase and PMATF revenues would correspondingly increase.
It should be noted, however, that without some form of Medicaid waiver, a provider
assessment could not be designed to fund the Medicaid program at the same level as the current

Navigant Page 166 of 246
LIP program. This is because the current LIP program distributes more funds than is allowable
under UPL regulations, as discussed in section 9.2 Current Upper Payment Limit Gap. Without
a waiver the provider assessment would at most be able to fund approximately $1.5 billion
beyond what the assessment already funds today.
Provider assessment programs generally afford states flexibility in the methods used to
distribute the funds generated by the program, notwithstanding the political obstacles
associated with the redistributive requirements of how the funds are collected. Assessment
programs have the advantage of being mandated within law, thus are not optional as are IGT
donations. Assessments also have the advantage of being applied equally to all hospitals,
unlike IGTs which can only be received from public institutions, local governments, and taxing
districts. The actual distribution of funds can be determined by the state, and do not need to be
established in a way that incents contribution of funds to the Medicaid program. Payments can
be applied across providers through rate increases, or can be targeted to specific types of
providers or services. As is done today, the funds generated from the provider assessment
could be used to increase fee-for-service and managed care capitation rates for all hospitals,
while reducing the role of supplemental payments within the overall hospital reimbursement
scheme employed by Florida Medicaid. This would tie payments more closely to Medicaid
utilization and patient acuity and resource requirements, and remove the link of hospital
reimbursements to the donator of funds. This option will also give managed care organizations
more leverage to incent cost effectiveness and quality improvements because the managed care
organizations will have control of more of the hospitals’ total Medicaid reimbursement.
As a negative, provider assessments cannot be explicit in holding hospitals harmless for all (or a
portion) of the tax, or otherwise guarantee that hospitals will get all of the tax paid into the
program back in payments. For many hospitals, this will not likely be an issue. However, it is
likely that hospitals that see a relatively low volume of Medicaid patients will be required to
pay more into a provider tax than they receive in Medicaid revenue.
Replacement of IGT funding and the LIP program with an increase in the provider assessment
would also require modification to the current inpatient payment method. This is because the
LIP program and automatic IGT rate enhancements have been distributed in ways that protect
hospitals deemed critical to the Medicaid program, including safety net hospitals, rural
hospitals, and free-standing children’s hospitals. With this new funding, Florida Medicaid
would need to determine how funds would be distributed to the providers, and whether or not
portions of the funds should be directed to specific provider types or services. The current
payment already pays more to specific categories of hospitals, but those differences would need
to be reconsidered if current supplemental payments were replaced with higher claim payment
rates. If such distributions result in significant payment differences among hospitals, and if
such differences are carried forward through the contracting process between the hospitals and
the Medicaid managed care plans, there is a risk that rate variations between hospitals may
incent the managed care organizations to steer Medicaid recipients towards hospitals with
lower rates.

Navigant Page 167 of 246
In addition, an increase in the provider assessment is likely to be politically problematic. Tax
increases are never popular. Also, replacement of IGTs with a larger provider assessment will
redistribute funds, to the benefit of some hospitals and the detriment of others. In particular,
hospitals with very low Medicaid utilization may be assessed more than they receive in
payment for services rendered to Medicaid recipients. However in this case, replacement of the
LIP program with an increased provider assessment could tend to even out the burden of
funding the Medicaid program across all hospitals. Funding would not be reliant on the limited
number of public hospitals, local governments, and taxing districts that are currently
contributing non-federal portions of funds to the Medicaid program. In addition, it might
increase access to care by incenting low Medicaid volume hospitals to accept more Medicaid
patients in order to cover their cost of the provider assessment.
9.3.2 Increase General Fund Revenue
Continuing with the theme of politically problematic is the option of increasing general revenue
funds appropriated for the Medicaid program. Many providers of Medicaid services would
argue that funding the program is an obligation of the State. In addition, the State of Florida
has had budget surpluses over the last couple of years. In theory, a portion of that surplus
could be used towards increasing general revenue funding of the Medicaid program.
At the same time, Medicaid costs have been rising at rates that offer substantial risk of crippling
state budgets, thus making full funding of the state share of Medicaid programs through state
general revenue and untenable solution. In SFY 2013, the State of Florida contributed 22
percent of its general revenue funds to Medicaid, the fourth highest percentage of any state in
the country. Across the country, the average percentage of state general revenue used to fund
the Medicaid program is 14 percent.149 However, Florida’s state tax revenue per capita ranked
47th out of the 50 states in 2012 when looking only at state tax revenue. In 2012, Florida’s per
capita state tax revenue was $1,719 and the average across all states was $2,557.150 When
looking at total state and local tax revenue per capita, Florida ranked 31st out of the 50 states in
2011. In 2011, Florida’s per capita state and local tax revenue was $3,699 and the average across
all states was $4,217.151
It would be outside of the scope of this study to make to recommendations regarding how the
State of Florida allocates its tax revenue to best benefit of the citizens of Florida. We can only
offer that increases in general revenue used for the Medicaid program offer the greatest
flexibility in terms of payment distribution. General revenue funds can be used for fee-for-
service claim payments, managed care capitation payments, supplemental UPL payments, DSH
149 Percentages were derived from data in The National Association of State Budget Officers State Expenditure Report
Examining Fiscal 2012 – 2014 State Spending, (2014). 150 The Tax Foundation, “Facts and Figures 2014,” Table 4, retrieved from
http://taxfoundation.org/sites/taxfoundation.org/files/docs/Facts%20and%20Figures%202014.pdf in December, 2014. 151 The Tax Foundation, “Facts and Figures 2014,” Table 2, retrieved from
http://taxfoundation.org/sites/taxfoundation.org/files/docs/Facts%20and%20Figures%202014.pdf in December, 2014.
Navigant Page 168 of 246
payments, and supplemental payments defined through an 1115 waiver, such as a DSRIP
program or an uncompensated care pool.
9.3.3 Managed Care Assessment
The Department of Health and Human Services’ Office of Inspector General issued a report
entitled “Pennsylvania’s Gross Receipts Tax on Medicaid Managed Care Organizations Appear
to be an Impermissible Health-Care-Related Tax” (A-03-13-00201) on May 28, 2014. The report
made the following recommendations:
CMS should determine whether the tax on Medicaid MCOs is an impermissible health-
care-related tax.
CMS should clarify its policy concerning permissible health-care-related taxes with all
States.
In response to the OIG report, CMS issued State Health Official Letter SHO #14-001 on July 25,
2014, talking on the issue of health care related taxes (“provider assessment”). The letter
discussed briefly the history of health care related taxes in relation to managed care
organizations. A few key points made in that history include:
The Balance Budget Act of 1997 replaced the language referencing the term “health care
organizations” with the term “Medicaid managed care organizations.” This language
allowed states to develop an assessment for managed care organizations who dealt with
Medicaid beneficiaries only.
The Deficit Reduction Act of 2005 removed the word “Medicaid” from the description of
managed care organizations, leaving the class of providers as simply “managed care
organizations (MCOs).” This change required states that have managed care assessment
programs to assess both Medicaid MCOs and non-Medicaid MCOs.
Despite the SHO #14-001 restrictions on managed care organization taxes, the following states
are currently using some form of a tax or assessment on managed care companies/health
insurers that benefits the Medicaid agency:
Table 24. Description of managed care assessments utilized by other state Medicaid agencies
specifically on plans caring for Medicaid recipients.
State Description
California A tax on Medi-Cal managed care plans under Article 5 of the state’s sales tax
law. Article 5 Section 6174 through 6189 created a sales tax on Medi-Cal
managed care plans. With this tax, Medi-Cal managed care plans “for the
privilege of selling Medi-Cal health care services at retail, a tax is hereby
extended to all sellers of Medi-Cal managed care plans at the rate of 3.9375
Navigant Page 169 of 246
State Description
percent of the gross receipts of any seller from the sale of all Medi-Cal
managed care plans sold at retail in this state.”152 All monies that are collected
from the Medi-Cal managed care plans were deposited into Children’s Health
and Human Services Special Fund where it will be “appropriated to the State
Department of Health Care Services solely for purposes of funding managed
care rates for health care services for children, seniors, persons with
disabilities, and dual eligibles in the Medi-Cal program that reflect the cost of
services and acuity of the population served.”153
The tax included a requirement that the California Department of Health Care
Services “provider actuarially sound, monthly capitation payments” to the
Medi-Cal managed care organizations and these payments have to be
“certified as actuarially sound by State Department of health Care Services’
actuaries or contracted actuaries.”154
Because of the uncertainty of taxes levied on Medicaid managed care
companies only, the sales tax in California shall “shall be implemented only if
and to the extent that federal financial participation under Title XIX of the
federal Social Security Act (42 U.S.C. 1395 et seq.) is available and any
necessary federal approvals have been obtained” and the sales tax law “is
automatically repealed if it is delayed based upon a challenge under federal
law.” 155 Furthermore, this sales tax shall have “no force or effect if there” is
any of the following:156
1. A final judicial determination made by any state or federal court that
is not appealed, in any action by any party.
2. A final determination by the administrator of the federal Centers for
Medicare and Medicaid Services, that disallows, defers, or alters the
implementation of this article.
If there is no legal or CMS objection to the tax this tax would “become
inoperative on July 1, 2016” and repealed on January 1, 2017.157
Despite the issues raised by the OIG and responded to by CMS, California is
anticipating use of this managed care tax to save general fund monies for SFY
2014-2015. The initial Governor’s Budget stated the following:
The Budget projects net General Fund savings for the CCI of $159.4
million in 2014‑15. General Fund savings from the sales tax on
managed care organizations is included in the net savings figure.
152 California Revenue & Tax Code §6175 153 California Revenue & Tax Code §6184 154 California Revenue & Tax Code §6186 155 California Revenue & Tax Code §6187 156 California Revenue & Tax Code §6188 157 California Revenue & Tax Code §6189

Navigant Page 170 of 246
State Description
Without the tax revenue, the CCI would have a General Fund cost of
$172.9 million in 2014‑15.158
Michigan The State of Michigan reintroduced its tax on Medicaid managed care
organizations with the passage of P.A. 162 of 2014 which was signed by
Governor Rick Snyder on June 11, 2014. The use tax was effective beginning
April 1, 2014 and reinstated the 6 percent rate on “medical services provided
by Medicaid Health Maintenance Organizations (HMOs) and Prepaid
Inpatient Health Plans (PIHPs).”159
The Michigan Senate Fiscal Agency estimated the impact of the use tax at a net
of $101 million for SFY 2014 and $236 million for SFY 2015. The net amount is
after payment for increase in the managed care capitation payments and an
amount re-directed to the school aid fund.160
Missouri Missouri employs a Medicaid managed care reimbursement allowance. The
reimbursement allowance is for “the privilege of engaging in the business of
providing health benefit services in the state.”161 This reimbursement
allowance “shall be based on a formula set forth in rules, including emergency
rules if necessary, promulgated by the department of social services.”162 The
statute expires on September 30, 2015.
As with the California sales tax, the reimbursement allowance under section
208.431 “be collected by the department of social services if the federal Center
for Medicare and Medicaid Services determines that such reimbursement
allowance is not authorized under Title XIX of the Social Security Act” In
addition, the statute allows for repayment of “any Medicaid managed care
organization reimbursement allowance collected prior to such determination
shall be immediately returned to the Medicaid managed care organizations
which have paid such allowance.”163
Ohio Chapter 5739.01(11)(a) of the Ohio Revised Code requires a sales tax on “all
transactions by which health care services are paid for, reimbursed, provided,
delivered, arranged for, or otherwise made available by a Medicaid health
insuring corporation’s contract with the state.”164 Chapter 5739.01(11)(b) does
have a caveat on the as follows:
158 State of California, “Welcome to California’s Governor’s Budget 2014-2015 Proposed Budget Summary,” Page 50,
(January 10, 2014). 159 Michigan Department of Treasury HMO Use Tax Information. Downloaded from
http://www.michigan.gov/taxes/0,4676,7-238-43519-334456--,00.html 160 Michigan Senate Fiscal Agency. “Health Insurance Claim Adjustment and Use Tax S.B. 893 (S-3) & 912 (S-2) Bill
Analysis,” (May 9, 2014). 161 Missouri Revised Statutes §208.431 162 Ibid. 163 Ibid. 164 Ohio Revised Code Title 57 Chapter 5739.01(11)(a)
Navigant Page 171 of 246
State Description
If the centers for Medicare and Medicaid services of the United States
department of health and human services determines that the taxation of
transactions described in division (B)(11)(a) of this section constitutes an
impermissible health care-related tax under the "Social Security Act,"
section 1903(w), 42 U.S.C. 1396b(w), and regulations adopted thereunder,
the Medicaid director shall notify the tax commissioner of that
determination. Beginning with the first day of the month following that
notification, the transactions described in division (B)(11)(a) of this section
are not sales for the purposes of this chapter or Chapter 5741. of the
Revised Code. The tax commissioner shall order that the collection of
taxes under sections 5739.02, 5739.021, 5739.023, 5739.026, 5741.02,
5741.021, 5741.022, and 5741.023 of the Revised Code shall cease for
transactions occurring on or after that date.165
Current sales tax rate is 5.5 percent and is collected from the Buckeye Health
Plan, CareSource, Molina Healthcare, Inc., Paramount Advantage and
UnitedHealth.166
Based on the sales tax only applying to Medicaid managed care organizations
and the July 25, 2014 State Health Official Letter SHO# 14-001, the Ohio
Department of Medicaid is currently reviewing if changes need to be made to
the State’s collection of tax on managed care organizations.167
Most states, however, moved away from a tax on Medicaid managed care organizations and
adopted a tax on all health insurers that a portion or all of the tax was used to benefit the
Medicaid program. Examples of these states are as follows:
Table 25. Description of managed care assessments utilized by other state Medicaid agencies and
applied to all health insurers in the state.
State Description
Arizona Arizona Revised Statutes 20-224(B) requires the payment of a “tax of 2.0 per
cent of such net premiums.”
Louisiana The State of Louisiana has a tax on life, accident, health, or service insurance
providers. The minimum tax paid is $140 on annual gross premiums of $7,000
or less and then an additional $225 for each additional $10,000 of annual gross
revenue.168
165 Ohio Revised Code Title 57 Chapter 5739.01(11)(b). 166 Carries Ghose. “Feds scrutinizing state taxes like Ohio’s singling out Medicaid managed care,” Columbus Business First,
(September 14, 2014). 167 Ibid. 168 Louisiana Revised State Chapter 22 §842A.
Navigant Page 172 of 246
State Description
Louisiana Revised Statute Chapter 22 §842B requires “[t]axes collected under
the provision of this Section from health care premium assessments paid by
Medicaid-enrolled managed care organizations, after first having been
credited to the Bond Security and Redemption Fund as required by Article VII,
Section 9(B) of the Constitution of Louisiana, shall be deposited into the
Louisiana Medical Assistance Trust Fund.”
During state fiscal year ended June 30, 2013, the Louisiana Department of
Insurance collected $17,921,585 from the Medicaid-Enrollment Managed Care
Organizations – Bayou Health Plans169
Michigan The Health Insurance Claims Assessment Act of 2011 (P.A. 142 of 2011)
created Michigan Compiled Laws Section 550.1731 through 550.1741. The
initial purpose of the act was to collect “an assessment of 1% on that carrier’s
or third party administrator’s paid claims” for dates of services beginning on
January 1, 2012 and ending on June 30, 2014 with some exceptions detailed in
the law.170
The funds collected from this tax have to be used to “finance the expenditures
of Medicaid managed care organizations that include Medicaid contracted
health plans and specialty prepaid health plans”171 or “[t]hrough June 30, 2014,
if the assessment under this section collects revenue in an amount greater than
$400,000,000.00, adjusted annually by the medical inflation rate since 2011,
each carrier and third party administrator that paid the assessment shall
receive a proportional credit against the carrier's or third party administrator's
assessment in the immediately succeeding year.”172
The 1 percent tax under the Health Insurance Claims Assessment was reduced
to 0.75 percent beginning July 1, 2014 with the passage of P.A. 162 of 2014
which created the use tax on Medicaid managed care organizations.173 In
addition to the decrease in the tax rate for the Health Insurance Claims
Assessment, the maximum amount of receipts before carry forwards into the
next year begin was raised from $400 million to $450 million with the use tax
and HICA being combined.174
The Health Insurance Claims Assessment generated $268.45 million in
State Fiscal Year ended June 30, 2013.175 The implementation of the use
tax for Medicaid managed care services discussed previously would
169 Louisiana Department of Insurance. “2012-2013 Annual Report,” Page 187. 170 Michigan Compiled Laws Section 550.173(1) 171 Michigan Compiled Laws Section 550.1737(5)(a) 172 Michigan Compiled Laws Section 550.1733(6) 173 Michigan Department of Treasury Update on Health Insurance Claims Assessment (HICA) Act.
http://www.michigan.gov/taxes/0,4676,7-238-43519-264498--,00.html 174 Michigan Compiled Laws Section 550.1733(6) 175 Michigan Department of Treasury. “Annual Report of the Michigan State Treasurer 2012-2013,” Page 19.

Navigant Page 173 of 246
State Description
reduce the Health Insurance Claim Assessment by $77.55 million in
rate year.176
Texas The Texas Insurance Code includes two taxes that Medicaid managed care
organizations are required to pay. The first tax is a premium tax based on
gross premiums or gross revenue which include “premiums, membership
fees, assessments, dues, revenues, and other considerations received by the
insurer or health maintenance organization in a calendar year.”177 These gross
revenues and gross premiums are taxed at 0.0875% on the first $450,000 of
gross premiums and 1.75% on gross premiums above the first $450,000.178
The second tax required to be paid by Medicaid managed care organizations
in the state of Texas is a maintenance tax. The Medicaid managed care
organizations are considered health maintenance organizations and therefore
are governed by the maintenance tax prescribed under the Texas Insurance
Code §258. Under this tax, a per capita maintenance tax at a “rate of
assessment set by the commissioner” that “may not exceed $2 per enrollee” on
an annual basis.179
The administrative potion of rates set for STAR+PLUS managed care entities
include an allowance for these taxes. Premium rates for STAR+PLUS managed
care entities include a premium tax (1.75%) and a maintenance tax ($0.1025 for
each PMPM).180
For State Fiscal Year 2014, the insurance premium tax collected $1.811 billion
and the insurance maintenance tax collected $83.188 million which were
deposited into the general fund. A portion of these taxes are diverted to the
Texas Health and Human Service Commission to reduce the agency’s impact
on the traditional sources of funding in the General Fund. During the
managed care expansion as part of the 2012-2013 biennial, HHSC estimated
that $238 million in increased revenue would be generated to relieve
commitments from pre-existing general fund sources.181
CMS has detailed a methodology for including any health insurance related tax that is paid by
Medicaid managed care organizations that would allow these Medicaid MCOs to be paid for
176 Michigan Senate Fiscal Agency. “Health Insurance Claim Adjustment and Use Tax S.B. 893 (S-3) & 912 (S-2) Bill
Analysis,” (May 9, 2014). 177 Texas Insurance Code §222.002 178 Texas Insurance Code §222.003 179 Texas Insurance Code §258.003 180 Even L. Dial. “State of Texas Medicaid Managed Care STAR+PLUS Program Rate Setting State Fiscal Year 2014,”
Prepared for Texas Health and Human Services Commission, (July 11, 2013). 181 Texas Health and Human Services Commission, “Health and Human Services System Consolidated Budget for Fiscal
Year 2012-2013,” Table IV.3.

Navigant Page 174 of 246
the tax. In October 2014, CMS issued a frequently asked questions memo related to the Section
9010 of the Affordable Care Act’s health insurance provider fees and the impact on Medicaid
managed care organizations. CMS stated that “this fee, like other similar fees, should be
considered a business cost to health plans.” The same logic would exist in a state generated tax
causing the managed care organizations to potentially be held harmless if the tax is under 6
percent of net revenues, and broad based, and assessed in a uniform manner.
9.3.4 Continue Inter-Governmental Transfers
IGTs currently generate a significant portion of funding for the Florida Medicaid program. In
SFY 2012/13, $1.2 billion in IGT dollars were contributed to the Florida Medicaid program,
which funded 44 percent of the state share of hospital reimbursements and 26 percent of the
state share of the Medicaid program overall.182 These percentages are relatively unchanged in
SFY 2013/14 and 2014/15.
IGTs fund a portion of the state share for claim payments and fund nearly the entire state share
of the LIP program. In SFY 2014/15, approximately $270 million will be contributed through
automatic IGTs to help fund the state share of claim payments in the FFS and managed care
programs. IGTs also fund approximately 98 percent of the “traditional” $1 billion in the LIP
program and fund all of state share of “LIP 6” (formerly “self-funded IGTs”)183. IGTs for the
physician supplemental payment program and a small amount of general revenue comprise the
rest of the state share for the SFY 2014/15 LIP program.
These very sizeable IGT contributions have evolved because the payment distribution methods
have ensured local governments and public hospitals receive measureable benefit from their
contributions. At a minimum, the LIP program ensures IGT contributors receive back their
money plus an 8.5 percent usage fee for all money contributed toward funding the state’s share
of the traditional $1 billion LIP program and automatic rate enhancements applied to claim
payments. In addition to the usage fee, many, but not all hospitals, receive benefit from
increased rates through automatic rate enhancements and supplemental payments through
various sub-programs defined within the LIP program. Lastly, contributors to LIP 6 receive
back their contribution plus the entire federal share related to that contribution.
As long as such clear benefits are available to contributors of IGTs, it is safe to assume the
contributors will continue to make these funds available. If the LIP program continues in the
future, it can continue to distribute funds generated through IGT contributions. If on the other
hand, the LIP program is discontinued, other payment methods will need to be devised to
ensure continued Medicaid funding through IGT contributions.
182 Includes funding for hospital fee-for-service rates, managed care capitation rates, LIP supplemental payments and
DSH supplemental payments. 183 Note that Florida began referring to the “self-funded IGT” program as the “LIP 6” program starting in SFY
2014/2015.

Navigant Page 175 of 246
Without a waiver for the LIP program, the transition to managed care in Florida will continue to
“shrink” the available gap between FFS claim payments and the Medicare UPL, which in turn
will limit the amount of federal matching funds that can be generated through IGTs. It simply
will not be possible to sustain the same funding levels using IGTs without the waiver. At the
same time, some states have preserved the use of IGTs through the creation of DSRIP programs,
although as described in Chapter 7 of this report, even with DSRIP waivers, states need to be
able to demonstrate budget neutrality, so there are some financial constraints.
This is an option several other states, such as California, Texas, and New York, have chosen to
enable supplemental payments (or DSRIP incentive payments) to continue while most of the
recipients are enrolled in Medicaid managed care programs. DSRIP programs tie distribution
of funds to quality measures, so hospitals would not be guaranteed payment in the same way
they are today within the Florida LIP program. Hospitals would need to reach pre-determined
milestones in order to receive full payment. In addition, California and Texas have
uncompensated care pools. Uncompensated care pools could provide another avenue for
distribution of IGT funds, if approved by CMS.
The benefits to public hospitals, local governments, and taxing districts who contribute IGTs
would not necessarily need to be as great as they are today to create sufficient incentive for IGTs
to continue. IGTs increase the state share and enable significant federal funds to flow into the
state. So there is clear benefit for IGTs to continue. However, payment methods will need to be
defined in ways that offer direct, identifiable benefit to IGT contributors. Without that,
administrators of public hospitals, local governments, and taxing districts will be unable to
justify to their constituents donation of local tax revenue to the state Medicaid program.
9.3.5 Medicaid Expansion – Funding
Coming up with the state share of funding for Medicaid expansion is a critical concern for states
deciding whether or not to implement. While the Federal government promises to supply all of
the funding for the first three years of expansion, the states are required to contribute a steadily
increasing percentage which reaches 10 percent by FFY 2020 and continues at 10 percent
through the rest of the initially designated period (with the federal government paying the
other 90 percent). An obvious concern for state governments is the question of how long the
FMAP for the expansion population will remain at 90 percent. With a 90 percent FMAP, there is
certainly temptation to find ways to fund the 10 percent state share in order to bring a very
significant amount of additional federal funds into the state. However, if the FMAP percentage
reduces over time, the costs to the state can increase significantly.
By SFY 2022/23, the Florida SSEC estimates the additional state costs from Medicaid expansion
to be $953 million and continuing annually around that level, with adjustments for inflation and
Medicaid utilization. This estimate assumes a 90 percent FMAP for the expansion population.
Figure 27 below shows how the amount of state share for the expansion population changes if
the FMAP gets reduced below 90 percent. These numbers use estimates of expansion costs to
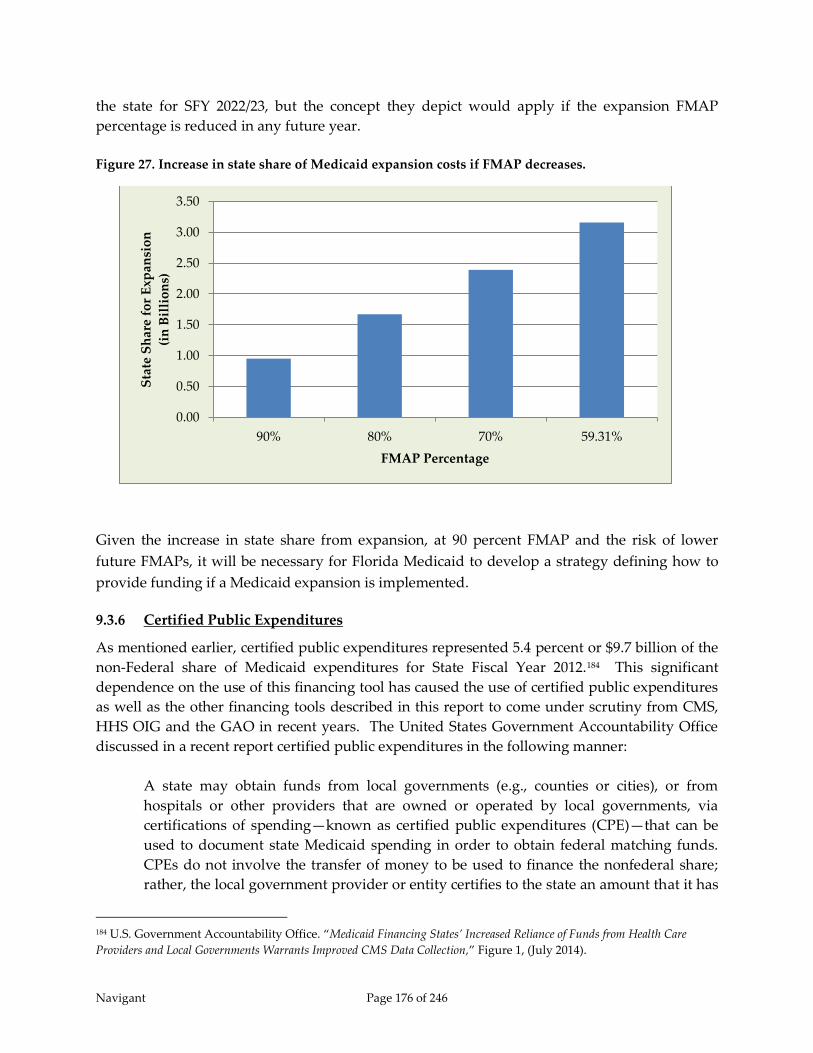
Navigant Page 176 of 246
the state for SFY 2022/23, but the concept they depict would apply if the expansion FMAP
percentage is reduced in any future year.
Figure 27. Increase in state share of Medicaid expansion costs if FMAP decreases.
Given the increase in state share from expansion, at 90 percent FMAP and the risk of lower
future FMAPs, it will be necessary for Florida Medicaid to develop a strategy defining how to
provide funding if a Medicaid expansion is implemented.
9.3.6 Certified Public Expenditures
As mentioned earlier, certified public expenditures represented 5.4 percent or $9.7 billion of the
non-Federal share of Medicaid expenditures for State Fiscal Year 2012.184 This significant
dependence on the use of this financing tool has caused the use of certified public expenditures
as well as the other financing tools described in this report to come under scrutiny from CMS,
HHS OIG and the GAO in recent years. The United States Government Accountability Office
discussed in a recent report certified public expenditures in the following manner:
A state may obtain funds from local governments (e.g., counties or cities), or from
hospitals or other providers that are owned or operated by local governments, via
certifications of spending—known as certified public expenditures (CPE)—that can be
used to document state Medicaid spending in order to obtain federal matching funds.
CPEs do not involve the transfer of money to be used to finance the nonfederal share;
rather, the local government provider or entity certifies to the state an amount that it has
184 U.S. Government Accountability Office. “Medicaid Financing States’ Increased Reliance of Funds from Health Care
Providers and Local Governments Warrants Improved CMS Data Collection,” Figure 1, (July 2014).
0.00
0.50
1.00
1.50
2.00
2.50
3.00
3.50
90% 80% 70% 59.31%
Sta
te S
har
e fo
r E
xpan
sio
n
(in
Bil
lio
ns)
FMAP Percentage
Navigant Page 177 of 246
expended for Medicaid covered services provided to Medicaid beneficiaries. A CPE
represents the total costs (both the federal and the nonfederal share) incurred for the
Medicaid services. The state has the flexibility to send the federal matching funds it
receives to the local government or local government provider that certified the
expenditure or may retain some or all of those funds.185
Certified public expenditures have several advantages over the other financing tools discussed
in this report. Some of these advantages are as follows:
1. Inter-governmental transfers require the public provider or local government
transferring on behalf of the health care provider to send funds to the Medicaid agency
for the Medicaid agency to pull the corresponding Federal dollars for the allowable
expenditure. The entire computable expenditure must be paid to the health care
provider under intergovernmental transfers. As stated above, the certified public
expenditure represents both the Federal and non-Federal share of the total computable
expenditure. The Medicaid agency receives the Federal share from the grant award and
CMS considers the expenditure paid. The Medicaid agency has complete discretion on
how to spend the Federal portion on the expenditure although the manner of its use is
usually defined in a contract between the health care provider and the Medicaid agency.
2. Health care-related taxes may be applied to only permissible classes listed in 42 CFR
§433.56. Certified Public Expenditures are governed by 42 CFR §433.51 which requires
that “the actual expenditures incurred by the contributing unit of government in
providing services to eligible individuals receiving medical assistance or in the
administration of the State Plan.”
3. Health care-related taxes have a hold harmless provision where certified public
expenditures have no such hold harmless provision.
Several states have adopted certified public expenditures as a financing tool within the
Medicaid program. A summary of several states using certified public expenditures is shown in
Table 26.
185 US GAO, “Medicaid Financing – States’ Increased Reliance on Funds from Health Care Providers and Local Governments
Warrants Improved CMS Data Collection (GAO-14-627),” Page 7-8, (July 2014).
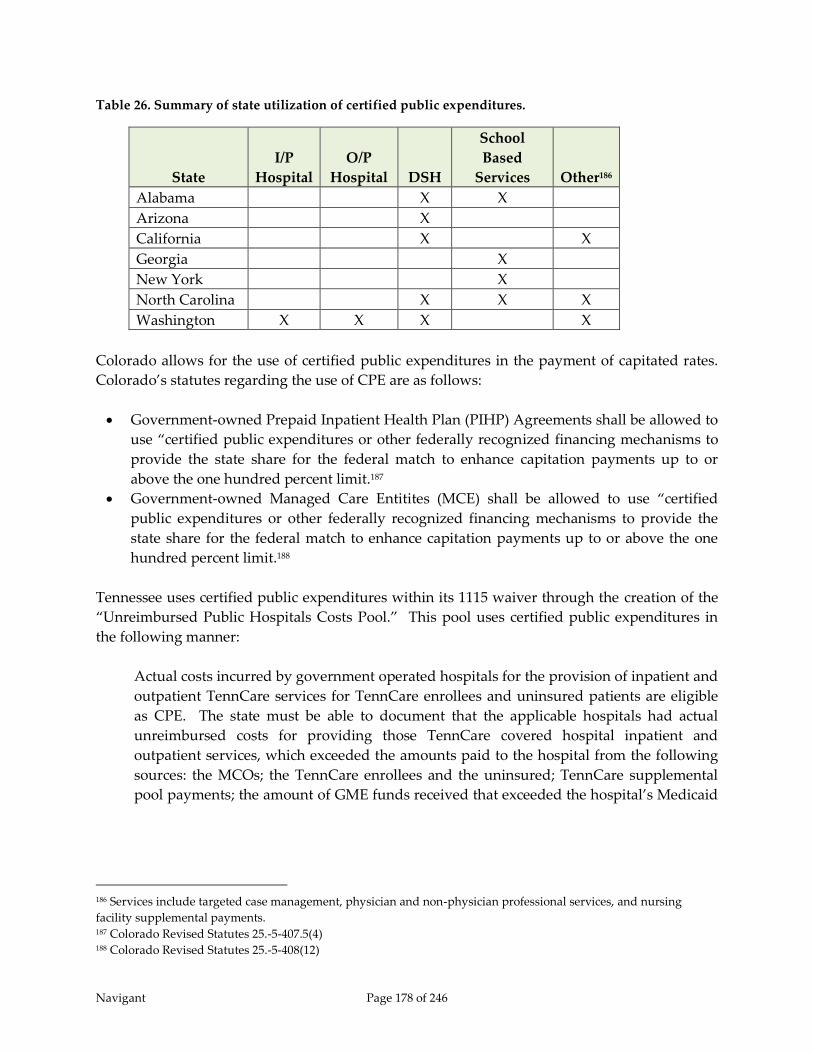
Navigant Page 178 of 246
Table 26. Summary of state utilization of certified public expenditures.
State
I/P
Hospital
O/P
Hospital DSH
School
Based
Services Other186
Alabama X X
Arizona X
California X X
Georgia X
New York X
North Carolina X X X
Washington X X X X
Colorado allows for the use of certified public expenditures in the payment of capitated rates.
Colorado’s statutes regarding the use of CPE are as follows:
Government-owned Prepaid Inpatient Health Plan (PIHP) Agreements shall be allowed to
use “certified public expenditures or other federally recognized financing mechanisms to
provide the state share for the federal match to enhance capitation payments up to or
above the one hundred percent limit.187
Government-owned Managed Care Entitites (MCE) shall be allowed to use “certified
public expenditures or other federally recognized financing mechanisms to provide the
state share for the federal match to enhance capitation payments up to or above the one
hundred percent limit.188
Tennessee uses certified public expenditures within its 1115 waiver through the creation of the
“Unreimbursed Public Hospitals Costs Pool.” This pool uses certified public expenditures in
the following manner:
Actual costs incurred by government operated hospitals for the provision of inpatient and
outpatient TennCare services for TennCare enrollees and uninsured patients are eligible
as CPE. The state must be able to document that the applicable hospitals had actual
unreimbursed costs for providing those TennCare covered hospital inpatient and
outpatient services, which exceeded the amounts paid to the hospital from the following
sources: the MCOs; the TennCare enrollees and the uninsured; TennCare supplemental
pool payments; the amount of GME funds received that exceeded the hospital’s Medicaid
186 Services include targeted case management, physician and non-physician professional services, and nursing
facility supplemental payments. 187 Colorado Revised Statutes 25.-5-407.5(4) 188 Colorado Revised Statutes 25.-5-408(12)
Navigant Page 179 of 246
GME expenditures; any DSH payments received; and other sources (except for local
government indigent care funds).189
States have learned to use the flexibility of certified public expenditures to help meet the needs
of both health care providers and the Medicaid agency. Health care providers are able to
receive reimbursement above normal claims payments without the Medicaid agencies needing
to use general funds for the allowable expenditures. In addition, some Medicaid agencies keep
portions of the CPE federal matching funds for use in paying for health care services beyond
those certified by the public facility.
9.3.7 Designated State Health Program
Designated State Health Programs (DSHPs) have become a common source of funding for
States under 1115 waivers. These programs are “health programs funded entirely by the state,
many of which provide safety-net health care services for low-income or uninsured individuals
such as adult day care, outpatient substance abuse treatment, or care for the mentally ill who
are not eligible for Medicaid.”190 The key component of DSHP is that a state uses existing
programs that traditionally were not available for Federal match and receives Federal dollars.
The State continues to pay for the programs as they have in the past, and the state can pull
down federal matching funds that can be used for reforms defined under an 1115 waiver.
The following are examples of how DSHP is implemented in various states:
California Bridge to Reform Demonstration (11-W-00193/0) – effective November 1, 2010
The California Health and Human Services Agency uses DSHP expenditures to assist in
the funding of the Safety Net Care Pool program by using expenditures for medical care
from the following programs: Breast and Cervical Treatment Program (BCCTP);
Medically Indigent Adults/Long-Term Care (MIA/LTC) Program; California Children’s
Services (CCS) Program; Genetically Handicapped Persons Program (GHPP); Expanded
Access to Primary Care (EAPC); AIDS Drug Assistance Program (ADAP); Department
of Development Services (DSS); and County Mental Health Services. In addition to the
above expenditures, California is allowed to use expenditures for workforce
development programs related to medically disadvantaged service areas in the
following programs: Song Brown HealthCare Workforce Training; Health Professions
Education Foundation Loan Repayment; Mental Health Loan Assumption; and training
programs for medical professionals at California community colleges, California State
Universities and the University of California.191
189 CMS Approval Letter for amendment to TennCare II (Project No. 11-W-00151/4) 1115 demonstration letter, Page
71, (September 5, 2014). 190 Alexandra Gates, Robin Rudowitz, and Jocelyn Guyer (Kaiser Family Foundation), “An Overview of Delivery System
Reform Incentive Payment (DSRIP) Waivers,” (September 29, 2014). 191 CMS Expenditure Authority Letter, California Bridge to Reform Demonstration (11-W-00193/9), Page 4-5.
Navigant Page 180 of 246
The FFP annual limit on DSHP expenditures for Medi-Cal is $400 million for
demonstration years covering SFY 2010 through SFY 2015.
New York Federal-State Health Reform Partnership (F-SHRP) 1115 – effective October 1,
2006
The State of New York’s F-SHRP 1115 waiver used programs from certain Health Care
Reform Act (HCRA) programs and certain programs “administered by other State
agencies such as the offices of Mental Health, Mental Retardation and Developmental
Disabilities, Aging, Alcohol and Substance Abuse Services and Children and Family
Services” that are not Medicaid services and do not qualify for standard Medicaid
Federal matching. The State of New York was entitled to draw $300 million of Federal
funds each year of the demonstration to use as the State share for other expenditures
under the 1115 waiver.192
Oregon Health Plan (21-W00031/10 and 11-W00160/10) – effective July 5, 2012
Oregon Health Authority is allowed to use expenditures from the following programs as
DSHP funds available to draw down Federal funds under the waiver: Alcohol and
Drug; Adults and People with Disabilities; Addictions & Mental Health; Children,
Adults and Families; Client Process Monitoring System; Division of Medical Assistance
Programs; Express Payment and Reporting System; Oregon State Public Health Lab;
Oregon Medical Insurance Pool; Public Health Division; Statewide Financial
Management System; and Seniors and People with Disabilities.193
The maximum limit on the Federal Fund Participation for DSHP in Oregon is as follows:
Demonstration Year 1 & 2: $230 million annually, Year 3: $108 million, and Year 4 & 5:
$68 million annually.194
9.4 Options for Payment Methods
9.4.1 Continue the LIP Program
As mentioned in previous sections, Florida Medicaid receives a relatively small amount of
federal funds for the DSH program as compared to other states. To a degree, the LIP program
helps offset Florida’s low DSH funding by providing other funding that helps offset hospital
costs for care to the uninsured. However, the LIP program does not go through the same level
of oversight as the DSH program. Both the LIP and DSH programs have a requirement that
total reimbursement to hospitals should not exceed hospital cost to treat Medicaid and
192 New York Department of Health, “Federal-State Health Reform Partnership (F-SHRP) Overview,” (June 2007). 193 CMS Amended Waiver List and Expenditure Authority, Oregon Health Plan (OHP) (21-W-00013/10 and 11-W-
00160/10), Attachment G. 194 CMS Amended Waiver List and Expenditure Authority, Oregon Health Plan (OHP) (21-W-00013/10 and 11-W-
00160/10), Table 4.

Navigant Page 181 of 246
uninsured recipients. Under the DSH program, annual audits of hospital cost are performed to
ensure this requirement is met. Audits are not performed for the LIP program. Instead, costs
self-reported by hospitals are used to ensure total reimbursement is within applicable hospital
costs. If more program oversight and control is added to the LIP program, and greater
transparency is provided related to the levels of funding and payment occurring through the
LIP program and IGT-funded rate enhancements, perhaps continuation of the LIP program
would be considered a viable option by CMS.
Improved transparency of funds flow would be helpful because of the complexity of the current
program. The overlap between distribution of LIP funds and IGT-funded automatic rate
enhancements creates some complexity that makes tracking of funds flow more difficult. The
LIP program is part of an 1115 waiver and is managed separately from claim payments.
However, the LIP Council, which determined distribution of LIP funds also determined
distribution of automatic rate enhancements, which are distributed with claim payments. In
addition, the hold-harmless provision that guarantees hospitals receive back their contributions
plus 8.5 percent is handled through supplemental payments in the LIP program, even though
some of their IGT contributions are used as state share in funding automatic rate enhancements.
Inclusion of separately negotiated self-funded IGTs further compounds the complexity of
Florida Medicaid hospital funding and payment mechanisms.
To fully monitor the flow of Medicaid reimbursements to hospitals, a combination of claim
payments and supplemental payments needs to be reported. Separately, AHCA monitors claim
payments and supplemental payments in detail. However, few, if any standard reports show
the combination of both at the individual hospital level. Creating such reports would be
relatively easy for AHCA as they already monitor both types of payments. Combining more
comprehensive payment reports with data on the source of funding at the hospital level, would
significantly increase transparency within the program. Combining this with better reporting
and auditing standards for hospital costs (similar to the reporting and auditing standards
established for the DSH program), instead of reliance on hospital self-reporting, and assuring
that payments will not exceed allowable costs, could potentially be sufficient for CMS to
reconsider the appropriateness of continuing the LIP program. And, given the lead time
required to design and implement many of the other options described in this report, being able
to preserve much of what already is in place with the current LIP program makes it an
attractive option.
9.4.2 Increase Medicaid Fee-for-Service Program Rates and Medicaid Managed Care
Capitation Rates
One of the more administratively straight forward options for distributing funds that have
previously been distributed through the LIP program is to increase Medicaid FFS rates for
inpatient and outpatient hospital services. Such rate increases would ultimately translate into
increases to the Medicaid managed care capitation rates for both inpatient and outpatient
hospital services. Such increases could be made in a way that maintains budget neutrality of
overall Medicaid spending across inpatient and outpatient hospital services, by simply shifting
Navigant Page 182 of 246
the current levels of supplemental payments distributed through the LIP program into claim-
based or capitation-based payments. For services provided under the FFS program, the claim
payment increases would be made directly from AHCA to the hospitals. For inpatient and
outpatient hospital services provided through the Medicaid managed care plans, the increased
rates could be translated into larger capitation rates from Medicaid to the managed care plans,
which would generally be passed on from the managed care plans to hospitals.195
Increases to FFS rates for Medicaid inpatient and outpatient hospital services are limited by
federal UPL regulations, which generally specify that Medicaid programs cannot pay more than
what Medicare would pay for the same services. This same limitation also indirectly affects
how much can be added to the managed care capitation rates. Medicaid managed care
capitation rates must meet a standard of actuarial soundness, which is determined by the State’s
designated actuary. Generally, actuarial soundness means that the capitation rates must be
appropriate for the populations covered by the plans and the services to be furnished. While
capitation rates may not be directly related to FFS payment levels, we assume that the State’s
actuary does consider what would be paid for services provided to the Medicaid managed care
populations when establishing capitation rates.
We believe there is an opportunity to increase both the FFS rates and the capitation rates, which
can both be used to distribute some of the funding currently distributed though the LIP
program. However, the traditional $1 billion LIP program amounts are intended to compensate
hospitals for both the unfunded gap between Medicaid and Medicare payments as well as to
partially offset the hospital costs associated with providing services for uncompensated care
populations. As discussed previously, adding the entire $1 billion LIP program amount into the
FFS and capitation rates would exceed allowable reimbursement levels under the FFS UPL rules
and potentially the principles associated with capitation rate actuarial soundness. As a result, if
this option was selected, some funds from the LIP program may need to be held out of the FFS
rates (and indirectly the capitation rates) and potentially distributed through other means.
Making some increases to FFS rates can provide some flexibility to the State as far as directing
Medicaid funds to certain providers. Similar to what is done today with inpatient fee-for-
service payments, the rates can be set by category of hospital to account for justifiable variations
in cost structures and different levels of Medicaid utilization. Today, separate fee-for-service
inpatient payment rates exist for rural hospitals, free-standing long-term acute care hospitals,
free-standing rehabilitation hospitals, and hospitals with very high Medicaid utilization and
very high outlier payments. In addition, GME and DSH payments can continue to be made
separately.
This option has the distinct advantage of being rationally based, and would be consistent with
the U.S.C. § 1396 (a)(30)(A) standards related to efficiency and economy, and adequate access to
195 We are assuming most negotiated rates between managed care plans and hospitals are based on the Agency’s fee-
for-service rates.

Navigant Page 183 of 246
quality care, a requirement for CMS. We assume that CMS would also consider this option
attractive because it more closely aligns payments with Medicaid patient utilization than does
the current LIP funding distribution method. The bulk of the hospitals’ reimbursement would
be tied to patient utilization, as was the case in SFY 2013/14 when 84 percent of total hospital
reimbursement was utilization based. In SFY 2014/15, this amount dropped to 70 percent196
because self-funded IGTs shifted from claim payments to supplemental LIP payments.
In addition, this option has the advantage of enabling the managed care plans the flexibility to
offer stronger quality-based financial incentives as the plans generally will have more control
over all payments related to the managed care population. This option allows for greater
payments made to hospitals from the plans and less made through supplemental payments
directly from AHCA to hospitals. This would give the plans greater purchasing power and a
greater ability to implement value-based purchasing strategies that could help reduce
unnecessary utilization and lower overall cost to the Medicaid program.
As clear as the advantages are to this option, there are equally clear disadvantages. The
primary concern with this option relates to the source of the funding. This option could be
designed with much more fair and even distribution of funds across all hospitals based on
services provided to Medicaid recipients, for example, through an across-the-board
proportional increase to the FFS rates (which would presumably translate to higher capitation
rates as well). However, under current funding mechanisms, this approach will result in the
IGT contributors (counties, hospital districts, etc.) contributing funds that would be spread
across the entire state, with little or no control over what funding comes back to the specific
jurisdictions who provided the funds. This easily could result in local governments choosing to
keep their funds within their local area instead of offering the funds to the Medicaid program
through IGTs, even at the risk of giving up the federal matching funds that have been generated
through these programs. At the same time, it should be noted that although state Medicaid
agencies generally may not dictate how the Medicaid managed care plans distribute funds to
participating providers, we do know that hospital providers in some states have successfully
established arrangements that allow supplemental funding streams to be redistributed between
hospitals after payments are received from the managed care plans. It should also be noted that
these types of “back door” redistribution arrangements have typically been established without
any state involvement.
Another way to implement this option is to set different rates for different hospitals based on
the amount of IGT funds contributed on the hospitals’ behalf. This rate setting method would
be very similar to what was done in SFY 2013/14 when most Medicaid payments were made
through the FFS program. However, this option might give managed care organizations
incentives to direct Medicaid patients towards hospitals with lower rates thus reducing
utilization and reimbursement levels at hospitals in the jurisdictions that contribute IGTs.
196 The percentages of payments based on Medicaid utilization assume all fee-for-service and managed care
capitation payments are based on Medicaid utilization and all LIP payments are not based on utilization. Also, these
estimates exclude GME payments, DSH payments, and physician supplemental payments.

Navigant Page 184 of 246
Again, the result could be local governments choosing to keep their funds within their local area
instead of offering the funds to the Medicaid program through IGTs.
The option of increasing claim payment rates for both fee-for-service and Medicaid managed
care creates a risk of reduced IGT contributions, which could result in reductions in the overall
state share of funding available for Medicaid hospital reimbursement. As a result, this option is
likely only viable if coupled with a shift in funding to a broad-based increase in the provider
assessment (which would replace the need to rely on voluntary contributions from other
governmental entities) or an increase in State general revenue funds applied to the Medicaid
program.
9.4.3 Delivery System Reform Incentive Payment Program
In most, if not all, DSRIP programs, funds are distributed through incentive payments outside
of claim payments and outside of managed care capitation payments. Payments are made
directly from Medicaid agencies to providers.
Similar to Florida’s current LIP program, if a DSRIP program is funded primarily with IGTs,
one would expect the projects selected and the distribution of funds would be primarily to
those who contributed the IGTs. Given the influx of federal matching dollars for the IGTs, some
funds could be set aside specifically for projects operated by non-public hospitals. This is done
in New York, for example. Alternatively, projects could be required to be defined in such a way
that project teams include both public and private institutions. Hospitals in similar geographic
locations that offer similar service lines may consider each other as competitors and have a
difficult time forming partnerships for DSRIP programs. However, hospitals that are
geographically separate, or offer different service lines may find these arrangements easier to
develop. The free-standing children’s hospitals, for example, may be able to develop
partnerships because they offer care for severely ill or injured children that other hospitals do
not necessarily offer. Similarly, an arrangement for placement of residents may provide an
opportunity for a public teaching hospital, which does have access to IGTs, and a private
hospital, which does not have access to IGTs, to form a partnership.
While defining a DSRIP program, payments are generally held at current levels and using
current distribution methods to allow time for providers to transition into the new fund
distribution mechanisms. In addition, most DSRIP programs set milestones in the first two or
three years of the program to be based primarily on meeting predetermined program
requirements and achieving milestones related to process improvement and system redesign.
Starting in year three and continuing in subsequent years, the payments shift to being tied more
to outcome measures related to improvement in quality of care and/or reduction in health care
costs.
Calculation of specific payment amounts can be determined using a variety of factors.
Certainly, in later years of the DSRIP program, levels of completion of milestones should be
considered, likely with tiers defined allowing for higher levels of payment for higher levels of

Navigant Page 185 of 246
success in pre-defined milestones. In addition, some DSRIP programs set aside money to
reward projects that succeed beyond expectations. For example, New Jersey funds a program
called Universal Performance Pool (UPP) which is available to hospitals that successfully
maintain or improve on a subset of DSRIP performance indicators. Similarly, New York plans
to set aside some DSRIP funds for a performance pool available to providers that exceed the
stated quality improvement goals.
Like all programs that include incentive or other types of supplemental payments, a balance has
to be struck between fairness and administrative simplicity. The payment methods need to be
robust enough to fairly reward those who meet or exceed program goals. At the same time,
administrative simplicity and transparency of the payment calculations increases
understanding of how incentive payments are determined, a critical component of facilitating
buy-in from all of the many critical stakeholders affected by the projects, including CMS.
9.4.4 Medicaid Expansion – Payments
In theory, payments for the expansion population could be defined differently than payments
for the non-expansion population. However, we don’t see any particular value in defining
separate payment methods. On the contrary, we would expect folding an expansion population
into existing Medicaid payment methods offers the greater simplicity and administrative ease.
In addition, in the case of Florida, where most recipients are enrolled in managed care plans,
enrolling the expansion population in Medicaid managed care would give the managed care
organizations greater purchasing power and more ability to manage cost through value-based
purchasing strategies.
We do not expect that Medicaid expansion would do away with uncompensated care entirely,
so we would hope the DSH program could continue even if Florida decided to undergo
expansion. Florida’s DSH allotment is currently unusually small given the size of the state’s
uninsured population. Expansion would succeed in making the current DSH allotment in
Florida more reasonable for the population it serves.
The LIP program on the other hand, could justifiably be reduced if the number of uninsured
reduced significantly through expansion. Recent Upper Payment Limit calculations show that
the LIP program is contributing towards care of the uninsured, particularly in the public
hospitals which receive the bulk of the LIP funding. For example, when looking at the UPL
calculations for SFY 2013/14, the last year Florida Medicaid was primarily a fee-for-service
program, the Non-State, Government Owned hospital category had a UPL gap of only $18
million, whereas the Privately Owned hospital category had a UPL gap of $480 million.
Although no formal distinction is made, one might imply from these numbers that payments
from the traditional $1 billion LIP program to Non-State, Government Owned hospitals
primarily contribute to those hospitals’ costs of caring for the uninsured. Payments from the
traditional $1 billion LIP program to Privately Owned hospitals primarily contribute to the gap
between Medicaid reimbursement and the Upper Payment Limit. (This assertion assumes
Navigant Page 186 of 246
payments from the LIP program are applied first to the UPL gap and secondly to
uncompensated care.)
9.4.5 Upper Payment Limit Program for Fee-for-Service Eligibles
Upper Payment Limit programs are generally supplemental payment programs where
payments are made outside of the claims-based payment process, generally made in the form of
lump sum amounts (e.g., quarterly payments for trauma service providers). These UPL
payments are commonly made to as a way for a state to direct funding to specific types of
providers outside of the claims-based payment methodology, and are typically targeted to
providers that are critical for maintaining adequate access to services for the Medicaid
population (e.g., safety net hospitals). Such payments are eligible for federal match as long as,
when combined with all other payment sources, payments do not exceed the Medicare UPL
(which is the maximum amount that a Medicaid program can pay).
Generally, UPL payment programs are difficult to maintain when states transition to fully
capitated managed care models. This is because states are not allowed to make payments
directly to hospitals for services provided to Medicaid-eligible individuals that are enrolled in
Medicaid managed care programs. In other words, with few exceptions, all payments to
hospitals for services provided as part of Medicaid managed care programs must be made by
the managed care plans. States make PMPM capitation rate payments to the Medicaid plans –
and the plans are responsible for negotiating contracts with participating hospitals and making
payments in accordance with those contracts.
Further, as states transition to capitated managed care models, the Medicare Upper Payment
Limit “gap”, or the difference between what Medicare would pay for services and what is
actually paid for by Medicaid, gets smaller. This is because the Medicare Upper Payment Limit
“gap” can be determined based on the service payments associated with the FFS population
only.
As such, Florida’s opportunity for UPL payments is growing smaller.
With the transition to a Medicaid managed care model, Florida’s Statewide Managed Care
(SMMC) Managed Medical Assistance (MMA) program now only has the following individuals
who are not required to participate and who are not eligible to participate, and whose payments
will continue through the FFS program:197
197 AHCA. “A Snapshot of the Florida Medicaid Managed Care”
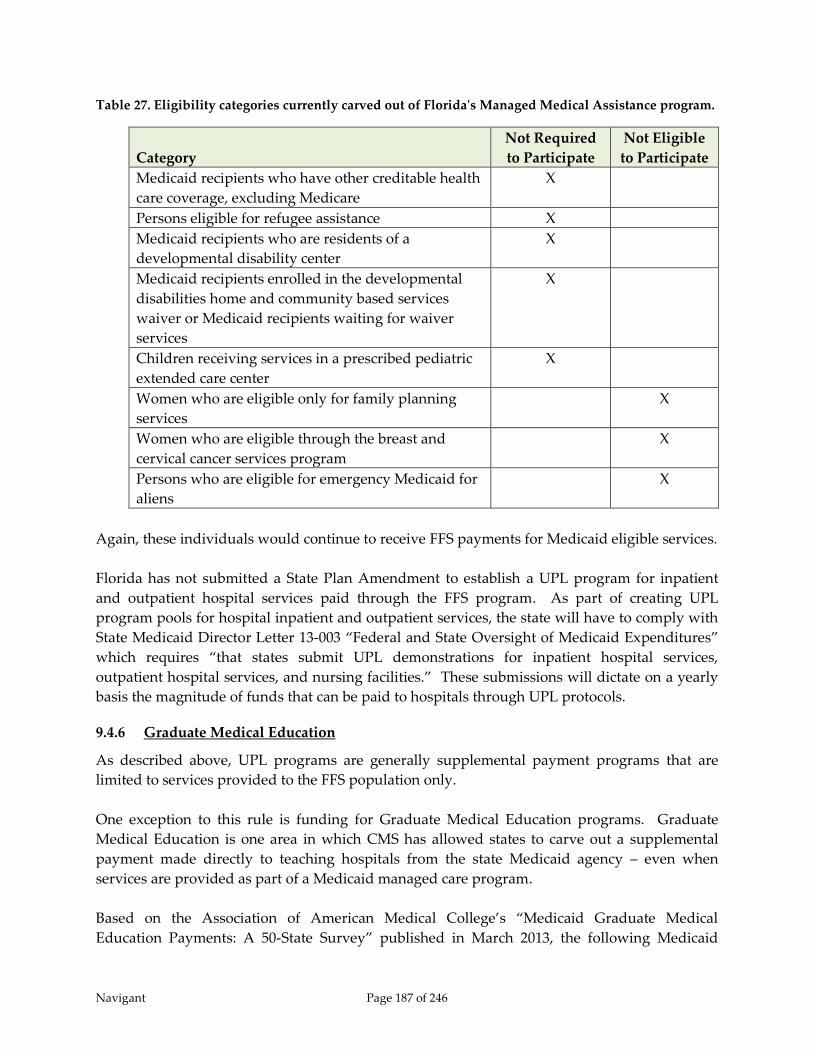
Navigant Page 187 of 246
Table 27. Eligibility categories currently carved out of Florida's Managed Medical Assistance program.
Category
Not Required
to Participate
Not Eligible
to Participate
Medicaid recipients who have other creditable health
care coverage, excluding Medicare
X
Persons eligible for refugee assistance X
Medicaid recipients who are residents of a
developmental disability center
X
Medicaid recipients enrolled in the developmental
disabilities home and community based services
waiver or Medicaid recipients waiting for waiver
services
X
Children receiving services in a prescribed pediatric
extended care center
X
Women who are eligible only for family planning
services
X
Women who are eligible through the breast and
cervical cancer services program
X
Persons who are eligible for emergency Medicaid for
aliens
X
Again, these individuals would continue to receive FFS payments for Medicaid eligible services.
Florida has not submitted a State Plan Amendment to establish a UPL program for inpatient
and outpatient hospital services paid through the FFS program. As part of creating UPL
program pools for hospital inpatient and outpatient services, the state will have to comply with
State Medicaid Director Letter 13-003 “Federal and State Oversight of Medicaid Expenditures”
which requires “that states submit UPL demonstrations for inpatient hospital services,
outpatient hospital services, and nursing facilities.” These submissions will dictate on a yearly
basis the magnitude of funds that can be paid to hospitals through UPL protocols.
9.4.6 Graduate Medical Education
As described above, UPL programs are generally supplemental payment programs that are
limited to services provided to the FFS population only.
One exception to this rule is funding for Graduate Medical Education programs. Graduate
Medical Education is one area in which CMS has allowed states to carve out a supplemental
payment made directly to teaching hospitals from the state Medicaid agency – even when
services are provided as part of a Medicaid managed care program.
Based on the Association of American Medical College’s “Medicaid Graduate Medical
Education Payments: A 50-State Survey” published in March 2013, the following Medicaid
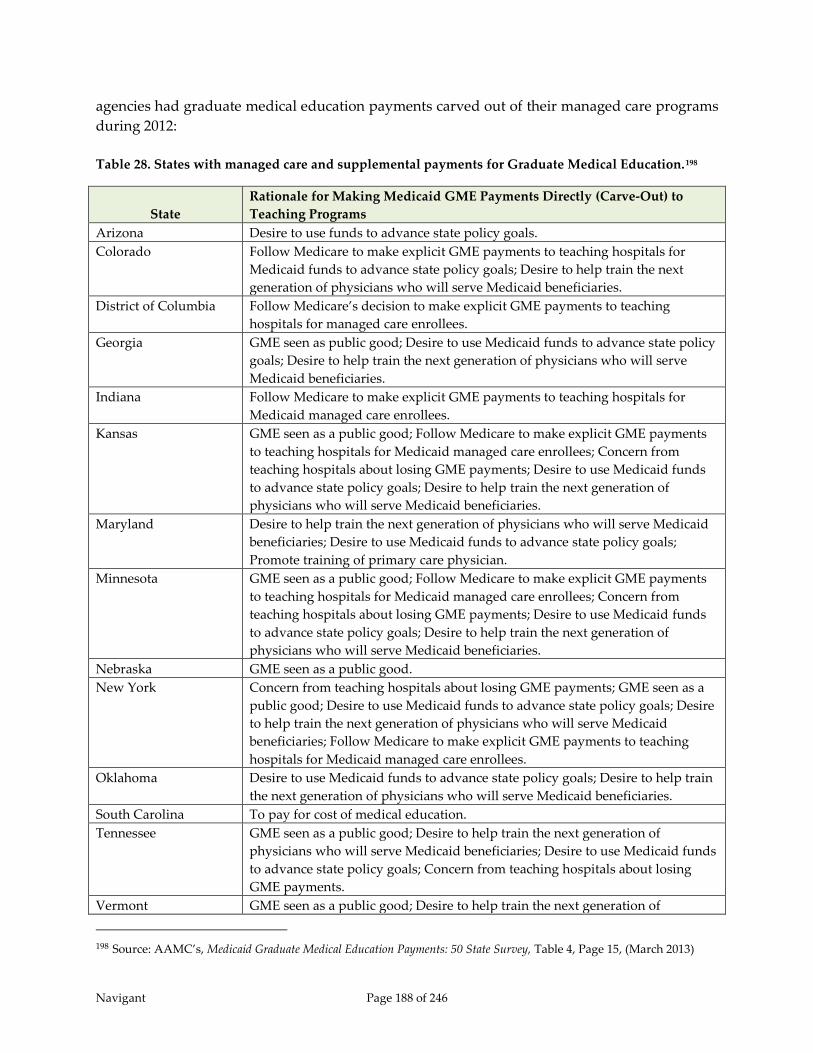
Navigant Page 188 of 246
agencies had graduate medical education payments carved out of their managed care programs
during 2012:
Table 28. States with managed care and supplemental payments for Graduate Medical Education.198
State
Rationale for Making Medicaid GME Payments Directly (Carve-Out) to
Teaching Programs
Arizona Desire to use funds to advance state policy goals.
Colorado Follow Medicare to make explicit GME payments to teaching hospitals for
Medicaid funds to advance state policy goals; Desire to help train the next
generation of physicians who will serve Medicaid beneficiaries.
District of Columbia Follow Medicare’s decision to make explicit GME payments to teaching
hospitals for managed care enrollees.
Georgia GME seen as public good; Desire to use Medicaid funds to advance state policy
goals; Desire to help train the next generation of physicians who will serve
Medicaid beneficiaries.
Indiana Follow Medicare to make explicit GME payments to teaching hospitals for
Medicaid managed care enrollees.
Kansas GME seen as a public good; Follow Medicare to make explicit GME payments
to teaching hospitals for Medicaid managed care enrollees; Concern from
teaching hospitals about losing GME payments; Desire to use Medicaid funds
to advance state policy goals; Desire to help train the next generation of
physicians who will serve Medicaid beneficiaries.
Maryland Desire to help train the next generation of physicians who will serve Medicaid
beneficiaries; Desire to use Medicaid funds to advance state policy goals;
Promote training of primary care physician.
Minnesota GME seen as a public good; Follow Medicare to make explicit GME payments
to teaching hospitals for Medicaid managed care enrollees; Concern from
teaching hospitals about losing GME payments; Desire to use Medicaid funds
to advance state policy goals; Desire to help train the next generation of
physicians who will serve Medicaid beneficiaries.
Nebraska GME seen as a public good.
New York Concern from teaching hospitals about losing GME payments; GME seen as a
public good; Desire to use Medicaid funds to advance state policy goals; Desire
to help train the next generation of physicians who will serve Medicaid
beneficiaries; Follow Medicare to make explicit GME payments to teaching
hospitals for Medicaid managed care enrollees.
Oklahoma Desire to use Medicaid funds to advance state policy goals; Desire to help train
the next generation of physicians who will serve Medicaid beneficiaries.
South Carolina To pay for cost of medical education.
Tennessee GME seen as a public good; Desire to help train the next generation of
physicians who will serve Medicaid beneficiaries; Desire to use Medicaid funds
to advance state policy goals; Concern from teaching hospitals about losing
GME payments.
Vermont GME seen as a public good; Desire to help train the next generation of
198 Source: AAMC’s, Medicaid Graduate Medical Education Payments: 50 State Survey, Table 4, Page 15, (March 2013)

Navigant Page 189 of 246
State
Rationale for Making Medicaid GME Payments Directly (Carve-Out) to
Teaching Programs
physicians who will serve Medicaid beneficiaries; Desire to use Medicaid funds
to advance state policy goals.
Virginia Do not want managed care to disadvantage teaching hospitals
The State of Florida already has a graduate medical education supplemental payment program
documented under State Plan Attachment 4.19-A Section VII – Statewide Medicaid Residency
Program. The goal of the program is “to improve the quality of care and access to care for
Medicaid recipients, expand graduate medical education on an equitable basis, and increase the
supply of highly trained physicians statewide.”
Each hospital’s reimbursement under the Statewide Medicaid Residency Program contains a
ceiling of $50,000 per resident. If a hospital’s calculated amount per resident exceeds $50,000
then that hospital will not receive additional reimbursement. The reimbursement that hospital
would have received will be allocated between the hospitals whose allocated amount per
resident was below the $50,000 per resident threshold.
The 2013 cost reports for Florida hospitals participating in this program indicate per resident
costs noticeably higher than the current Florida Medicaid $50,000 per resident threshold. The
following is a listing of a portion of the Florida hospitals qualifying for GME supplemental
payments:
Table 29. Cost per resident at seven sample Florida teaching hospitals based on cost reports files with
fiscal year ending in 2013.
Hospital
Allowable
Direct
GME199
Allowable
Indirect
GME200 Total Cost
Total
Resident
FTEs201
Cost Per
Resident
University of Miami Hospital & Clinics
$3,477,134 $3,477,134 41.46 $83,867
University of Miami Hospital
$10,042,216 $10,042,216 97.01 $103,517
Orlando Health $30,442,121 $6,358,285 $36,800,406 247.00 $148,990
Tampa General Hospital $24,156,004 $14,418,760 $38,574,764 268.17 $143,844
St. Petersburg General $2,730,060 $1,101,270 $3,831,330 39.07 $98,063
Florida Hospital $13,803,028 $15,650,976 $29,454,004 137.13 $214,789
Broward Health Medical Center $5,676,531 $501,510 $6,178,041 97.16 $63,586
199 CMS Form 2552-10 Worksheet B Part I Line 118 Column 21 200 CMS Form 2552-10 Worksheet B Part I Line 118 Column 22 201 CMS Form 2552-10 Worksheet S-3 Part I Line 14 Column 9

Navigant Page 190 of 246
As shown above, hospitals incur costs related to teaching interns and residents that are
substantially above the Statewide Medicaid Residency Program cap. In addition, using
Medicare policies as a model, there is room to increase GME payments to teaching hospitals,
since the amount paid by Florida to hospitals on a per intern and resident basis is significantly
lower than the amount allowed under the Medicare program. The state could increase its per
resident cost cap amount and shift current inter-governmental transfer payments made to
teaching hospitals under the LIP program to the Statewide Medicaid Residency Program.
Funding for this change could come from inter-governmental transfers that are currently being
used to support other payments within the LIP program for the teaching hospitals.
The advantage of this option is that CMS has already approved a graduate medical education
supplemental payment program for Florida and allows other states the same option – even in a
Medicaid managed care model. In addition, this option complies with the State of Florida’s
desire to ensure that doctors are properly trained and available to become contracted providers
with the Medicaid program to ensure proper access to care for Medicaid beneficiaries.
A constraint with graduate medical education programs is the inclusion of the payments as a
Medicaid payment within the calculation of the hospital specific disproportionate share hospital
limit for each hospital. As payment increases are made and the use of inter-governmental
transfers for the non-Federal share of the payment increase, these additional payments increase
the chances of a hospital exceeding its hospital specific DSH limit because the payment must be
treated as the Federal funds plus the inter-governmental transfer used as the state share.
Therefore, a hospital could exceed its hospital specific DSH limit based on monies that were
originally the hospitals or another local governmental entity that paid on behalf of the hospital.
Creating a component of a DSRIP for graduate medical education could eliminate this
constraint by structuring the payment program in a way that would waive the DSH limit, and
allow for federal matching funds related to the payment for this purpose outside of the
requirements of the DSH audit.
9.4.7 Disproportionate Share Hospital Payments
The Disproportionate Share Hospital (DSH) payment program was created with the Omnibus
Budget Reconciliation Act of 1981 allowing for the additional payment to hospitals which
“serve a disproportionate number of low income patients with special needs.” In practice, the
DSH program has become a tool in which Medicare and Medicaid can compensate hospitals
that treat a large volume of uninsured patients. Hospitals receive DSH payments separately
from Medicare and Medicaid.
We certainly recommend continuing the DSH program within Florida Medicaid as long as
possible. The DSH program is funded primarily by a combination of IGTs and CPEs, so the
program is not consuming a significant amount of state general revenue. Unfortunately, we do
not see increasing the DSH program as a viable option. Medicaid Voluntary Contribution and
Provider-Specific Tax Amendments of 1991 (P.L. 102-234) capped federal funding for Medicaid

Navigant Page 191 of 246
DSH payments as of 1993. The original state DSH allotments provided in FFY 1993 were based
on each state’s FFY 1992 DSH payments. In FFY 1992, some states provided relatively more
DSH payments to hospitals, and, as a result, these states locked in relatively higher Medicaid
DSH allotments. Other states made relatively fewer DSH payments, and these states locked in
relatively lower DSH allotments.
This disparity still remains to some extent in current DSH allotments because DSH allotments
are not distributed according to a formula based on the number of DSH hospitals in a state or
the amount of hospital services these hospitals provide to low-income patients. Efforts have
been made over time to reduce the disparity in DSH allotments by providing larger annual
increases to DSH allotments for states that initially made fewer DSH payments and limiting the
growth of DSH allotments for states that initially provided relatively more DSH payments.
In FY 1992, Florida was not a heavy user of the DSH program, so its federal DSH allotment was
capped at a relatively low level. Even with adjustments that have occurred since the early
1990’s the disparity remains.
In addition to being capped in 1993, the more recently passed ACA includes stipulations to
reduce DSH payments further in the near future. Originally, the DSH reductions were set to
begin in FFY 2014, but have been delayed until the start of FFY 2016.
9.4.8 Uncompensated Care Pool
The State of Florida is tied for the 17th largest DSH allotment for FY 2014 at $213 million while
being the 5th largest Medicaid agency based on the most recent expenditures reported by CMS.
Two other states that rank high on the list of DSH allotments and total Medicaid spending,
California and Texas, have created uncompensated care pools as part of their managed care
programs.
The State of California’s current Safety Net Care Pool program consists of an uncompensated
care pool that pays out approximately $8 billion over 5 years to reimburse uncompensated care
cost at designated public hospitals. For 2013 and 2014, the program was amended to allow for
payments to certain Indian Health Service providers. In addition to the designated public
hospitals, approved designated state health programs can participate in the pool.202 This
program is in addition to the Disproportionate Share Hospital program where the State of
California has a federal allotment of $1.169 billion for Federal Year 2014.
The State of Texas received approval in December 2011 for an 1115 waiver entitled “Texas
Healthcare Transformation and Quality Improvement Program” that also included the
establishment of an uncompensated care pool. The purpose of this pool is to “defray the actual
202 California Department of Health Care Services, California Bridge to Reform Section 1115 Demonstration Fact Sheet,
downloaded from http://www.medicaid.gov/Medicaid-CHIP-Program-Information/By-
Topics/Waivers/1115/downloads/ca/ca-bridge-to-health-reform-fs.pdf in November 2014.
Navigant Page 192 of 246
uncompensated cost of medical services that meet the definition of ‘medical assistance’
contained in 1905(a) of the Act, that are provided to Medicaid eligible or uninsured individuals
incurred by hospitals, clinics, or other provider types…”203 As long as payments under the
uncompensated care pool and through Disproportionate Share Hospital payments do not
exceed the total hospital specific DSH limit when combined with interim payments through fee
for service and managed care payments, a hospital may receive payments from both programs.
The State of Tennessee also recently obtained approval from CMS for elimination of its DSH
program and shift of its DSH allotment into an existing program known as the Essential Access
Hospital Pool.
The State of Florida could potentially follow the Tennessee model and request to combine LIP
and DSH into a single uncompensated care pool. Or Florida could potentially following the
California and Texas models and request an uncompensated care pool along with a DSRIP
program in an 1115 waiver. To gain approval in today’s environment, the uncompensated care
pool would likely need to be more tied to utilization of services by the uninsured than is
currently done with the LIP program.
9.4.9 Physician Supplemental Program
The State of Florida had a supplemental program that ended on June 30, 2014. Starting on July
1, 2014, SFY 2014/15, this program has been moved within the LIP program so that the
supplemental payments could continue even though the volume of FFS recipients, and thus, the
size of the UPL gap, has decreased. The program supports teaching physicians affiliated with a
public university system medical school or a private medical school that had 50 percent of
residents placed in a public hospital. As stated previously, supplemental payment programs
governed by the rules of upper payment limits cannot exist in a managed care environment.
Therefore finding options to continue the $204 million (total computable) program is essential to
maintain current reimbursement levels to these providers.
Many other states struggle with this funding issue as they continue their transitions from
traditional FFS delivery models to fully capitated Medicaid managed care models. The states of
Texas and Washington are two where solutions are being sought to preserve, or even expand,
this important funding stream. For example, Texas has an 1115 waiver designed to address this
issue through an uncompensated care pool. The objective of the uncompensated care pool with
the Texas 1115 waiver is to allow physicians to be reimbursed for the uncompensated care for
Medicaid eligible beneficiaries and uninsured individuals. With regard to the changes to
supplemental physicians’ payments in Texas, the Texas Health and Human Services
Commission issued the following question and answers, which offer specifics about the
program:204
203 Texas Health and Human Services Commission, Waiver No. 11-W-00278/6 entitled “Texas Healthcare Transformation
and Quality Improvement Program,” Page 34. 204 Texas Health Care Transformation and Quality Improvement Program – FAQ (http://www.hhsc.state.tx.us/1115-
faq.shtml)

Navigant Page 193 of 246
Will HHSC still pay supplemental payments for services provided by physician
practice groups under the 1115 waiver?
Uncompensated care payments under the waiver may cover the unmet cost of providing
physician services to Medicaid patients and uninsured patients. HHSC will seek
clarification from CMS as to whether payments out of the pool may be made to
qualifying physician practice groups where appropriate.
Will the payments still be calculated based on 145 percent of the Medicare rate?
Uncompensated care payments under the waiver will be limited to the cost of providing
services, and therefore the current physician supplemental funding methodology using
145 percent of the Medicare rate will no longer be used. However, HHSC will compute
transition payment caps for the first year based on historical Physician UPL payments.
The State of Florida could incorporate the existing $204 million program into the calculation of
an uncompensated care pool as long as that option is deemed acceptable to CMS.
Uncompensated care pools approved recently by CMS have been coupled with implementation
of a DSRIP program. Similarly, CMS might require a DSRIP program to be implemented if it
allows for an uncompensated care pool.
Given that the current Florida physician supplemental payment program is funded through the
use of IGTs, the new program could still use IGTs for establishing the payments for physicians
affiliated with a public university system medical school or a private medical school that has 50
percent of residents placed in a public hospital.
As another example, Washington Medicaid has established a professional supplemental
payment program for University of Washington (UW) Medicine, which comprises two hospitals
that are large state-owned and operated hospitals (University of Washington Medical Center
and Harborview Medical Center) and a large physician practice group (University of
Washington Physicians). Physicians who are a part of University of Washington Physicians are
considered employees of UW Medicine, and therefore of the State, which enables the use of an
IGT model for the physician supplemental payment program.
When this program was first implemented, funding was initially limited to the physician UPL
gap associated with only services provided as part of the FFS program. Recently, Washington
expanded the program to also take advantage of the “imputed” gap associated with the
capitated managed care population - a program that was recently approved by CMS. This new
expansion was also funded through the use of IGTs, whereby UW Medicine funds the state’s
portion of an increase in the actuarially sound capitation rates paid to the Medicaid managed
care plans that contract with UW Medicine. Although the State cannot direct how those plans
contract with or otherwise pay UW Medicine for their enrollees, it is our understanding that,

Navigant Page 194 of 246
with the cooperation and brokering efforts of the Washington State Hospital Association on
behalf of UW Medicine, funds are being distributed by the plans to the hospitals in a way that is
satisfactory to all parties involved.
Another option for maintaining supplemental payments to teaching physicians if the LIP
program goes away would be to move these payments into the GME program. There is
precedent for CMS allowing GME supplemental payments to continue as these payments are
associated with the cost of teaching medical students, and not associated with the care of
Medicaid recipients. Similarly, the teaching physician supplemental payment program helps
offset costs of physicians instructing medical students.
9.4.10 Transition Period
Regardless of funding and payment methods chosen, any major change in reimbursement
should be accompanied by a transition period. Medicare applies transition periods on payment
formula changes, often by blending payment amounts from the older and newer payment
methods for a period of three or four years. Similarly, many Medicaid agencies have
implemented a transition period when shifting from an older inpatient payment method, such
as per diem, to a newer inpatient payment method, such as Diagnosis Related Groups (DRGs).
Often this is done by controlling the hospital base rates in order to buffer changes in individual
hospital reimbursement levels for some period of time. We believe a replacement of the LIP
program would also warrant a transition period if the replacement results in significant changes
in Medicaid reimbursement to individual hospitals.
Specifically for Florida, continuation of the LIP program or creation of some other form of IGT-
funded supplemental payments is appropriate to allow hospitals time to adjust to whatever is
installed in the longer term as a replacement of the current LIP program.
9.5 Combination of Various Options
9.5.1 Introduction
In general, we can categorize the funding options described previously as either broad-based or
qualified. The broad-based funding options include increasing the provider assessment
(PMATF), creating a managed care assessment, and increasing general revenue for the Medicaid
program. The more qualified funding options include continued use of IGTs and, potentially,
expansion of CPEs. These categorizations have as much to do with how the funds are allocated
across hospitals in Florida as they are related to who is contributing the funding. With the
broad-based funding methods, Florida Medicaid would have significantly more flexibility with
how the funds that are generated are ultimately distributed to providers. Without the
dependence on providers eligible for contributing the State’s share of funding, there could be
less of a tie between payment allocation and source of funding. Payment allocation could be
focused on achieving Florida Medicaid’s overall policy priorities, such as rewarding those
providers who make a commitment to serving Medicaid and uninsured patients.
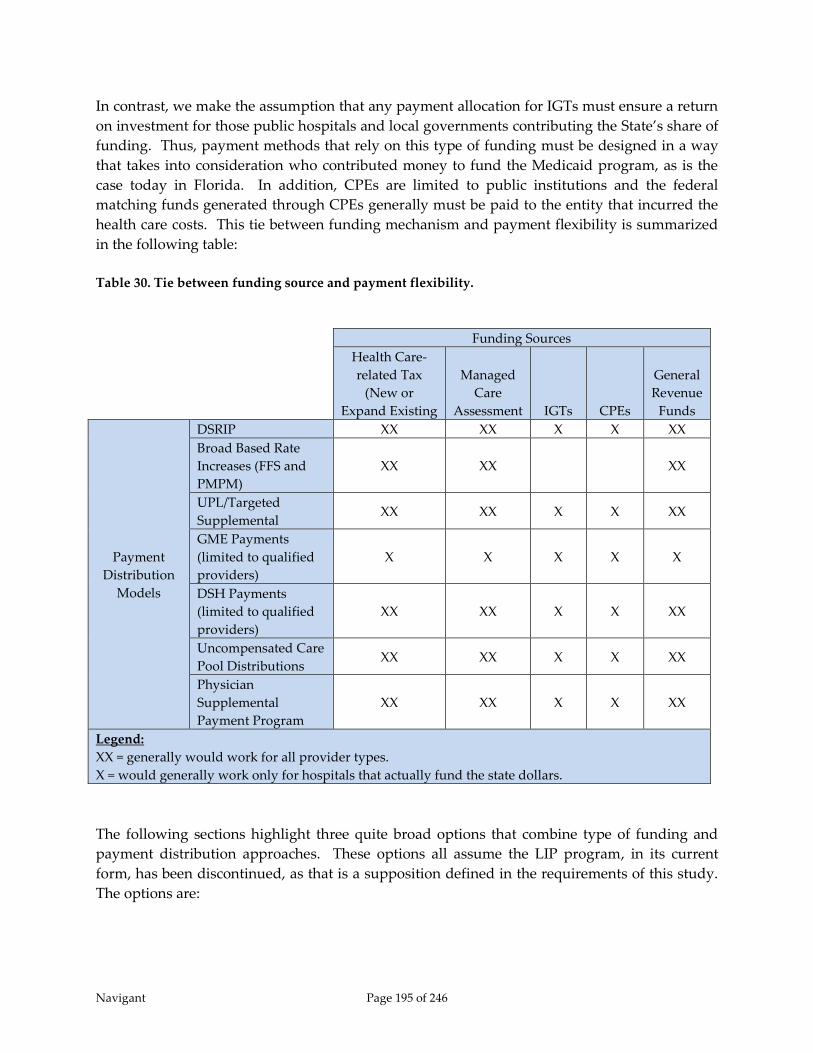
Navigant Page 195 of 246
In contrast, we make the assumption that any payment allocation for IGTs must ensure a return
on investment for those public hospitals and local governments contributing the State’s share of
funding. Thus, payment methods that rely on this type of funding must be designed in a way
that takes into consideration who contributed money to fund the Medicaid program, as is the
case today in Florida. In addition, CPEs are limited to public institutions and the federal
matching funds generated through CPEs generally must be paid to the entity that incurred the
health care costs. This tie between funding mechanism and payment flexibility is summarized
in the following table:
Table 30. Tie between funding source and payment flexibility.
The following sections highlight three quite broad options that combine type of funding and
payment distribution approaches. These options all assume the LIP program, in its current
form, has been discontinued, as that is a supposition defined in the requirements of this study.
The options are:
Funding Sources
Health Care-
related Tax
(New or
Expand Existing
Managed
Care
Assessment IGTs CPEs
General
Revenue
Funds
Payment
Distribution
Models
DSRIP XX XX X X XX
Broad Based Rate
Increases (FFS and
PMPM)
XX XX XX
UPL/Targeted
Supplemental XX XX X X XX
GME Payments
(limited to qualified
providers)
X X X X X
DSH Payments
(limited to qualified
providers)
XX XX X X XX
Uncompensated Care
Pool Distributions XX XX X X XX
Physician
Supplemental
Payment Program
XX XX X X XX
Legend:
XX = generally would work for all provider types.
X = would generally work only for hospitals that actually fund the state dollars.

Navigant Page 196 of 246
1) Fully replace the funds currently used for the LIP program with a broad-based funding
source and an increase in fee-for-service and capitation rates;
2) Continue current level of IGTs, design, and implement a large DSRIP program;
3) Expand the Florida Medicaid program through the ACA combined with either a broad-
based funding source or IGTs for funding for the existing Medicaid population.
For illustrative purposes, these options describe all-encompassing funding methods for the
funds currently used within the LIP program. One option replaces all of the LIP funds, which
are almost entirely IGTs, with a broad-based funding method. Another option continues to use
IGTs as the source for all of the funds. In reality, there are a multitude of variations that could
be applied related to these combinations of funding and payment. Of course, if both types of
funding are implemented the benefits and limitations of each method will apply.
In the discussion of these options, we consider current federal and state regulations as well as
precedent related to what CMS has approved recently in 1115 demonstration waivers. We also
consider the ability of each option to maintain current program-wide payment levels to
hospitals and teaching physicians. In addition, we consider the potential to maintain payment
levels for individual hospitals and teaching physicians similar to what is provided today. (For
teaching physicians, discussion in this study relates only to the supplemental payments made
through the LIP program. There is no consideration of physician fee-for-service rates.) With
the exception of uncompensated care pools, all payment methods have constraints that will
likely result in limited redistribution of funds at the individual hospital level. Even so, there are
ways in which each option could be implemented to help mitigate changes in reimbursement
for individual facilities.
All options discussed could, in theory, maintain an overall Medicaid funding level at or above
what exists today. However, to do so, a federal waiver will be needed for distribution of some
of the funds. As mentioned earlier in this chapter, the current level of payments exceeds the
Medicare upper payment limit and is helping reimburse costs not only for care of Medicaid
recipients, but also for care of uninsured patients. Maintaining a payment level above the UPL
would require a federal waiver. Although the UPL only applies to the fee-for-service program,
we assume payments reaching the upper payment limit are also the maximum that would be
considered actuarially sound within the Medicaid managed care program.
Note that several of these options include some type of DSRIP design and implementation as a
component part. While CMS is increasingly using DSRIP programs to provide funding for
health reform and transformation to states using 1115 Demonstration Waivers as the vehicle for
this funding, the DSRIP landscape is rapidly evolving. Our firm is having ongoing discussions
with CMS and the National Governors Association about DRSIP funding as a part of our work
in other states, and the flow of information is rapid and changing. In particular, it should be
noted that program design and related terms and conditions for states that have received DSRIP
funding in prior years should not necessarily be indicative of CMS’ willingness to approve
similar terms and conditions in other states considering DSRIP programs. Consistent with the

Navigant Page 197 of 246
intent of 1115 Demonstration Waivers, CMS is looking for innovative models intended to
transform health care delivery. Simply replicating another state’s model may not be consistent
with CMS’ overall objectives in this regard.
9.5.2 Increase in Broad-Based Funding and Increased Rates
As described previously, broad-based funding sources include a provider assessment, a
managed care organization assessment, and state general revenue. Use of any one, or a
combination of these three funding sources to replace the $1.03 billion (state share only) from
IGTs funding the LIP program and automatic rate enhancements in SFY 2014/15 could be used
to maintain program-wide hospital reimbursement levels while increasing Florida Medicaid’s
flexibility on how those funds are distributed.
If a broad-based funding mechanism is used, AHCA and the Florida Legislature would be able
to distribute these funds in a manner consistent with the overall policy objectives of the
program. There would generally be less of a need to directly link the payments to the
contributions. Thus, the funds could be distributed in a way that ties to services provided to
Medicaid recipients and that ties to promotion of access to quality care. One way to do this
would be through an increase in fee-for-service and capitation rates. We make the assumption
that these increases would also translate into increases in rates paid by Medicaid managed care
plans to hospitals based on Florida Statute 409.975(6) – “Provider Payment” which sets
minimum and maximum Medicaid managed care rates based on agency fee for service rates:
“Managed care plans and hospitals shall negotiate mutually acceptable rates, methods,
and terms of payment. For rates, methods, and terms of payment negotiated after the
contract between the agency and the plan is executed, plans shall pay hospitals, at a
minimum, the rate the agency would have paid on the first day of the contract between
the provider and the plan. Such payments to hospitals may not exceed 120 percent of
the rate the agency would have paid on the first day of the contract between the
provider and the plan, unless specifically approved by the agency. Payment rates may
be updated periodically.”205
With this option that increases broad-based funding, the current inpatient DRG payment
method would likely need to be adjusted to direct more money to categories of hospitals
deemed critical to the Medicaid program including statutory teaching, rural, safety net, trauma,
and large children’s hospitals. Some logic of this type is already built into the current DRG
payment method, but not enough to mimic the benefits these hospitals currently receive
through the LIP program. The LIP program has several small sub-programs in a grouping
referred to as “Special LIP” that target money to these specific categories of hospitals. In
addition, the allocation of automatic IGT funds also targets these specific categories of hospitals.
Also the current LIP program provides greater benefit to those with access to IGTs, which in
205 Florida general laws, Section 409.975(6), Retrieved August 19, 2014 from http://www.leg.state.fl.us/statutes/,
Chapter 409.

Navigant Page 198 of 246
many cases are public and safety net hospitals. To highlight this point, the benefit certain
categories of hospitals are predicted receive through the LIP program in SFY 2014/15 is shown
in Table 31.
Table 31. Net gain from IGT contributions and the LIP program in SFY 2014/15.
Provider Category
Net Gain
from IGT
Contributions
Number of
Hospitals
in Category
Average Gain
Per Hospital
Statutory Teaching $682,327,258 11 $62,029,751
Trauma $1,015,445,509 23 $44,149,805
Safety Net $905,234,085 22 $41,147,004
Children $116,658,481 4 $29,164,620
Public $310,981,163 28 $11,106,470
For Profit $314,292,767 116 $2,709,420
General Acute $227,641,506 101 $2,253,876
Rural $21,487,504 29 $740,948
Long Term Acute Care $0 19 $0
State-Owned Psychiatric $0 4 $0
Free-Standing Rehabilitation $0 13 $0
Notes:
1) Hospitals may be included in more than one category in this table.
2) Net gain equals payment through the LIP program (including LIP 6) minus
IGTs contributed to fund the LIP program.
Adjustments to the current inpatient DRG payment method, and potentially to the outpatient
payment method, could help maintain benefits to individual categories of hospitals currently
afforded through the LIP program. Particularly for the inpatient DRG payment method, this
could be obtained reasonably easily by resetting policy adjustors. However, adjustments in
payment rates by category of hospital should be done sparingly as differing rates between
hospitals may create incentives for managed care organizations to direct Medicaid recipients
towards facilities with the lower rates. Thus, the new payment method would not likely
distribute funds exactly the way they are distributed today.
In terms of program-wide funding, this option will allow for payments up to the Medicare
upper payment limit. Although the UPL only applies to payments made under the FFS
program, we assume payments reaching the FFS upper payment limit would also be
representative of payment levels expected to be achieved under Medicaid managed care, and
which would ultimately translate into actuarially sound capitation rates. However, current
payment levels are over the upper payment limit at a program-wide level when including
payments made under the 1115 waiver through the LIP program. Thus, with this option,
additional funds would have to be distributed outside of fee-for-service rates and capitation
payments to maintain reimbursement equal to current-day levels. But an advantage of this
option is that the amount of funds needed to be paid through other mechanisms would be
Navigant Page 199 of 246
relatively small in comparison to overall hospital reimbursements made by the Medicaid
program.
These other payment mechanisms could include reinstitution of supplemental payments under
the UPL program, an increase in GME payments, and a DSRIP program. UPL supplemental
payments could be made to individual hospitals so long as such payments do not exceed the
UPL limit for the hospital’s UPL class when aggregated with all other fee-for-service payments
made to hospitals in that same UPL class. Payments would not necessarily need to be directed
to hospitals in whose name IGTs were contributed because the funding is not coming from
voluntary IGTs. In addition, using Medicare per resident amounts as a model, there is room to
increase GME payments to teaching hospitals, since the amount paid by Florida to hospitals on
a per intern and resident basis is significantly lower than the amount allowed under the
Medicare program.
Unfortunately, we do not expect the UPL program and increased GME payments will cover the
entire difference between amounts that could be made available through new rate payments
and current reimbursement levels. The LIP program helped fund cost of care to the uninsured
which cannot be covered through UPL and GME payments. As a result, payments defined
through an 1115 demonstration waiver will likely still be needed, and potentially could be
established using a DSRIP program and possibly an uncompensated care pool. If that proves
true, it might be most administratively prudent to pursue a relatively simple and targeted
DSRIP program. Under this option, the amount of funds being distributed through the DSRIP
program might be relatively small, and might not warrant a large, complex program.
Alternatively, instead of a DSRIP program, these funds potentially could be set aside for a
program-wide quality incentive program, similar to what is done in the State of Maryland.
Comparisons of quality measures across hospitals, such as readmissions, complications,
avoidable emergency department visits, etc… could be performed with the funds distributed to
those hospitals that exceed predetermined benchmarks for the selected quality measures.
Another less complex option would be an uncompensated care pool which pays out these funds
based on a percentage of uncompensated care provided at each hospital in the State, similar to
programs established in other states that have high federal DSH allotments.
This option, an increase in broad-based funding and an increase and FFS and capitation rates
would not necessarily replace teaching physician supplemental payments that currently exist
within the LIP program. Under this option, replacement of the teaching physician
supplemental payments if the LIP program is discontinued potentially could be accomplished
through a DSRIP program or through an increase in GME payments, if acceptable to CMS.
9.5.3 Continued Use of IGTs and a DSRIP Program
Understandably, increases in broad-based funding may not be a preferred option for the State
as this approach may involve increases in uses of tax or assessment revenue. An option on the
other side of the spectrum is continuation of funding a significant portion of Medicaid
reimbursements to hospitals with IGTs. With this option, we assume payment methods will
Navigant Page 200 of 246
need to be designed in ways that ensure contributors of IGTs receive more benefit from their
contributions than they would receive from keeping their local tax dollars within their
geographic region.
Ensuring such incentives is not likely to be possible using only claim-based payment rates. If an
attempt was made to accomplish these incentives with claim-based payment rates, many
hospitals in the state would need to be assigned their own payment rate. And the disparity in
rates across hospitals for the same service would be significant in many cases. This would
create strong and unwanted incentives for managed care organizations to direct recipients
towards lower cost (lower rate) hospitals whenever possible, and is an option for which it may
be difficult to obtain CMS SPA approval.
Potentially a better payment solution with this funding option might be constructing a DSRIP
program, possibly accompanied with an uncompensated care pool. To ensure IGT funding, the
quality and health care delivery initiatives defined under the DSRIP program would likely need
to focus on hospitals for which the IGTs were contributed. The initiatives could still involve
multiple hospitals and non-hospitals, but each initiative would likely have a primary provider
and that provider might need to be a hospital for which IGTs were contributed. It is expected
that these would generally be public hospitals, but could also be private hospitals in counties or
local taxing districts that have agreed to contribute IGTs in the name of the private hospital. As
with the LIP program, not all funds would go to these hospitals. DSRIP programs reach beyond
hospitals to other entities that can affect health care transformation, and it is likely that DSRIP
incentive payments would likely be earmarked for non-hospital entities as well. In addition,
payments would not be guaranteed as they are today under the LIP program. Providers within
a DSRIP project, both hospital and non-hospital, would need to meet the projects’ objectives to
receive all the DSRIP funding.
New York Medicaid’s DSRIP model initiatives, for example, include a primary provider and
other affiliated providers. New York’s program does not allow stand-alone providers to apply
for DSRIP funds independently. To be eligible, providers must form “Performing Provider
System” (PPS) coalitions comprised of a lead provider and component providers, which must
participate in programs across three domains that focus on broad system transformation and
collaboration. 206
As described in Chapter 7 – Delivery System Reform Incentive Payment Programs, DSRIP
programs do not guarantee annual payment distributions to individual hospitals. They define a
maximum annual payment distribution and milestones for which providers can receive
payments up to that maximum if they achieve the project milestones and outcomes. For this
reason, hospitals would not necessarily receive the same funding they receive today through
the LIP program, within which only a small fraction conditionally relies on milestones or
benchmarks. In addition, the provider networks created within proposals for DSRIP initiatives
206 NY Medicaid, Program Funding and Mechanics Protocol, (April 2014).

Navigant Page 201 of 246
would not necessarily include the exact same set of providers as the set that currently receives
payments through the LIP program. CMS will likely require distribution of the DSRIP dollars
be based on the achievement of measurable milestones and outcomes that are linked to
demonstrating improvements in health in the State. CMS will also want to see a positive return
for its federal investment in the DSRIP program. Even so, the DSRIP initiatives may be
definable in a way that not necessarily ensures, but creates an achievable opportunity for a
positive return on investment for those contributing IGTs, so long as conditional milestones are
achieved.
An uncompensated care pool potentially could be included with a DSRIP program. Rather
significant uncompensated care pools were approved for both Medi-Cal and Texas Medicaid.
Uncompensated care pools are much like most sub-programs within LIP in that they offer
payments to hospitals without restrictions based on meeting quality measures or implementing
new health care delivery initiatives. As indicated by their name, generally, uncompensated care
pools make funds available for providers that treat a significant number of uninsured patients.
DSRIP programs have proven to be complex and require long lead times to develop. Needing
up to two years to design and implement a DSRIP program and to receive final approval from
CMS is not uncommon. As a result, if DSRIP is selected, interim funding and payment
mechanisms would need to be defined and implemented for the time in which the DSRIP
program is being developed. It would simply not be realistic to expect the hospitals to absorb
payment reductions that would have to occur if the LIP program were discontinued on June 30,
2015, while the State works with CMS for the next two years to get a DSRIP program designed
and implemented.
A logical interim solution would be to work with CMS to temporarily continue the LIP
program. Since parts of Florida’s existing 1115 demonstration waiver have been renewed
through state fiscal year 2016/17 (through June 30, 2017), a renewal of the LIP program for the
remainder of the current 1115 waiver might coincide well with the time needed to develop a
DSRIP program.
There are no guarantees that CMS would temporarily approve this type of interim “bridge”
solution. However, it the State were to make modifications to the LIP program to increase the
transparency of the program funding and payment distributions, enhance program integrity
protocols, and make the revised temporary program contingent on a robust effort to have a
DSRIP program up and running by the end of SFY 2017, it may very well be worth
consideration by CMS.
As an example of how a temporary LIP program might work, the State could incorporate the
following changes to the current program:
Apply the same limitations on payments under the program as are applied for DSH
payment purposes. This would include incorporating the same data collection, cost

Navigant Page 202 of 246
determination, reporting and audit protocols that are now required under the DSH
program, and would require limiting federal matching funds to the costs of the
Medicaid and uninsured populations at the hospital-specific level.
Modify the distributions of funding to be more closely tied to utilization of services. For
example, currently under the LIP-6 portion (formerly self-funded rate enhancements) of
the LIP program, the State returns to contributing providers all of their contribution plus
100 percent of the federal matching funds related to their contribution. In the future,
some of these federal matching funds could instead be redistributed to other providers,
particularly those that do not have the capacity to make IGT contributions but serve
large proportions of Medicaid and/or people without insurance – that is, based on
utilization of services.
Similarly, federal funds could be distributed based on other quality improvement-
related goals, which would be determined by the State, consistent with an overall value-
based purchasing strategy. For example, distributions could be tied to measured
reductions in preventable hospital readmissions or complications.
Since redistributing funds in the manner described above could represent a significant
reduction in payments to the hospitals that currently contribute IGTs through LIP-6, it
might be appropriate to phase in the reductions over the span of the two-year “bridge”
period. For example, returns on IGTs could be set to limit the total payment to be 80
percent of what they had received under legacy program for the first year, and 40
percent in the second year.
In any event, the pay-back related to the IGT contribution would need to represent a
significant enough return to the hospitals to preserve the incentive for the IGT
contributions to continue to be made.
Implementation of a DSRIP program has the distinct advantage of being able to maintain
incentives for IGT contributions. Thus, the program has the potential to avoid the need for
increases in use of general revenue or increases in health care assessments. In addition, DSRIP
programs have the potential to promote creation of new, innovative health care service delivery
models which may result in improved population health and/or decreased costs of health care
in the State. Also, a DSRIP program would likely involve teaching institutions and teaching
physicians, thus providing a potential replacement for the physician supplemental payment
program within LIP. However, these benefits need to be weighed against the drawbacks
associated with implementing a complex program that requires considerable effort to
administer. In addition, the lack of regulations regarding DSRIP programs makes the future of
DSRIP programs unclear. Going forward, CMS will likely want to understand how states will
use DSRIP programs to transform their delivery system so that states will not require the same
amount of additional federal investment in the future. States implementing DSRIPs that are not
successful at achieving real system transformation will likely spend considerable effort on these
programs only to find themselves searching for new solutions when their DSRIP programs fall
out of favor with CMS.

Navigant Page 203 of 246
9.5.4 Medicaid Expansion with Either a Broad-Based Funding Increase or IGTs
As a third option, the State of Florida could expand the Florida Medicaid program. Expansion
would significantly mitigate the problems associated with limited compensation for most of the
population currently uninsured or underinsured. Thus, expansion could, in theory, replace the
portion of the LIP program currently helping to fund uncompensated care. This is true with
any type of implementation of expansion selected by the Florida Government. As discussed in
Chapter 6 – Medicaid Expansion, this could be a traditional expansion as defined in the ACA, or
an alternative expansion, such as a premium assistance program. However, expansion would
not replace the portion of the LIP program funding the difference between Medicaid payments
and hospitals’ costs to treat Medicaid recipients. To replace this “UPL portion” of the LIP
program will require a solution like the options described in the previous two sections.
If current LIP funding is replaced with a broad-based funding mechanism, then potential
increases in claim-based payments through rates could help to close the gap between current
payment levels and the allowable costs incurred by providers of health care services. A DSRIP
program would not necessarily be needed. With the option of replacing LIP funding with a
broad-based funding mechanism, a DSRIP program was included only for reimbursement of
funds currently paid out through the LIP program for care of the uninsured and underinsured.
However, Medicaid expansion would cover care for this population, thus generally offsetting
the need for DSRIP. Medicaid expansion would also increase volume in both Medicaid FFS and
managed care. In particular, the increase in FFS volume might be enough to enable the teaching
physicians to receive standard UPL supplemental payments up to the levels they currently
receive through the LIP program.
If on the other hand, Florida’s replacement for the LIP program is a DSRIP program, then
DSRIP would still be needed, even with Medicaid expansion, although with Medicaid
expansion, the size of the DSRIP program could be smaller. Current program-wide
reimbursement levels could be obtained with DSRIP replacing only the portion of the LIP
program used to close the gap between Medicaid claim payments and hospitals’ cost of care
plus the portion of LIP defined for teaching physician supplemental payments. The DSRIP
program would not need to replace the portion of LIP that reimburses hospitals for
uncompensated care. Medicaid expansion would significantly reduce the number of uninsured
Floridians, and would significantly reduce uncompensated costs associated with this
population.
Starting in FFY 2017, the FMAP for Medicaid expansion will drop below 100 percent. As a
result, expansion will likely increase costs to the Medicaid program in the long term. Future
options for funding the state share of costs for the expansion population when it becomes a state
obligation are the same as those discussed for funding a replacement for the LIP program.
Broad-based funding methods provide the most flexibility for payment methods, while IGTs
offer less flexibility but allow the program to be funded without increases in taxes or
assessments.

Navigant Page 204 of 246
9.5.5 Partial Implementation of Funding Options
For ease of explanation, sections 9.5.2 and 9.5.3 describe “all-or-nothing” options. The option
described under section 9.5.2 shifts all current LIP funding, which is almost entirely IGTs, to a
broad-based funding method including increased use of general revenue and/or an increase in
health care related assessments – either through increases in the provider assessment or creation
of a new managed care assessment. In contrast, the option described under section 9.5.3
continues use of IGTs at the same levels as currently exist for funding the LIP program. In
reality, some form of combination of these two funding methods could be used. In the future,
the funds currently used for the LIP program could come from a combination of an increase in
broad-based funding and a smaller collection of IGTs. Of course, if both types of funding are
implemented the benefits and limitations of each method will apply. Broad-based funding
methods generate money that can be used for claim payments, capitation payments, and
supplemental payments, to the extent that these distributions remain within the regulations set
forth by CMS. IGTs generate money that must be distributed first to compensate those who
have contributed and then any remaining funds have flexibility to be distributed in the way that
best suits the Florida Medicaid program – again, to the extent that these distributions remain
within the regulations set forth by CMS.

Navigant Page 205 of 246
10 Evaluation of Options for Consideration for Florida Medicaid
In a program as large and complex as Florida Medicaid, there are many competing priorities. In
addition, any change in funding and/or payment method will likely result in shifting Medicaid
reimbursement levels between providers – particularly with a change as large as a replacement
for the LIP program. If a modified version of the LIP program would be acceptable to CMS,
then this would likely generate the least amount of changes to the Florida Medicaid program.
In case that proves an unacceptable option, we developed a set of objective evaluation criteria to
help evaluate the options defined in Section “9.5 – Combination of Various Options.” Each of
the three combination options are rated using this criteria with the third option evaluated twice;
once with Medicaid expansion and an increase in broad-based funding, and a second time with
Medicaid expansion and an increase in IGTs.
The evaluation criteria are based on the goals of all stakeholders including CMS, the Florida
Legislature, AHCA, providers, and Medicaid and uninsured beneficiaries. The criteria include
items such as access to care, funding level, program simplicity, equity, and cost effectiveness. In
addition, we felt some criteria were more important than others, so the evaluation matrix
includes a weighting for each criteria. Weighting the criteria is subjective and would likely
differ based on each stakeholder’s point of view. We chose a relatively simple weighting, one –
least important, two – medium importance, and three – greatest importance, and aimed to
define the weights and individual ratings using a program-wide perspective. The results are
shown in Table 32.

Navigant Page 206 of 246
Table 32. Numerically weighted comparison of the combined options.
Nbr Measure Weight
Increase Broad
Based Funding
without
Expansion1
IGT Funding
with DSRIP,
without
Expansion1
Increase Broad
Based Funding
with
Expansion1
IGT Funding
with DSRIP,
with
Expansion1
Payment
1
Improves equity of payment, while considering the resource
requirements that may be unique to certain types of providers
(safety net, children's, psychiatric, etc.) consistent with Section
(a)(30)(A) requirements.
2 4 2 4 2
2 Enhances the state's ability to ensure access to care, consistent
with Section (a)(30)(A) requirements. 3 3 3 4 4
3
Recognizes the additional resource requirements associated with
caring for higher proportions of uninsured or under insured
patients.
3 2 3 4 4
4 Contributes to a transition from volume-based purchasing to
value-based purchasing. 3 1 4 1 4
5 Creates payment incentives that contribute to improvement of
quality of care consistent with Section (a)(30)(A) requirements. 3 2 4 2 4
6 Provides for aggregate payment levels greater than or equal to
current levels. 3 3 3 4 4
7 Offers transparent, predictable and simplistic payments for
providers and the State. 2 4 3 4 3
8 Provides for administrative ease for implementation and ongoing
operation and monitoring. 1 4 1 2 1
Funding
9 Improves equity of provider funding obligation across all
categories of hospitals (public, private, non-profit etc…) 2 3 2 4 2
10 Improves long term sustainability and stability of funding. 2 2 1 4 3

Navigant Page 207 of 246
Nbr Measure Weight
Increase Broad
Based Funding
without
Expansion1
IGT Funding
with DSRIP,
without
Expansion1
Increase Broad
Based Funding
with
Expansion1
IGT Funding
with DSRIP,
with
Expansion1
11 Improves transparency of funding streams (State, county,
provider, etc.) 1 4 2 4 2
State/Federal
12 Mitigates increasing the fiscal burden placed on State/local
taxpayers. 3 2 2 3 3
13 Offers consistency with current federal and state guidelines and
regulations. 3 3 3 2 2
Total Weighted Score (sum of individual rating times weight)
82 85 98 98
Notes:
1) Rating Scale: 1=Strongly Disagree, 2=Disagree, 3=Agree, 4=Strongly Agree
2) Maximum possible total weighted score is 124.

Navigant Page 208 of 246
In general, the expansion options rate higher because they increase access to care for those
currently uninsured, and they increase federal funds coming into the state, thus resulting in
greater payments to hospitals (assuming current funding levels can be maintained for the
current Medicaid population). However, the expansion options rate lower on one particular
category, consistency with federal and state guidelines, because Medicaid expansion is not
known to be a preference of the Florida Legislature. In addition, expansion, if implemented,
will require more state-share funds in the near future as the 100 percent FMAP only continues
through September 30th, 2016.
The options that include continued use of IGTs and a DSRIP program rate higher on criteria
relating to improvement of quality of health care delivery and to implementation of value-based
purchasing. At the same time, they rate lower in relation to equity, transparency, and
simplicity. As defined, the option including an increase in broad-based funding does not
include implementation of a DSRIP or any other kind of new health care quality incentives, and
thus did not score as high on those categories. However, there is nothing in this option that
precludes implementation of new value-based initiatives.
Navigant Page 209 of 246
11 Conclusion
The State of Florida has placed significant reliance on the LIP program to enable funding a
portion of the state share and to draw down federal matching funds. As such, without renewal
of the provision within the current 1115 demonstration waiver that authorizes the LIP program,
the State is at risk of losing approximately $1.3 billion207 in federal matching funds that are
currently used supplemental LIP payments. The State may also be at risk of losing some or all
of the $397 in federal matching funds currently used for automatic rate enhancements.
Specifically for the $1.3 billion federal funds at risk for the LIP program, approximately $728
million will be paid to the State’s 23 public hospitals and $577 million to the State’s 190
privately-owned hospitals in SFY 2014/15. These federal funds are generated almost entirely
through application of IGT contributions received from public hospitals, county governments,
and other local sources. As such, there is almost no cost to the State associated with generating
these federal matching funds.
These funds are critical for maintaining access to essential hospital services for the State’s large
Medicaid and uninsured population. Not having these funds available for payment to Florida’s
hospitals may exacerbate an already tenuous situation. Based on our analyses, if LIP payments
are not counted, we estimate that Medicaid payments covered an average of 79 percent of the
costs incurred by hospitals for providing services to Medicaid recipients in SFY 2012/13. During
that year, self-funded IGTs were paid out as rate enhancements. However, in SFY 2014/15, self-
funded IGTs have been moved into the LIP program, as LIP-6. Thus in SFY 2014/15, the
average hospital cost coverage for services to Medicaid recipients when LIP payments are not
counted will be approximately 62 percent. Further, if the LIP program expired without any
type of replacement, the IGTs used to fund automatic rate enhancements would also be at risk.
If automatic rate enhancements were not available, average hospital cost coverage for services
to Medicaid recipients excluding LIP and automatic rate enhancements would be 48 percent.
In addition, pay-to-cost coverage differs significantly for hospitals that have capacity to
contribute IGTs versus those that do not. For example in SFY 2012/13, hospitals that received
IGT rate enhancements (including self-funded IGTs) were paid on average 83 percent of their
cost for treating Medicaid recipients. Hospitals that did not receive IGT rate enhancements
were paid on average 45 percent of their costs. Payment below cost generally requires hospitals
to cover a portion of Medicaid costs with payments from other payers, a situation commonly
referred to as “cost shifting”. Further, many hospitals in the State provide some services to the
uninsured, and in fact are required by law to do so in emergency-related situations. Although it
is not necessarily a legal obligation for the State to provide health benefits to the uninsured
population, most states, including Florida make some effort to compensate hospitals caring for
the uninsured. When you consider the costs associated with providing services to the
207 The $1.3 billion estimate is based on the federal share of the total estimated LIP-based payments of approximately
$2.2 billion for SFY 2014/15. The assumed FMAP for this calculation is 59.56 percent.
Navigant Page 210 of 246
uninsured, Medicaid payments without LIP obviously would cover a much smaller percentage
of hospital cost.
It is possible that an IGT-funded UPL supplemental payment program could be used to replace
a portion of LIP-related funds, but such a program would be limited to the available fee-for-
service program UPL gap, which is approximately $412 million, total computable, of which
approximately $245208 million is the federal share. Thus if the federal share of the LIP program
and automatic rate enhancements were not available, approximately $1.7 billion in federal
funds would be removed from the program, for which re-institution of a standard UPL
program would replace only about $245 million.
There is no perfect solution to this problem. In the absence of a federal waiver, the UPL
limitations in payments simply restrict how much funding can be federally matched. This
appears to be one of the unintended, but common consequences associated with a transition to
a capitated managed care model. Shifting the financial risk from the State to the Medicaid
managed care plans also means that the State is passing substantial control of how payments
are made over to the plans.
In Chapters 9 and 10 of this report, we identify and evaluate four broad options for
consideration, two of which include an expansion of Medicaid eligibility provided under the
ACA. While we have evaluated and attempted to “score” these options using a standard set of
evaluation criteria, we fully understand that there are numerous other factors that must be
considered outside of these criteria that make it difficult to recommend one option over another.
We believe that all four of these options represent opportunities to preserve the aggregated
funding levels that have historically been achieved through the LIP program. None of these
funding models, however, afford the State the flexibility to maintain exactly the same payment
levels currently made to individual hospital providers.
As these four options are considered, there are three key questions that must be answered. The
answers to these questions can provide a guide for determining which of the four options
should be pursued and/or what combination of options will work best for Florida Medicaid.
1) Are the citizens of Florida ready to move forward with a Medicaid expansion?
Medicaid expansion in Florida as afforded by the ACA could significantly help offset the
costs incurred by the State’s hospitals in caring for uninsured and under-insured
patients, but would come with additional cost to the State. Starting in FFY 2017, the
FMAP for the expansion population will start to be reduced, and the balance, which will
increase to as much as 10 percent over the years, will transfer to the State.
2) Should the State consider linking hospital reimbursements more closely to a hospital’s
commitment to serve higher proportions of Medicaid and uninsured patients, and less
208 The assumed FMAP for this calculation is 59.56 percent.
Navigant Page 211 of 246
on their ability to make IGT contributions? Today, hospitals with access to IGT
contributions receive significantly higher reimbursements in relation to their cost. And
while hospitals with higher reimbursements generated by IGT contributions oftentimes
are those that tend to care for high percentages of Medicaid and uninsured patients, the
differences in per unit payment between those with access to IGT contributions and
those that do not may be too disparate.
3) Should the State evolve the program further by transitioning to more of a value-based
purchasing model instead of a utilization-based model? Today, payments are for the
most part volume-based. In other words, the more patients a hospital can admit and
discharge, the more payments that hospital will receive. Payment amounts are not
necessarily predicated on achieving quality outcomes. The current payment models
tend to incent more hospital-based volume instead of incenting preventable care and
less hospital-based volume. Payment models could be established to incentivize
reductions in unnecessary utilization of services (unnecessary admissions, readmissions,
complications, emergency room visits, etc.), or otherwise provide incentives for
hospitals to become more cost effective. A more value-based model could be achieved
through implementation of carefully considered quality-based incentive payments, or
through a DSRIP program, for which quality-based incentive payments are a
foundational element.
The answers to these questions can effectively narrow the four broader options down to one
option or a mixture of options that best suits the circumstances of Florida.
We also believe that there may be a fifth option to consider. This study generally assumes that
the LIP program will be discontinued. Consistent with the 2014 Special Terms and Conditions
of Florida’s 1115 demonstration waiver, this study is intended to identify “sustainable,
transparent, equitable, appropriate, accountable and actuarially sound Medicaid payment
systems and funding mechanisms that will ensure quality health care services to Florida’s
Medicaid beneficiaries throughout the state without the need for LIP funding.”209 However,
given the potential risk to individual providers and the State related to discontinuation of the
LIP program, we believe that it would be prudent to determine if some form of LIP program
can be maintained.
We believe that the complexity and lack of transparency related to the LIP program may have
contributed to CMS’ decision to not renew the LIP component of the 1115 demonstration waiver
beyond 2015. The goal of the LIP program appears to be very similar to that of the DSH
program. If Florida Medicaid could modify the LIP program in a way that creates more
transparency in funding and payment distribution, and applies the same fiscal oversight
standards that are now required as a part of operating a DSH program, much of what is good
about the LIP program might be retained. Such fiscal oversight would likely have to include
209 Centers for Medicare and Medicaid Services, Special Terms and Conditions for Florida Medicaid Reform Section 1115
Demonstration, Document number 11-W-00206/4, (2014).

Navigant Page 212 of 246
reporting and auditing standards that are now integral to the DSH program, and potentially
reconsideration of the equity of how funds are distributed.
In any event, we strongly recommend that Florida maintain an open dialogue with CMS in
determining how to best address this problem, and use CMS as a partner in determining the
best solutions.

Navigant Page 213 of 246
12 Appendices
12.1 Appendix A – Definitions and Acronyms
ACA Affordable Care Act – a shortened version of the full acronym – PPACA
AHCA Agency for Health Care Administration – the agency within the Florida state
government that oversees the Florida Medicaid program
CFR Code of Federal Regulations
CHD County Health Department
CHEP Community Hospital Education Program – hospitals participating in this
program are referred to as “CHEP hospitals.”
CMS Centers for Medicare and Medicaid Services – the federal governmental agency
overseeing state Medicaid programs
CPE Certified Public Expenditure – an expenditure made by a governmental entity,
including a provider operated by state or local government, under the state’s
approved Medicaid state plan, making the expenditure eligible for federal match
DRG Diagnosis Related Grouping – a categorization scheme used in determining
payment and measuring acuity of inpatient admissions
DSH Disproportionate Share Hospital – a hospital receiving a disproportionate share
of Medicaid, under insured and uninsured patients.
DSHP Designated State Health Programs
DSRIP Delivery System Reform Incentive Payment
DY Demonstration Year – the demonstration years for the Florida’s current 1115
Demonstration Waiver are:
DY 1 – July 1, 2006 – June 30, 2007
DY 2 – July 1, 2007 – June 30, 2008
DY 3 – July 1, 2008 – June 30, 2009
DY 4 – July 1, 2009 – June 30, 2010
DY 5 – July 1, 2010 – June 30, 2011
DY 6 – July 1, 2011 – June 30, 2012
DY 7 – July 1, 2012 – June 30, 2013
Navigant Page 214 of 246
DY 8 – July 1, 2013 – June 30, 2014
DY 9 – July 1, 2014 – June 30, 2015
DY 10 – July 1, 2015 – June 30, 2016
DY 11 – July 1, 2016 – June 30, 2017
EPSDT Early Periodic Screening, Diagnosis, and Treatment
FFP Federal Financial Participation
FFY Federal Fiscal Year – runs from October 1st through September 30th of the
following calendar year.
FMAP Federal Medical Assistance Percentage
FQHC Federally Qualified Health Center
FPL Federal Poverty Level
GAA General Appropriations Act
GME Graduate Medical Education
GR General Revenue – state funds collected through state taxes, licensing fees, and
various other avenues
ICF-MR Intermediate Care Facilities for individuals with Mental Retardation
IGT Inter-governmental transfer – a method in which local (non-state) governments
and public hospitals can transfer money to AHCA to help fund the Medicaid
program.
LIP Low Income Pool – part of Florida’s 1115 Demonstration Waiver
MACPAC Medicaid and CHIP Payment and Access Commission
MMA Managed Medical Assistance – name for Florida’s Medicaid managed care
program
PMATF Public Medical Assistance Trust Fund – Florida’s hospital provider assessment
program which helps fund the Medicaid program.
PMPM Per member per month
Navigant Page 215 of 246
PPACA Patient Protection and Affordable Care Act
SFY State Fiscal Year – Florida’s state fiscal year runs from July 1 of one year through
June 30th of the following year. AHCA generally includes both years when
defining a state fiscal year, such as “SFY 2011/12” and “SFY 2012/13”. This
convention has been followed in this report.
SMMC Statewide Medicaid Managed Care
SPA State Plan Amendment
SSEC Social Services Estimating Conference
STC Special Term and Condition – these are parameters and conditions which help
define waivers granted to a Medicaid program under a section 1115
demonstration.
Supplemental Payment
Within this report, we define a “supplemental payment” as any lump-sum
payment a Medicaid Agency makes to a provider that is made in addition to
standard payment rates for services provided to Medicaid beneficiaries. This
includes UPL payments, DSH payments, LIP payments, and, potentially in the
future, DSRIP payments.
Total Computable
Sum of state share and federal share of funds used by a state Medicaid agency
for Medicaid reimbursements.
UPL Upper Payment Limit – a program that allows states to claim supplemental UPL
Federal matching funds to cover the difference between Medicaid payments and
what Medicare would have paid for the same services.
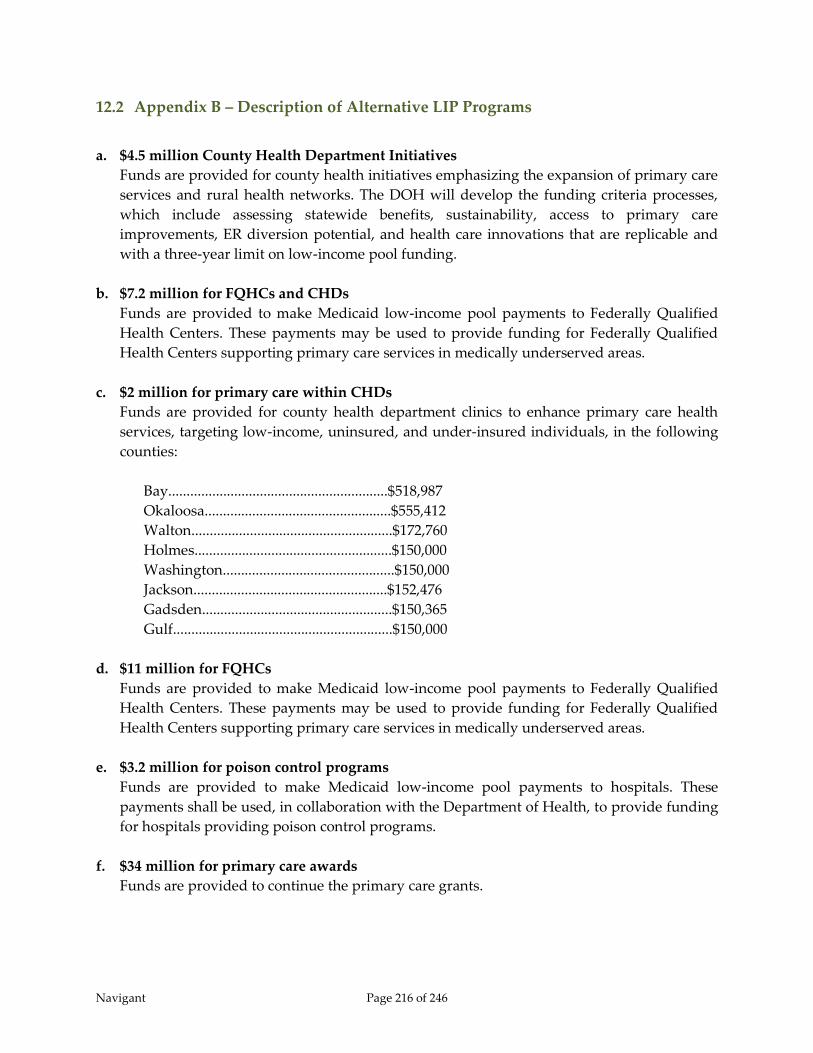
Navigant Page 216 of 246
12.2 Appendix B – Description of Alternative LIP Programs
a. $4.5 million County Health Department Initiatives
Funds are provided for county health initiatives emphasizing the expansion of primary care
services and rural health networks. The DOH will develop the funding criteria processes,
which include assessing statewide benefits, sustainability, access to primary care
improvements, ER diversion potential, and health care innovations that are replicable and
with a three-year limit on low-income pool funding.
b. $7.2 million for FQHCs and CHDs
Funds are provided to make Medicaid low-income pool payments to Federally Qualified
Health Centers. These payments may be used to provide funding for Federally Qualified
Health Centers supporting primary care services in medically underserved areas.
c. $2 million for primary care within CHDs
Funds are provided for county health department clinics to enhance primary care health
services, targeting low-income, uninsured, and under-insured individuals, in the following
counties:
Bay............................................................$518,987
Okaloosa...................................................$555,412
Walton.......................................................$172,760
Holmes......................................................$150,000
Washington...............................................$150,000
Jackson.....................................................$152,476
Gadsden....................................................$150,365
Gulf............................................................$150,000
d. $11 million for FQHCs
Funds are provided to make Medicaid low-income pool payments to Federally Qualified
Health Centers. These payments may be used to provide funding for Federally Qualified
Health Centers supporting primary care services in medically underserved areas.
e. $3.2 million for poison control programs
Funds are provided to make Medicaid low-income pool payments to hospitals. These
payments shall be used, in collaboration with the Department of Health, to provide funding
for hospitals providing poison control programs.
f. $34 million for primary care awards
Funds are provided to continue the primary care grants.

Navigant Page 217 of 246
g. Premium assistance for Palm Beach and Miami-Dade counties
Funds are provided to make health insurance premium payments for low-income residents
enrolled in the Miami-Dade Premium Assistance Program.
Funds are provided to make Medicaid low-income pool payments for premium assistance
programs operated by Palm Beach County Health Care District.
h. $3 million for hospital-based primary care initiatives – $750,000 for each hospital
Funds are provided to make Medicaid low-income pool payments to hospitals. These
payments shall be used, in collaboration with the DOH, to provide funding for hospitals
with hospital based primary care initiatives.
i. $35 million for quality initiatives described in STC 61a – split into $20 million for new
initiatives and $15 million to expand existing initiatives
Tier-one Milestone Distributions (STC 61) are included as a portion of the total of the $50
million in new funds required by updated STCs from CMS. The distribution of the $35
million in this section will be determined by the agency based upon the requirements
herein. A total of $20 million will be used for the start-up of new primary care programs and
a total of $15 million will be used to meaningfully enhance existing primary care programs.
There is a cap of $4 million per grant proposal. The CMS Tier-one Milestones are for the
establishment of new, or enhancement of existing, innovative primary care programs that
meaningfully enhance the quality of care and the health of low income populations. The
new or enhanced primary care programs must broadly drive from the three overarching
goals of CMS’s Three-Part Aim.
1. Better care for individuals, including safety, effectiveness, patient centeredness,
timeliness, efficiency, and equity.
2. Better health for populations by addressing areas such as poor nutrition, physical
activity, and substance abuse; and
3. Reducing per capita-costs.
Within these broad goals, the agency will establish further requirements for new or
enhanced primary care programs to provide the services most needed by the local
community, such as needed physician, dental, nurse practitioner, or pharmaceutical
services; expand local capacity to treat patients; and provide for extended service hours.
Additionally, reduction of unnecessary emergency room visits and preventable
hospitalizations will be components of new or enhanced primary care programs.
j. Manatee ER Diversion program
Funds are provided to continue the primary care and emergency room diversion program in
Manatee, Sarasota and DeSoto counties.
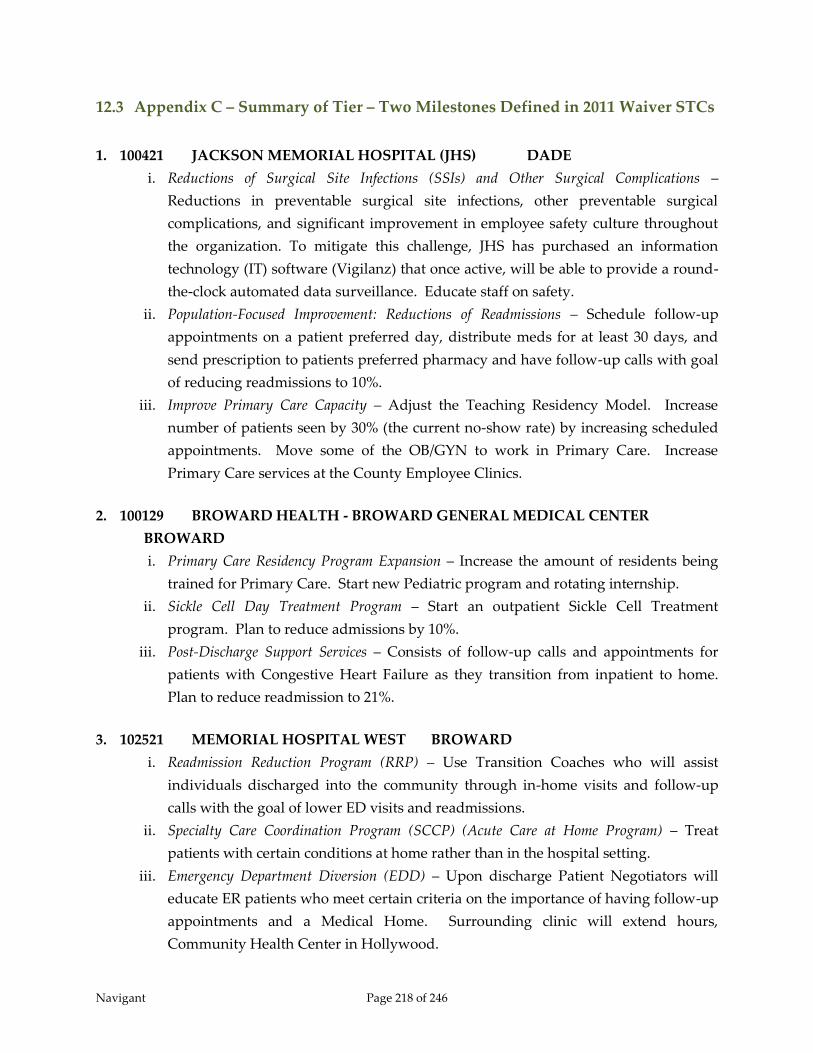
Navigant Page 218 of 246
12.3 Appendix C – Summary of Tier – Two Milestones Defined in 2011 Waiver STCs
1. 100421 JACKSON MEMORIAL HOSPITAL (JHS) DADE
i. Reductions of Surgical Site Infections (SSIs) and Other Surgical Complications –
Reductions in preventable surgical site infections, other preventable surgical
complications, and significant improvement in employee safety culture throughout
the organization. To mitigate this challenge, JHS has purchased an information
technology (IT) software (Vigilanz) that once active, will be able to provide a round-
the-clock automated data surveillance. Educate staff on safety.
ii. Population-Focused Improvement: Reductions of Readmissions – Schedule follow-up
appointments on a patient preferred day, distribute meds for at least 30 days, and
send prescription to patients preferred pharmacy and have follow-up calls with goal
of reducing readmissions to 10%.
iii. Improve Primary Care Capacity – Adjust the Teaching Residency Model. Increase
number of patients seen by 30% (the current no-show rate) by increasing scheduled
appointments. Move some of the OB/GYN to work in Primary Care. Increase
Primary Care services at the County Employee Clinics.
2. 100129 BROWARD HEALTH - BROWARD GENERAL MEDICAL CENTER
BROWARD
i. Primary Care Residency Program Expansion – Increase the amount of residents being
trained for Primary Care. Start new Pediatric program and rotating internship.
ii. Sickle Cell Day Treatment Program – Start an outpatient Sickle Cell Treatment
program. Plan to reduce admissions by 10%.
iii. Post-Discharge Support Services – Consists of follow-up calls and appointments for
patients with Congestive Heart Failure as they transition from inpatient to home.
Plan to reduce readmission to 21%.
3. 102521 MEMORIAL HOSPITAL WEST BROWARD
i. Readmission Reduction Program (RRP) – Use Transition Coaches who will assist
individuals discharged into the community through in-home visits and follow-up
calls with the goal of lower ED visits and readmissions.
ii. Specialty Care Coordination Program (SCCP) (Acute Care at Home Program) – Treat
patients with certain conditions at home rather than in the hospital setting.
iii. Emergency Department Diversion (EDD) – Upon discharge Patient Negotiators will
educate ER patients who meet certain criteria on the importance of having follow-up
appointments and a Medical Home. Surrounding clinic will extend hours,
Community Health Center in Hollywood.

Navigant Page 219 of 246
4. 100676 SHANDS AT JACKSONVILLE DUVAL
i. Post Discharge Primary Care Visit – Schedule a follow-up visit at discharge and
develop program based on amount of patients that attend the follow-up visit; could
include after-hour clinic hours, transportation, and patient education.
ii. City Contract Primary Care Redesign – Plan on having all types of health care in one or
two locations with the goals of improving access, delivering services in an
appropriate setting, changing health seeking behaviors and reducing cost.
iii. No-show Physician Appointments – Hire employees to call and remind patients of
upcoming appointments and identify the patients’ transportation barriers and
develop a webpage “Catch a Caravan to Improved Health.” Reduce no-shows by
10-15% and decrease unnecessary ER visits.
5. 100200 MEMORIAL REGIONAL HOSPITAL BROWARD
i. Specialty Care Clinic Program (Acute Care at Home Program) at Memorial Regional
Hospital – Treat patients with certain conditions at home rather than in the hospital
setting.
ii. Enhancement of Patient Centered Medical Home (PCMH) at 4 Community Health
Centers Operated by Memorial Regional Hospital – Expand staff to improve
availability and educate the patients. Will also purchase a web-based business
intelligence tool (database of patients medical data that multiple physicians have
access to) to improve care coordination and reduce cost.
iii. Readmission Reduction Program at Memorial Regional Hospital – Use Transition
Coaches who will assist individuals discharged into the community through in-
home visits and follow-up calls with the goal of lower ED visits and readmissions.
6. 108219 BROWARD HEALTH - IMPERIAL POINT HOSPITAL BROWARD
i. Readmission Pneumonia Reduction – Create group of individuals to evaluate the
hospital’s processes impacting the readmissions and form a plan to lower
readmissions to 18%.
ii. Improve Emergency Department Turn Around Time – A team will work on reducing the
average Turn-Around-Time (from the moment the patient is seen to discharge) of
390 minutes by 10%.
iii. Inpatient Fall Reduction – National Patient Safety Goal Performance Improvement
Team to evaluate current fall prevention processes and lower the fall rate by 3%.

Navigant Page 220 of 246
7. 101842 HALIFAX HEALTH VOLUSIA
i. Center For Women & Infant Health – Make certain every woman in the Labor &
Delivery department sees a physician (24/7 OB), will the goal of lowering non-
medically required caesareans and inductions, along with reducing lengths of stay
for infants in the neonatal unit.
ii. Congestive Heart Failure Observation Services – Develop a specialized observation
protocol for patients with Congestive Heart Failure with the goal of reducing
readmission rates and lengths of stay, thus reducing per-capita cost and increasing
effectiveness of care.
iii. Expanded ED Diversion Program – Build a second location for ED medical Triage and
extend the hours at existing locations with the goal of diverting patients from the
ED.
8. 100994 TAMPA GENERAL HOSPITAL (TGH) HILLSBOROUGH
i. Practice Connect – Investment in Technology – Provide surrounding physician practices
with access to the Electronic Health Record (EHR) system for a small fee that is
subsidized by the hospital with the goal of increasing the effectiveness of care
ii. Population Focused Initiative to Reduce CLABSI in NICU – Join an eight state
collaborative committed to reducing the Central-Line-Blood Stream Infections
(CLABSI) in neonatal intensive care units (NICUs); the goal is to reduce the rate by
following evidence-based practices and engaging in continuous quality
improvement.
iii. Primary Care Clinics Extended Hours – Will extend hours in TGH’s Primary Care
Clinics to afternoons, weekends and even offer same-day appointments and walk-
ins.
9. 102229 MEMORIAL HOSPITAL PEMBROKE BROWARD
i. Specialty Care Clinic Program (Acute Care at Home Program) at Memorial Hospital
Pembroke – Treat patients with certain conditions at home rather than in the hospital
setting.
ii. Readmission Reduction Program at Memorial Hospital Pembroke – Use Transition
Coaches who will assist individuals discharged into the community through in-
home visits and follow-up calls with the goal of lower ED visits and readmissions.
iii. Enhancement of the Patient Centered Medical Home (PCMH) at 1 Community Health
Center Operated by Memorial Hospital Pembroke – Expand staff to improve availability
and educate the patients. Purchase a web-based business intelligence tool (database
of patients medical data that multiple physicians have access to) to improve care
coordination and reduce cost.

Navigant Page 221 of 246
10. 101761 SARASOTA MEMORIAL HOSPITAL SARASOTA
i. mHealth (Mobile Health) Trial Use of Mobile Phone Technology to Improve Monitoring of
Heart Failure Patients – Familiarize the target group with their mobile devices. Cell
phones will be used several times a day to send updates of patients’ blood pressure
cuff and external scale to nurse practitioners, nurse practitioner will respond to
patients outside of pre-prescribed ranges.
ii. Decrease Average Length-of-Stay (ALOS) for Neonatal Abstinence Syndrome (NAS)
Patients – Infants born to mothers that used illicit or prescription meds while in utero
and have developed a dependency. The goal is to more effectively care for these
infants by identifying and administering the most appropriate pharmaceutical
intervention
iii. Improve Quality, Safety and Experience of Care Through Patient Centered Rounding –Staff
will make specially educated and trained to make hourly rounds to check on
patients. Sarasota intends for patient-centered rounding to reduce patient reliance
on call lights by 10% and to provide proactive care rather than reactive care in the
inpatient setting, thus reducing falls and hospital induced ulcers.
11. 101109 LEE MEMORIAL HOSPITAL LEE
i. Improve Health Status of Low Income Patients with COPD – Improve the health status
for low income patients with chronic obstructive pulmonary disease (COPD) with an
evidenced based plan of care developed and monitored by the assignment of patient
to a patient centered primary care home physician that provides the evaluation,
education, care coordination and support system to best equip patients to manage
their disease and improve their quality of life.
ii. Improve Health of Obese Low Income Population – Improve the health status for low
income patients that are obese (BMI greater than or equal to 30) by initiating a
motivational medical program based on proven methods to improve diet and
exercise habits
iii. Improve Health of Dual Diagnosis Low Income Behavioral Health Patients – Improve the
health status through appropriate screening for and treating behavioral health issues
for low-income patients with dual diagnosis of behavioral health disorder such as
depression with comorbid medical conditions.

Navigant Page 222 of 246
12. 100218 BROWARD HEALTH - NORTH BROWARD MEDICAL CENTER
BROWARD
i. Decrease Catheter Associated Urinary Tract Infections (CAUTI) - Increased education on
appropriate Foley care and handling for all staff. Daily assessment of Foley catheter
need for appropriate discontinuation. Reduce CAUTIs to 2.0/catheter day X 1,000.
ii. Decrease Readmissions in Chronic Obstructive Pulmonary Disease (COPD) Patient
Population – Reduce readmissions through improved patient education about their
disease process and lifestyle changes required to reduce acute exacerbations;
improve patient compliance with appropriate medication usage; primary care
follow-up.
iii. Admitted Patient Flow – Develop a team that analyzes and cuts down on delays
associated with the time between the doctor giving the order to admit the patient to
when the patient is transported to nurse station for inpatient care. Goal is to reduce
time from 152 minutes to 137 minutes.
13. 103454 MEMORIAL HOSPITAL MIRAMAR BROWARD
i. Readmission Reduction Program at Memorial Hospital Miramar – Use Transition Coaches
who will assist individuals discharged into the community through in-home visits
and follow-up calls with the goal of lower ED visits and readmissions.
ii. Specialty Care Clinic Program (Acute Care at Home Program) at Memorial Hospital
Miramar – Treat patients with certain conditions at home rather than in the hospital
setting.
iii. Emergency Department Diversion Program at Memorial Hospital Miramar – Upon
discharge Patient Negotiators will educate ER patients who meet certain criteria on
the importance of having follow-up appointments and a Medical Home.
Surrounding clinic will extend hours, Community Health Center in Hollywood.
14. 120405 BROWARD HEALTH - CORAL SPRINGS MEDICAL CENTER
BROWARD
i. Mislabeled Specimens – Reduce number of specimens mislabeled, currently is over
1.0/1000 patient days goal is to reduce to .3/1000 patient days by DY8
ii. Patient Care Flow – Improve patient flow by optimizing discharge timing. By
expediting the discharge procedure they hope to reduce the pressure on the ED
while the new ED is being constructed.
iii. Reducing 30-day CHF Readmissions – Reduce readmissions by 2 percentage points for
patients with Congestive Heart Failure, as well as prepare the family and patient for
discharge.
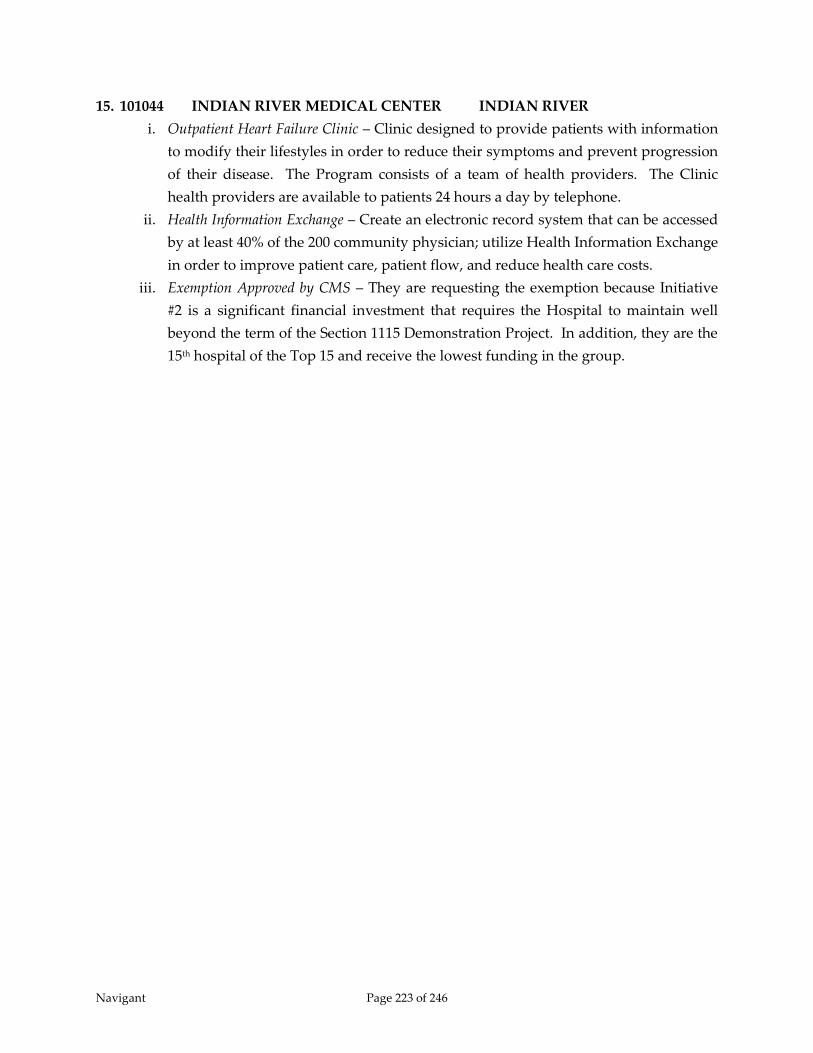
Navigant Page 223 of 246
15. 101044 INDIAN RIVER MEDICAL CENTER INDIAN RIVER
i. Outpatient Heart Failure Clinic – Clinic designed to provide patients with information
to modify their lifestyles in order to reduce their symptoms and prevent progression
of their disease. The Program consists of a team of health providers. The Clinic
health providers are available to patients 24 hours a day by telephone.
ii. Health Information Exchange – Create an electronic record system that can be accessed
by at least 40% of the 200 community physician; utilize Health Information Exchange
in order to improve patient care, patient flow, and reduce health care costs.
iii. Exemption Approved by CMS – They are requesting the exemption because Initiative
#2 is a significant financial investment that requires the Hospital to maintain well
beyond the term of the Section 1115 Demonstration Project. In addition, they are the
15th hospital of the Top 15 and receive the lowest funding in the group.
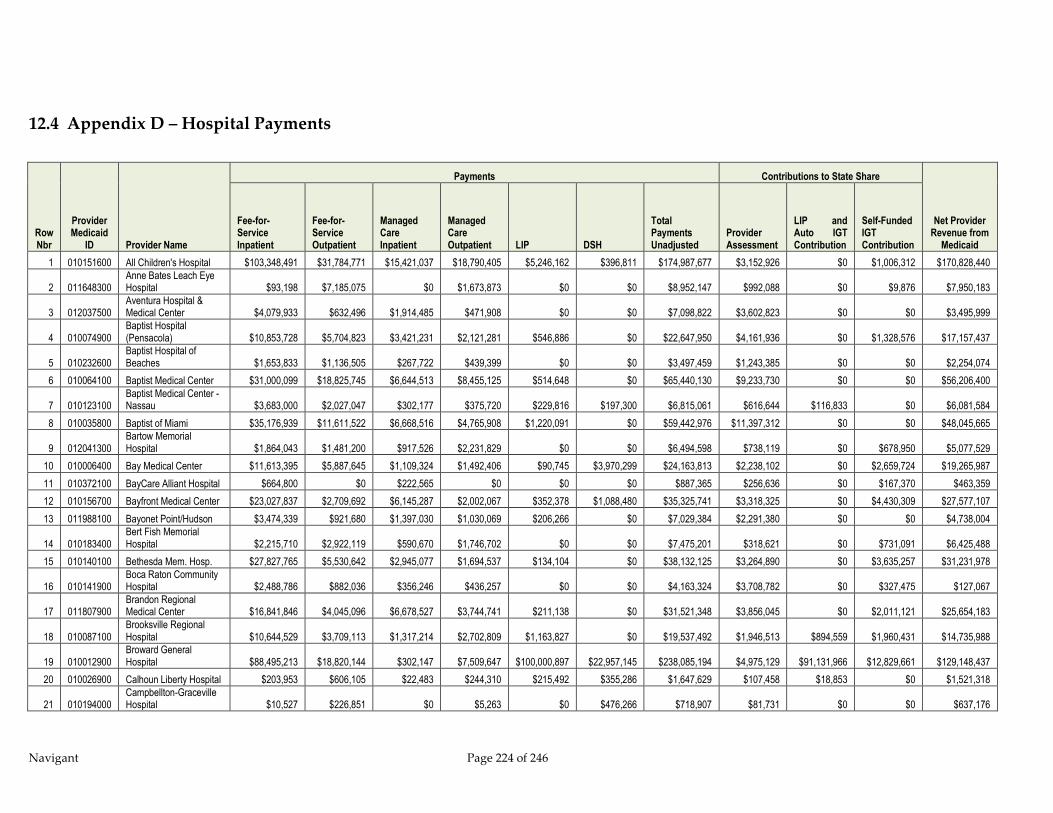
Navigant Page 224 of 246
12.4 Appendix D – Hospital Payments
Row Nbr
Provider Medicaid
ID Provider Name
Payments Contributions to State Share
Net Provider Revenue from
Medicaid
Fee-for-Service Inpatient
Fee-for-Service Outpatient
Managed Care Inpatient
Managed Care Outpatient LIP DSH
Total Payments Unadjusted
Provider Assessment
LIP and Auto IGT Contribution
Self-Funded IGT Contribution
1 010151600 All Children's Hospital $103,348,491 $31,784,771 $15,421,037 $18,790,405 $5,246,162 $396,811 $174,987,677 $3,152,926 $0 $1,006,312 $170,828,440
2 011648300 Anne Bates Leach Eye Hospital $93,198 $7,185,075 $0 $1,673,873 $0 $0 $8,952,147 $992,088 $0 $9,876 $7,950,183
3 012037500 Aventura Hospital & Medical Center $4,079,933 $632,496 $1,914,485 $471,908 $0 $0 $7,098,822 $3,602,823 $0 $0 $3,495,999
4 010074900 Baptist Hospital (Pensacola) $10,853,728 $5,704,823 $3,421,231 $2,121,281 $546,886 $0 $22,647,950 $4,161,936 $0 $1,328,576 $17,157,437
5 010232600 Baptist Hospital of Beaches $1,653,833 $1,136,505 $267,722 $439,399 $0 $0 $3,497,459 $1,243,385 $0 $0 $2,254,074
6 010064100 Baptist Medical Center $31,000,099 $18,825,745 $6,644,513 $8,455,125 $514,648 $0 $65,440,130 $9,233,730 $0 $0 $56,206,400
7 010123100 Baptist Medical Center - Nassau $3,683,000 $2,027,047 $302,177 $375,720 $229,816 $197,300 $6,815,061 $616,644 $116,833 $0 $6,081,584
8 010035800 Baptist of Miami $35,176,939 $11,611,522 $6,668,516 $4,765,908 $1,220,091 $0 $59,442,976 $11,397,312 $0 $0 $48,045,665
9 012041300 Bartow Memorial Hospital $1,864,043 $1,481,200 $917,526 $2,231,829 $0 $0 $6,494,598 $738,119 $0 $678,950 $5,077,529
10 010006400 Bay Medical Center $11,613,395 $5,887,645 $1,109,324 $1,492,406 $90,745 $3,970,299 $24,163,813 $2,238,102 $0 $2,659,724 $19,265,987
11 010372100 BayCare Alliant Hospital $664,800 $0 $222,565 $0 $0 $0 $887,365 $256,636 $0 $167,370 $463,359
12 010156700 Bayfront Medical Center $23,027,837 $2,709,692 $6,145,287 $2,002,067 $352,378 $1,088,480 $35,325,741 $3,318,325 $0 $4,430,309 $27,577,107
13 011988100 Bayonet Point/Hudson $3,474,339 $921,680 $1,397,030 $1,030,069 $206,266 $0 $7,029,384 $2,291,380 $0 $0 $4,738,004
14 010183400 Bert Fish Memorial Hospital $2,215,710 $2,922,119 $590,670 $1,746,702 $0 $0 $7,475,201 $318,621 $0 $731,091 $6,425,488
15 010140100 Bethesda Mem. Hosp. $27,827,765 $5,530,642 $2,945,077 $1,694,537 $134,104 $0 $38,132,125 $3,264,890 $0 $3,635,257 $31,231,978
16 010141900 Boca Raton Community Hospital $2,488,786 $882,036 $356,246 $436,257 $0 $0 $4,163,324 $3,708,782 $0 $327,475 $127,067
17 011807900 Brandon Regional Medical Center $16,841,846 $4,045,096 $6,678,527 $3,744,741 $211,138 $0 $31,521,348 $3,856,045 $0 $2,011,121 $25,654,183
18 010087100 Brooksville Regional Hospital $10,644,529 $3,709,113 $1,317,214 $2,702,809 $1,163,827 $0 $19,537,492 $1,946,513 $894,559 $1,960,431 $14,735,988
19 010012900 Broward General Hospital $88,495,213 $18,820,144 $302,147 $7,509,647 $100,000,897 $22,957,145 $238,085,194 $4,975,129 $91,131,966 $12,829,661 $129,148,437
20 010026900 Calhoun Liberty Hospital $203,953 $606,105 $22,483 $244,310 $215,492 $355,286 $1,647,629 $107,458 $18,853 $0 $1,521,318
21 010194000 Campbellton-Graceville Hospital $10,527 $226,851 $0 $5,263 $0 $476,266 $718,907 $81,731 $0 $0 $637,176
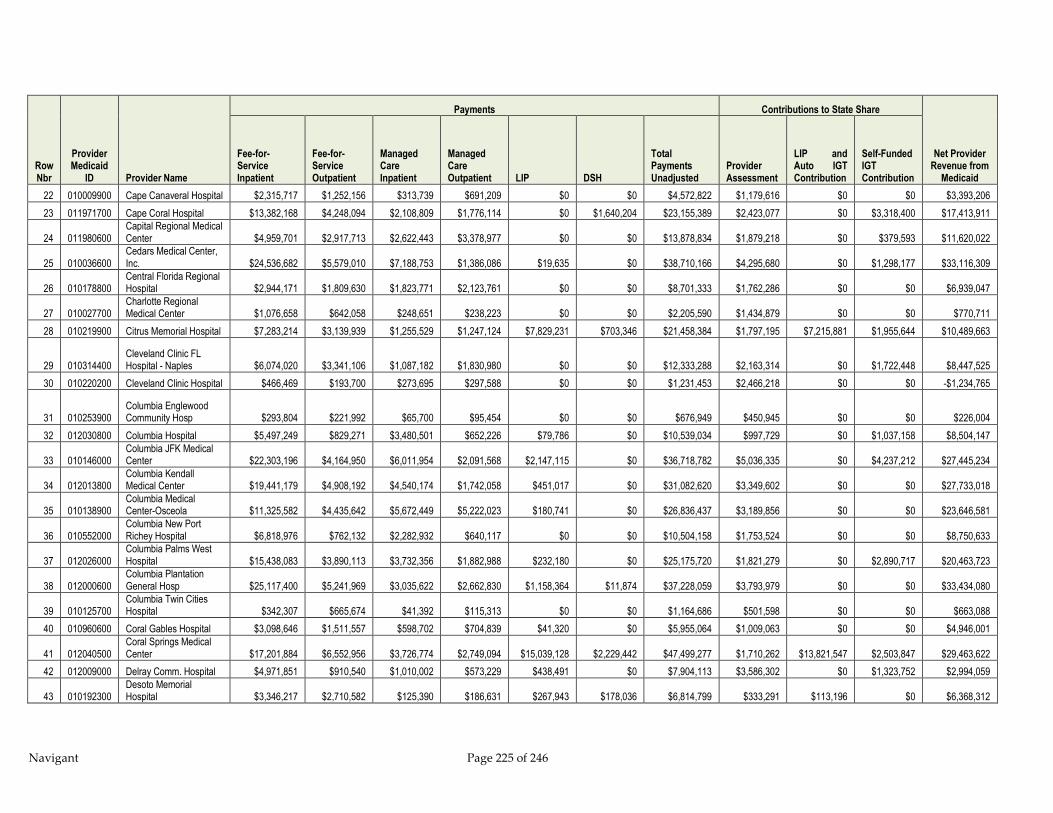
Navigant Page 225 of 246
Row Nbr
Provider Medicaid
ID Provider Name
Payments Contributions to State Share
Net Provider Revenue from
Medicaid
Fee-for-Service Inpatient
Fee-for-Service Outpatient
Managed Care Inpatient
Managed Care Outpatient LIP DSH
Total Payments Unadjusted
Provider Assessment
LIP and Auto IGT Contribution
Self-Funded IGT Contribution
22 010009900 Cape Canaveral Hospital $2,315,717 $1,252,156 $313,739 $691,209 $0 $0 $4,572,822 $1,179,616 $0 $0 $3,393,206
23 011971700 Cape Coral Hospital $13,382,168 $4,248,094 $2,108,809 $1,776,114 $0 $1,640,204 $23,155,389 $2,423,077 $0 $3,318,400 $17,413,911
24 011980600 Capital Regional Medical Center $4,959,701 $2,917,713 $2,622,443 $3,378,977 $0 $0 $13,878,834 $1,879,218 $0 $379,593 $11,620,022
25 010036600 Cedars Medical Center, Inc. $24,536,682 $5,579,010 $7,188,753 $1,386,086 $19,635 $0 $38,710,166 $4,295,680 $0 $1,298,177 $33,116,309
26 010178800 Central Florida Regional Hospital $2,944,171 $1,809,630 $1,823,771 $2,123,761 $0 $0 $8,701,333 $1,762,286 $0 $0 $6,939,047
27 010027700 Charlotte Regional Medical Center $1,076,658 $642,058 $248,651 $238,223 $0 $0 $2,205,590 $1,434,879 $0 $0 $770,711
28 010219900 Citrus Memorial Hospital $7,283,214 $3,139,939 $1,255,529 $1,247,124 $7,829,231 $703,346 $21,458,384 $1,797,195 $7,215,881 $1,955,644 $10,489,663
29 010314400 Cleveland Clinic FL Hospital - Naples $6,074,020 $3,341,106 $1,087,182 $1,830,980 $0 $0 $12,333,288 $2,163,314 $0 $1,722,448 $8,447,525
30 010220200 Cleveland Clinic Hospital $466,469 $193,700 $273,695 $297,588 $0 $0 $1,231,453 $2,466,218 $0 $0 -$1,234,765
31 010253900 Columbia Englewood Community Hosp $293,804 $221,992 $65,700 $95,454 $0 $0 $676,949 $450,945 $0 $0 $226,004
32 012030800 Columbia Hospital $5,497,249 $829,271 $3,480,501 $652,226 $79,786 $0 $10,539,034 $997,729 $0 $1,037,158 $8,504,147
33 010146000 Columbia JFK Medical Center $22,303,196 $4,164,950 $6,011,954 $2,091,568 $2,147,115 $0 $36,718,782 $5,036,335 $0 $4,237,212 $27,445,234
34 012013800 Columbia Kendall Medical Center $19,441,179 $4,908,192 $4,540,174 $1,742,058 $451,017 $0 $31,082,620 $3,349,602 $0 $0 $27,733,018
35 010138900 Columbia Medical Center-Osceola $11,325,582 $4,435,642 $5,672,449 $5,222,023 $180,741 $0 $26,836,437 $3,189,856 $0 $0 $23,646,581
36 010552000 Columbia New Port Richey Hospital $6,818,976 $762,132 $2,282,932 $640,117 $0 $0 $10,504,158 $1,753,524 $0 $0 $8,750,633
37 012026000 Columbia Palms West Hospital $15,438,083 $3,890,113 $3,732,356 $1,882,988 $232,180 $0 $25,175,720 $1,821,279 $0 $2,890,717 $20,463,723
38 012000600 Columbia Plantation General Hosp $25,117,400 $5,241,969 $3,035,622 $2,662,830 $1,158,364 $11,874 $37,228,059 $3,793,979 $0 $0 $33,434,080
39 010125700 Columbia Twin Cities Hospital $342,307 $665,674 $41,392 $115,313 $0 $0 $1,164,686 $501,598 $0 $0 $663,088
40 010960600 Coral Gables Hospital $3,098,646 $1,511,557 $598,702 $704,839 $41,320 $0 $5,955,064 $1,009,063 $0 $0 $4,946,001
41 012040500 Coral Springs Medical Center $17,201,884 $6,552,956 $3,726,774 $2,749,094 $15,039,128 $2,229,442 $47,499,277 $1,710,262 $13,821,547 $2,503,847 $29,463,622
42 012009000 Delray Comm. Hospital $4,971,851 $910,540 $1,010,002 $573,229 $438,491 $0 $7,904,113 $3,586,302 $0 $1,323,752 $2,994,059
43 010192300 Desoto Memorial Hospital $3,346,217 $2,710,582 $125,390 $186,631 $267,943 $178,036 $6,814,799 $333,291 $113,196 $0 $6,368,312
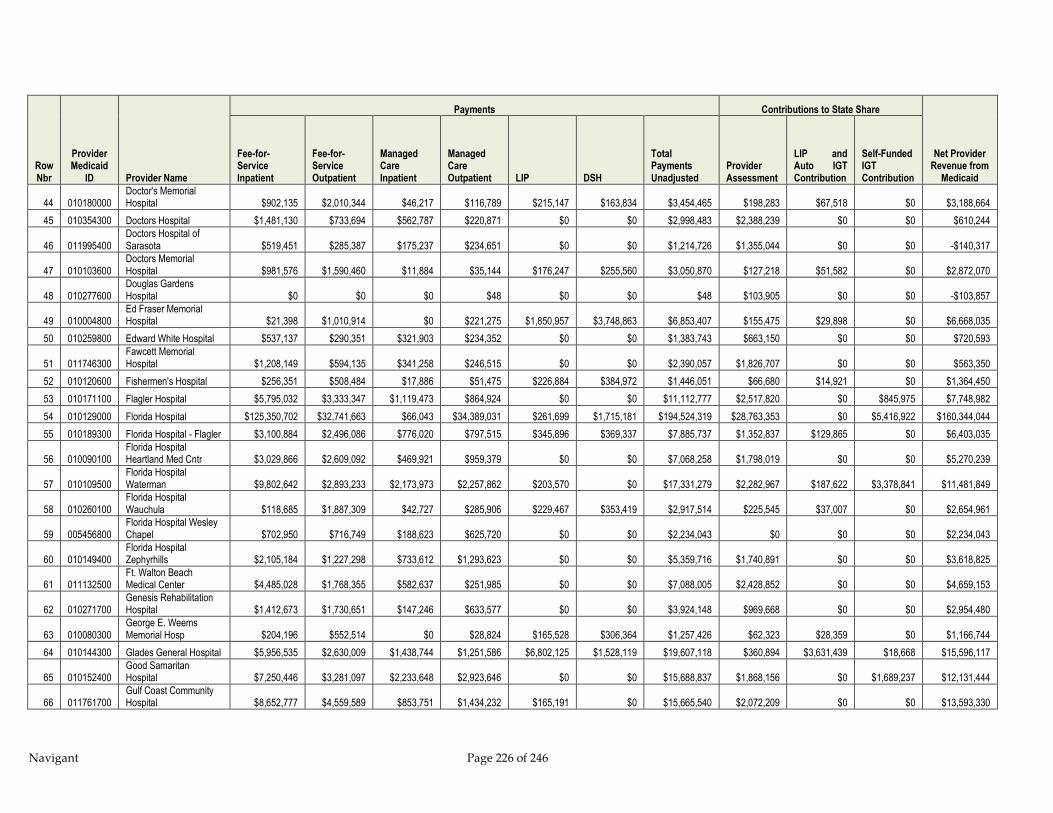
Navigant Page 226 of 246
Row Nbr
Provider Medicaid
ID Provider Name
Payments Contributions to State Share
Net Provider Revenue from
Medicaid
Fee-for-Service Inpatient
Fee-for-Service Outpatient
Managed Care Inpatient
Managed Care Outpatient LIP DSH
Total Payments Unadjusted
Provider Assessment
LIP and Auto IGT Contribution
Self-Funded IGT Contribution
44 010180000 Doctor's Memorial Hospital $902,135 $2,010,344 $46,217 $116,789 $215,147 $163,834 $3,454,465 $198,283 $67,518 $0 $3,188,664
45 010354300 Doctors Hospital $1,481,130 $733,694 $562,787 $220,871 $0 $0 $2,998,483 $2,388,239 $0 $0 $610,244
46 011995400 Doctors Hospital of Sarasota $519,451 $285,387 $175,237 $234,651 $0 $0 $1,214,726 $1,355,044 $0 $0 -$140,317
47 010103600 Doctors Memorial Hospital $981,576 $1,590,460 $11,884 $35,144 $176,247 $255,560 $3,050,870 $127,218 $51,582 $0 $2,872,070
48 010277600 Douglas Gardens Hospital $0 $0 $0 $48 $0 $0 $48 $103,905 $0 $0 -$103,857
49 010004800 Ed Fraser Memorial Hospital $21,398 $1,010,914 $0 $221,275 $1,850,957 $3,748,863 $6,853,407 $155,475 $29,898 $0 $6,668,035
50 010259800 Edward White Hospital $537,137 $290,351 $321,903 $234,352 $0 $0 $1,383,743 $663,150 $0 $0 $720,593
51 011746300 Fawcett Memorial Hospital $1,208,149 $594,135 $341,258 $246,515 $0 $0 $2,390,057 $1,826,707 $0 $0 $563,350
52 010120600 Fishermen's Hospital $256,351 $508,484 $17,886 $51,475 $226,884 $384,972 $1,446,051 $66,680 $14,921 $0 $1,364,450
53 010171100 Flagler Hospital $5,795,032 $3,333,347 $1,119,473 $864,924 $0 $0 $11,112,777 $2,517,820 $0 $845,975 $7,748,982
54 010129000 Florida Hospital $125,350,702 $32,741,663 $66,043 $34,389,031 $261,699 $1,715,181 $194,524,319 $28,763,353 $0 $5,416,922 $160,344,044
55 010189300 Florida Hospital - Flagler $3,100,884 $2,496,086 $776,020 $797,515 $345,896 $369,337 $7,885,737 $1,352,837 $129,865 $0 $6,403,035
56 010090100 Florida Hospital Heartland Med Cntr $3,029,866 $2,609,092 $469,921 $959,379 $0 $0 $7,068,258 $1,798,019 $0 $0 $5,270,239
57 010109500 Florida Hospital Waterman $9,802,642 $2,893,233 $2,173,973 $2,257,862 $203,570 $0 $17,331,279 $2,282,967 $187,622 $3,378,841 $11,481,849
58 010260100 Florida Hospital Wauchula $118,685 $1,887,309 $42,727 $285,906 $229,467 $353,419 $2,917,514 $225,545 $37,007 $0 $2,654,961
59 005456800 Florida Hospital Wesley Chapel $702,950 $716,749 $188,623 $625,720 $0 $0 $2,234,043 $0 $0 $0 $2,234,043
60 010149400 Florida Hospital Zephyrhills $2,105,184 $1,227,298 $733,612 $1,293,623 $0 $0 $5,359,716 $1,740,891 $0 $0 $3,618,825
61 011132500 Ft. Walton Beach Medical Center $4,485,028 $1,768,355 $582,637 $251,985 $0 $0 $7,088,005 $2,428,852 $0 $0 $4,659,153
62 010271700 Genesis Rehabilitation Hospital $1,412,673 $1,730,651 $147,246 $633,577 $0 $0 $3,924,148 $969,668 $0 $0 $2,954,480
63 010080300 George E. Weems Memorial Hosp $204,196 $552,514 $0 $28,824 $165,528 $306,364 $1,257,426 $62,323 $28,359 $0 $1,166,744
64 010144300 Glades General Hospital $5,956,535 $2,630,009 $1,438,744 $1,251,586 $6,802,125 $1,528,119 $19,607,118 $360,894 $3,631,439 $18,668 $15,596,117
65 010152400 Good Samaritan Hospital $7,250,446 $3,281,097 $2,233,648 $2,923,646 $0 $0 $15,688,837 $1,868,156 $0 $1,689,237 $12,131,444
66 011761700 Gulf Coast Community Hospital $8,652,777 $4,559,589 $853,751 $1,434,232 $165,191 $0 $15,665,540 $2,072,209 $0 $0 $13,593,330
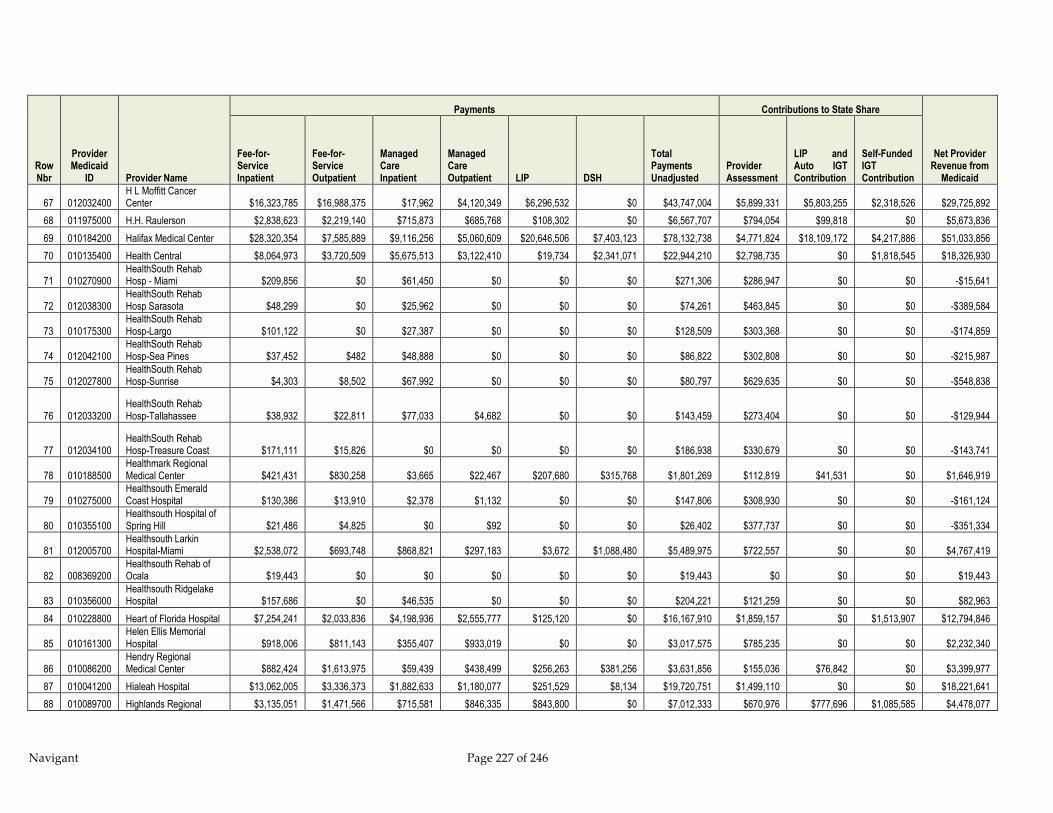
Navigant Page 227 of 246
Row Nbr
Provider Medicaid
ID Provider Name
Payments Contributions to State Share
Net Provider Revenue from
Medicaid
Fee-for-Service Inpatient
Fee-for-Service Outpatient
Managed Care Inpatient
Managed Care Outpatient LIP DSH
Total Payments Unadjusted
Provider Assessment
LIP and Auto IGT Contribution
Self-Funded IGT Contribution
67 012032400 H L Moffitt Cancer Center $16,323,785 $16,988,375 $17,962 $4,120,349 $6,296,532 $0 $43,747,004 $5,899,331 $5,803,255 $2,318,526 $29,725,892
68 011975000 H.H. Raulerson $2,838,623 $2,219,140 $715,873 $685,768 $108,302 $0 $6,567,707 $794,054 $99,818 $0 $5,673,836
69 010184200 Halifax Medical Center $28,320,354 $7,585,889 $9,116,256 $5,060,609 $20,646,506 $7,403,123 $78,132,738 $4,771,824 $18,109,172 $4,217,886 $51,033,856
70 010135400 Health Central $8,064,973 $3,720,509 $5,675,513 $3,122,410 $19,734 $2,341,071 $22,944,210 $2,798,735 $0 $1,818,545 $18,326,930
71 010270900 HealthSouth Rehab Hosp - Miami $209,856 $0 $61,450 $0 $0 $0 $271,306 $286,947 $0 $0 -$15,641
72 012038300 HealthSouth Rehab Hosp Sarasota $48,299 $0 $25,962 $0 $0 $0 $74,261 $463,845 $0 $0 -$389,584
73 010175300 HealthSouth Rehab Hosp-Largo $101,122 $0 $27,387 $0 $0 $0 $128,509 $303,368 $0 $0 -$174,859
74 012042100 HealthSouth Rehab Hosp-Sea Pines $37,452 $482 $48,888 $0 $0 $0 $86,822 $302,808 $0 $0 -$215,987
75 012027800 HealthSouth Rehab Hosp-Sunrise $4,303 $8,502 $67,992 $0 $0 $0 $80,797 $629,635 $0 $0 -$548,838
76 012033200 HealthSouth Rehab Hosp-Tallahassee $38,932 $22,811 $77,033 $4,682 $0 $0 $143,459 $273,404 $0 $0 -$129,944
77 012034100 HealthSouth Rehab Hosp-Treasure Coast $171,111 $15,826 $0 $0 $0 $0 $186,938 $330,679 $0 $0 -$143,741
78 010188500 Healthmark Regional Medical Center $421,431 $830,258 $3,665 $22,467 $207,680 $315,768 $1,801,269 $112,819 $41,531 $0 $1,646,919
79 010275000 Healthsouth Emerald Coast Hospital $130,386 $13,910 $2,378 $1,132 $0 $0 $147,806 $308,930 $0 $0 -$161,124
80 010355100 Healthsouth Hospital of Spring Hill $21,486 $4,825 $0 $92 $0 $0 $26,402 $377,737 $0 $0 -$351,334
81 012005700 Healthsouth Larkin Hospital-Miami $2,538,072 $693,748 $868,821 $297,183 $3,672 $1,088,480 $5,489,975 $722,557 $0 $0 $4,767,419
82 008369200 Healthsouth Rehab of Ocala $19,443 $0 $0 $0 $0 $0 $19,443 $0 $0 $0 $19,443
83 010356000 Healthsouth Ridgelake Hospital $157,686 $0 $46,535 $0 $0 $0 $204,221 $121,259 $0 $0 $82,963
84 010228800 Heart of Florida Hospital $7,254,241 $2,033,836 $4,198,936 $2,555,777 $125,120 $0 $16,167,910 $1,859,157 $0 $1,513,907 $12,794,846
85 010161300 Helen Ellis Memorial Hospital $918,006 $811,143 $355,407 $933,019 $0 $0 $3,017,575 $785,235 $0 $0 $2,232,340
86 010086200 Hendry Regional Medical Center $882,424 $1,613,975 $59,439 $438,499 $256,263 $381,256 $3,631,856 $155,036 $76,842 $0 $3,399,977
87 010041200 Hialeah Hospital $13,062,005 $3,336,373 $1,882,633 $1,180,077 $251,529 $8,134 $19,720,751 $1,499,110 $0 $0 $18,221,641
88 010089700 Highlands Regional $3,135,051 $1,471,566 $715,581 $846,335 $843,800 $0 $7,012,333 $670,976 $777,696 $1,085,585 $4,478,077

Navigant Page 228 of 246
Row Nbr
Provider Medicaid
ID Provider Name
Payments Contributions to State Share
Net Provider Revenue from
Medicaid
Fee-for-Service Inpatient
Fee-for-Service Outpatient
Managed Care Inpatient
Managed Care Outpatient LIP DSH
Total Payments Unadjusted
Provider Assessment
LIP and Auto IGT Contribution
Self-Funded IGT Contribution
Medical Center
89 010008100 Holmes Regional Medical Center $16,516,545 $3,569,177 $4,487,436 $2,503,231 $305,830 $0 $27,382,218 $5,537,304 $0 $0 $21,844,914
90 010018800 Holy Cross Hospital, Inc. $3,437,558 $1,228,251 $594,168 $793,411 $0 $0 $6,053,388 $3,756,061 $0 $0 $2,297,327
91 010226100 Homestead Hospital $15,977,725 $9,588,409 $5,557,448 $6,562,777 $417,436 $5,381 $38,109,177 $2,059,449 $0 $0 $36,049,728
92 010821900 Imperial Point Hospital $5,678,292 $1,532,086 $1,730,293 $1,056,126 $34,378,555 $2,683,479 $47,058,831 $1,158,853 $31,557,004 $1,180,739 $13,162,236
93 010104400 Indian River Memorial Hospital $10,167,293 $4,330,910 $1,446,540 $1,048,784 $9,673,051 $0 $26,666,579 $2,090,632 $8,915,254 $3,026,398 $12,634,295
94 010106100 Jackson Hospital $4,695,413 $2,913,517 $65,633 $162,799 $289,774 $258,275 $8,385,411 $490,788 $157,935 $0 $7,736,688
95 010042100 Jackson Memorial Hospital $313,560,886 $63,320,623 $22,651,168 $18,368,417 $365,499,429 $75,963,625 $859,364,148 $12,063,078 $328,264,793 $56,477,630 $462,558,647
96 010173700 Jay Hospital $130,440 $398,038 $40,199 $104,678 $177,355 $285,075 $1,135,785 $138,204 $45,714 $0 $951,867
97 012029400 Jupiter Hospital $2,468,942 $882,046 $448,555 $479,168 $0 $0 $4,278,712 $1,935,156 $0 $435,403 $1,908,152
98 010234200 Kindred Hospital (Tampa) $55,742 $0 $46,019 $0 $0 $0 $101,761 $319,832 $0 $0 -$218,070
99 011993800 Kindred Hospital - Coral Gables $0 $0 $26,344 $0 $0 $0 $26,344 $375,404 $0 $0 -$349,061
100 010019600 Kindred Hospital - Ft.Lauderdale $11,622 $0 $61,904 $0 $0 $0 $73,527 $446,774 $0 $0 -$373,247
101 010267900 Kindred Hospital - North Florida $15,039 $0 $0 $0 $0 $0 $15,039 $427,237 $0 $0 -$412,198
102 000417000 Kindred Hospital - Palm Beaches $12,198 $0 $2,562 $0 $0 $0 $14,760 $332,075 $0 $0 -$317,316
103 010353500 Kindred Hospital Ocala $92,853 $0 $12,857 $0 $0 $0 $105,709 $148,954 $0 $0 -$43,245
104 010191500 Kindred Hospital-Hollywood $10,666 $0 $66,957 $0 $0 $0 $77,623 $572,953 $0 $0 -$495,331
105 001681500 Kindred Hospital-Melbourne $99,538 $0 $29,272 $0 $0 $0 $128,811 $263,004 $0 $0 -$134,193
106 010276800 Kindred Hospital-St. Petersburg $50,241 $0 $16,328 $0 $0 $0 $66,569 $416,309 $0 $0 -$349,740
107 011021300 L.W. Blake Memorial Hospital $3,882,936 $1,439,381 $1,704,088 $1,105,529 $206,266 $0 $8,338,199 $2,274,229 $0 $726,751 $5,337,219
108 010822700 Lake Butler Hospital $19,752 $778,483 $0 $15,952 $455,768 $478,786 $1,748,741 $93,312 $40,015 $0 $1,615,415
109 011976800 Lake City Medical Center $584,419 $1,383,185 $38,699 $61,920 $0 $0 $2,068,223 $736,753 $0 $0 $1,331,470
110 010166400 Lake Wales Hospital Association $1,930,962 $1,231,361 $1,544,823 $1,362,746 $0 $0 $6,069,893 $738,327 $0 $283,664 $5,047,902
111 010164800 Lakeland Regional $33,967,374 $13,088,958 $17,348,578 $18,007,721 $4,380,361 $0 $86,792,992 $6,548,212 $0 $5,303,622 $74,941,158
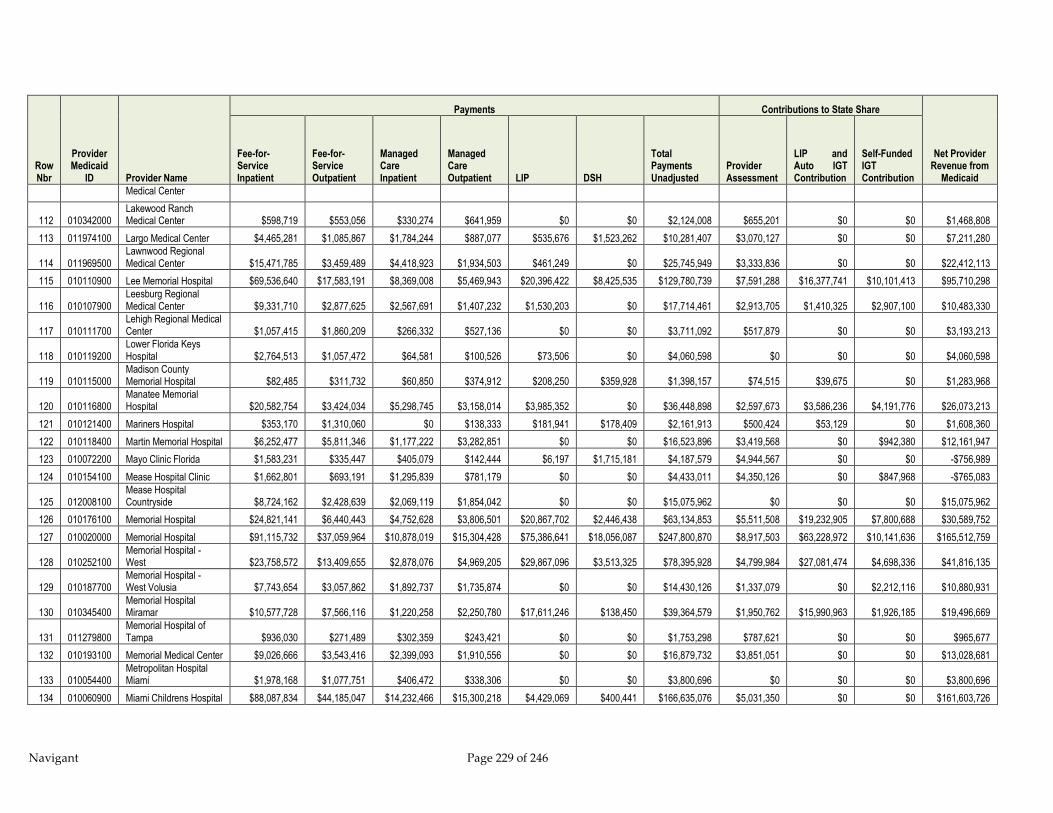
Navigant Page 229 of 246
Row Nbr
Provider Medicaid
ID Provider Name
Payments Contributions to State Share
Net Provider Revenue from
Medicaid
Fee-for-Service Inpatient
Fee-for-Service Outpatient
Managed Care Inpatient
Managed Care Outpatient LIP DSH
Total Payments Unadjusted
Provider Assessment
LIP and Auto IGT Contribution
Self-Funded IGT Contribution
Medical Center
112 010342000 Lakewood Ranch Medical Center $598,719 $553,056 $330,274 $641,959 $0 $0 $2,124,008 $655,201 $0 $0 $1,468,808
113 011974100 Largo Medical Center $4,465,281 $1,085,867 $1,784,244 $887,077 $535,676 $1,523,262 $10,281,407 $3,070,127 $0 $0 $7,211,280
114 011969500 Lawnwood Regional Medical Center $15,471,785 $3,459,489 $4,418,923 $1,934,503 $461,249 $0 $25,745,949 $3,333,836 $0 $0 $22,412,113
115 010110900 Lee Memorial Hospital $69,536,640 $17,583,191 $8,369,008 $5,469,943 $20,396,422 $8,425,535 $129,780,739 $7,591,288 $16,377,741 $10,101,413 $95,710,298
116 010107900 Leesburg Regional Medical Center $9,331,710 $2,877,625 $2,567,691 $1,407,232 $1,530,203 $0 $17,714,461 $2,913,705 $1,410,325 $2,907,100 $10,483,330
117 010111700 Lehigh Regional Medical Center $1,057,415 $1,860,209 $266,332 $527,136 $0 $0 $3,711,092 $517,879 $0 $0 $3,193,213
118 010119200 Lower Florida Keys Hospital $2,764,513 $1,057,472 $64,581 $100,526 $73,506 $0 $4,060,598 $0 $0 $0 $4,060,598
119 010115000 Madison County Memorial Hospital $82,485 $311,732 $60,850 $374,912 $208,250 $359,928 $1,398,157 $74,515 $39,675 $0 $1,283,968
120 010116800 Manatee Memorial Hospital $20,582,754 $3,424,034 $5,298,745 $3,158,014 $3,985,352 $0 $36,448,898 $2,597,673 $3,586,236 $4,191,776 $26,073,213
121 010121400 Mariners Hospital $353,170 $1,310,060 $0 $138,333 $181,941 $178,409 $2,161,913 $500,424 $53,129 $0 $1,608,360
122 010118400 Martin Memorial Hospital $6,252,477 $5,811,346 $1,177,222 $3,282,851 $0 $0 $16,523,896 $3,419,568 $0 $942,380 $12,161,947
123 010072200 Mayo Clinic Florida $1,583,231 $335,447 $405,079 $142,444 $6,197 $1,715,181 $4,187,579 $4,944,567 $0 $0 -$756,989
124 010154100 Mease Hospital Clinic $1,662,801 $693,191 $1,295,839 $781,179 $0 $0 $4,433,011 $4,350,126 $0 $847,968 -$765,083
125 012008100 Mease Hospital Countryside $8,724,162 $2,428,639 $2,069,119 $1,854,042 $0 $0 $15,075,962 $0 $0 $0 $15,075,962
126 010176100 Memorial Hospital $24,821,141 $6,440,443 $4,752,628 $3,806,501 $20,867,702 $2,446,438 $63,134,853 $5,511,508 $19,232,905 $7,800,688 $30,589,752
127 010020000 Memorial Hospital $91,115,732 $37,059,964 $10,878,019 $15,304,428 $75,386,641 $18,056,087 $247,800,870 $8,917,503 $63,228,972 $10,141,636 $165,512,759
128 010252100 Memorial Hospital - West $23,758,572 $13,409,655 $2,878,076 $4,969,205 $29,867,096 $3,513,325 $78,395,928 $4,799,984 $27,081,474 $4,698,336 $41,816,135
129 010187700 Memorial Hospital - West Volusia $7,743,654 $3,057,862 $1,892,737 $1,735,874 $0 $0 $14,430,126 $1,337,079 $0 $2,212,116 $10,880,931
130 010345400 Memorial Hospital Miramar $10,577,728 $7,566,116 $1,220,258 $2,250,780 $17,611,246 $138,450 $39,364,579 $1,950,762 $15,990,963 $1,926,185 $19,496,669
131 011279800 Memorial Hospital of Tampa $936,030 $271,489 $302,359 $243,421 $0 $0 $1,753,298 $787,621 $0 $0 $965,677
132 010193100 Memorial Medical Center $9,026,666 $3,543,416 $2,399,093 $1,910,556 $0 $0 $16,879,732 $3,851,051 $0 $0 $13,028,681
133 010054400 Metropolitan Hospital Miami $1,978,168 $1,077,751 $406,472 $338,306 $0 $0 $3,800,696 $0 $0 $0 $3,800,696
134 010060900 Miami Childrens Hospital $88,087,834 $44,185,047 $14,232,466 $15,300,218 $4,429,069 $400,441 $166,635,076 $5,031,350 $0 $0 $161,603,726
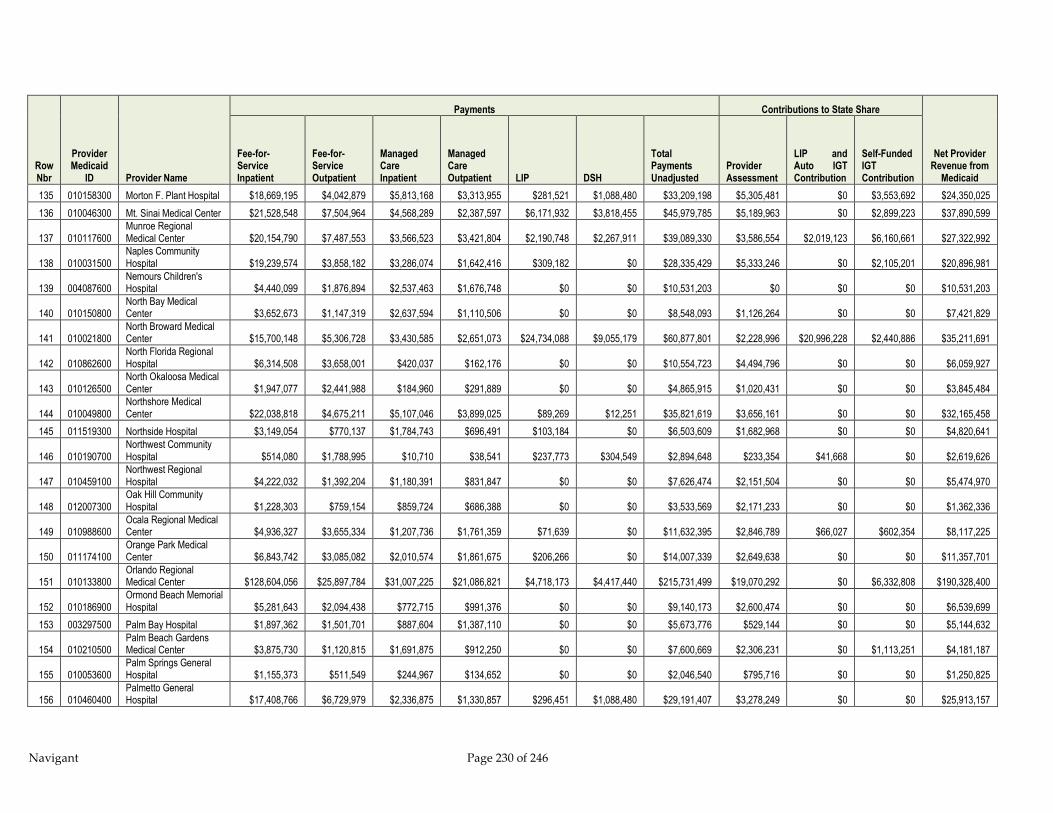
Navigant Page 230 of 246
Row Nbr
Provider Medicaid
ID Provider Name
Payments Contributions to State Share
Net Provider Revenue from
Medicaid
Fee-for-Service Inpatient
Fee-for-Service Outpatient
Managed Care Inpatient
Managed Care Outpatient LIP DSH
Total Payments Unadjusted
Provider Assessment
LIP and Auto IGT Contribution
Self-Funded IGT Contribution
135 010158300 Morton F. Plant Hospital $18,669,195 $4,042,879 $5,813,168 $3,313,955 $281,521 $1,088,480 $33,209,198 $5,305,481 $0 $3,553,692 $24,350,025
136 010046300 Mt. Sinai Medical Center $21,528,548 $7,504,964 $4,568,289 $2,387,597 $6,171,932 $3,818,455 $45,979,785 $5,189,963 $0 $2,899,223 $37,890,599
137 010117600 Munroe Regional Medical Center $20,154,790 $7,487,553 $3,566,523 $3,421,804 $2,190,748 $2,267,911 $39,089,330 $3,586,554 $2,019,123 $6,160,661 $27,322,992
138 010031500 Naples Community Hospital $19,239,574 $3,858,182 $3,286,074 $1,642,416 $309,182 $0 $28,335,429 $5,333,246 $0 $2,105,201 $20,896,981
139 004087600 Nemours Children's Hospital $4,440,099 $1,876,894 $2,537,463 $1,676,748 $0 $0 $10,531,203 $0 $0 $0 $10,531,203
140 010150800 North Bay Medical Center $3,652,673 $1,147,319 $2,637,594 $1,110,506 $0 $0 $8,548,093 $1,126,264 $0 $0 $7,421,829
141 010021800 North Broward Medical Center $15,700,148 $5,306,728 $3,430,585 $2,651,073 $24,734,088 $9,055,179 $60,877,801 $2,228,996 $20,996,228 $2,440,886 $35,211,691
142 010862600 North Florida Regional Hospital $6,314,508 $3,658,001 $420,037 $162,176 $0 $0 $10,554,723 $4,494,796 $0 $0 $6,059,927
143 010126500 North Okaloosa Medical Center $1,947,077 $2,441,988 $184,960 $291,889 $0 $0 $4,865,915 $1,020,431 $0 $0 $3,845,484
144 010049800 Northshore Medical Center $22,038,818 $4,675,211 $5,107,046 $3,899,025 $89,269 $12,251 $35,821,619 $3,656,161 $0 $0 $32,165,458
145 011519300 Northside Hospital $3,149,054 $770,137 $1,784,743 $696,491 $103,184 $0 $6,503,609 $1,682,968 $0 $0 $4,820,641
146 010190700 Northwest Community Hospital $514,080 $1,788,995 $10,710 $38,541 $237,773 $304,549 $2,894,648 $233,354 $41,668 $0 $2,619,626
147 010459100 Northwest Regional Hospital $4,222,032 $1,392,204 $1,180,391 $831,847 $0 $0 $7,626,474 $2,151,504 $0 $0 $5,474,970
148 012007300 Oak Hill Community Hospital $1,228,303 $759,154 $859,724 $686,388 $0 $0 $3,533,569 $2,171,233 $0 $0 $1,362,336
149 010988600 Ocala Regional Medical Center $4,936,327 $3,655,334 $1,207,736 $1,761,359 $71,639 $0 $11,632,395 $2,846,789 $66,027 $602,354 $8,117,225
150 011174100 Orange Park Medical Center $6,843,742 $3,085,082 $2,010,574 $1,861,675 $206,266 $0 $14,007,339 $2,649,638 $0 $0 $11,357,701
151 010133800 Orlando Regional Medical Center $128,604,056 $25,897,784 $31,007,225 $21,086,821 $4,718,173 $4,417,440 $215,731,499 $19,070,292 $0 $6,332,808 $190,328,400
152 010186900 Ormond Beach Memorial Hospital $5,281,643 $2,094,438 $772,715 $991,376 $0 $0 $9,140,173 $2,600,474 $0 $0 $6,539,699
153 003297500 Palm Bay Hospital $1,897,362 $1,501,701 $887,604 $1,387,110 $0 $0 $5,673,776 $529,144 $0 $0 $5,144,632
154 010210500 Palm Beach Gardens Medical Center $3,875,730 $1,120,815 $1,691,875 $912,250 $0 $0 $7,600,669 $2,306,231 $0 $1,113,251 $4,181,187
155 010053600 Palm Springs General Hospital $1,155,373 $511,549 $244,967 $134,652 $0 $0 $2,046,540 $795,716 $0 $0 $1,250,825
156 010460400 Palmetto General Hospital $17,408,766 $6,729,979 $2,336,875 $1,330,857 $296,451 $1,088,480 $29,191,407 $3,278,249 $0 $0 $25,913,157

Navigant Page 231 of 246
Row Nbr
Provider Medicaid
ID Provider Name
Payments Contributions to State Share
Net Provider Revenue from
Medicaid
Fee-for-Service Inpatient
Fee-for-Service Outpatient
Managed Care Inpatient
Managed Care Outpatient LIP DSH
Total Payments Unadjusted
Provider Assessment
LIP and Auto IGT Contribution
Self-Funded IGT Contribution
157 012011100 Palms of Pasadena Hospital $430,451 $205,300 $221,930 $165,259 $0 $0 $1,022,940 $957,224 $0 $0 $65,716
158 006344700 Park Royal Hospital $39,374 $0 $0 $0 $0 $0 $39,374 $0 $0 $0 $39,374
159 010010200 Parrish Medical Center $5,033,434 $4,636,061 $1,482,525 $3,137,967 $1,145,682 $1,063,987 $16,499,656 $1,711,111 $1,055,928 $1,683,330 $12,049,287
160 010959200 Pasco Community Hospital $824,161 $1,127,607 $450,960 $1,388,402 $0 $0 $3,791,130 $628,619 $0 $0 $3,162,511
161 010028500 Peace River Regional Medical Center $4,091,955 $1,691,959 $518,772 $563,182 $0 $0 $6,865,867 $1,132,986 $0 $0 $5,732,881
162 010222900 Pembroke Pines Hospital $5,706,722 $5,178,141 $1,010,512 $2,562,383 $23,388,504 $2,869,746 $40,716,007 $1,294,989 $20,765,069 $1,030,227 $17,625,722
163 011351400 Putnam Community Hospital $3,418,929 $2,867,824 $1,133,750 $1,218,839 $211,609 $0 $8,850,952 $702,679 $195,031 $0 $7,953,241
164 010323300 Sacred Heart Hosp - Emerald Coast $4,541,782 $2,220,786 $193,878 $185,480 $114,197 $0 $7,256,123 $979,746 $105,251 $0 $6,171,127
165 002012700 Sacred Heart Hosp. - Gulf $562,978 $1,577,804 $34,982 $69,997 $453,100 $0 $2,698,860 $89,824 $417,604 $0 $2,191,433
166 010076500 Sacred Heart Hospital $36,507,810 $11,451,855 $5,329,289 $4,604,181 $4,405,782 $16,871 $62,315,788 $5,128,626 $0 $2,016,588 $55,170,573
167 010174500 Santa Rosa Hospital $3,558,855 $2,945,659 $836,515 $1,344,721 $132,894 $0 $8,818,645 $666,399 $122,483 $866,551 $7,163,212
168 012001400 Sebastian Hospital $575,523 $672,900 $193,185 $237,672 $0 $0 $1,679,279 $895,379 $0 $0 $783,900
169 010339000 Select Specialty Hospital - Orlando $243,446 $0 $10,913 $0 $0 $0 $254,359 $515,537 $0 $0 -$261,178
170 010337300 Select Specialty Hospital Miami $0 $0 $86,598 $0 $0 $0 $86,598 $352,181 $0 $0 -$265,584
171 010343800 Select Specialty Hospital Panama City $120,918 $0 $19,684 $0 $0 $0 $140,602 $197,041 $0 $0 -$56,439
172 011998900 Seven Rivers Community Hospital $1,494,936 $1,146,901 $368,818 $700,803 $0 $0 $3,711,458 $1,019,356 $0 $0 $2,692,102
173 010033100 Shands At Lake Shore $8,897,874 $5,299,203 $996,133 $726,779 $3,549,903 $211,791 $19,681,683 $403,606 $2,968,218 $111,568 $16,198,291
174 010067600 Shands Jacksonville Med Cntr $85,570,569 $35,274,547 $7,353,003 $4,622,671 $38,654,443 $14,017,104 $185,492,338 $5,393,995 $4,171,073 $11,889,965 $164,037,305
175 010003000 Shands Teaching Hospital $166,226,596 $41,926,030 $15,280,508 $3,131,908 $8,336,553 $14,031,063 $248,932,658 $12,873,148 $0 $18,641,540 $217,417,970
176 010179600 Shands at Live Oak $674,344 $3,186,313 $49,096 $415,940 $764,440 $203,592 $5,293,725 $215,837 $306,413 $1,229 $4,770,245
177 010007200 Shands at Starke $942,367 $3,184,344 $151,051 $711,696 $390,869 $191,797 $5,572,124 $230,723 $89,366 $0 $5,252,034
178 002576600 Shriners Hospital for Children $1,948,482 $629,832 $185,200 $402,828 $0 $0 $3,166,343 $26,398 $0 $0 $3,139,945
179 010328400 Sister Emmanuel $16,314 $0 $50,900 $162 $0 $0 $67,375 $132,677 $0 $0 -$65,302

Navigant Page 232 of 246
Row Nbr
Provider Medicaid
ID Provider Name
Payments Contributions to State Share
Net Provider Revenue from
Medicaid
Fee-for-Service Inpatient
Fee-for-Service Outpatient
Managed Care Inpatient
Managed Care Outpatient LIP DSH
Total Payments Unadjusted
Provider Assessment
LIP and Auto IGT Contribution
Self-Funded IGT Contribution
Hospital
180 011994600 South Bay Hospital $1,058,951 $585,369 $700,719 $672,009 $0 $0 $3,017,048 $968,621 $0 $236,853 $1,811,574
181 010098600 South Florida Baptist $5,664,951 $2,991,238 $2,354,998 $2,639,731 $17,064 $0 $13,667,982 $1,029,083 $0 $1,383,495 $11,255,404
182 010108700 South Lake Memorial Hospital $5,341,881 $2,985,574 $2,486,109 $2,330,458 $0 $0 $13,144,022 $1,583,685 $0 $1,629,196 $9,931,141
183 010058700 South Miami Hospital $14,004,206 $3,033,174 $1,159,618 $610,291 $0 $0 $18,807,289 $5,593,240 $0 $0 $13,214,049
184 011134100 Southwest Florida Regional Medical $17,386,310 $4,675,930 $4,535,321 $2,410,754 $0 $799,353 $29,807,669 $3,748,530 $0 $6,165,920 $19,893,218
185 010377200 Specialty Hospital - Gainesville $155,176 $0 $0 $0 $0 $0 $155,176 $224,461 $0 $0 -$69,285
186 010376400 Specialty Hospital - Palm Beach $81,835 $0 $39,966 $0 $0 $0 $121,801 $320,173 $0 $0 -$198,372
187 010368300 Specialty Hospital - Pensacola $360,378 $0 $40,914 $0 $0 $0 $401,292 $377,005 $0 $0 $24,286
188 010374800 Specialty Hospital - Tallahassee $222,560 $0 $10,462 $0 $0 $0 $233,022 $216,757 $0 $0 $16,265
189 012022700 St Anthonys Hospital $7,452,531 $2,196,957 $3,478,013 $1,805,717 $16,338 $0 $14,949,555 $2,169,177 $0 $0 $12,780,378
190 010346200 St. Cloud Regional Center $838,467 $982,652 $563,631 $1,163,092 $0 $0 $3,547,842 $605,182 $0 $0 $2,942,660
191 010240700 St. John's Rehabilitation Hospital $261,260 $0 $222,758 $0 $0 $0 $484,018 $146,793 $0 $0 $337,224
192 010097800 St. Joseph's Hospital $78,787,275 $17,584,182 $0 $15,720,415 $938,998 $29,384 $113,060,253 $9,792,404 $0 $14,745,376 $88,522,473
193 010373000 St. Lukes- St. Vincent's Healthcare $3,568,721 $1,046,210 $532,161 $453,200 $0 $0 $5,600,291 $1,770,351 $0 $0 $3,829,940
194 010148600 St. Mary's Hospital $57,154,158 $7,356,544 $9,439,087 $4,477,081 $1,090,304 $20,317 $79,537,491 $3,360,947 $0 $7,069,928 $69,106,615
195 012010300 St. Petersburg General Hospital $4,066,860 $1,429,729 $1,638,460 $1,119,038 $582,350 $1,088,480 $9,924,917 $1,286,138 $0 $0 $8,638,779
196 010073100 St. Vincent's Hospital $10,740,438 $2,526,366 $2,793,611 $1,117,429 $1,670,918 $1,088,480 $19,937,242 $4,931,686 $0 $0 $15,005,556
197 012002200 St.Catherine's Rehab Hosp $505,185 $0 $296,840 $14 $0 $0 $802,039 $376,932 $0 $0 $425,107
198 011997100 St.Lucie Medical Center $5,261,694 $1,464,353 $1,504,842 $862,997 $104,347 $1,088,480 $10,286,713 $2,171,609 $0 $0 $8,115,104
199 010113300 Tallahassee Memorial Rgnl Med Cntr $19,840,010 $4,912,227 $5,463,544 $3,306,661 $1,651,845 $1,088,480 $36,262,766 $5,140,181 $0 $0 $31,122,586
200 010099400 Tampa General Hospital $122,846,651 $14,599,975 $28,898,713 $10,162,807 $17,702,984 $9,507,190 $203,718,320 $12,278,638 $0 $21,606,920 $169,832,762
201 010317900 The Villages Regional Hospital $1,457,561 $936,256 $360,270 $446,967 $0 $0 $3,201,053 $1,783,143 $0 $0 $1,417,911
202 011984900 Town and Country $1,541,229 $827,355 $752,379 $786,317 $0 $0 $3,907,280 $683,836 $0 $337,202 $2,886,242

Navigant Page 233 of 246
Row Nbr
Provider Medicaid
ID Provider Name
Payments Contributions to State Share
Net Provider Revenue from
Medicaid
Fee-for-Service Inpatient
Fee-for-Service Outpatient
Managed Care Inpatient
Managed Care Outpatient LIP DSH
Total Payments Unadjusted
Provider Assessment
LIP and Auto IGT Contribution
Self-Funded IGT Contribution
Hospital
203 010114100 Tri-County Hospital Williston $440,880 $240,445 $5,202 $17,487 $141,113 $156,896 $1,002,024 $52,822 $26,221 $0 $922,981
204 000949600 UCHLTACH at Connerton $228,428 $0 $819 $1,638 $0 $0 $230,885 $333,210 $0 $0 -$102,325
205 010094300 Univ Community Hosp Carrollwood $1,548,592 $1,240,547 $856,158 $1,302,508 $0 $0 $4,947,805 $1,187,694 $0 $758,866 $3,001,245
206 010102800 Univ Community Hosp-Tampa $8,637,144 $2,164,622 $3,853,767 $2,846,079 $0 $0 $17,501,612 $4,123,553 $0 $1,406,140 $11,971,919
207 011280100 University Hospital & Medical Center $1,549,050 $708,809 $414,551 $398,062 $0 $0 $3,070,472 $1,315,839 $0 $0 $1,754,633
208 010047100 University of Miami Hospital $4,684,177 $21,930,071 $371,143 $2,861,198 $0 $0 $29,846,589 $2,641,524 $0 $0 $27,205,064
209 011973300 Venice Hospital $858,682 $355,381 $202,085 $241,757 $0 $0 $1,657,906 $2,006,290 $0 $0 -$348,385
210 003158800 Viera Hospital $887,853 $589,236 $195,286 $364,382 $0 $0 $2,036,757 $361,054 $0 $0 $1,675,704
211 010182600 Volusia Medical Center $4,364,136 $2,822,141 $2,517,196 $2,677,811 $0 $0 $12,381,284 $1,525,972 $0 $1,717,903 $9,137,409
212 010213000 Wellington Regional Medical Center $10,746,689 $2,473,196 $1,246,339 $1,244,512 $21,108 $0 $15,731,845 $1,535,221 $0 $1,853,769 $12,342,854
213 012024300 West Boca Medical Center $6,468,585 $1,950,797 $1,373,362 $1,580,855 $0 $0 $11,373,600 $1,744,057 $0 $0 $9,629,543
214 011321200 West Florida Regional Med Cntr $3,613,751 $1,423,503 $1,580,038 $640,284 $0 $0 $7,257,576 $2,535,488 $0 $0 $4,722,088
215 010170200 West Gables Rehabilitation $229,445 $0 $131,746 $0 $0 $0 $361,191 $300,157 $0 $0 $61,034
216 003226500 West Kendall $3,602,796 $3,587,399 $547,654 $1,644,463 $0 $0 $9,382,312 $689,232 $0 $0 $8,693,079
217 010062500 Westchester General Hospital $3,108,657 $602,495 $3,252,794 $285,829 $0 $0 $7,249,775 $785,068 $0 $0 $6,464,706
218 011230500 Westside Regional Medical Center $2,008,372 $462,734 $628,559 $326,896 $0 $0 $3,426,560 $2,221,317 $0 $0 $1,205,243
219 010169900 Winter Haven Hospital $16,068,909 $3,620,900 $8,764,858 $3,421,325 $1,104,422 $0 $32,980,413 $2,607,402 $0 $2,363,288 $28,009,723
220 010320900 Wuesthoff Medical Center Melbourne $1,688,016 $986,496 $1,070,599 $1,260,586 $0 $0 $5,005,697 $887,089 $0 $0 $4,118,608
221 010011100 Wuesthoff Memorial Hospital $4,926,664 $1,863,288 $1,825,298 $1,917,107 $0 $0 $10,532,356 $1,720,574 $0 $0 $8,811,781
Total
$2,738,439,044 $896,174,845 $476,766,429 $432,627,901 $914,743,618 $240,525,403 $5,699,277,240 $491,249,874 $711,727,197 $310,674,932 $4,185,625,237
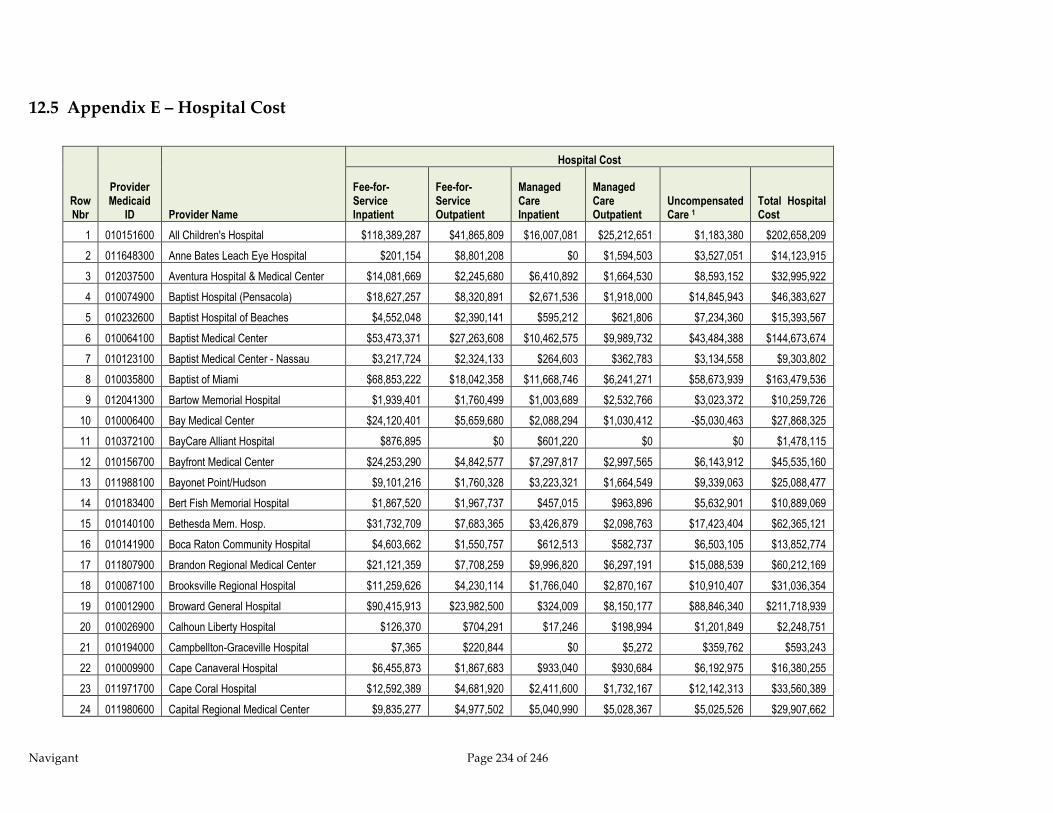
Navigant Page 234 of 246
12.5 Appendix E – Hospital Cost
Row Nbr
Provider Medicaid
ID Provider Name
Hospital Cost
Fee-for-Service Inpatient
Fee-for-Service Outpatient
Managed Care Inpatient
Managed Care Outpatient
Uncompensated Care 1
Total Hospital Cost
1 010151600 All Children's Hospital $118,389,287 $41,865,809 $16,007,081 $25,212,651 $1,183,380 $202,658,209
2 011648300 Anne Bates Leach Eye Hospital $201,154 $8,801,208 $0 $1,594,503 $3,527,051 $14,123,915
3 012037500 Aventura Hospital & Medical Center $14,081,669 $2,245,680 $6,410,892 $1,664,530 $8,593,152 $32,995,922
4 010074900 Baptist Hospital (Pensacola) $18,627,257 $8,320,891 $2,671,536 $1,918,000 $14,845,943 $46,383,627
5 010232600 Baptist Hospital of Beaches $4,552,048 $2,390,141 $595,212 $621,806 $7,234,360 $15,393,567
6 010064100 Baptist Medical Center $53,473,371 $27,263,608 $10,462,575 $9,989,732 $43,484,388 $144,673,674
7 010123100 Baptist Medical Center - Nassau $3,217,724 $2,324,133 $264,603 $362,783 $3,134,558 $9,303,802
8 010035800 Baptist of Miami $68,853,222 $18,042,358 $11,668,746 $6,241,271 $58,673,939 $163,479,536
9 012041300 Bartow Memorial Hospital $1,939,401 $1,760,499 $1,003,689 $2,532,766 $3,023,372 $10,259,726
10 010006400 Bay Medical Center $24,120,401 $5,659,680 $2,088,294 $1,030,412 -$5,030,463 $27,868,325
11 010372100 BayCare Alliant Hospital $876,895 $0 $601,220 $0 $0 $1,478,115
12 010156700 Bayfront Medical Center $24,253,290 $4,842,577 $7,297,817 $2,997,565 $6,143,912 $45,535,160
13 011988100 Bayonet Point/Hudson $9,101,216 $1,760,328 $3,223,321 $1,664,549 $9,339,063 $25,088,477
14 010183400 Bert Fish Memorial Hospital $1,867,520 $1,967,737 $457,015 $963,896 $5,632,901 $10,889,069
15 010140100 Bethesda Mem. Hosp. $31,732,709 $7,683,365 $3,426,879 $2,098,763 $17,423,404 $62,365,121
16 010141900 Boca Raton Community Hospital $4,603,662 $1,550,757 $612,513 $582,737 $6,503,105 $13,852,774
17 011807900 Brandon Regional Medical Center $21,121,359 $7,708,259 $9,996,820 $6,297,191 $15,088,539 $60,212,169
18 010087100 Brooksville Regional Hospital $11,259,626 $4,230,114 $1,766,040 $2,870,167 $10,910,407 $31,036,354
19 010012900 Broward General Hospital $90,415,913 $23,982,500 $324,009 $8,150,177 $88,846,340 $211,718,939
20 010026900 Calhoun Liberty Hospital $126,370 $704,291 $17,246 $198,994 $1,201,849 $2,248,751
21 010194000 Campbellton-Graceville Hospital $7,365 $220,844 $0 $5,272 $359,762 $593,243
22 010009900 Cape Canaveral Hospital $6,455,873 $1,867,683 $933,040 $930,684 $6,192,975 $16,380,255
23 011971700 Cape Coral Hospital $12,592,389 $4,681,920 $2,411,600 $1,732,167 $12,142,313 $33,560,389
24 011980600 Capital Regional Medical Center $9,835,277 $4,977,502 $5,040,990 $5,028,367 $5,025,526 $29,907,662
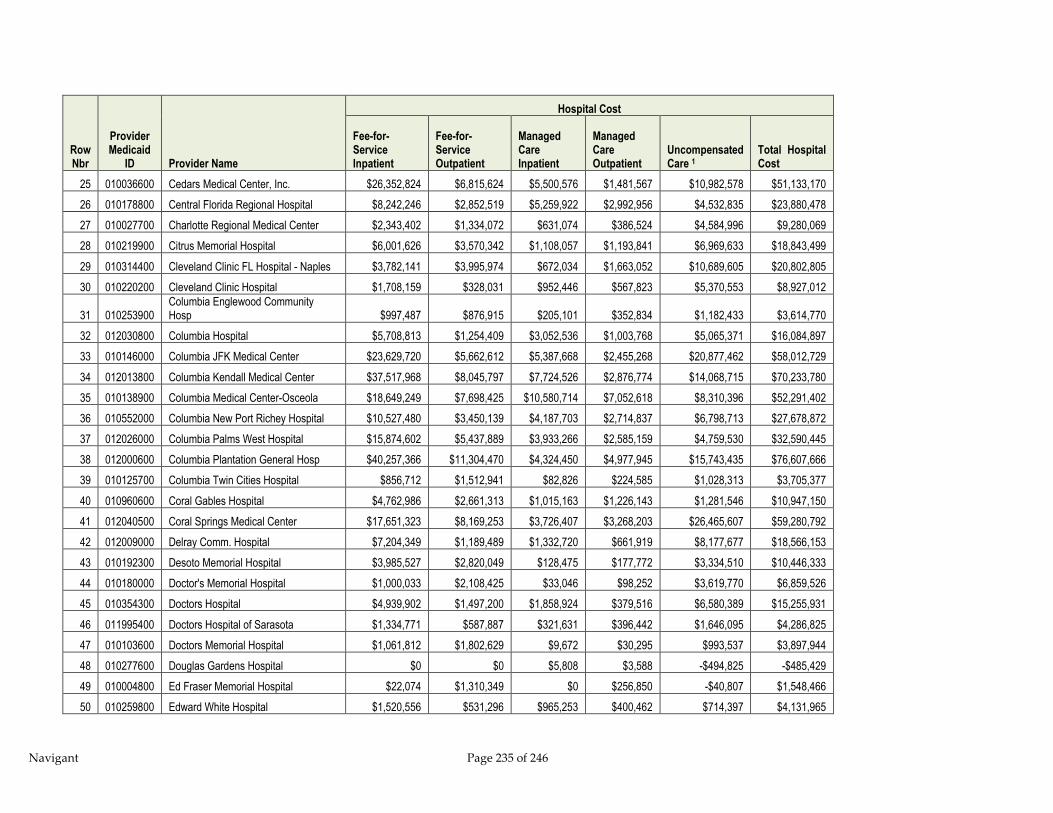
Navigant Page 235 of 246
Row Nbr
Provider Medicaid
ID Provider Name
Hospital Cost
Fee-for-Service Inpatient
Fee-for-Service Outpatient
Managed Care Inpatient
Managed Care Outpatient
Uncompensated Care 1
Total Hospital Cost
25 010036600 Cedars Medical Center, Inc. $26,352,824 $6,815,624 $5,500,576 $1,481,567 $10,982,578 $51,133,170
26 010178800 Central Florida Regional Hospital $8,242,246 $2,852,519 $5,259,922 $2,992,956 $4,532,835 $23,880,478
27 010027700 Charlotte Regional Medical Center $2,343,402 $1,334,072 $631,074 $386,524 $4,584,996 $9,280,069
28 010219900 Citrus Memorial Hospital $6,001,626 $3,570,342 $1,108,057 $1,193,841 $6,969,633 $18,843,499
29 010314400 Cleveland Clinic FL Hospital - Naples $3,782,141 $3,995,974 $672,034 $1,663,052 $10,689,605 $20,802,805
30 010220200 Cleveland Clinic Hospital $1,708,159 $328,031 $952,446 $567,823 $5,370,553 $8,927,012
31 010253900 Columbia Englewood Community Hosp $997,487 $876,915 $205,101 $352,834 $1,182,433 $3,614,770
32 012030800 Columbia Hospital $5,708,813 $1,254,409 $3,052,536 $1,003,768 $5,065,371 $16,084,897
33 010146000 Columbia JFK Medical Center $23,629,720 $5,662,612 $5,387,668 $2,455,268 $20,877,462 $58,012,729
34 012013800 Columbia Kendall Medical Center $37,517,968 $8,045,797 $7,724,526 $2,876,774 $14,068,715 $70,233,780
35 010138900 Columbia Medical Center-Osceola $18,649,249 $7,698,425 $10,580,714 $7,052,618 $8,310,396 $52,291,402
36 010552000 Columbia New Port Richey Hospital $10,527,480 $3,450,139 $4,187,703 $2,714,837 $6,798,713 $27,678,872
37 012026000 Columbia Palms West Hospital $15,874,602 $5,437,889 $3,933,266 $2,585,159 $4,759,530 $32,590,445
38 012000600 Columbia Plantation General Hosp $40,257,366 $11,304,470 $4,324,450 $4,977,945 $15,743,435 $76,607,666
39 010125700 Columbia Twin Cities Hospital $856,712 $1,512,941 $82,826 $224,585 $1,028,313 $3,705,377
40 010960600 Coral Gables Hospital $4,762,986 $2,661,313 $1,015,163 $1,226,143 $1,281,546 $10,947,150
41 012040500 Coral Springs Medical Center $17,651,323 $8,169,253 $3,726,407 $3,268,203 $26,465,607 $59,280,792
42 012009000 Delray Comm. Hospital $7,204,349 $1,189,489 $1,332,720 $661,919 $8,177,677 $18,566,153
43 010192300 Desoto Memorial Hospital $3,985,527 $2,820,049 $128,475 $177,772 $3,334,510 $10,446,333
44 010180000 Doctor's Memorial Hospital $1,000,033 $2,108,425 $33,046 $98,252 $3,619,770 $6,859,526
45 010354300 Doctors Hospital $4,939,902 $1,497,200 $1,858,924 $379,516 $6,580,389 $15,255,931
46 011995400 Doctors Hospital of Sarasota $1,334,771 $587,887 $321,631 $396,442 $1,646,095 $4,286,825
47 010103600 Doctors Memorial Hospital $1,061,812 $1,802,629 $9,672 $30,295 $993,537 $3,897,944
48 010277600 Douglas Gardens Hospital $0 $0 $5,808 $3,588 -$494,825 -$485,429
49 010004800 Ed Fraser Memorial Hospital $22,074 $1,310,349 $0 $256,850 -$40,807 $1,548,466
50 010259800 Edward White Hospital $1,520,556 $531,296 $965,253 $400,462 $714,397 $4,131,965

Navigant Page 236 of 246
Row Nbr
Provider Medicaid
ID Provider Name
Hospital Cost
Fee-for-Service Inpatient
Fee-for-Service Outpatient
Managed Care Inpatient
Managed Care Outpatient
Uncompensated Care 1
Total Hospital Cost
51 011746300 Fawcett Memorial Hospital $3,670,107 $1,495,339 $887,946 $581,641 $3,388,307 $10,023,340
52 010120600 Fishermen's Hospital $343,333 $671,119 $12,706 $59,399 $1,625,959 $2,712,516
53 010171100 Flagler Hospital $9,426,306 $5,162,512 $1,760,037 $1,130,043 $13,054,080 $30,532,978
54 010129000 Florida Hospital $175,539,015 $45,696,873 $66,834 $33,027,979 $101,313,699 $355,644,401
55 010189300 Florida Hospital - Flagler $2,779,956 $2,897,427 $641,891 $789,190 $6,805,571 $13,914,036
56 010090100 Florida Hospital Heartland Med Cntr $7,483,663 $4,579,952 $1,168,542 $1,391,803 $6,919,877 $21,543,837
57 010109500 Florida Hospital Waterman $11,004,948 $5,034,292 $2,632,506 $2,904,773 $13,246,763 $34,823,283
58 010260100 Florida Hospital Wauchula $51,152 $2,341,890 $16,491 $294,309 $1,473,608 $4,177,449
59 005456800 Florida Hospital Wesley Chapel $2,581,178 $1,633,021 $779,821 $1,141,062 $2,405,114 $8,540,196
60 010149400 Florida Hospital Zephyrhills $5,918,804 $2,649,281 $2,414,878 $2,496,473 $7,279,361 $20,758,796
61 011132500 Ft. Walton Beach Medical Center $11,235,839 $6,085,368 $1,036,326 $682,921 $4,337,901 $23,378,355
62 010271700 Genesis Rehabilitation Hospital $2,324,101 $2,063,577 $207,638 $763,258 -$14,673 $5,343,901
63 010080300 George E. Weems Memorial Hosp $237,424 $633,283 $0 $25,770 -$412,243 $484,234
64 010144300 Glades General Hospital $7,776,757 $2,767,850 $1,677,299 $994,071 $5,806,696 $19,022,674
65 010152400 Good Samaritan Hospital $7,467,119 $3,905,601 $2,176,671 $2,878,006 -$703,727 $15,723,670
66 011761700 Gulf Coast Community Hospital $14,261,541 $6,141,388 $1,468,977 $1,568,696 $3,546,834 $26,987,436
67 012032400 H L Moffitt Cancer Center $15,773,312 $22,879,591 $22,207 $3,226,315 $15,947,928 $57,849,353
68 011975000 H.H. Raulerson $3,100,173 $3,049,960 $752,329 $921,072 $2,801,045 $10,624,579
69 010184200 Halifax Medical Center $34,440,176 $12,066,724 $9,487,031 $5,870,295 $35,388,346 $97,252,572
70 010135400 Health Central $9,558,132 $6,057,147 $7,172,458 $5,334,582 $17,838,465 $45,960,784
71 010270900 HealthSouth Rehab Hosp - Miami $581,594 $0 $187,816 $0 -$17,239 $752,171
72 012038300 HealthSouth Rehab Hosp Sarasota $120,319 $0 $53,757 $0 -$18,519 $155,557
73 010175300 HealthSouth Rehab Hosp-Largo $246,223 $0 $64,304 $0 -$25,428 $285,100
74 012042100 HealthSouth Rehab Hosp-Sea Pines $79,454 $770 $71,113 $0 -$9,151 $142,185
75 012027800 HealthSouth Rehab Hosp-Sunrise $9,074 $15,274 $133,822 $0 -$21,785 $136,385
76 012033200 HealthSouth Rehab Hosp-Tallahassee $85,999 $41,042 $173,721 $9,638 -$19,225 $291,174
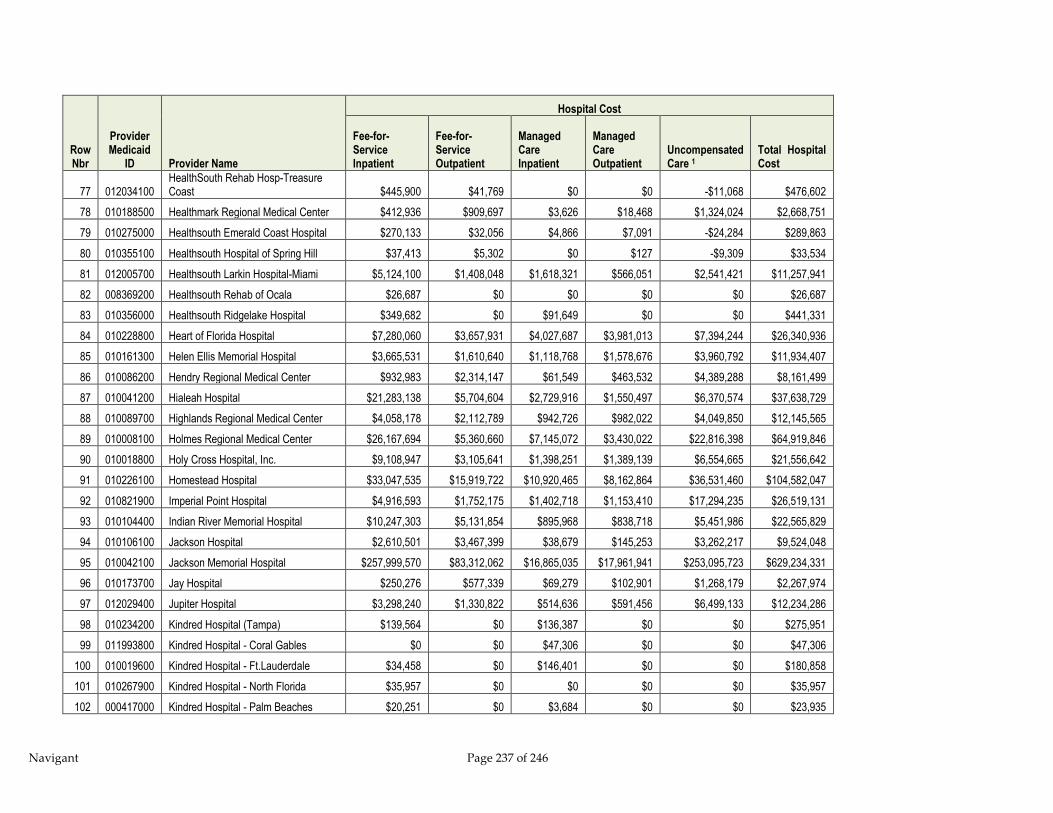
Navigant Page 237 of 246
Row Nbr
Provider Medicaid
ID Provider Name
Hospital Cost
Fee-for-Service Inpatient
Fee-for-Service Outpatient
Managed Care Inpatient
Managed Care Outpatient
Uncompensated Care 1
Total Hospital Cost
77 012034100 HealthSouth Rehab Hosp-Treasure Coast $445,900 $41,769 $0 $0 -$11,068 $476,602
78 010188500 Healthmark Regional Medical Center $412,936 $909,697 $3,626 $18,468 $1,324,024 $2,668,751
79 010275000 Healthsouth Emerald Coast Hospital $270,133 $32,056 $4,866 $7,091 -$24,284 $289,863
80 010355100 Healthsouth Hospital of Spring Hill $37,413 $5,302 $0 $127 -$9,309 $33,534
81 012005700 Healthsouth Larkin Hospital-Miami $5,124,100 $1,408,048 $1,618,321 $566,051 $2,541,421 $11,257,941
82 008369200 Healthsouth Rehab of Ocala $26,687 $0 $0 $0 $0 $26,687
83 010356000 Healthsouth Ridgelake Hospital $349,682 $0 $91,649 $0 $0 $441,331
84 010228800 Heart of Florida Hospital $7,280,060 $3,657,931 $4,027,687 $3,981,013 $7,394,244 $26,340,936
85 010161300 Helen Ellis Memorial Hospital $3,665,531 $1,610,640 $1,118,768 $1,578,676 $3,960,792 $11,934,407
86 010086200 Hendry Regional Medical Center $932,983 $2,314,147 $61,549 $463,532 $4,389,288 $8,161,499
87 010041200 Hialeah Hospital $21,283,138 $5,704,604 $2,729,916 $1,550,497 $6,370,574 $37,638,729
88 010089700 Highlands Regional Medical Center $4,058,178 $2,112,789 $942,726 $982,022 $4,049,850 $12,145,565
89 010008100 Holmes Regional Medical Center $26,167,694 $5,360,660 $7,145,072 $3,430,022 $22,816,398 $64,919,846
90 010018800 Holy Cross Hospital, Inc. $9,108,947 $3,105,641 $1,398,251 $1,389,139 $6,554,665 $21,556,642
91 010226100 Homestead Hospital $33,047,535 $15,919,722 $10,920,465 $8,162,864 $36,531,460 $104,582,047
92 010821900 Imperial Point Hospital $4,916,593 $1,752,175 $1,402,718 $1,153,410 $17,294,235 $26,519,131
93 010104400 Indian River Memorial Hospital $10,247,303 $5,131,854 $895,968 $838,718 $5,451,986 $22,565,829
94 010106100 Jackson Hospital $2,610,501 $3,467,399 $38,679 $145,253 $3,262,217 $9,524,048
95 010042100 Jackson Memorial Hospital $257,999,570 $83,312,062 $16,865,035 $17,961,941 $253,095,723 $629,234,331
96 010173700 Jay Hospital $250,276 $577,339 $69,279 $102,901 $1,268,179 $2,267,974
97 012029400 Jupiter Hospital $3,298,240 $1,330,822 $514,636 $591,456 $6,499,133 $12,234,286
98 010234200 Kindred Hospital (Tampa) $139,564 $0 $136,387 $0 $0 $275,951
99 011993800 Kindred Hospital - Coral Gables $0 $0 $47,306 $0 $0 $47,306
100 010019600 Kindred Hospital - Ft.Lauderdale $34,458 $0 $146,401 $0 $0 $180,858
101 010267900 Kindred Hospital - North Florida $35,957 $0 $0 $0 $0 $35,957
102 000417000 Kindred Hospital - Palm Beaches $20,251 $0 $3,684 $0 $0 $23,935
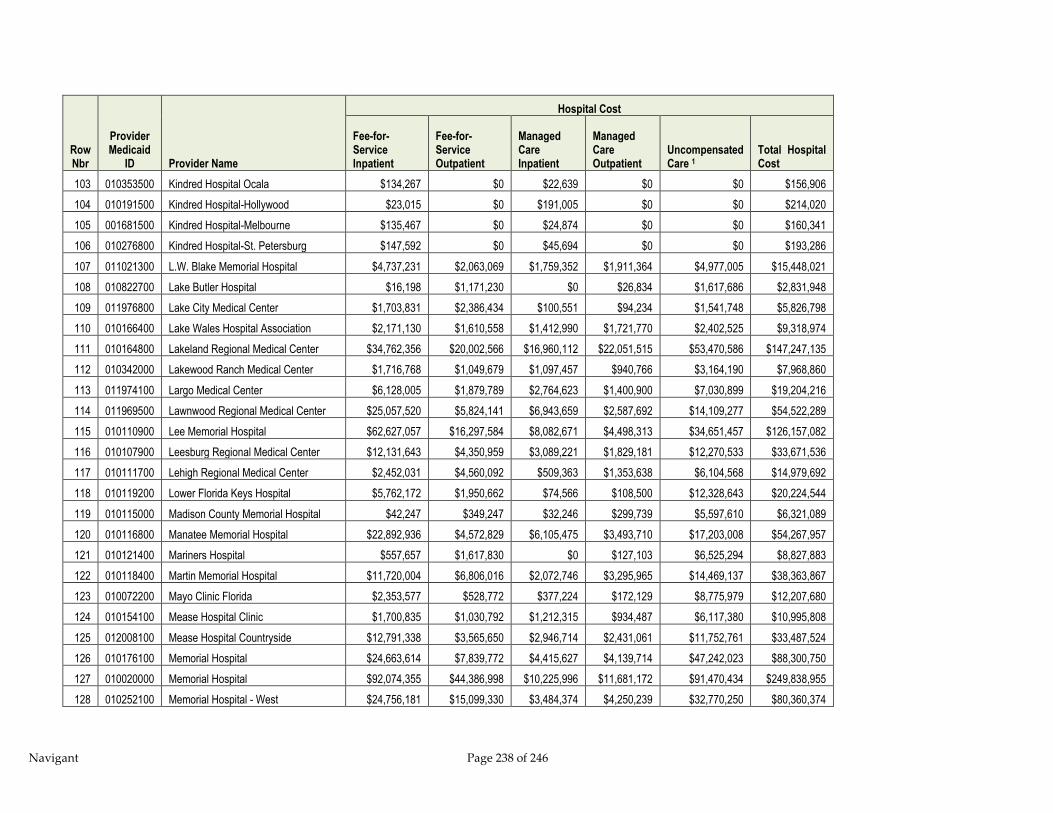
Navigant Page 238 of 246
Row Nbr
Provider Medicaid
ID Provider Name
Hospital Cost
Fee-for-Service Inpatient
Fee-for-Service Outpatient
Managed Care Inpatient
Managed Care Outpatient
Uncompensated Care 1
Total Hospital Cost
103 010353500 Kindred Hospital Ocala $134,267 $0 $22,639 $0 $0 $156,906
104 010191500 Kindred Hospital-Hollywood $23,015 $0 $191,005 $0 $0 $214,020
105 001681500 Kindred Hospital-Melbourne $135,467 $0 $24,874 $0 $0 $160,341
106 010276800 Kindred Hospital-St. Petersburg $147,592 $0 $45,694 $0 $0 $193,286
107 011021300 L.W. Blake Memorial Hospital $4,737,231 $2,063,069 $1,759,352 $1,911,364 $4,977,005 $15,448,021
108 010822700 Lake Butler Hospital $16,198 $1,171,230 $0 $26,834 $1,617,686 $2,831,948
109 011976800 Lake City Medical Center $1,703,831 $2,386,434 $100,551 $94,234 $1,541,748 $5,826,798
110 010166400 Lake Wales Hospital Association $2,171,130 $1,610,558 $1,412,990 $1,721,770 $2,402,525 $9,318,974
111 010164800 Lakeland Regional Medical Center $34,762,356 $20,002,566 $16,960,112 $22,051,515 $53,470,586 $147,247,135
112 010342000 Lakewood Ranch Medical Center $1,716,768 $1,049,679 $1,097,457 $940,766 $3,164,190 $7,968,860
113 011974100 Largo Medical Center $6,128,005 $1,879,789 $2,764,623 $1,400,900 $7,030,899 $19,204,216
114 011969500 Lawnwood Regional Medical Center $25,057,520 $5,824,141 $6,943,659 $2,587,692 $14,109,277 $54,522,289
115 010110900 Lee Memorial Hospital $62,627,057 $16,297,584 $8,082,671 $4,498,313 $34,651,457 $126,157,082
116 010107900 Leesburg Regional Medical Center $12,131,643 $4,350,959 $3,089,221 $1,829,181 $12,270,533 $33,671,536
117 010111700 Lehigh Regional Medical Center $2,452,031 $4,560,092 $509,363 $1,353,638 $6,104,568 $14,979,692
118 010119200 Lower Florida Keys Hospital $5,762,172 $1,950,662 $74,566 $108,500 $12,328,643 $20,224,544
119 010115000 Madison County Memorial Hospital $42,247 $349,247 $32,246 $299,739 $5,597,610 $6,321,089
120 010116800 Manatee Memorial Hospital $22,892,936 $4,572,829 $6,105,475 $3,493,710 $17,203,008 $54,267,957
121 010121400 Mariners Hospital $557,657 $1,617,830 $0 $127,103 $6,525,294 $8,827,883
122 010118400 Martin Memorial Hospital $11,720,004 $6,806,016 $2,072,746 $3,295,965 $14,469,137 $38,363,867
123 010072200 Mayo Clinic Florida $2,353,577 $528,772 $377,224 $172,129 $8,775,979 $12,207,680
124 010154100 Mease Hospital Clinic $1,700,835 $1,030,792 $1,212,315 $934,487 $6,117,380 $10,995,808
125 012008100 Mease Hospital Countryside $12,791,338 $3,565,650 $2,946,714 $2,431,061 $11,752,761 $33,487,524
126 010176100 Memorial Hospital $24,663,614 $7,839,772 $4,415,627 $4,139,714 $47,242,023 $88,300,750
127 010020000 Memorial Hospital $92,074,355 $44,386,998 $10,225,996 $11,681,172 $91,470,434 $249,838,955
128 010252100 Memorial Hospital - West $24,756,181 $15,099,330 $3,484,374 $4,250,239 $32,770,250 $80,360,374
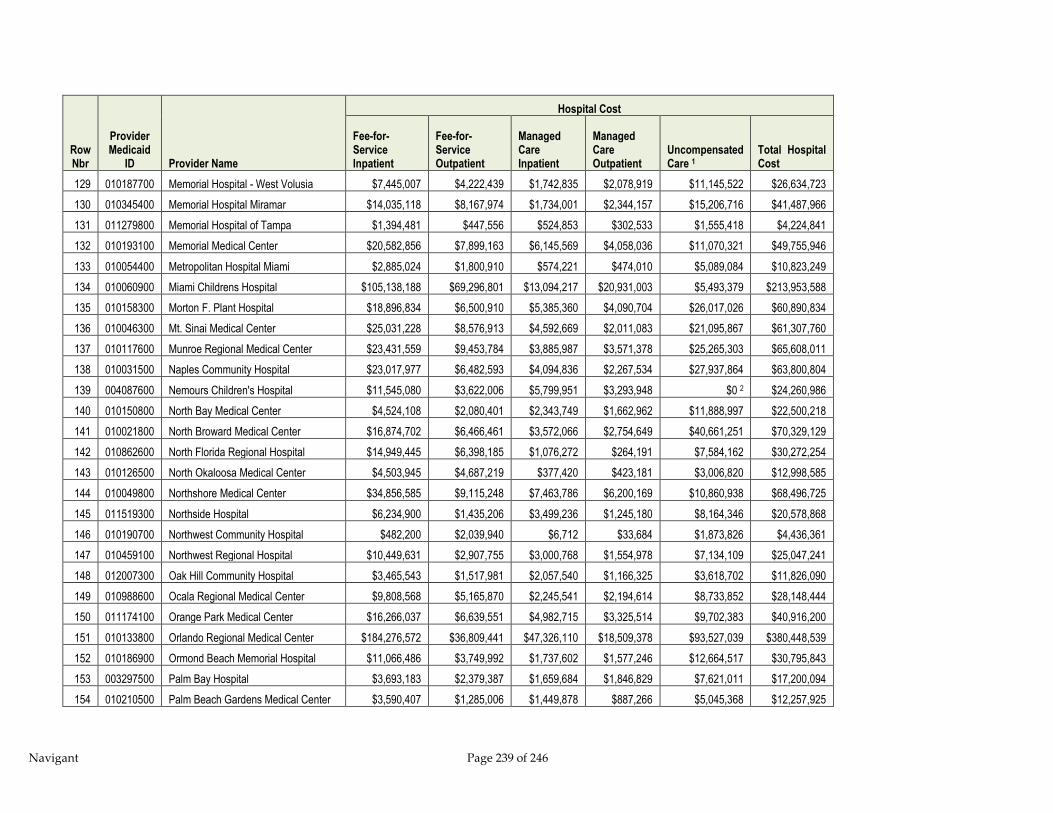
Navigant Page 239 of 246
Row Nbr
Provider Medicaid
ID Provider Name
Hospital Cost
Fee-for-Service Inpatient
Fee-for-Service Outpatient
Managed Care Inpatient
Managed Care Outpatient
Uncompensated Care 1
Total Hospital Cost
129 010187700 Memorial Hospital - West Volusia $7,445,007 $4,222,439 $1,742,835 $2,078,919 $11,145,522 $26,634,723
130 010345400 Memorial Hospital Miramar $14,035,118 $8,167,974 $1,734,001 $2,344,157 $15,206,716 $41,487,966
131 011279800 Memorial Hospital of Tampa $1,394,481 $447,556 $524,853 $302,533 $1,555,418 $4,224,841
132 010193100 Memorial Medical Center $20,582,856 $7,899,163 $6,145,569 $4,058,036 $11,070,321 $49,755,946
133 010054400 Metropolitan Hospital Miami $2,885,024 $1,800,910 $574,221 $474,010 $5,089,084 $10,823,249
134 010060900 Miami Childrens Hospital $105,138,188 $69,296,801 $13,094,217 $20,931,003 $5,493,379 $213,953,588
135 010158300 Morton F. Plant Hospital $18,896,834 $6,500,910 $5,385,360 $4,090,704 $26,017,026 $60,890,834
136 010046300 Mt. Sinai Medical Center $25,031,228 $8,576,913 $4,592,669 $2,011,083 $21,095,867 $61,307,760
137 010117600 Munroe Regional Medical Center $23,431,559 $9,453,784 $3,885,987 $3,571,378 $25,265,303 $65,608,011
138 010031500 Naples Community Hospital $23,017,977 $6,482,593 $4,094,836 $2,267,534 $27,937,864 $63,800,804
139 004087600 Nemours Children's Hospital $11,545,080 $3,622,006 $5,799,951 $3,293,948 $0 2 $24,260,986
140 010150800 North Bay Medical Center $4,524,108 $2,080,401 $2,343,749 $1,662,962 $11,888,997 $22,500,218
141 010021800 North Broward Medical Center $16,874,702 $6,466,461 $3,572,066 $2,754,649 $40,661,251 $70,329,129
142 010862600 North Florida Regional Hospital $14,949,445 $6,398,185 $1,076,272 $264,191 $7,584,162 $30,272,254
143 010126500 North Okaloosa Medical Center $4,503,945 $4,687,219 $377,420 $423,181 $3,006,820 $12,998,585
144 010049800 Northshore Medical Center $34,856,585 $9,115,248 $7,463,786 $6,200,169 $10,860,938 $68,496,725
145 011519300 Northside Hospital $6,234,900 $1,435,206 $3,499,236 $1,245,180 $8,164,346 $20,578,868
146 010190700 Northwest Community Hospital $482,200 $2,039,940 $6,712 $33,684 $1,873,826 $4,436,361
147 010459100 Northwest Regional Hospital $10,449,631 $2,907,755 $3,000,768 $1,554,978 $7,134,109 $25,047,241
148 012007300 Oak Hill Community Hospital $3,465,543 $1,517,981 $2,057,540 $1,166,325 $3,618,702 $11,826,090
149 010988600 Ocala Regional Medical Center $9,808,568 $5,165,870 $2,245,541 $2,194,614 $8,733,852 $28,148,444
150 011174100 Orange Park Medical Center $16,266,037 $6,639,551 $4,982,715 $3,325,514 $9,702,383 $40,916,200
151 010133800 Orlando Regional Medical Center $184,276,572 $36,809,441 $47,326,110 $18,509,378 $93,527,039 $380,448,539
152 010186900 Ormond Beach Memorial Hospital $11,066,486 $3,749,992 $1,737,602 $1,577,246 $12,664,517 $30,795,843
153 003297500 Palm Bay Hospital $3,693,183 $2,379,387 $1,659,684 $1,846,829 $7,621,011 $17,200,094
154 010210500 Palm Beach Gardens Medical Center $3,590,407 $1,285,006 $1,449,878 $887,266 $5,045,368 $12,257,925
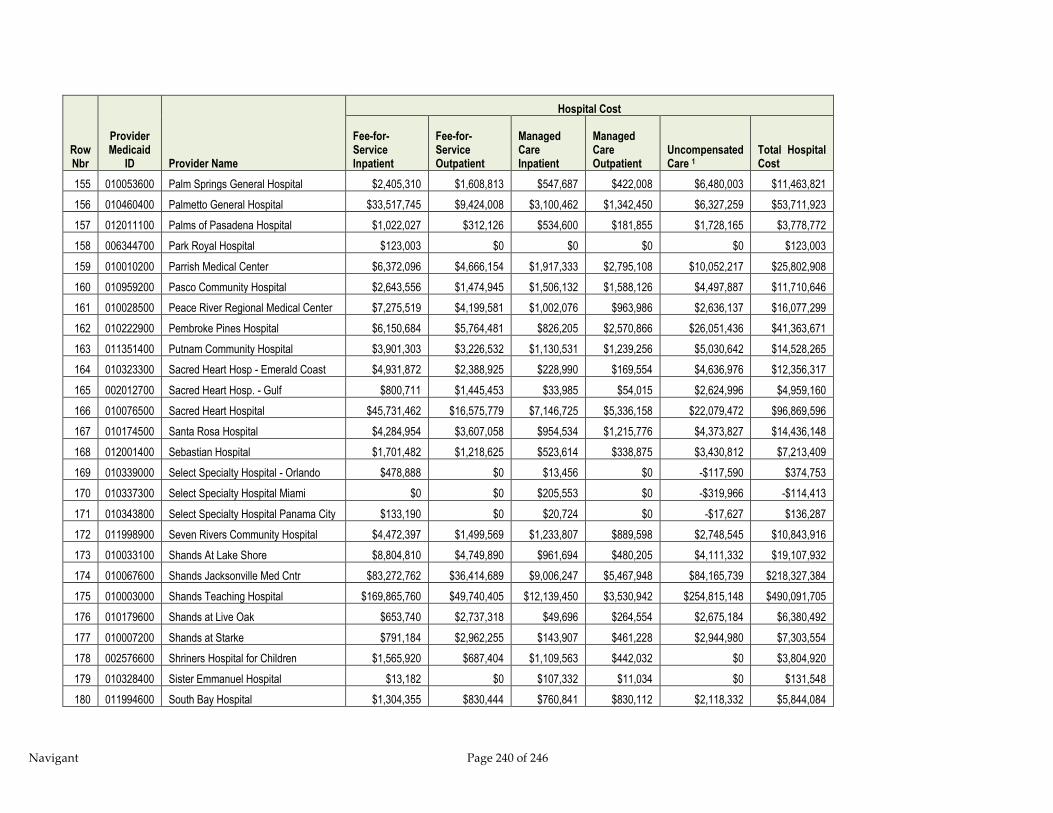
Navigant Page 240 of 246
Row Nbr
Provider Medicaid
ID Provider Name
Hospital Cost
Fee-for-Service Inpatient
Fee-for-Service Outpatient
Managed Care Inpatient
Managed Care Outpatient
Uncompensated Care 1
Total Hospital Cost
155 010053600 Palm Springs General Hospital $2,405,310 $1,608,813 $547,687 $422,008 $6,480,003 $11,463,821
156 010460400 Palmetto General Hospital $33,517,745 $9,424,008 $3,100,462 $1,342,450 $6,327,259 $53,711,923
157 012011100 Palms of Pasadena Hospital $1,022,027 $312,126 $534,600 $181,855 $1,728,165 $3,778,772
158 006344700 Park Royal Hospital $123,003 $0 $0 $0 $0 $123,003
159 010010200 Parrish Medical Center $6,372,096 $4,666,154 $1,917,333 $2,795,108 $10,052,217 $25,802,908
160 010959200 Pasco Community Hospital $2,643,556 $1,474,945 $1,506,132 $1,588,126 $4,497,887 $11,710,646
161 010028500 Peace River Regional Medical Center $7,275,519 $4,199,581 $1,002,076 $963,986 $2,636,137 $16,077,299
162 010222900 Pembroke Pines Hospital $6,150,684 $5,764,481 $826,205 $2,570,866 $26,051,436 $41,363,671
163 011351400 Putnam Community Hospital $3,901,303 $3,226,532 $1,130,531 $1,239,256 $5,030,642 $14,528,265
164 010323300 Sacred Heart Hosp - Emerald Coast $4,931,872 $2,388,925 $228,990 $169,554 $4,636,976 $12,356,317
165 002012700 Sacred Heart Hosp. - Gulf $800,711 $1,445,453 $33,985 $54,015 $2,624,996 $4,959,160
166 010076500 Sacred Heart Hospital $45,731,462 $16,575,779 $7,146,725 $5,336,158 $22,079,472 $96,869,596
167 010174500 Santa Rosa Hospital $4,284,954 $3,607,058 $954,534 $1,215,776 $4,373,827 $14,436,148
168 012001400 Sebastian Hospital $1,701,482 $1,218,625 $523,614 $338,875 $3,430,812 $7,213,409
169 010339000 Select Specialty Hospital - Orlando $478,888 $0 $13,456 $0 -$117,590 $374,753
170 010337300 Select Specialty Hospital Miami $0 $0 $205,553 $0 -$319,966 -$114,413
171 010343800 Select Specialty Hospital Panama City $133,190 $0 $20,724 $0 -$17,627 $136,287
172 011998900 Seven Rivers Community Hospital $4,472,397 $1,499,569 $1,233,807 $889,598 $2,748,545 $10,843,916
173 010033100 Shands At Lake Shore $8,804,810 $4,749,890 $961,694 $480,205 $4,111,332 $19,107,932
174 010067600 Shands Jacksonville Med Cntr $83,272,762 $36,414,689 $9,006,247 $5,467,948 $84,165,739 $218,327,384
175 010003000 Shands Teaching Hospital $169,865,760 $49,740,405 $12,139,450 $3,530,942 $254,815,148 $490,091,705
176 010179600 Shands at Live Oak $653,740 $2,737,318 $49,696 $264,554 $2,675,184 $6,380,492
177 010007200 Shands at Starke $791,184 $2,962,255 $143,907 $461,228 $2,944,980 $7,303,554
178 002576600 Shriners Hospital for Children $1,565,920 $687,404 $1,109,563 $442,032 $0 $3,804,920
179 010328400 Sister Emmanuel Hospital $13,182 $0 $107,332 $11,034 $0 $131,548
180 011994600 South Bay Hospital $1,304,355 $830,444 $760,841 $830,112 $2,118,332 $5,844,084

Navigant Page 241 of 246
Row Nbr
Provider Medicaid
ID Provider Name
Hospital Cost
Fee-for-Service Inpatient
Fee-for-Service Outpatient
Managed Care Inpatient
Managed Care Outpatient
Uncompensated Care 1
Total Hospital Cost
181 010098600 South Florida Baptist $5,290,790 $3,325,308 $2,600,511 $2,530,103 $8,826,784 $22,573,496
182 010108700 South Lake Memorial Hospital $6,665,998 $3,069,907 $3,138,702 $1,802,081 $5,501,175 $20,177,863
183 010058700 South Miami Hospital $45,978,196 $11,377,942 $3,723,152 $2,222,556 $28,588,320 $91,890,167
184 011134100 Southwest Florida Regional Medical $20,256,533 $3,981,179 $5,154,511 $1,812,937 $6,729,352 $37,934,512
185 010377200 Specialty Hospital - Gainesville $281,640 $0 $0 $0 $0 $281,640
186 010376400 Specialty Hospital - Palm Beach $250,229 $0 $102,809 $0 -$117,346 $235,692
187 010368300 Specialty Hospital - Pensacola $486,035 $0 $37,835 $0 -$46,762 $477,108
188 010374800 Specialty Hospital - Tallahassee $468,288 $0 $12,336 $0 -$38,841 $441,784
189 012022700 St Anthonys Hospital $12,273,594 $3,718,428 $4,814,100 $2,754,802 $16,267,973 $39,828,897
190 010346200 St. Cloud Regional Center $1,874,691 $1,932,089 $1,044,801 $1,570,665 $6,302,140 $12,724,385
191 010240700 St. John's Rehabilitation Hospital $1,050,859 $0 $443,818 $3,701 $0 $1,498,377
192 010097800 St. Joseph's Hospital $84,894,037 $22,940,420 $0 $16,636,576 $56,544,838 $181,015,871
193 010373000 St. Lukes- St. Vincent's Healthcare $9,531,278 $2,289,189 $1,913,073 $976,334 $9,101,127 $23,811,002
194 010148600 St. Mary's Hospital $55,666,110 $10,379,217 $8,272,658 $4,942,281 $15,252,835 $94,513,101
195 012010300 St. Petersburg General Hospital $7,777,771 $2,653,312 $3,339,620 $2,157,404 $4,397,700 $20,325,808
196 010073100 St. Vincent's Hospital $17,899,237 $6,572,992 $4,975,872 $2,552,373 $20,621,195 $52,621,669
197 012002200 St.Catherine's Rehab Hosp $2,498,549 $0 $1,109,894 $178 $0 $3,608,621
198 011997100 St.Lucie Medical Center $9,020,206 $2,940,032 $2,507,941 $1,324,158 $5,775,194 $21,567,532
199 010113300 Tallahassee Memorial Rgnl Med Cntr $32,315,345 $8,374,006 $8,780,254 $5,047,872 $51,046,490 $105,563,966
200 010099400 Tampa General Hospital $112,906,411 $24,267,051 $32,289,734 $13,822,901 $87,826,622 $271,112,719
201 010317900 The Villages Regional Hospital $2,525,200 $1,444,911 $639,547 $542,708 $5,614,068 $10,766,434
202 011984900 Town and Country Hospital $1,664,940 $998,063 $864,256 $737,789 $2,546,574 $6,811,622
203 010114100 Tri-County Hospital Williston $451,618 $451,049 $6,006 $33,229 $983,005 $1,924,907
204 000949600 UCHLTACH at Connerton $347,551 $0 $9,839 $45,850 -$93,326 $309,914
205 010094300 Univ Community Hosp Carrollwood $2,433,685 $2,981,596 $1,007,206 $2,580,339 $5,076,806 $14,079,632
206 010102800 Univ Community Hosp-Tampa $16,173,449 $5,073,860 $7,396,573 $5,953,035 $15,911,369 $50,508,287
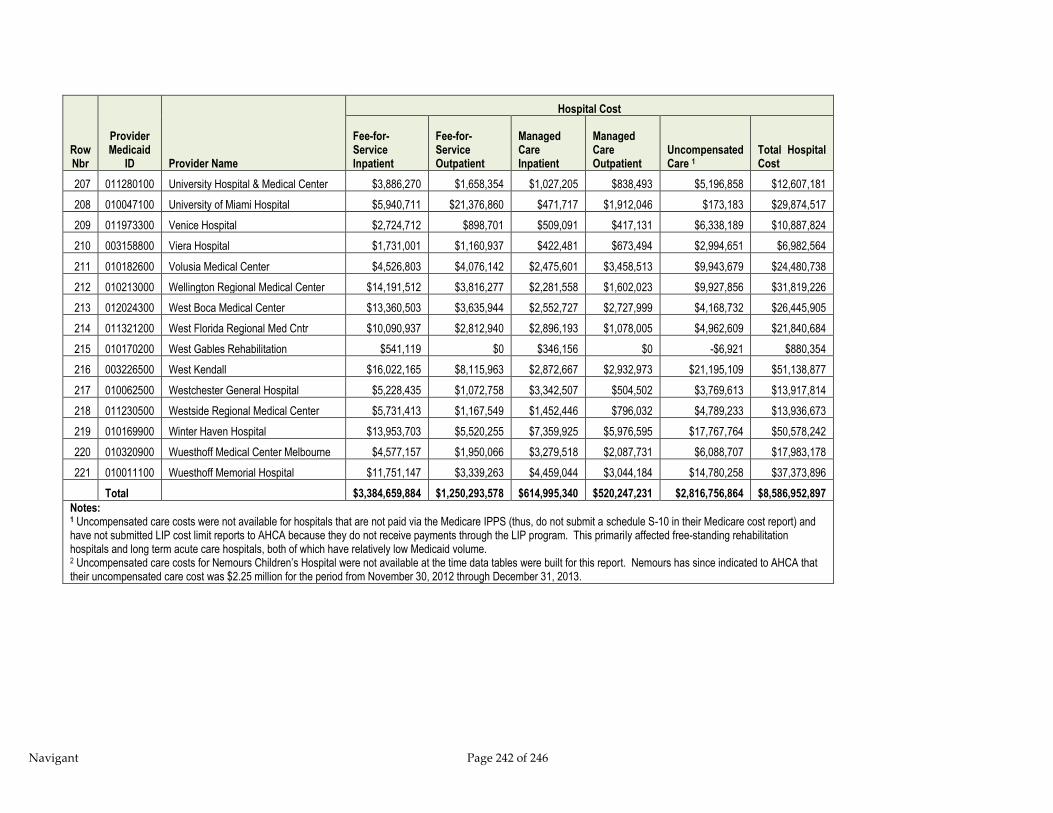
Navigant Page 242 of 246
Row Nbr
Provider Medicaid
ID Provider Name
Hospital Cost
Fee-for-Service Inpatient
Fee-for-Service Outpatient
Managed Care Inpatient
Managed Care Outpatient
Uncompensated Care 1
Total Hospital Cost
207 011280100 University Hospital & Medical Center $3,886,270 $1,658,354 $1,027,205 $838,493 $5,196,858 $12,607,181
208 010047100 University of Miami Hospital $5,940,711 $21,376,860 $471,717 $1,912,046 $173,183 $29,874,517
209 011973300 Venice Hospital $2,724,712 $898,701 $509,091 $417,131 $6,338,189 $10,887,824
210 003158800 Viera Hospital $1,731,001 $1,160,937 $422,481 $673,494 $2,994,651 $6,982,564
211 010182600 Volusia Medical Center $4,526,803 $4,076,142 $2,475,601 $3,458,513 $9,943,679 $24,480,738
212 010213000 Wellington Regional Medical Center $14,191,512 $3,816,277 $2,281,558 $1,602,023 $9,927,856 $31,819,226
213 012024300 West Boca Medical Center $13,360,503 $3,635,944 $2,552,727 $2,727,999 $4,168,732 $26,445,905
214 011321200 West Florida Regional Med Cntr $10,090,937 $2,812,940 $2,896,193 $1,078,005 $4,962,609 $21,840,684
215 010170200 West Gables Rehabilitation $541,119 $0 $346,156 $0 -$6,921 $880,354
216 003226500 West Kendall $16,022,165 $8,115,963 $2,872,667 $2,932,973 $21,195,109 $51,138,877
217 010062500 Westchester General Hospital $5,228,435 $1,072,758 $3,342,507 $504,502 $3,769,613 $13,917,814
218 011230500 Westside Regional Medical Center $5,731,413 $1,167,549 $1,452,446 $796,032 $4,789,233 $13,936,673
219 010169900 Winter Haven Hospital $13,953,703 $5,520,255 $7,359,925 $5,976,595 $17,767,764 $50,578,242
220 010320900 Wuesthoff Medical Center Melbourne $4,577,157 $1,950,066 $3,279,518 $2,087,731 $6,088,707 $17,983,178
221 010011100 Wuesthoff Memorial Hospital $11,751,147 $3,339,263 $4,459,044 $3,044,184 $14,780,258 $37,373,896
Total
$3,384,659,884 $1,250,293,578 $614,995,340 $520,247,231 $2,816,756,864 $8,586,952,897
Notes: 1 Uncompensated care costs were not available for hospitals that are not paid via the Medicare IPPS (thus, do not submit a schedule S-10 in their Medicare cost report) and have not submitted LIP cost limit reports to AHCA because they do not receive payments through the LIP program. This primarily affected free-standing rehabilitation hospitals and long term acute care hospitals, both of which have relatively low Medicaid volume. 2 Uncompensated care costs for Nemours Children’s Hospital were not available at the time data tables were built for this report. Nemours has since indicated to AHCA that their uncompensated care cost was $2.25 million for the period from November 30, 2012 through December 31, 2013.

Navigant Page 243 of 246
12.6 Appendix F – Waiver for Health Care-Related Taxes
12.6.1 Overview of Waivers
A state may request a waiver from CMS for the broad based and uniformity requirements for
health care-related taxes210. If a tax is imposed on more than one class of health care services, a
separate waiver must be obtained for each class subject to the tax. For CMS to approve a
waiver, the state must demonstrate that its tax program meets all of the following requirements:
The net impact of the tax and any payments made to the providers by the state under
the Medicaid program is generally redistributive211.
The amount of the tax is not directly correlated212 to Medicaid payments; and
The tax program does not fall within the hold harmless provisions
If the state desires a waiver of only the broad-based tax requirement, it must demonstrate
compliance with a redistributive test that measures, in aggregate, the proportion of the tax
burden to Medicaid providers. If the state desires a waiver of the uniform tax requirement,
whether or not the tax is broad-based, it must demonstrate compliance with a different
redistributive test that measures, for each provider, the relationship between the tax burden and
each provider’s “Medicaid Statistic”. The following sections describe in more detail the
calculations required in applying for waivers of the broad based and uniformity requirements.
If a state wishes to present an application to CMS for a waiver of the broad based and/or
uniform requirements, there is a formal submittal process. States generally submit a cover letter
that describes the tax, a copy of the legislation, and the results of the appropriate test(s) showing
that the tax is “generally redistributive”, as well as the data to support the calculations. CMS
will re-run the data to verify the results of the test.213
Assuming the waiver is approved by CMS, the waiver will be effective on the first day in the
quarter in which the waiver is received by CMS.
12.6.2 Waiver Of Broad-Based Requirement Only (“P” Values)
A state may request a waiver of the broad-based requirement if it can demonstrate that the tax
is generally redistributive. This test is applied on a per class basis to a tax that is imposed on all
210 Waivers will automatically be granted in cases of variations in licensing/certification fees if the fees are not more
than $1,000 annually per provider and if all the fees are used by the state to administer the licensing/cert. program. 211 Per the Interim Final Regulations 57 FR 5518, Nov. 24, 1992, redistributive is interpreted “…to mean the tendency
of a state’s tax and payment program to derive revenues from taxes imposed on non-Medicaid services…and to use
these revenues as the state’s share of Medicaid payments. To the extent that a tax is imposed more heavily on
providers with low Medicaid utilization than high Medicaid providers, the tax would be considered redistributive.” 212 Per the Final Rule 58 FR 43156, Aug. 13, 1993, “…states may not make… payments…that result in taxpayers
automatically being repaid dollar (or part of a dollar)-for-dollar for their tax costs. This is a direct correlation…” 213 The submittal process description is based on discussions with CMS.
Navigant Page 244 of 246
revenues but excludes certain providers. For example, a tax that is imposed on all revenues but
excludes teaching hospitals would have to meet this test.
A state must demonstrate that a non-broad-based provider tax is generally redistributive by
completing the following calculations:
1. Calculate the P1 value: The P1 value is the proportion of the tax revenue applicable to
Medicaid214 if the tax were broad based and applied to all providers within the class215
2. Calculate the P2 value: The P2 value is the proportion of the tax revenue applicable to
Medicaid under the state’s proposed tax program.
3. Calculate the P1/P2 value: Divide the P1 value by the P2 value.
If the P1/P2 value is one or greater (in other words, the P1 value is larger than the P2 value), CMS
will automatically approve the waiver request. This would occur when the proportion of the
tax revenue applicable to Medicaid under the state’s proposed tax (that tax that would exclude
certain providers) is less than the proportion of the tax revenue applicable to Medicaid if the tax
were broad-based.
If the P1/P2 value is at least 0.95, CMS will review and approve the request if the tax excludes or
provides credits or deductions only to one or more of the following providers within the class216:
Providers that furnish no services within the class in the state
Providers that do not charge for services within the class
Rural hospitals
Sole community hospitals
Physicians practicing primarily in a medically underserved area
Financially distressed hospitals (defined by state law). No more than ten percent of
nonpublic hospitals are exempt from the tax.
Psychiatric hospitals
Hospitals owned and operated by HMOs
This test cannot be used when a state excludes any or all Medicaid revenue from its tax in
addition to the exclusion of providers, since the test compares the proportion of Medicaid
revenue being taxed under the proposed tax with the proportion of Medicaid revenue being
taxed under a broad-based tax.
214 Per the Final Rule 58 FR 43156, Aug. 13, 1993, “The proportion of the tax revenue applicable to Medicaid means
how much of the tax burden shifts to Medicaid.” 215 Based on discussions with CMS, all facilities that provide the service being assessed, including government
facilities, should be included in the P1 portion of the test. 216 For taxes enacted and in effect prior to August 13, 1993, waivers with a P1/P2 value of at least 0.90 would be
reviewed by CMS.

Navigant Page 245 of 246
12.6.3 Waiver Of Uniform Tax Requirement (“B” Values)
A state may request a waiver of the uniform application requirement if it can demonstrate that
the tax is generally redistributive. This test is applied on a per class basis to all taxes that are
not uniform - including taxes that are neither broad based nor uniform. For example, a tax for
inpatient hospital services that has a different tax rate for teaching hospitals in the same class
would have to meet this test.
A state must demonstrate that a non-uniform provider tax is generally redistributive by
completing the following calculations:
1. Calculate the slope of two linear regressions: Determine the B value by using ordinary
least squares to calculate the slope of two linear regressions using the following
dependent and independent variables:
a. Dependent Variable – Each provider’s percentage share of the total tax paid by all
taxpayers during a 12-month period
b. Independent Variable – Each provider’s “Medicaid Statistic”. The Medicaid Statistic is
defined as the number of the provider’s taxable units applicable to the Medicaid
program during a 12-month period. For example, if the provider pays a tax based on
inpatient days, the provider’s Medicaid Statistic would be the number of Medicaid
days during a 12-month period.
2. Calculate the B1 value: The B1 value is the slope of the linear regression for the state’s
tax program, were it broad-based and uniform217.
3. Calculate the B2 value: The B2 value is the slope of the linear regression for the state’s
tax program as proposed218.
4. Calculate the B1/B2 value: Divide the B1 value by the B2 value
If the B1/B2 value is one or greater (in other words, the B1 value is larger than the B2 value), CMS
will automatically approve the state’s waiver request. This would occur when the increase in
each provider’s portion of the tax increases more slowly with an increase in the Medicaid
Statistic under the proposed tax system (non-uniform/broad-based) than under the
uniform/broad-based system.
If the B1/B2 value is at least 0.95, CMS will review and approve the request if the tax excludes or
provides credits or deductions only to one or more of the following providers within the class:
Providers that furnish no services within the class in the state
Providers that do not charge for services within the class
Rural hospitals
217 Based on discussions with CMS, all facilities that provide the service being assessed, including government
facilities, should be included in the B1 portion of the test. 218 Based on discussions with CMS, all facilities that provide the service being assessed, including government
facilities, should be included in the B2 portion of the test. For non-taxed facilities under the proposed system, the B2
Tax Percentage would be 0% and the B2 Medicaid Statistic would be equal to the B1 Medicaid Statistic.
Navigant Page 246 of 246
Sole community hospitals
Physicians practicing primarily in a medically underserved area
Financially distressed hospitals (defined by state law). No more than ten percent of
nonpublic hospitals are exempt from the tax.
Psychiatric hospitals
Providers/payors with tax rates that vary based exclusively on regions219, but only if
the regional variations are coterminous with preexisting political (and not special
purpose) boundaries. Taxes within each regional boundary must meet the broad-
based and uniformity requirements.
For purposes of this redistributive test, it is not relevant that a tax program exempts Medicaid
from the tax.
219 A B1/B2 value of 0.70 will be applied to taxes enacted and in effect prior to November 24, 1992.