STUDY OF DIRECTIONALLY SOLIDIFIED Fe – 4,25 %C EUTECTIC ...
4
347 METALURGIJA 59 (2020) 3, 347-350 M. TREPCZYŃSKA-ŁENT, J. PIĄTKOWSKI STUDY OF DIRECTIONALLY SOLIDIFIED Fe – 4,25 %C EUTECTIC ALLOY USING ELECTRON BACKSCATTER DIFFRACTION (EBSD) TECHNIQUE Received – Primljeno: 2019-11-19 Accepted – Prihvaćeno: 2020-03-10 Preliminary Note – Prethodno priopćenje M. Trepczyńska-Łent, University of Science and Technology Bydgo- szcz, Faculty of Mechanical Engineering, Poland, e-mail: malgorzata. [email protected] J. Piątkowski, Silesian University, Faculty of Materials Engineering and Metallurgy, Katowice, Poland Electron back-scattered diffraction was used to determine the microstructure of a eutectic. Fe – 4,25 % C alloy was directionally solidified with the growth rate of 300 mm/h (83,3 μm/s) in a vacuum Bridgman-type furnace with liquid metal cooling. Eutectic phases have been observed using optical microscopy and scanning electron microscopy. The morphology of the eutectic phases was described. EBSD analysis reveals pronounced direction <100> of ce- mentite in the microstructure produced by directional solidification. Key words: Fe – eutectic, directional solidification; phase; EBSD; microstructure INTRODUCTION The conditions of solidification affect the properties of eutectics. Eutectics have a fine microstructure and are composite materials. The purpose of the eutectic studies is to determine their mechanical properties re- sulting from the reduction of interphase spacing, ho- mogenization of the structure and the increase of inter- faces surface. The Bridgman method allowed better understanding of the physical mechanisms controlling the microstructural development during directional so- lidification. The use of better techniques allows to un- derstand the relationship between the properties and the microstructure of eutectics. This applies particularly to transmission electron microscopy, scanning electron microscopy, X–ray diffraction and electron back scatter diffraction techniques. The directional solidification conditions with a temperature gradient along with heat conduction direction also influence the growth of eutec- tic cementite. Regarding eutectic growth, the structures are con- trolled by the ratio of the temperature gradient G to the growth rate v. A relatively high G/v value gives a quasi- regular lamellar structure with edgewise growth and a smaller G/v value results in a ledeburite structure with cooperation growth of austenite and Fe 3 C. As there is no certainty how the growth texture of eutectic cementite is related to its growth morphology, this current study is aimed at investigating this relationship [1]. The studies of eutectic Fe - C alloys [2÷11] are well known. The subject of the increase in the ledeburitic eutectic was also dis- cussed, defining the growth directions for cementite. ISSN 0543-5846 METABK 59(3) 347-350 (2020) UDC – UDK 669.1:66.065:536.425:620.18:539.26=111 Figure 1 shows a 3-D model of Fe(γ) – Fe 3 C eutectic with directions: <010>, <001>, <100>. Electron back scatter diffraction was used in the studies of directional solidification of Fe – C eutectic alloy. EBSD has a re- markable impact on the characterization of materials, including eutectics [8, 12÷14], through directly linking microstructure and crystallographic texture to provide quantitative data. METHODOLOGY Fe – 4,25% C eutectic alloy was prepared for this study in corundum crucible under the protection of ar- gon gas in Balzers-type heater. Table 1 presents the chemical composition of this alloy. The directional solidification was performed by the Bridgman method at the Faculty of Foundry Engineer- Figure 1 Three-dimensional model of Fe(γ) – Fe 3 C eutectic [2, 3, 5]
Transcript of STUDY OF DIRECTIONALLY SOLIDIFIED Fe – 4,25 %C EUTECTIC ...

347METALURGIJA 59 (2020) 3, 347-350
M. TREPCZYŃSKA-ŁENT, J. PIĄTKOWSKI
STUDY OF DIRECTIONALLY SOLIDIFIED Fe – 4,25 %C EUTECTIC ALLOY USING ELECTRON BACKSCATTER DIFFRACTION (EBSD) TECHNIQUE
Received – Primljeno: 2019-11-19Accepted – Prihvaćeno: 2020-03-10
Preliminary Note – Prethodno priopćenje
M. Trepczyńska-Łent, University of Science and Technology Bydgo-szcz, Faculty of Mechanical Engineering, Poland, e-mail: [email protected]. Piątkowski, Silesian University, Faculty of Materials Engineering and Metallurgy, Katowice, Poland
Electron back-scattered diffraction was used to determine the microstructure of a eutectic. Fe – 4,25 % C alloy was directionally solidified with the growth rate of 300 mm/h (83,3 μm/s) in a vacuum Bridgman-type furnace with liquid metal cooling. Eutectic phases have been observed using optical microscopy and scanning electron microscopy. The morphology of the eutectic phases was described. EBSD analysis reveals pronounced direction <100> of ce-mentite in the microstructure produced by directional solidification.
Key words: Fe – eutec tic, directional solidification; phase; EBSD; microstructure
INTRODUCTION
The conditions of solidification affect the properties of eutectics. Eutectics have a fine microstructure and are composite materials. The purpose of the eutectic studies is to determine their mechanical properties re-sulting from the reduction of interphase spacing, ho-mogenization of the structure and the increase of inter-faces surface. The Bridgman method allowed better understanding of the physical mechanisms controlling the microstructural development during directional so-lidification. The use of better techniques allows to un-derstand the relationship between the properties and the microstructure of eutectics. This applies particularly to transmission electron microscopy, scanning electron microscopy, X–ray diffraction and electron back scatter diffraction techniques. The directional solidification conditions with a temperature gradient along with heat conduction direction also influence the growth of eutec-tic cementite.
Regarding eutectic growth, the structures are con-trolled by the ratio of the temperature gradient G to the growth rate v. A relatively high G/v value gives a quasi-regular lamellar structure with edgewise growth and a smaller G/v value results in a ledeburite structure with cooperation growth of austenite and Fe3C. As there is no certainty how the growth texture of eutectic cementite is related to its growth morphology, this current study is aimed at investigating this relationship [1]. The studies of eutectic Fe - C alloys [2÷11] are well known. The subject of the increase in the ledeburitic eutectic was also dis-cussed, defining the growth directions for cementite.
ISSN 0543-5846METABK 59(3) 347-350 (2020)
UDC – UDK 669.1:66.065:536.425:620.18:539.26=111
Figure 1 shows a 3-D model of Fe(γ) – Fe3C eutectic with directions: <010>, <001>, <100>. Electron back scatter diffraction was used in the studies of directional solidification of Fe – C eutectic alloy. EBSD has a re-markable impact on the characterization of materials, including eutectics [8, 12÷14], through directly linking microstructure and crystallographic texture to provide quantitative data.
METHODOLOGY
Fe – 4,25% C eutectic alloy was prepared for this study in corundum crucible under the protection of ar-gon gas in Balzers-type heater. Table 1 presents the chemical composition of this alloy.
The directional solidification was performed by the Bridgman method at the Faculty of Foundry Engineer-
Figure 1 Three-dimensional model of Fe(γ) – Fe3C eutectic [2, 3, 5]
348
M. TREPCZYŃSKA-ŁENT et al.: STUDY OF DIRECTIONALLY SOLIDIFIED Fe – 4,25 %C EUTECTIC ALLOY USING...
METALURGIJA 59 (2020) 3, 347-350
ing, Department of Engineering of Cast Alloys and Composites at AGH in Krakow. The pulling process was performed at a growth rate of 300 mm/h (83,3 μm/s). The temperature gradient G = 33,5 K/mm was constant. Detailed information on the process is pre-sented elsewhere [15, 16]. The sample of φ 5 x 100 mm was cut, ground and polished. The metallographic cross-sections were etched with 3 % Nital solution for light-optical microscopy Nikkon MA100 equipped with Zeiss Erc5s digital camera and polished with Al2O3 suspension with a grain size of 0,05 μm for EBSD investigation, respectively. EBSD measure-ments aimed at and polished with Al2O3 suspension with a grain size of 0,05 μm for EBSD investigation, respectively. EBSD measurements aimed at determin-ing the presence of microstructure by measuring the directional topography, the pole figures, the inverse pole figures and phase composition maps for the sam-ple of the metastable eutectic alloy after directional solidification, with the pulling rate being 300 mm/h. Electron back-scattered diffraction, which can moni-tor concurrent particles individually and correlate the results to the microstructure, was adopted in this study. The microstructure of the eutectic was examined using an EBSD system interfaced to a Hitachi S–3400N. The measurements were performed at Institute of Materi-als Science, Faculty of Materials Engineering and Metallurgy at Silesian University of Technology. EBSD measurements were conducted using a Carl Zeiss LEO 1530 field emission scanning electron mi-croscope (SEM) equipped with the detector INCA HKL Nordlys II Channel 5 system. Acceleration volt-age was set to 20 kV using a magnification of 1 000 x and a step of electron beam travel equal to 0,5 μm. The study was performed in three different areas on the transverse section of the sample (hereinafter referred to as: area 1, area 2, area 3).
RESULTS AND DISCUSSION
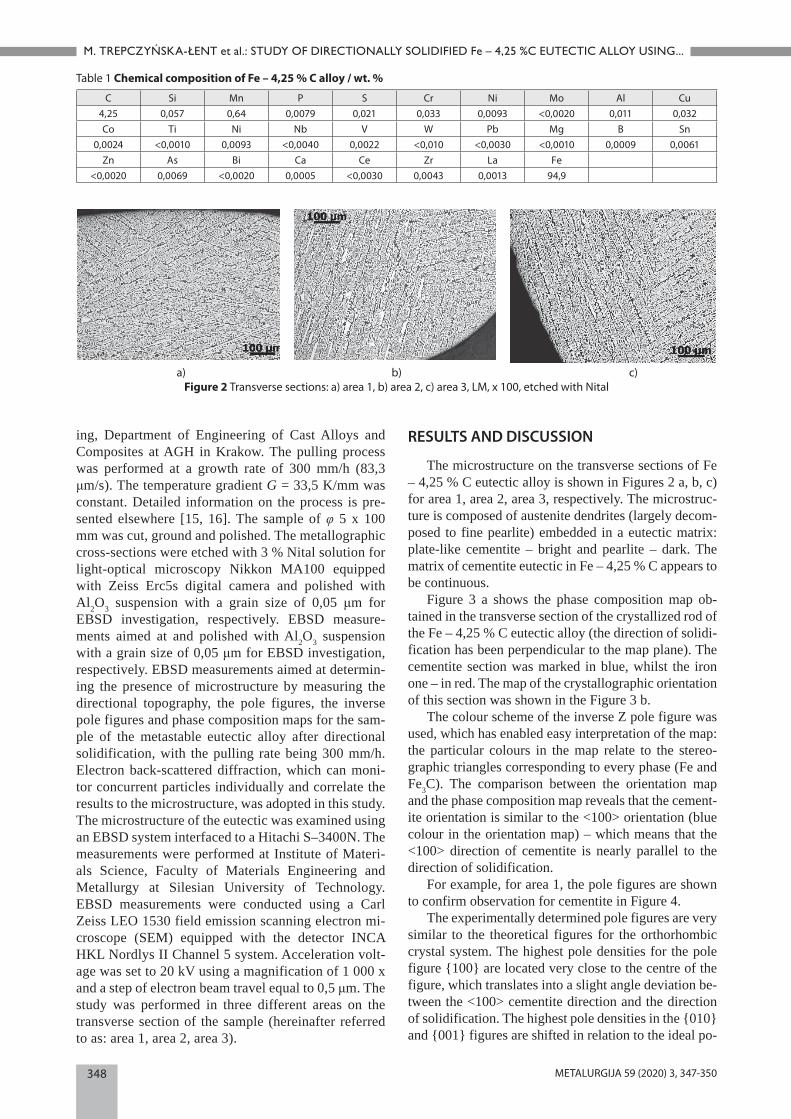
The microstructure on the transverse sections of Fe – 4,25 % C eutectic alloy is shown in Figures 2 a, b, c) for area 1, area 2, area 3, respectively. The microstruc-ture is composed of austenite dendrites (largely decom-posed to fine pearlite) embedded in a eutectic matrix: plate-like cementite – bright and pearlite – dark. The matrix of cementite eutectic in Fe – 4,25 % C appears to be continuous.
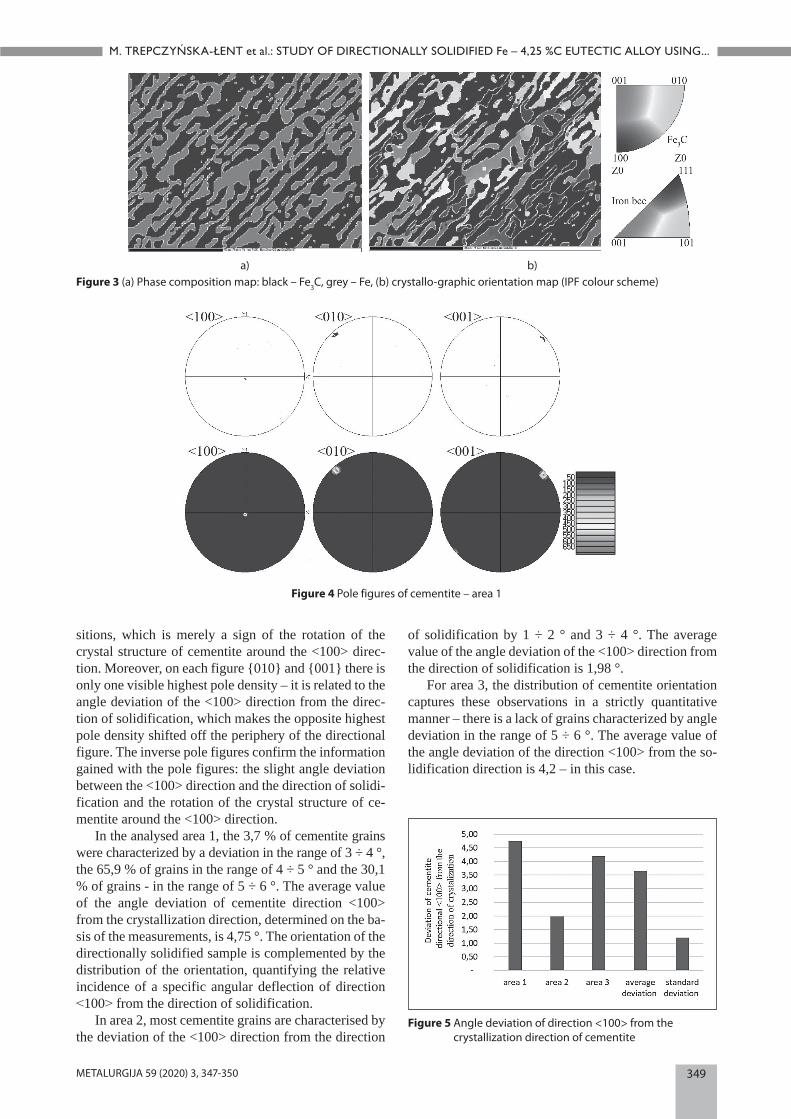
Figure 3 a shows the phase composition map ob-tained in the transverse section of the crystallized rod of the Fe – 4,25 % C eutectic alloy (the direction of solidi-fication has been perpendicular to the map plane). The cementite section was marked in blue, whilst the iron one – in red. The map of the crystallographic orientation of this section was shown in the Figure 3 b.
The colour scheme of the inverse Z pole figure was used, which has enabled easy interpretation of the map: the particular colours in the map relate to the stereo-graphic triangles corresponding to every phase (Fe and Fe3C). The comparison between the orientation map and the phase composition map reveals that the cement-ite orientation is similar to the <100> orientation (blue colour in the orientation map) – which means that the <100> direction of cementite is nearly parallel to the direction of solidification.
For example, for area 1, the pole figures are shown to confirm observation for cementite in Figure 4.
The experimentally determined pole figures are very similar to the theoretical figures for the orthorhombic crystal system. The highest pole densities for the pole figure {100} are located very close to the centre of the figure, which translates into a slight angle deviation be-tween the <100> cementite direction and the direction of solidification. The highest pole densities in the {010} and {001} figures are shifted in relation to the ideal po-
Table 1 Chemical composition of Fe – 4,25 % C alloy / wt. %
C Si Mn P S Cr Ni Mo Al Cu4,25 0,057 0,64 0,0079 0,021 0,033 0,0093 <0,0020 0,011 0,032Co Ti Ni Nb V W Pb Mg B Sn
0,0024 <0,0010 0,0093 <0,0040 0,0022 <0,010 <0,0030 <0,0010 0,0009 0,0061Zn As Bi Ca Ce Zr La Fe
<0,0020 0,0069 <0,0020 0,0005 <0,0030 0,0043 0,0013 94,9
a) b) c)Figure 2 Transverse sections: a) area 1, b) area 2, c) area 3, LM, x 100, etched with Nital
349
M. TREPCZYŃSKA-ŁENT et al.: STUDY OF DIRECTIONALLY SOLIDIFIED Fe – 4,25 %C EUTECTIC ALLOY USING...
METALURGIJA 59 (2020) 3, 347-350
sitions, which is merely a sign of the rotation of the crystal structure of cementite around the <100> direc-tion. Moreover, on each figure {010} and {001} there is only one visible highest pole density – it is related to the angle deviation of the <100> direction from the direc-tion of solidification, which makes the opposite highest pole density shifted off the periphery of the directional figure. The inverse pole figures confirm the information gained with the pole figures: the slight angle deviation between the <100> direction and the direction of solidi-fication and the rotation of the crystal structure of ce-mentite around the <100> direction.
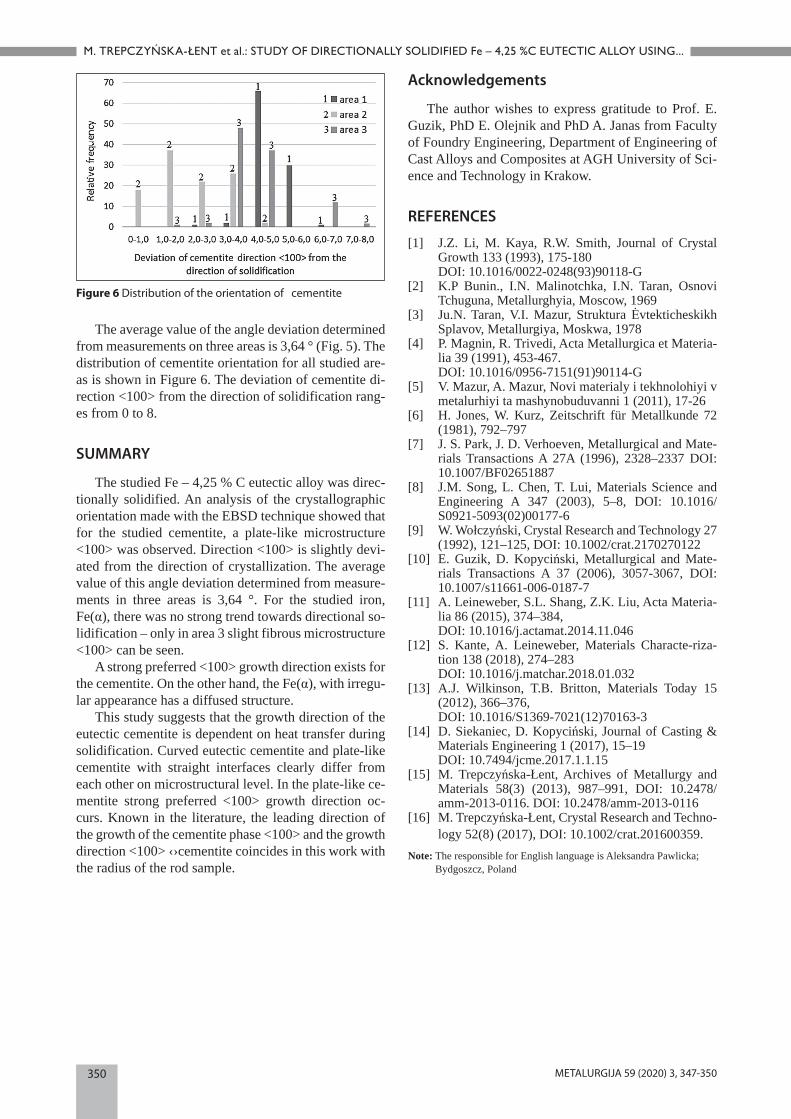
In the analysed area 1, the 3,7 % of cementite grains were characterized by a deviation in the range of 3 ÷ 4 °, the 65,9 % of grains in the range of 4 ÷ 5 ° and the 30,1 % of grains - in the range of 5 ÷ 6 °. The average value of the angle deviation of cementite direction <100> from the crystallization direction, determined on the ba-sis of the measurements, is 4,75 °. The orientation of the directionally solidified sample is complemented by the distribution of the orientation, quantifying the relative incidence of a specific angular deflection of direction ˂100˃ from the direction of solidification.
In area 2, most cementite grains are characterised by the deviation of the <100> direction from the direction
of solidification by 1 ÷ 2 ° and 3 ÷ 4 °. The average value of the angle deviation of the <100> direction from the direction of solidification is 1,98 °.
For area 3, the distribution of cementite orientation captures these observations in a strictly quantitative manner – there is a lack of grains characterized by angle deviation in the range of 5 ÷ 6 °. The average value of the angle deviation of the direction <100> from the so-lidification direction is 4,2 – in this case.
a) b)Figure 3 (a) Phase composition map: black – Fe3C, grey – Fe, (b) crystallo-graphic orientation map (IPF colour scheme)
Figure 5 Angle deviation of direction <100> from the crystallization direction of cementite
Figure 4 Pole figures of cementite – area 1
350
M. TREPCZYŃSKA-ŁENT et al.: STUDY OF DIRECTIONALLY SOLIDIFIED Fe – 4,25 %C EUTECTIC ALLOY USING...
METALURGIJA 59 (2020) 3, 347-350
The average value of the angle deviation determined from measurements on three areas is 3,64 ° (Fig. 5). The distribution of cementite orientation for all studied are-as is shown in Figure 6. The deviation of cementite di-rection <100> from the direction of solidification rang-es from 0 to 8.
SUMMARY
The studied Fe – 4,25 % C eutectic alloy wa s direc-t ionally solidified. An analysis of the crystallographic orientation made with the EBSD technique showed that for the studied cementite, a plate-like microstructure <100> was observed. Direction <100> is slightly devi-ated from the direction of crystallization. The average value of this angle deviation determined from measure-ments in three areas is 3,64 °. For the studied iron, Fe(α), there was no strong trend towards directional so-lidification – only in area 3 slight fibrous microstructure <100> can be seen.
A strong preferred <100> growth direction exists for the cementite. On the other hand, the Fe(α), with irregu-lar appearance has a diffused structure.
This study suggests that the growth direction of the eut ectic cementite is dependent on heat transfer during solidification. Curved eutectic cementite and plate-like cementite with straight interfaces clearly differ from each other on microstructural level. In the plate-like ce-mentite strong preferred <100> growth direction oc-curs. Known in the literature, the leading direction of the growth of the cementite phase <100> and the growth direction <100> ‹›cementite coincides in this work with the radius of the rod sample.
Acknowledgements
The author wishes to express gratitude to Prof. E. Guzik, PhD E. Olejnik and PhD A. Janas from Faculty of Foundry Engineering, Department of Engineering of Cast Alloys and Composites at AGH University of Sci-ence and Technology in Krakow.
REFERENCES
[1] J.Z. Li, M. Kaya, R.W. Smith, Journal of Crystal Growth 133 (1993), 175-180
DOI: 10.1016/0022-0248(93)90118-G [2] K.P Bunin., I.N. Malinotchka, I.N. Taran, Osnovi
Tchuguna, Metallurghyia, Moscow, 1969[3] Ju.N. Taran, V.I. Mazur, Struktura Ėvtekticheskikh
Splavov, Metallurgiya, Moskwa, 1978[4] P. Magnin, R. Trivedi, Acta Metallurgica et Materia-
lia 39 (1991), 453-467. DOI: 10.1016/0956-7151(91)90114-G [5] V. Mazur, A. Mazur, Novi materialy i tekhnolohiyi v
metalurhiyi ta mashynobuduvanni 1 (2011), 17-26 [6] H. Jones, W. Kurz, Zeitschrift für Metallkunde 72
(1981), 792–797 [7] J. S. Park, J. D. Verhoeven, Metallurgical and Mate-
rials Transactions A 27A (1996), 2328–2337 DOI: 10.1007/BF02651887
[8] J.M. Song, L. Chen, T. Lui, Materials Science and Engineering A 347 (2003), 5–8, DOI: 10.1016/S0921-5093(02)00177-6
[9] W. Wołczyński, Crystal Research and Technology 27 (1992), 121–125, DOI: 10.1002/crat.2170270122
[10] E. Guzik, D. Kopyciński, Metallurgical and Mate-rials Transactions A 37 (2006), 3057-3067, DOI: 10.1007/s11661-006-0187-7
[11] A. Leineweber, S.L. Shang, Z.K. Liu, Acta Materia-lia 86 (2015), 374–384,
DOI: 10.1016/j.actamat.2014.11.046[12] S. Kante, A. Leineweber, Materials Characte-riza-
tion 138 (2018), 274–283 DOI: 10.1016/j.matchar.2018.01.032[13] A.J. Wilkinson, T.B. Britton, Materials Today 15
(2012), 366–376, DOI: 10.1016/S1369-7021(12)70163-3[14] D. Siekaniec, D. Kopyciński, Journal of Casting &
Materials Engineering 1 (2017), 15–19 DOI: 10.7494/jcme.2017.1.1.15[15] M. Trepczyńska-Łent, Archives of Metallurgy and
Materials 58(3) (2013), 987–991, DOI: 10.2478/amm-2013-0116. DOI: 10.2478/amm-2013-0116
[16] M. Trepczyńska-Łent, Crystal Research and Techno-logy 52(8) (2017), DOI: 10.1002/crat.201600359.
Note: The responsible for English language is Aleksandra Pawlicka; Bydgoszcz, Poland
Figure 6 Distribution of the orientation of cementite