Study of Competition in the Railroad Industry and Analysis ...
27
Study of Competition in the Railroad Industry and Analysis of Proposals that Might Enhance Competition Final Report November 2008
Transcript of Study of Competition in the Railroad Industry and Analysis ...

Study of Competition in the Railroad Industry
and Analysis of Proposals that Might Enhance Competition
Final Report
November 2008

November 2008 2 CHRISTENSEN ASSOCIATES
Outline
Project backgroundRailroad economicsTrends in rates and market powerRailroad productivity and costsRailroad revenue sufficiencyShipper captivityCapacity and service qualityEconomic analysis of policy proposalsFuture directions

November 2008 3 CHRISTENSEN ASSOCIATES
Project Background
The Christensen Associates team was selected by the STB to perform an independent study of competitive issues in the U.S. freight railroad industry, including—Competition and captivity—Capacity and service quality issues—Economic analysis of policy proposals
Two research phases—Gather stakeholder input to assist in
formulating research plan —Quantitative research

November 2008 4 CHRISTENSEN ASSOCIATES
Railroad Economics
Economies of density and fixed costs require pricing above marginal cost to cover total costs
— Economies of density – costs fall as traffic over network increases
By definition, price above marginal cost is the exercise of market power, but exercise does not imply abuseRailroads use differential pricing to recover their total costs
— Different commodity groups face different markups of rates over marginal costs

November 2008 5 CHRISTENSEN ASSOCIATES
Railroad Market Power –Margin Between RPTM and MC
$0.005
$0.010
$0.015
$0.020
$0.025
$0.030
$0.03519
87
1988
1989
1990
1991
1992
1993
1994
1995
1996
1997
1998
1999
2000
2001
2002
2003
2004
2005
2006
RPTM MC

November 2008 6 CHRISTENSEN ASSOCIATES
Trends in Railroad Rates and Market Power
Recent years’ rate increases due to declining productivity growth and increasing costs, not increased exercise of market powerMarket power index relatively flat in recent years—LMI = (RPTM-MC)/RPTM
Market power increased most when both MC and RPTM falling

November 2008 7 CHRISTENSEN ASSOCIATES
Railroad Market Power –Lerner Index
5%10%15%20%25%30%35%40%45%50%
1987
1988
1989
1990
1991
1992
1993
1994
1995
1996
1997
1998
1999
2000
2001
2002
2003
2004
2005
2006
Lerner Index

November 2008 8 CHRISTENSEN ASSOCIATES
Railroad Productivity and Costs
Recent declines in productivity growth and increases in input price growth
— Less ability for railroads to absorb cost increases— Reflected in upturn in RCAF-A
Increases in average and marginal costs in recent years
— “Spike” in fixed costs — Increases in marginal and variable costs— Differences in marginal costs by commodity and over
time

November 2008 9 CHRISTENSEN ASSOCIATES
Productivity-Adjusted Input Prices –RCAF-A
(1Q89=1.000)
0.500
0.600
0.700
0.800
0.900
1.000
1.100
1Q89 1Q90 1Q91 1Q92 1Q93 1Q94 1Q95 1Q96 1Q97 1Q98 1Q99 1Q00 1Q01 1Q02 1Q03 1Q04 1Q05 1Q06 1Q07 1Q08

November 2008 10 CHRISTENSEN ASSOCIATES
Railroad Average Costs
$0.000
$0.005
$0.010
$0.015
$0.020
$0.025
$0.030
$0.03519
8719
8819
8919
9019
9119
9219
9319
9419
9519
9619
9719
9819
9920
0020
0120
0220
0320
0420
0520
06
ATC AVC AFC

November 2008 11 CHRISTENSEN ASSOCIATES
Recent Trends in Commodity Rates
Rates and markups over marginal cost vary by commodity groups and within groups
— Relatively larger markups for agricultural commodities
Some ability by shippers to adjust to counteract increases
— e.g., length of haul, car loadings— But what are adjustment costs?— However, not all shippers can adjust
Data problems with intermodal— Most lumped into STCC 46, Misc. Mixed Shipments

November 2008 12 CHRISTENSEN ASSOCIATES
Estimated Marginal Costs and Markups by Commodity
LMI Adjusted MC
(2000 Q1 cents) Commodity 2001-2003 2004-2006 2001-2003 2004-2006Farm Products (Aggregate) 0.61 0.61 0.9 0.9 Barley 0.68 0.75 0.7 0.6 Corn 0.71 0.73 0.7 0.6 Wheat 0.67 0.71 0.8 0.7 Soybeans 0.63 0.58 0.9 1.0 Metallic Ores 0.46 0.51 2.1 2.3 Coal 0.41 0.41 1.1 1.1 Non-metallic Minerals 0.52 0.39 1.8 2.2 Food Products 0.59 0.60 1.2 1.2 Lumber & Wood Products 0.64 0.63 1.4 1.4 Chemicals 0.63 0.59 1.6 1.6 Petroleum & Coal Products 0.64 0.60 1.6 1.5 Clay, Concrete, Glass, & Stone 0.60 0.60 1.7 1.8 Primary Metal Products 0.59 0.59 1.8 2.1 Transportation Equipment 0.55 0.51 5.1 5.4 Intermodal (COFC/TOFC) -0.36 -0.35 4.3 4.5

November 2008 13 CHRISTENSEN ASSOCIATES
Railroad Revenue Sufficiency
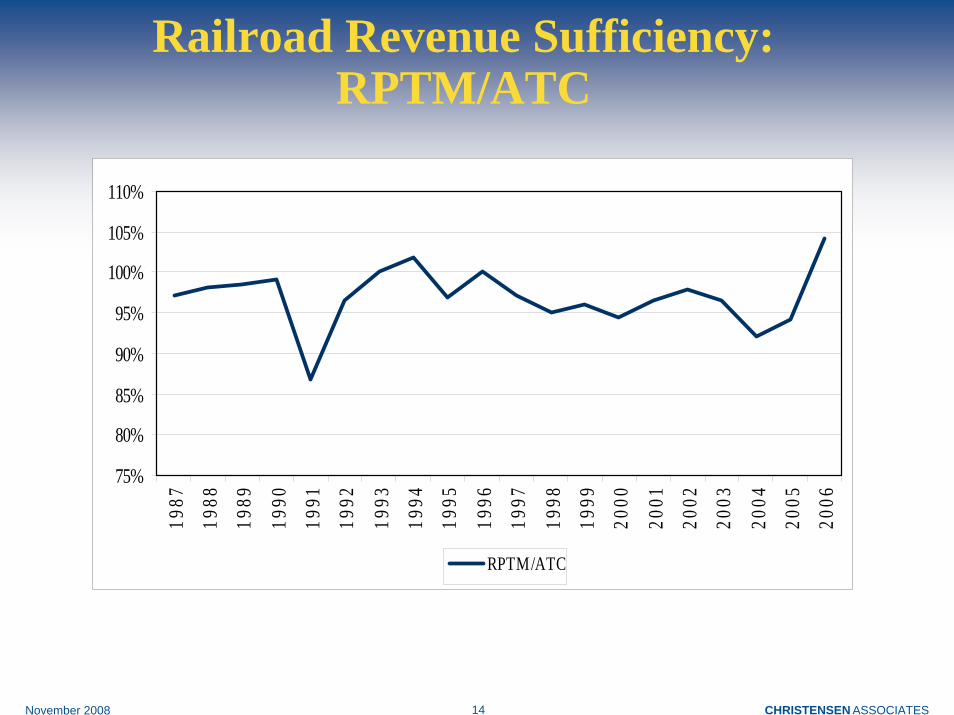
Revenue sufficiency measure = RPTM/ATCFor most years of study (1987-2006) Class I’s do not appear to be earning above normal profit
— Results vary by railroad— Does 2006 indicate start of new trend?
Consistent with financial market assessment— e.g., P/E ratios, EPS— Financial performance similar to electric utilities
November 2008 14 CHRISTENSEN ASSOCIATES
Railroad Revenue Sufficiency:RPTM/ATC
75%
80%
85%
90%
95%
100%
105%
110%19
87
1988
1989
1990
1991
1992
1993
1994
1995
1996
1997
1998
1999
2000
2001
2002
2003
2004
2005
2006
RPTM/ATC

November 2008 15 CHRISTENSEN ASSOCIATES
Railroad Revenue Sufficiency and Market Power
No increase in exercise of market power in recent years as revenue sufficiency improvedGreatest increases in market power occurred in late 1980s and early 1990s when industry mostly below and trying to achieve revenue sufficiency levels

November 2008 16 CHRISTENSEN ASSOCIATES
Railroad Revenue Sufficiency and Market Power
0%
20%
40%
60%
80%
100%
120%19
8719
8819
8919
9019
9119
9219
9319
9419
9519
9619
9719
9819
9920
0020
0120
0220
0320
0420
0520
06
RPTM/ATC Lerner Index

November 2008 17 CHRISTENSEN ASSOCIATES
Shipper Captivity
Within commodity groups, shippers with no or limited transportation options pay more than shippers with same shipment characteristics and better transportation alternativesR/VC is weakly correlated with market structure factors that affect shipper captivity
— Not a reliable indicator of market dominance— Instances of “relative captivity” when R/VC < 180— Percent of R/VC below100 often greater than percent
above 300

November 2008 18 CHRISTENSEN ASSOCIATES
Percent Tons and Ton-Miles by R/VC Category
Percent of Tons by R/VC Category Period R/VC < 100
Percent R/VC between
100 and 180 Percent
R/VC between 180 and 300
Percent
R/VC > 300 Percent
Subtotal R/VC > 180 Percent
2000-2001 14% 44% 31% 12% 43% 2005-2006 14% 42% 27% 17% 44% Percent of Ton-Miles by R/VC Category
Period R/VC < 100 Percent
R/VC between 100 and 180
Percent
R/VC between 180 and 300
Percent
R/VC > 300 Percent
Subtotal R/VC > 180 Percent
2000-2001 19% 51% 25% 5% 30% 2005-2006 20% 51% 21% 9% 29%

November 2008 19 CHRISTENSEN ASSOCIATES
Correlation of R/VC with Market Factors
Correlation Coefficient with R/VC Ratio
Commodity Group RPTM
Distance to Water
(Origin)
Distance to Water
(Destination)
Railroad Competition at
Origin
Railroad Competition at
Destination
Econometric Market
Structure Shifter
Chemicals 0.18 -0.03 -0.01 -0.07 0.01 0.06 Coal 0.61 -0.26 0.03 -0.25 -0.13 0.05 Corn 0.23 -0.01 0.09 0.00 -0.06 0.07 Intermodal 0.12 -0.06 0.13 -0.04 -0.20 0.21 Transportation 0.16 -0.18 -0.18 -0.05 -0.02 -0.10 Wheat 0.44 0.09 -0.04 -0.05 -0.02 0.08

November 2008 20 CHRISTENSEN ASSOCIATES
R/VC Averages by County - Wheat
-70�
-80�
-80�
-90�
-90�
-100�
-100�
-110�
-110�-120�-130�
40�
40�
30�
30�
COUNTIESR/VC Ratio
0.43 - 1.001.01 - 1.801.81 - 3.003.01 - 7.57Rivers 0 200 400 600 800100
Miles

November 2008 21 CHRISTENSEN ASSOCIATES
Market Structure and Rates - Wheat
-70�
-80�
-80�
-90�
-90�
-100�
-100�
-110�
-110�-120�-130�
40�
40�
30�
30�
COUNTIESMarket Structure Factor
1 - 1.331.33 - 1.491.49 - 1.641.64 - 1.87Rivers 0 200 400 600 800100
Miles

November 2008 22 CHRISTENSEN ASSOCIATES
Capacity Constraints
Capacity “tightness” due to localized congestion and constraints
— Similar to performance of other network industries— Econometric and engineering studies say overall
networks not constrained
No evidence of connection between capacity and increased exercise of market power
— No overall changes in railroad markups during periods of “tightness,” but some redistribution
Capacity lumpiness – hard to achieve optimalityFuture projections must be viewed cautiously

November 2008 23 CHRISTENSEN ASSOCIATES
Capacity Investment
Investment has increased in both nominal and real terms in recent yearsInvestment is relatively constant percent of industry revenues—Still high relative to other industries, but down
somewhat from 1990s – period of high “capex”—Similar to electric utilities

November 2008 24 CHRISTENSEN ASSOCIATES
Service Quality
RPM Train speed data used as proxy—These data are a rough, aggregate proxy
Service performance declines in 2003-2005 period linked to terminal congestionSpeed and variability by commodity—Variability typically greatest for coal and
grains, lowest for intermodal
Better data needed

November 2008 25 CHRISTENSEN ASSOCIATES
Economic Analysis of Policy Proposals
Circumstances (as of 2006) imply providing relief to certain groups will likely result in increases for other shippers or threaten railroad viability
— Caveat – does 2006 represent a new trend?Incremental policies have greater likelihood of resolving shipper issues with lower risk of adverse consequences. For example,
— Reciprocal switching, terminal agreements— Improvements in STB procedures— Possibility of encouraging competitive response and
expanding “size of pie”Some shippers will not benefit from greater competition – continued oversight necessary

November 2008 26 CHRISTENSEN ASSOCIATES
Economic Impact of Open Access Proposals
Reciprocal Switching
Bottleneck Rates
Terminal Agreements
Trackage Rights
Economies of Density
Potential gains Gains unlikely Potential gains Potential gains
Length-of-Haul Economies
Small loss Potentially large loss
No gain to small gain
No gain to small gain
Vertical Economies
Small loss Potentially large loss
Small loss Potentially large loss
Investment Incentives
Small effect Potentially large effect
Small effect Potentially large effect
Railroad Profitability
Small effect Potentially large effect
Small effect Potentially large effect
Coordination Costs
Small to moderate
Small to moderate
Small to moderate
Potentially large
Competitive Response
Most likely Least likely Most likely Somewhat likely
Shipper Gains Most likely Least likely Most likely Somewhat likely

November 2008 27 CHRISTENSEN ASSOCIATES
Future Directions
Captivity and effective competitionDisaggregate analysis of service qualityDisaggregate analysis of capacity issuesCost shiftingFuel surchargesClass II and III issuesCritical evaluation of demand growth projectionsAccess to railroads