
Studies on the Oxygen and Carbon Monoxide Equilibria of...
16
ARCHIVES OF BIOCHEMISTRY AND BIOPHYSICS 77, 478-492 (1958) Studies on the Oxygen and Carbon Monoxide Equilibria of Human Myoglobin! A. Rossi-Fanelli and E. Antonini From the Institlite of Biological Chemistry University of Rome and National Research Council Unit for Enzyme Studies, Rome, Italy Received March 10, 1958 INTRODUCTION The reactions of hemoglobin (Hb) and myoglobin (Mb) with gas are, for the particular mechanisms involved, one of the most interesting problems in biochemistry. In spite of a great number of researches on the gaseous equilibria of Hb from different animal species, Mb has not been extensively investi- gated from this point of view. The classical work by Theorell (1) with crystallized horse Mb appears to be the only detailed research on the oxygen-dissociation curves of this pigment. With respect to human Mb, this pigment has recently been obtained in pure crystallized form (2, 3), but only some of its chemical and physicochemical properties have been investigated so far (4, 5). It seemed therefore a matter of interest to perform a complete study of the oxygen equilibrium of crystallized human Mb. The study of oxygen equilibrium of Mb offers some technical dif- ficulties related to the nature of the pigment: (a) Mb must be available in pure crystallized form and this, in the case of human Mb, is not easy to obtain; (b) the crystallized pigment, which is obtained in the ferric form, should be reduced through a system that does not modify the properties of the protein; (c) the usual gasometric methods for the deter- mination of the oxygen-dissociation curves of Hb are not very suitable owing to the relatively small quantities of pigment available and to the great speed of oxidation of Mb. On the basis of these considerations, a convenient spectrophotometric nethod of determining the oxygen equilibrium of Mb was developed. 1 Aided in part by a grant from the Rockefeller Foundation. 478
Transcript of Studies on the Oxygen and Carbon Monoxide Equilibria of...

ARCHIVES OF BIOCHEMISTRY AND BIOPHYSICS 77, 478-492 (1958)
Studies on the Oxygen and Carbon Monoxide Equilibriaof Human Myoglobin!
A. Rossi-Fanelli and E. Antonini
From the Institlite of Biological Chemistry University of Rome and National ResearchCouncil Unit for Enzyme Studies, Rome, Italy
Received March 10, 1958
INTRODUCTION
The reactions of hemoglobin (Hb) and myoglobin (Mb) with gas are,for the particular mechanisms involved, one of the most interestingproblems in biochemistry.
In spite of a great number of researches on the gaseous equilibria ofHb from different animal species, Mb has not been extensively investigated from this point of view. The classical work by Theorell (1) withcrystallized horse Mb appears to be the only detailed research on theoxygen-dissociation curves of this pigment.
With respect to human Mb, this pigment has recently been obtainedin pure crystallized form (2, 3), but only some of its chemical andphysicochemical properties have been investigated so far (4, 5).
It seemed therefore a matter of interest to perform a complete studyof the oxygen equilibrium of crystallized human Mb.
The study of oxygen equilibrium of Mb offers some technical difficulties related to the nature of the pigment: (a) Mb must be availablein pure crystallized form and this, in the case of human Mb, is not easyto obtain; (b) the crystallized pigment, which is obtained in the ferricform, should be reduced through a system that does not modify theproperties of the protein; (c) the usual gasometric methods for the determination of the oxygen-dissociation curves of Hb are not very suitableowing to the relatively small quantities of pigment available and tothe great speed of oxidation of Mb.
On the basis of these considerations, a convenient spectrophotometricnethod of determining the oxygen equilibrium of Mb was developed.
1 Aided in part by a grant from the Rockefeller Foundation.
478
HUMAN MYOGLOBIN 479
The main advantages of this method are the following. Very simpleapparatus is required, and the procedure is rapid and easy to perform.The reduction of the pigment is obtained by an enzymic system thatoperates in a physiological manner, so that the use of chemical reducingagents is avoided. During the determination of the oxygen-dissociationcurve, the pigment is subjected to a very mild treatment and the stateof the pigment can be controlled at any time. Moreover, the oxygendissociation curve can be determined with very small quantities ofpigment and with both concentrated and diluted solutions. The objectof this note is to describe this method and to examine, in detail, theequilibria of the reactions of human Mb with O2 and CO.
EXPERIMENTAL
Apparatus
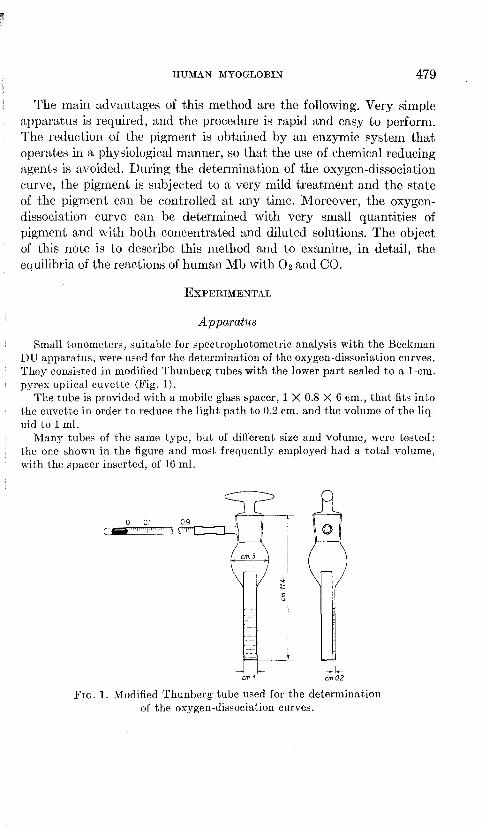
Small tonometers, suitable for spectrophotometric analysis with the BeckmanDU apparatus, were used for the determination of the oxygen-dissociation curves.They consisted in modified Thunberg tubes with the lower part sealed to a I-em.pyrex optical cuvette (Fig. 1).
The tube is provided with a mobile glass spacer, 1 X 0.8 X 6 em., that fits intothe cuvette in order to reduce the light path to 0.2 em. and the volume of the liquid to 1 ml.
Many tubes of the same type, but of different size and volume, were tested:the one shown in the figure and most frequently employed had a total volume,with the spacer inserted, of 16 ml.
o 0.1 0.9(1jjjjJ j i S IT:c=::::r=~1
I-em 1
-II.-em Q2
FIG. 1. Modified Thunberg tube used for the determinationof the oxygen-dissociation curves.

480 ROSSI-FANELLI AND ANTONINI
Preparation of Human Mb
Human Mb was crystallized according to Rossi -Fanelli (6) from skeletal musclescollected in post-mortem examinations from seven cases of different sex and age.Since no appreciable difference has been found in the oxygen equilibrium amongthe various Mb preparations, the different origin of the material will not be considered in this work.
The complete absence of Hb in each preparation was checked by spectropho_tometry (7) and paper electrophoresis (5).
As previously reported, human crystallized Mb is electrophoretically inhomoge_neous (5). The 02-dissociation curves of the isolated, pure components (Mb I andMb II) will be discussed later in the text.
DETERMINATION OF THE 02-DISSOCIATION CURVES
Enzymic Reduction of Ferri-Mb
The reduction of ferri-Mb was obtained as follows (8): 1 ,umole Mb+, 1.5-2,umoles DPNH, 1 X 10⁻² ,umole methylene blue (MB), and 100-200 ,ug. diphosphopyridine nucleotide (DPN) reductase were mixed together in 2-10 ml. of tris(hydroxymethyl)amino methane buffer, pH 7.45, 0.05 M; the formation of Mb02was followed spectrophotometrically.
After completion of the reduction, the O2 uptake of the Mb solution as measuredwith standard Warburg apparatus was found to be negligible (1-2,ul. O,jhr ./ml.).The solutions of Mb02 so obtained can be stored at + 2°C. for 3 or 4 days.
The DPN and the MB can be removed by dialysis, but since they do not affectthe O2equilibrium in the concentrations used, the Mb02 solutions were .generallyused for the determinations of the 02-dissociation curves without further treatment. Tris buffer, 0.05 M, pH 7.45, was used in most of the experiments. Whennecessary, the pH was varied by adding to the stock Mb solution (in Tris, 0.05M, pH 7.45) 0.1 N HCI or 0.1 N NaOH. In this way the ionic strength of the solutions was almost unchanged. After each determination the pH was measured witha Beckman pH meter.
The use of Tris buffer in the study of the oxygen equilibrium of Mb and Hbseemed suitable because it can be used between pH 7 and 9 and has a small salteffect compared with that of NaCl,2
Oxygenation of Mb
One milliliter of the Mb solution is measured into the tonometer cuvette, andthe stopper is sealed with silicone. The tonometer is then connected to a waterpump and kept at a temperature higher than the tap water in the pump (8-9°).
In some experiments a high vacuum pump was used; in this case deoxygenationcan be performed at a much lower temperature. After prolonged (10-15 min.)evacuation of the tonometer, the level of the liquid in the cuvette is measured andthe complete deoxygenation controlled spectrophotometrically .
Known amounts of air were then introduced in the tonometer in the following
2 Unpublished experiments by the authors.

HUMAN MYOGLOBIN 481
manner: a I-ml. graduated pipet having a meniscus of mercury was connected tothe side arm of the tonometer through a rubber tube; on cautiously opening thetap, the atmospheric air contained in the pipet is sucked into the tube. The volume of air introduced is measured by the displacement of the Hg meniscus in thepipet.
The tonometer was then rotated horizontally at constant temperature for 3-10min.; in the case of experiments at high temperatures, the equilibrium time mustbe the shortest possible since in these conditions Mb is rather quickly transformed into Mb+.
In our experimental conditions, the equilibrium was completed within 2-3min. After the equilibrium was established, the tonometer was transferred to theBeckman spectrophotometer and readings were taken at the wavelengths chosen.
The procedure was then repeated. In most experiments several points (three orfour) of the curve can be obtained; at low pH and high temperature (above 20°),however, only one or two points of the curve can be determined because, as mentioned, Mb readily changes into Mb+. The tonometer was then opened to air andthe optical density for complete oxygenation recorded. The experiments wereperformed in a room kept at constant temperature (20°), and the humidity andatmospheric pressure were controlled.
The pressure of oxygen in the tonometer corresponding to each introductionof air was calculated by the following formula:
PT
= P a X Vo _ FXV,
where
P T = oxygen pressure in the tonometer (at 20°)P a = oxygen pressure in air (at 20°)Vo = volume of air introduced into the tonometerV, = volume of the tonometer minus the volume of the Mb solutionX = oxygen bound to Mb02
F = factor to convert X in po, .
For dilute Mb solutions there is no need to introduce the correction for the O2
in combination with Mb. Since the volume of the liquid is very small, the O2
physically dissolved can be neglected.In order to maintain the proportionality between the O2 pressure and the O2
concentration, the O2 pressure in the tonometer was calculated for 20° as well asfor the higher and lower temperatures.
Spectrophotometry
The percentage of Mb02 was calculated from the following formula:

482
where
ROSSI-FANELLI AND ANTONINI
D obs = optical density at the po, under examinationD Mb = optical density at complete deoxygenation
DMbO, = optical density at complete oxygenation.
The spectrophotometric readings were taken, for the usual concentration of thepigment (between 0.2 and 1%) and 2 mm. light path, at 460, 510, 540, 560, and580 m!'; for higher Mb concentrations the readings were taken at 600 and 800m,u; for lower concentrations at 410 and 430 m,u.
The reading at 510 m,u (isosbestic point between Mb and Mb02) is taken inorder to control the possible formation of Mb+ and denaturation of the pigment.
The formula was applied to the readings obtained from the different wavelengths, and the mean of the values obtained was used for the plot of the O2
dissociation curve.
RESULTS
Shape of the 02-Dissociation Curve
The 02-dissociation curve of human Mb was found to be hyperbolicin all the experimental conditions examined. Such curves follow the Hillequation
y = K(P02t1 + K(P02)n
with a value of n = 1. The mean value of n experimentally determinedfrom about 50 dissociation curves was 1.03 (0.95-1.1). The equilibriumconstant, K, of the reaction can be then expressed as
K = Mb02Mb X P02
where Mb and Mb02 denote concentrations, and Po, oxygen pressurein mm. Hg.
The Effect of Temperature on the Dissociation Curves
Figure 2 and Table I show the effect of temperature on the dissociationcurves of human Mb in 0.05 M Tris buffer, pH 7.45.
From 10° to 40°, the curves obtained have the same shape and presenta marked increase in p! with increasing temperature.
Figure 3 shows that, for the range of temperature examined (10°-40°),a linear relation exists between log K and liT. .
On application of the van't Hoff equation (9), it is possible to calculate

HUMAN MYOGLOBIN 483
indirectly the over-all heat of the reaction Mb + O2 (gas) = Mb0 2 , viz.
Rdln KI1H = - d(ljT)
where I1H is the heat of reaction; K the equilibrium constant; T theabsolute temperature; R the gas constant.
1.0
y
0.5
478p02 mm Hg
FIG. 2. Oxygen-dissociation curves of human Mb at different temperatures.Tris buffer, 0.05 M, pH 7.45; Mb 2 X 10⁻⁴ M.Y = fractional saturation with oxygen.
TABLE I
Oxygen Equilibrium of Human Mb at Different Temperatures
Tris buffer, 0.05 M, pH 7.45; Mb 2 X 10⁻⁴ M.
Temperature, °c.Log K
10+0.49
20+0.14
30-0.18
35-0.32
40-0.48

484
+0.5
-0.5
ROSSI-FANELLI AND ANTONINI
000320 0.00330 000340 0.00350 0.00360 1/T
FIG. 3. Influence of temperature on the oxygen equilibrium of human Mb.
+0.5
--0_---..--00------
-0.5
10 11 pH
FIG. 4. Influence of pH on the oxygen equilibrium of humanMb. 20°C.; Mb 2 X 10⁻⁴ M.
The average value of !:lH calculated from the data obtained was-13.1 kca1.3 The heat so calculated is that of the combination of 1 g.mole O2 in the gaseous phase with Mb in the liquid phase; it thereforeincludes the heat of solution of O2•
3 For 10-20°, t:.H = -13.3 kcal.20-30° , -13.0 kcal.30-35°, -12.0 kcal.35-40°, -14.1 kcal.Mean = -13.1 ± 0.6 kcal.
From the slope of the line drawn in Fig. 3, t:.H = -13.0 kcal.

HUMAN MYOGLOBIN 485
Effect of pH
The effect of hydrogen-ion concentration on the oxygen equilibriumof human Mb in Tris buffer of ionic strength 0.05 at 20°C. is shown inFig. 4 and Table II.
lt can be seen that from pH 7.4 to 11.3 the Bohr effect is almost absent. At lower pH values the accurate determination of the equilibriumconstant is difficult since Mb readily changes into Mb+; however, nosignificant difference in the oxygen affinity was found above pH 5.5.
Effect of the Ionic Strength
The effect was studied at 20° with Mb solutions in Tris 0.05 M, theionic strength of which was increased by adding NaCl.
As shown in Fig. 5, even very high concentrations of NaCl do not affect the oxygen affinity.
TABLE IIOxygen Equilibrium of Human Mb at Different pH's
20°C.; I = 0.05; Mb 2 X 10⁻⁴ M.
pHLogK
7.40.14
7.450.15
7.70.12
8.20.16
8.80.16
9.00.18
11.30.28
Nace M
FIG. 5. Oxygen equilibrium of human Mb at different salt concentrations.20°C.; pH 7.45; Mb 2 X 10⁻⁴ M.

486 ROSSI-FANELLI AND ANTONINI
Effect of Mb Concentration
The oxygen-dissociation curves of human Mb have been determinedfor concentrations of the pigment from 0.2 X 10⁻⁴ M to 0.45 X 10⁻³ M.The Mb concentration in the muscles lies within these ranges. Figure6 shows that no difference can be demonstrated in the oxygen-dissociation curves for the different Mb concentrations.
Oxygen-Dissociation Curves of Mb in Strong Urea Solutions
Considering the important results obtained by Wyman (9) from thestudy of the O2 equilibrium of Hb in strong urea solutions, it seemedinteresting to examine the effect of urea on the reaction of Mb withoxygen. In the case of Mb, no splitting in subunits can be produced byurea, and therefore only the direct effect of urea on the oxygenationreaction should be present.
As shown in Table III, urea has no appreciable influence on the oxy-
+0.5
-0,5
4 5x10- 4M Mb
FIG. 6. Oxygen equilibrium of human Mb for different concentrations of thepigment. 20°C.; Tris buffer, 0.05 M, pH 7.45.
TABLE IIIOxygen Equilibrium of Human Mb in Strong Urea Solutions
Mb 2 X 10⁻⁴ M in Tris buffer, 0.1 M, pH 7.45.
Temperature Log K
Untreated Mb (control)Mb in 5 M ureaMb in 5 M urea
"C.
303020
-0.18-0.15+0.10

HUMAN MYOGLOBIN 487
gen-dissociation curves of human Mb. This finding gives a still greatersignificance to the results obtained by Wyman on Hb.
Oxygen-Dissociation Curves of Reconstituted Mb
In previous research (10) we reported the reversible splitting ofhuman Mb and the resynthesis of the pigment with protoheme anddeuteroheme (with H substituted for CH=CH2 groups in the 2 and 4positions of the porphyrin). The oxygen equilibria of reconstitutedproto- and deutero-Mb are summarized in Figs. 7, 8, and 9.
From these data it is evident that the oxygen equilibrium of recon-
po, 4 mm Hg
FIG. 7. Oxygen-dissociation curve of reconstituted deutero-Mb. 30°C.; Trisbuffer, 0.1 M, pH 7.4; deutero-Mb 1 X 10⁻⁴ M.Y = fractional saturation withoxygen.
+1.0
+0.5
6
o
8 9pH
,',
FIG. 8. Oxygen equilibrium of deutero-Mb at different pH's. 30°C.;deutero-Mb 0.5 X 10⁻⁴ M; I = 0.1.

488 ROSSI-FANELLI AND ANTONINI
stituted proto-Mb is identical to that of the natural pigment and thatdeutero-Mb has a much greater oxygen affinity than proto-Mb whilethe shape of the dissociation curve, the temperature, and the pH effects are the same.
Oxygen-Dissociation Curves of Mb I and Mb II
Our previous research (5) demonstrated that crystallized human Mbis inhomogeneous and that three distinct components (Mb I, Mb II,and Mb III) can be detected by electrophoresis. The relative percentages of the three components in the crystallized pigment are as follows:Mb I 70-80 %, Mb II 10-20 %, Mb III 5-7 %.
o
-0.5
0.00320 0.00330 0.00340 0.00350 1ITFIG. 9. Oxygen equilibrium of reconstituted proto-Mb - -e- - and deutero-Mb
-0- at different temperatures. Tris buffer, 0.1 M, pH 7.40; proto-Mb 1.5 X 10⁻⁴
M, deutero-Mb 0.5-1 X 10⁻⁴ M.
TABLE IV
Oxygen Equilibrium of Mb I and Mb II at Different Temperatures
Borate buffer pH 8; I = 0.05; Mb I 0.5 X 10⁻⁴ M, Mb II 0.4 X 10⁻⁴ M. The oxygen dissociation curves of both components follow the Hill equation with n = 1.
LogKTemperature
MbI MbII
ae.20 +0.18 +0.1925 +0.03 +0.0430 -0.13 -0.1135 -0.28 -0.2340 -0.47 -0.42
HUMAN MYOGLOBIN 489
For a correct evaluation of the results reported above on the oxygenequilibrium of crystallized human Mb, it was necessary to determinewhether the oxygen-dissociation curves of the Mb components were different from those obtained from the crystallized Mb.4
For this purpose Mb I and Mb II were isolated by electrophoresison starch gel, and the 02-dissociation curves of the pure homogeneouscomponents were determined. 5
The results of these experiments are summarized in Table IV. It canbe seen that the Mb components are almost identical to each other asthe oxygen equilibrium is concerned.
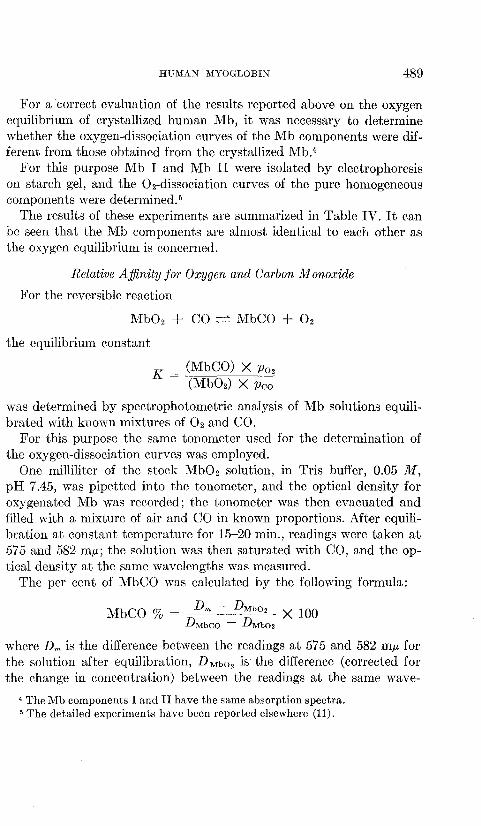
Relative Affinity for Oxygen and Carbon Monoxide
For the reversible reaction
Mb02 + CO ~ MbCO + O2
the equilibrium constant
K = (MbCO) X P02
(Mb02) X PCO
was determined by spectrophotometric analysis of Mb solutions equilibrated with known mixtures of O2and CO.
For this purpose the same tonometer used for the determination ofthe oxygen-dissociation curves was employed.
One milliliter of the stock Mb02 solution, in Tris buffer, 0.05 M,pH 7.45, was pipetted into the tonometer, and the optical density foroxygenated Mb was recorded; the tonometer was then evacuated andfilled with a mixture of air and CO in known proportions. After equilibration at constant temperature for 15-20 min., readings were taken at575 and 582 m,u; the solution was then saturated with CO, and the optical density at the same wavelengths was measured.
The per cent of MbCO was calculated by the following formula:
MbCO % = Dm - DMb02 X 100D MbCO - DMb02
where D m is the difference between the readings at 575 and 582 m,u forthe solution after equilibration, D Mb02 is the difference (corrected forthe change in concentration) between the readings at the same wave-
4 The Mb components I and II have the same absorption spectra.5 The detailed experiments have been reported elsewhere (11).

490 ROSSI-FANELLI AND ANTONINI
TABLE VRelative Affinity of Human Mb for Oxygen and Carbon Monoxide
Temp., 20°0.; Tris buffer, 0.05 M, pH 7.45; Mb 2 X 10⁻⁴ M.
Determination(MbCO) po,
K(MbO,) Pea
1 1 40 402 0.46 86 393 0.43 86 37
lengths for oxygenated Mb, and D MbCO is the same difference after saturation with CO.
The values of K obtained at 20" and pH 7.45 are reported in Table V.
Relation between log K and "Span"
Anson et al. (12) observed for many Hb's a linear relation betweenthe logarithm of the partition constant K and the "span" in angstrom units of the bands of the oxy and carbomonoxy compounds: y =log Kj"span"
As a result of a number of determinations, the "span" for human Mbwas found to be 33 A.; the value of y calculated from the "span" andthe partition constant was 0.048. Theorl;)ll (14) for horse Hb found y =0.045.
DISCUSSION
The reported data give a complete picture of the equilibrium betweenhuman Mb and oxygen.
Small but significant differences can be observed between our dataand those obtained by Theorell on horse Mb that might be attributedeither to the different pigment investigated or to the different methodsused.
The p~ for human Mb at 37" and pH 7.4 calculated from our data is2.75 mm Hg. This value, compared with that for human Hb in physiological conditions (p~ ~ 25 mm. Hg) is in agreement with the hypothesis of the function of Mb as a storage of O2 and as a link between theoxygen carrier (Hb) and the oxidizing systems in the muscle.
The over-all heat of oxygenation of human Mb has been found to be-13.1 kcal. This value is lower than that obtained by Theorell ( -17.5kcal.) and is similar to the heat of oxygenation for the 1" heme in Hbaccording to Roughton (13).

HUMAN MYOGLOBIN 491
The oxygen equilibrium of human Mb is not affected by the hydrogen~ion concentration, by the ionic strength or by the concentration ofthe pigment; this behavior differs from that of Hb and reflects the deepstructural and functional differences between the two pigments.
The study of the O2 equilibrium of the components that are presentin crystallized Mb (and in muscle extracts) demonstrates that Mb Iand Mb II have almost identical 02-dissociation curves: The heterogeneity of Mb should therefore be regarded as a problem concerningthe chemical structure rather than the functional properties of the pigments.
The results obtained with reconstituted proto- and deutero-Mb emphasize the importance of the vinyl side chains of protoheme in the reaction of Mb with O2.
The values for the partition constant between O2 and CO for humanMb are in agreement with those reported for other animal species (14,15).
ACKNOWLEDGMENT
The authors wish to thank Mr. Renata Giuffre for skilled technical assistance.
SUMMARY
1. A new spectrophotometric method of determining the oxygendissociation curves of Mb (and Hb) has been developed.
2. The oxygen equilibrium of human crystallized Mb has been studied by this method. The effect of temperature, pH, ionic strength, andconcentration of the pigment has been examined.
3. The oxygen-dissociation curves of reconstituted Mb's and of Mbcomponents Mb I and Mb II have also been investigated.
4. The partition constant K = (MbCO) X P02/(Mb0 2) X peo,for human crystallized Mb has been determined.
REFERENCES
1. THEORELL, H., Biochem. Z. 268, 73 (1934).2. THEORELL, H., AND DE DUVE, C., Arch. Biochem. 12,113 (1947).3. ROSSI-FANELLI, A., AND PERRI, G. C., Boll. soc. ital. biol. spero 23,119 (1947).4. ROSSI-FANELLI, A., CAVALLINI, D., AND DE MARCO, C., Biochim. et Biophys.
Acta 17, 377 (1955).5. ROSSI-FANELLI, A., AND ANTONINI, E., Arch. Biochem. Biophys. 65, 587 (1956).6. ROSSI-FANELLI, A., "Haemoglobin':' p. 115. Butterworths Sci. Pub!., London,
1949.7. DE DUVE, C., Acta Chem. Scand. 2, 264 (1948).

492 ROSSI-FANELLI AND ANTONINI
8. ROSSI-FANELLI, A., ANTONINI, E., AND MONDOVI, B., Arch. Biochem. Biophys.68, 341 (1957).
9. WYMAN, J., Advances in Protein Chem. 4, 410 (1948).10. ROSSI-FANELLI, A., AND ANTONINI, E., Arch. Biochem. Biophys. 72, 243 (1957).11. ROSSI-FANELLI, A., AND ANTONINI, E., Experientia 12,477 (1957).12. ANSON, M. L., BARCROFT, J., MIRSKY, A. E., AND DIMMA, S., Proc. Roy. Soc.
(London) B97, 61 (1925).13. ROUGHTON, F. J. W., quoted by GEORGE, P., in "Currents in Biochemical
Research" (Green D. E., ed.), p. 365. Interscience Pub!., New York, 1956.14. THEORELL, E., Biochem. Z. 268, 64 (1934).15. ROCHE, J., Camp. rend. soc. bioI. 195, 501 (1932).
ARCHIVES OF BIOCHEMISTRY AND BIOPHYSICS 77, 493-509 (1958)
Studies on Pig Liver Microsomes. I. Enzymic andPigment Composition of Different
Microsomal Fractions!
David Garfinke12
From the Johnson Foundation for Medical Physics, University of Pennsylvania,Philadelphia, Pennsylvania
Received January 6, 1958
INTRODUCTION
Since the demonstration of Strittmatter and Ball (1) that a characteristic cytochrome (bs) is present in microsomes, much work has beendone on the electron-transport behavior of microsomes. This includesboth kinetic studies on intact microsomes3 and isolation of enzymes,including the cytochrome itself (2, 3) and various reductases (4, 5).Thus far there has been little work on how electron-transporting components are organized in microsomes. This communication is concernedwith the chemical and enzymic composition of pig liver microsomes, theirappearance in the electron microscope and some data as to their organization, much of which was obtained in the course of enzyme preparations(particularly preparation of cytochrome bs). A more detailed picturemay be obtained by following the effects of digestion on a number ofenzymes and related substances.4
METHODS AND MATERIALS
Pig liver microsomes were prepared as previously described (3). Almost all thedata here reported were obtained from microsomes prepared from pig livers whichhad been perfused with mammalian Ringer's solution. No precipitant such as(NH,)zS04 (2) or acid (4) was used in the preparations; these precipitants mayhave an appreciable effect on the microsomal structure (5).
1 A preliminary report of part of this work was presented at the meeting of theBiophysical Society, Cambridge, Mass., Feb. 5, 1958.
2 Public Health Service Research Fellow of the National Cancer Institute.3 Klingenberg, M., in preparation.4 Garfinkel, n., in preparation.
493


![Detecting Carbon Monoxide Poisoning Detecting Carbon ...2].pdf · Detecting Carbon Monoxide Poisoning Detecting Carbon Monoxide Poisoning. Detecting Carbon Monoxide Poisoning C arbon](https://static.fdocuments.us/doc/165x107/5f551747b859172cd56bb119/detecting-carbon-monoxide-poisoning-detecting-carbon-2pdf-detecting-carbon.jpg)
