STUDIES ON THE BEHAVIOUR OF A MULTI-SPAN CONTINUOUS …
13
107 PROC. OF JSCE, No. 265, SEPT. 1977 STUDIES ON THE BEHAVIOUR OF A MULTI-SPAN CONTINUOUS BRIDGE IN A SEISMIC AREA By Sohei MATSUNO*, Bokkahalli Subbaiah BASAVARAJAIAH**, Keizo UGAI*** and Yoshiyuki MOMIYAMA**** 1. INTRODUCTION In these days, it has become necessary to construct large number of bridges with increased number of long span. On the other hand, recent developments in civil engineering have reached such an advanced state to meet these social demands. When the length of a bridge becomes considerably large, the phase differences of approaching seismic waves at piers can not be neglected. Moreover, the form of the input seismic waves themselves may differ at each pier, due to the varying geological and soil conditions. Such seismic waves influence the behaviour of bridges through fixed piers and frictions of moveable shoes at pier tops. Consider- ing the above mentioned conditions, dynamic analyses have been made through models for single and 3-span continuous bridges. The results of these studies have been published in the references 1) and 2). In this paper, the studies on the behaviour of a continuous bridge of 30-spans subjected to seismic waves in the longitudinal direction are reported. In Chap. 2, the continuous bridge whose super structure is supported on piers through hinges only, is discussed anticipating increased resistance to seismic attack by increasing statical indeterminacy. Also the behaviour of piers at plastic and failure state, the influence of phase differences of seismic waves and the effect of static strength of pier are studied. From the results of these studies, several suggestions are proposed for practical design of long continuous bridges. In Chap. 3, to achieve the benefits of long continuous bridges which possess great resistance to seismic attack, studies have been made on a suitable model of 30-span continuous bridge. The effect of plasticity of piers substituted by controlled friction at moveable pier tops and the influence of phase differences of seismic waves are discussed. From the results of these studies, sug- gestions, for the design of pier sizes independent of thermal stresses and also for the design of continuous bridges in practice, are made. It should be noticed that, in this study, the following assumptions were being provided, i.e., ( i ) The model was a 30-span continuous bridge whose superstructure was assumed as a rigid body, which could not be permitted when the frequency of incident waves was greater than the natural frequencies of the axial elastic- vibration of the super structure, (ii) The piers showed perfectly elastic-plastic behaviours, and (iii) The seismic waves were assumed as steady sine waves which propagated to the direction of bridge axis. 2. MODEL ANALYSIS OF THE BRIDGE STRUCTURE TREATING ALL THE SUP- PORTS AS HINGED 2.1 Object and Significance of this Investigation Continuous bridges have become popular on ac- count of their cheapness, savings in labour during construction, elimination of several joints for high speed traffic and so on. The main object was to study the behaviour of the superstructure having hinged supports only as its stiffness increases with the increase in the degree of indeterminacy and improves the resistance against earthquake shocks. It was also intended to solve the problem of exces- sive stress concentration at the fixed supports and * Dr . Eng., Professor, Dept. of Civil Eng., Niigata University. ** Dr . Eng., Professor, Dept. of Civil Eng., Karnataka Regional Engineering College, Karnataka State, India. *** Research Associate , Dept. of Civil Eng., Niigata University. **** Engineer of Japan Highway Public Corpo - ration.
Transcript of STUDIES ON THE BEHAVIOUR OF A MULTI-SPAN CONTINUOUS …
107
PROC. OF JSCE,
No. 265, SEPT. 1977
STUDIES ON THE BEHAVIOUR OF A MULTI-SPAN
CONTINUOUS BRIDGE IN A SEISMIC AREA
By Sohei MATSUNO*, Bokkahalli Subbaiah BASAVARAJAIAH**,
Keizo UGAI*** and Yoshiyuki MOMIYAMA****
1. INTRODUCTION
In these days, it has become necessary to construct large number of bridges with increased number of long span. On the other hand, recent developments in civil engineering have reached such an advanced state to meet these social demands.
When the length of a bridge becomes considerably large, the phase differences of approaching seismic waves at piers can not be neglected. Moreover, the form of the input seismic waves themselves may differ at each pier, due to the varying geological and soil conditions. Such seismic waves influence the behaviour of bridges through fixed piers and frictions of moveable shoes at pier tops. Consider-ing the above mentioned conditions, dynamic analyses have been made through models for single and 3-span continuous bridges. The results of these studies have been published in the references 1) and 2).
In this paper, the studies on the behaviour of a continuous bridge of 30-spans subjected to seismic waves in the longitudinal direction are reported. In Chap. 2, the continuous bridge whose super structure is supported on piers through hinges only, is discussed anticipating increased resistance to seismic attack by increasing statical indeterminacy. Also the behaviour of piers at plastic and failure state, the influence of phase differences of seismic waves and the effect of static strength of pier are studied. From the results of these studies, several
suggestions are proposed for practical design of long continuous bridges. In Chap. 3, to achieve the benefits of long continuous bridges which possess
great resistance to seismic attack, studies have been made on a suitable model of 30-span continuous bridge. The effect of plasticity of piers substituted by controlled friction at moveable pier tops and the influence of phase differences of seismic waves are discussed. From the results of these studies, sug-
gestions, for the design of pier sizes independent of thermal stresses and also for the design of continuous bridges in practice, are made.
It should be noticed that, in this study, the following assumptions were being provided, i.e.,
( i ) The model was a 30-span continuous bridge whose superstructure was assumed as a rigid
body, which could not be permitted when the frequency of incident waves was greater than
the natural frequencies of the axial elastic-vibration of the super structure,
(ii) The piers showed perfectly elastic-plastic behaviours, and
(iii) The seismic waves were assumed as steady sine waves which propagated to the direction
of bridge axis.
2. MODEL ANALYSIS OF THE BRIDGE STRUCTURE TREATING ALL THE SUP-
PORTS AS HINGED
2.1 Object and Significance of this Investigation
Continuous bridges have become popular on ac-count of their cheapness, savings in labour during construction, elimination of several joints for high speed traffic and so on. The main object was to study the behaviour of the superstructure having hinged supports only as its stiffness increases with the increase in the degree of indeterminacy and improves the resistance against earthquake shocks. It was also intended to solve the problem of exces-sive stress concentration at the fixed supports and
* Dr . Eng., Professor, Dept. of Civil Eng.,
Niigata University. ** Dr . Eng., Professor, Dept. of Civil Eng.,
Karnataka Regional Engineering College,
Karnataka State, India. *** Research Associate
, Dept. of Civil Eng., Niigata University.
**** Engineer of Japan Highway Public Corpo -
ration.

108 S. MATSUNO, B. S. BASAVARAJAIAH, K. UGAI and Y. MOMIYAMA
to study the effect of elimination of joints. Some more dynamical problems caused by these changes had to be studied.
2.2 Procedure
Various steps followed in the procedure were:
( i ) Selection of suitable 30-span continuous bridge model, which could be easily solved.
(ii) ) Supporting the superstructure on each pier top with hinges only, where the piers possessed
plasticity and were subjected to seismic waves with phase difference.
(iii) Derivation of the Equations of Motion. (iv) Preparation of a suitable programme for the
electronic computer to solve the equations numerically.
( v ) Selection of various parameters of input data for the computation such as spring constants of
piers, pier static strength, pier displacements at the time of failure and phase differences of input seismic waves.
(vi) Obtaining of output such as displacements, velocities and acceleration of superstructure,
relative displacement between superstructure and foundation, behaviour of piers in the elastic,
plastic or collapse stage.
2.3 Choice of the Model
The model shown in Fig. 1 for a 30-span con-tinuous bridge was substituted by the model shown in Fig. 2 and the Coulomb's friction factor (Kb) occuring at each pier top was used instead of the
yield strength of the pier. The superstructure was assumed rigid.
2.4 Equations of Motion
The equations of motion of the model were derived taking into consideration whether each shoe was sliding or not. The method to check whether each pier was under plastic or elatic state (i.e., whether each position which had Coulomb's friction was sliding or not) was explained in the reference 1), " 5, (1), (a), The method to treat Friction " on
page 19 to 20. The condition of each pier was examined at
first by using eq. (2-1) meant for the elastic state. And as soon as one of the piers approached the
plastic state eq. (2-2), which includes an ad-ditional term to account for the plastic state was used instead of eq. (2-1).
( i ) When all the piers were in the elastic range the equation of motion was of the form:
(2-1)
(ii) ) When jth pier was in the plastic range the equation of motion was of the form:
(2-2)
where ' sign ' is the function which represents
the sign of the value in parenthesis.
2.5 Programme for computation
A programme in Fortran IV was written for
solving the above problem and the computation was
done by an IBM 360 computer. In this programme,
in brief, the seismic waves were included in the
input data and the response of the superstructure
was also obtained as one of the output along with
the influence of seismic waves on piers (whether
each pier was in elastic, plastic or failure state or
not).
The fact mentioned in 2.4 was taken into consider-
ation. The change from elastic to plastic state
occures in a small interval of time Ģt: The piers
would be in an elastic state at the time " t " and
in the plastic state at the time "t+Ģt". In this
case it was assumed that the shift took place at
the time interval "Ģt"
and the piers approached
plastic state at load K'
although they should have
reached plastic state at
load K as indicated by the
hysterisis curve in Fig. 3.
But the precise treatment
of this problem was com-
Fig. 1 Structural Model of (n -1)- span Continuous Bridge.
Fig. 2 Vibration Model of (n -1)-span Continuous Bridge.
Fig. 3 Hysterisis Curve
of a Pier.

Studies on the Behaviour of a Multi-span Continuous Bridge in a Seismic Area 109
plicated and hence the difference between K and K' was neglected as the error caused by this in an interval of time tit was negligible.
2.6 Input and Output
Input data were the bridge constants (spring constants et al.), time intervals, seismic waves and all other factors which were necessary for the computation. (Refer Table 1).
(a) ( b )
( i ) In the computation the time interval Ģt and
seismic duration time T' were 0.01 sec. and 2
secs. respectively, which were determined taking
into account the accuracy required and the time
required to reach the steady state of vibration.
(ii) As for the seismic waves, sine waves with
amplitude 2 cm and angular velocity 15 rad/sec
were used. This corresponded to an acceleration
of 450 cm/sec' or to a severe earthquake, shock
level of 7. The expression x=x0 sin (wt-ƒÓ)
was used considering the phase difference ƒÓ,
which was necessary as the bridge in question
was very long. Six values of ƒÓ lying in the
range of ƒÓ to ƒÎ were used between two end
piers of the bridge as shown in Table 2 (a).
The phase differences corresponding to inter-
mediate piers were determined in proportion
to their distances from the end pier which
was first attacked by the seismic waves.
(iii) As for the values of the bridge constants, the
piers were regarded as reinforced concrete structures, designed according to standards and the values of the spring constants, the static strength and the displacement at failure were assigned suitably (Refer to Fig. 4). The values of the static strength and the displacement at failure were controlled in such a way that the energy spent up to the time of failure was constant as shown in Fig. 5 (See Table 2 (b)). In evaluating the mass of the superstructure it was estimated to be 9 000 ton. In addition, the weight of equivalent mass of each pier was added to this and the sum was assigned the value of m in Fig. 2.
(a) side elevation of bridge (b ) Side elevation of pier
(c) A-A section (in plane)
2.7 Discussion
2.7.1 The Influence of Phase Differences of
Seismic Waves
In Fig. 6 the time response curve of the super-
structure is shown where the variable parameter is
Table 1 Input Data.
Table. 2 Numerical Values of Input Data.
Fig. 4 Dimensions of Pier.
Fig. 5 Static Strength of Piers vs. Displacement.
(See Table 2 (b))
Fig. 6 Time Response Curve of the Superstructure.
(as to input data. cf. Table 2 (a))

110 S. MATSUNO, B. S. BASAVARAJAIAH, K. UGAI and Y. MOMIYAMA
the phase difference. In its calculation all the factors except phase difference were kept constant and the computer was allowed to record the failure of piers which was defined by definite relative displacements of pier tops to foundations and the total failure was defined as the failure of all
piers. If the total failure occured, the calculation would be interrupted. As seen from Fig. 6, the existence of phase differences seems to have the effects of lessening the response of bridges, in other words, making the occurence of total failure difficult. When the phase difference is r rad, the vibrations seem to be in the steady state as seen from the response curve and the more increase of time would not cause failure. On the other hand, as the phase differences become smaller, the displacements be-come larger and the time for failure shorter. This
phenomenon seems to be due to mutual interference of input waves with various phase differences at each pier which reduces the vibration. These are seen in Fig. 7, which shows the relation between
phase differences and time interval up to the com-mencement of the failure of piers (partial failure), and Fig. 8 shows up to total failure. Fig. 7 shows the phenomenon that the time for partial failure increases gradually as the phase difference ap-
proaches 7. Fig. 8 shows the phenomenon that the time for total failure increases rapidly as the
phase difference approaches 7. Fig. 9 shows the relationship between the phase
differences and the displacements (absolute values) of superstructure at the time of partial failure. From this, it is clear that as phase differences increase the displacements decrease. This is due to the mutual interference of input waves at each
pier, though some piers are subjected to large dis-placements in the case of large phase differences.
2.7.2 Influence of Plasticity of Piers Fig. 10, 11 and 12 show the displacement response
curves corresponding to different static strengths and displacements at failure. The energy consumed up to time of failure of pier was assumed constant in each case. The static strength—displacement curves in each of these figures correspond to the curves A, B and C of Fig. 5. In Fig. 12, the dis-
placement is irregular when compared to its be-haviour in Fig. 10 and 11. This might be due to the fact that the calculation was done in the neighbourhood of resonance. As observed in these figures, it is more difficult to cause the total failure of piers with small static strength and large plas-ticity when the energy consumed remains constant.
Fig. 7 Relationship between Phase Difference and Time Required for Partial Failure.
(as to input data, cf. Table 2 (a))
Fig. 8 Relationship between Phase Difference and Time Required for Total Failure. (as to input data, cf. Table 2 (a))
Fig. 9 Relationship between Phase Difference and Maximum Displacement of the Super Structure at the Time of Partial Failure.
(as to input data, cf. Table 2 (a))
Fig. 10 Response of the Superstructure When the Properties of Piers Correspond to A in Fig. 5.
(as to input data, cf. Table 2 (b))
Studies on the Behaviour of a Multi-span Continuous Bridge in a Seismic Area 111
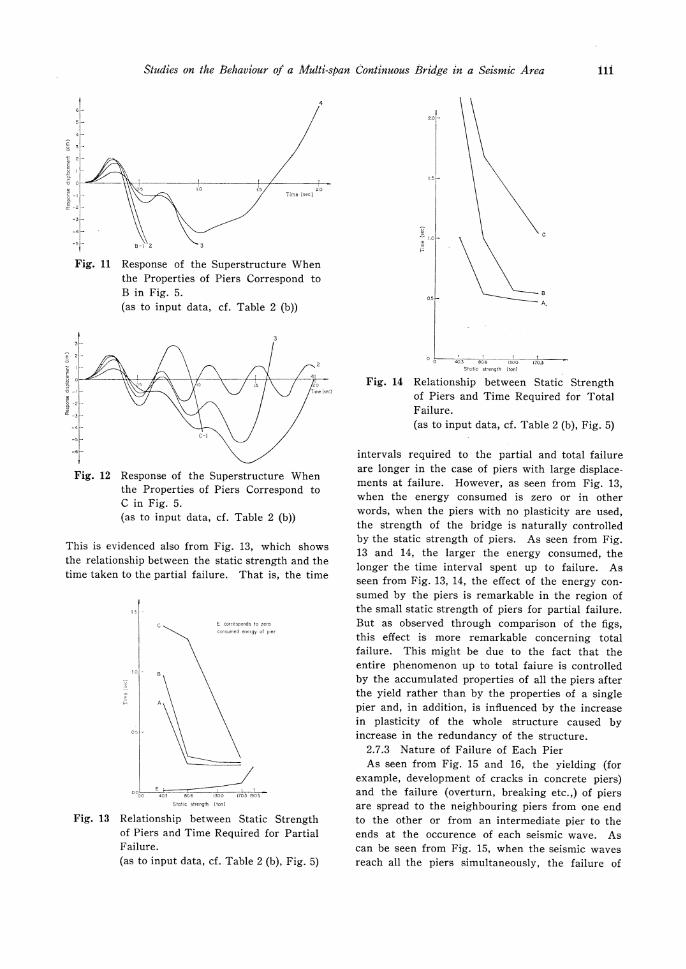
This is evidenced also from Fig. 13, which shows
the relationship between the static strength and the
time taken to the partial failure. That is, the time
intervals required to the partial and total failure are longer in the case of piers with large displace-ments at failure. However, as seen from Fig. 13, when the energy consumed is zero or in other words, when the piers with no plasticity are used, the strength of the bridge is naturally controlled by the static strength of piers. As seen from Fig. 13 and 14, the larger the energy consumed, the longer the time interval spent up to failure. As seen from Fig. 13, 14, the effect of the energy con-sumed by the piers is remarkable in the region of the small static strength of piers for partial failure. But as observed through comparison of the figs, this effect is more remarkable concerning total failure. This might be due to the fact that the entire phenomenon up to total faiure is controlled by the accumulated properties of all the piers after the yield rather than by the properties of a single
pier and, in addition, is influenced by the increase in plasticity of the whole structure caused by increase in the redundancy of the structure.
2.7.3 Nature of Failure of Each Pier As seen from Fig. 15 and 16, the yielding (for
example, development of cracks in concrete piers) and the failure (overturn, breaking etc.,) of piers are spread to the neighbouring piers from one end to the other or from an intermediate pier to the ends at the occurence of each seismic wave. As can be seen from Fig. 15, when the seismic waves reach all the piers simultaneously, the failure of
Fig. 11 Response of the Superstructure When the Properties of Piers Correspond to B in Fig. 5.
(as to input data, cf. Table 2 (b))
Fig. 12 Response of the Superstructure When the Properties of Piers Correspond to C in Fig. 5.
(as to input data, cf. Table 2 (b))
Fig. 13 Relationship between Static Strength of Piers and Time Required for Partial Failure.
(as to input data, cf. Table 2 (b), Fig. 5)
Fig. 14 Relationship between Static Strength of Piers and Time Required for Total Failure.
(as to input data, cf. Table 2 (b), Fig. 5)

112 S. MATSUNO, B. S. BASAVARAJAIAH, K. UGAI and Y. MOMIYAMA
each pier takes place at the same time. When there are phase differences, the mode of occurence of yield and failure can be determined. This will be from that end of the bridge which is attacked first by the seismic waves.
It is apparent from B-4 and B-1 in Fig. 16 that
yield and failure cannot be easily caused in the piers with large displacements at failure. But it can be noticed that the failure of piers in the case of B-4 was spread from intermediate piers to both ends in the case B-4. This phenomenon, combined with the temperature effect on fixed continuous beams, calls for the necessity of reconsiderations in the traditional design of bridge structures. The recommendations that can be suggested in this case are (1) Both end piers to should be designed to have more elastic properties, and (2) The intermediate
piers should be designed to have more plastic properties. The most important fact is the meaning
of the fact that as observed in Fig. 16, the failure of all piers occur simultaneously in a very short time in the case of no phase differences of seismic waves. This is analogous to the case where the superstructure is supported only by one pier having 31 times the strength of a single pier. The inportance of the meaning of this fact was ex-plained in the reference 1) on page 10 to 11.
2.8 Conclusions
Here, the authors should like to iterate that the following conclusions, obtained from above discus-sions could be true on the assumptions which were mentioned in chapter 1. ( 1 ) In case the seismic waves with phase dif-
ferences reach a continuous bridge with many spans and with fixed supports, then smaller the phase differences, larger will be the response displacements and shorter will be the time required for failure.
( 2 ) When the energy consumed till failure of piers is constant, then for a low static strength there will be larger displacements at failure and it is
difficult to cause failure. ( 3 ) When the energy consumed by the piers is
zero, the strength of the bridge becomes large proportionately with the static strength of the
piers. ( 4 ) In case the static strength of piers is constant,
greater the energy consumed is, larger the strength of the bridge will be. And this trend
is remarkable for small static strength of piers. ( 5 ) When the seismic waves reaching each pier
have phase differences and the displacement at failure is small, the failure of piers spreads from
an end pier, which the seismic waves reach first. ( 6 ) The static displacements of the superstructure
due to temperature changes become greater at the ends. Hence, when the effects of earthquakes
and temperature changes are taken into account, it is desirable to design the continuous bridge
with all piers fixed in such a way as to make the elastic displacements and displacements at
failure of piers large.
( 7 ) Consequently, it is desirable to design the end piers to possess large elastic deformations and the intermediate piers to possess large plastic
deformations. ( 8 ) And also it is desirable to use supports with
large friction at pier tops which can be adjusted suitably to preserve the advantages of fixed
supports and at the same time to avoid large thermal stresses.
( 9 ) Thus, it can be concluded, that designing the piers to have large displacements at failure and
Fig. 15 Yielding and Failure Behaviour of Piers After the Seismic Wave Reaches the
Bridge vs. Phase Difference of Input Waves.
(as to input data, cf. Table 2 (a))
Fig. 16 Yielding and Failure Behaviour of Piers After the Seismic Wave Reaches the
Bridge When the Energy Parameter is B Shown Fig. 5.
(as to input data, cf. Table 2 (b))
Studies on the Behaviour of a Multi-span Continuous Bridge in a Seismic Area 113
increasing the redundancy of the bridges through
the increase in number of fixed supports will
increase the dynamic strength of bridges at
seismic time.
3. MODEL ANALYSIS OF THE BRIDGE WHOSE SUPERSTRUCTURE IS ON
SEVERAL HINGED SUPPORTS AND
ON MOVEABLE SHOES WITH CON-TROLLED FRICTION ON PIER TOPS
3.1 Choice of the Model
In the previous chapter, it has been found, that the increase of number of fixed supports and of
plasticity of piers improved the behaviour of the continuous bridge, when it was subjected to seismic force. Such a structure naturally results in the increase of the thermal stress if all the supports are fixed. Moreover consideration of plasticity of
piers may mean permitting development of cracks in the piers during earthquake. In practice cracks should not be permitted. And such a bridge structure should be designed to have the advantages of both the ductility of a continuous bridge by increasing the degree of indeterminacy through increase in number of fixed supports and the plasticity of piers. In this chapter it is proposed to replace fixed sup-
ports by moveable shoes with controlled frictional resistances, which will have the same effect as fixed supports in practice. The frictional resistance at moveable supports is supposed to be governed in such a manner that it corresponds to the plasticity of the pier and will be in such a range as not to cause any damage to the pier due to thermal stresses.
The model corresponding to such a continuous
(a) Structural model
(b) Vibration model
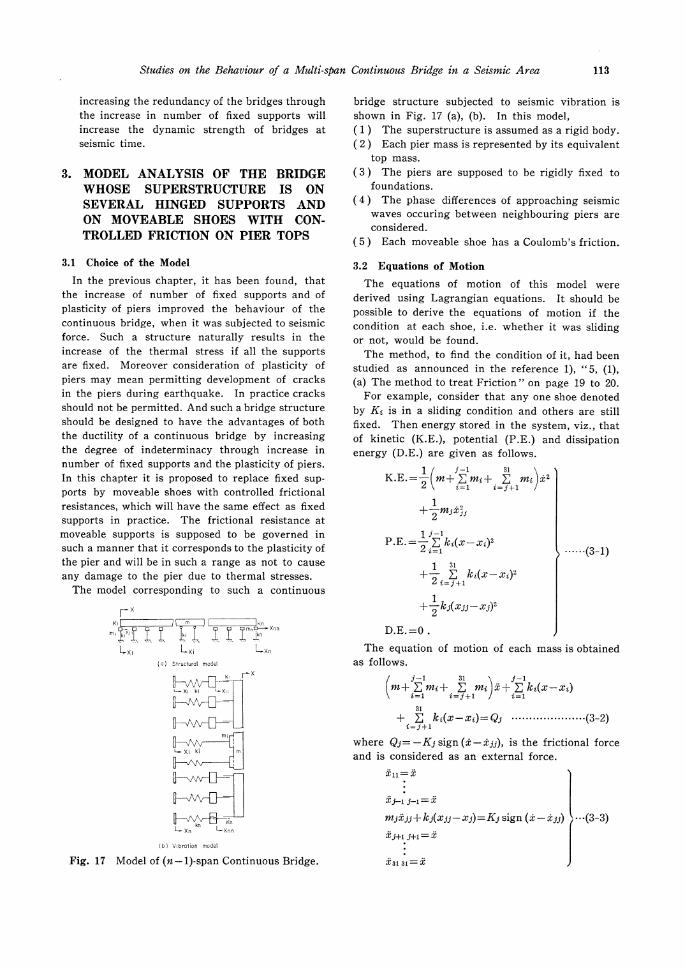
bridge structure subjected to seismic vibration is shown in Fig. 17 (a), (b). In this model,
(1) The superstructure is assumed as a rigid body. (2) Each pier mass is represented by its equivalent
top mass.
(3) The piers are supposed to be rigidly fixed to foundations.
(4) The phase differences of approaching seismic waves occuring between neighbouring piers are
considered.
(5) Each moveable shoe has a Coulomb's friction.
3.2 Equations of Motion
The equations of motion of this model were derived using Lagrangian equations. It should be
possible to derive the equations of motion if the condition at each shoe, i.e. whether it was sliding or not, would be found.
The method, to find the condition of it, had been studied as announced in the reference 1), " 5, (1),
(a) The method to treat Friction " on page 19 to 20. For example, consider that any one shoe denoted
by Ki is in a sliding condition and others are still fixed. Then energy stored in the system, viz., that of kinetic (K.E.), potential (P.E.) and dissipation energy (D.E.) are given as follows.
(3-1)
The equation of motion of each mass is obtained
as follows.
(3-2)
where Qj = -Kj sign (x - x jj), is the frictional force and is considered as an external force.
(3-3)
Fig. 17 Model of (n-1)-span Continuous Bridge.
114 S. MATSUNO, B. S. BASAVARAJAIAH, K. UGAI and Y. MOMIYAMA
where xjj is the displacement of the jth mass.
3.3 Programme for Computation
The programme was prepared in Fortran IV and the computations were executed by HITAC-8350 computer. The major portion of the
programme is almost similar to that of previous model as in chapter 2. But in this model, as
pier mass is included, the following changes are noticed in the programme when compared to the
previous one.
(1) Inclusion of the parameters representing the behaviour of pier tops.
(2) Inclusion of the inertia force due to pier mass.
3.4 Input and Output
The input data consisted of time interval (Ģt),
the time duration (T), spring constant of each pier
(k), number of fixed supports (N), amplitude (zi),
angular velocity (ƒÖi), phase difference (ƒÓ) of seismic
waves, pier mass (mi), superstructure mass (m), and
frictional resistance (Ki).
Since the pier masses were considered seperately
in this model, the mass of the superstructure was
smaller than that in the previous chapter. Fric-
tional resistance was also different from that in the
previous case, since the real frictional resistance
was employed in this chapter instead of an assumed
value of friction, which symbolized the yield
strength of pier. A set of suitable combination
of standard values of these data were selected as
indicated in Table 3, and the calculations were
made.
Output included the calculations made in chapter
2 and also the responses of pier tops.
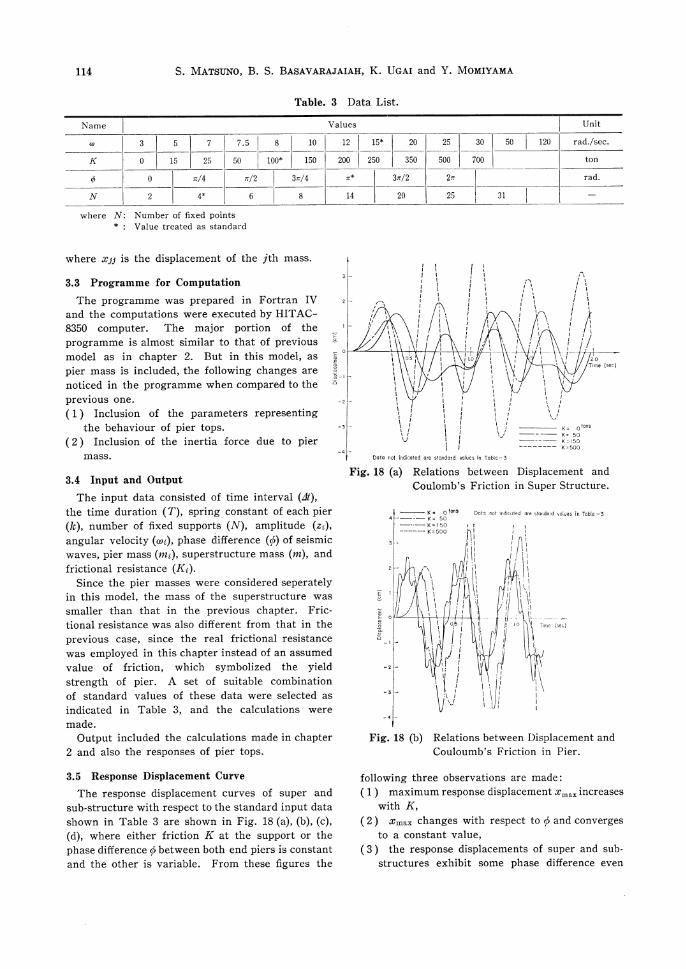
3.5 Response Displacement Curve
The response displacement curves of super and
sub-structure with respect to the standard input data
shown in Table 3 are shown in Fig. 18 (a), (b), (c),
(d), where either friction K at the support or the
phase difference ƒÓ between both end piers is constant
and the other is variable. From these figures the
following three observations are made :
(1) maximum response displacement xmax increases with K,
(2) xmax changes with respect to 0 and converges to a constant value,
(3) the response displacements of super and sub-structures exhibit some phase difference even
Table. 3 Data List.
Fig. 18 (a) Relations between Displacement and Coulomb's Friction in Super Structure.
Fig. 18 (b) Relations between Displacement and Couloumb's Friction in Pier.

Studies on the Behaviour of a Multi-span Continuous Bridge in a Seismic Area 115
though there was no phase difference of input
waves.
The first two observations are apparently repre-
sented by Fig. 19 (a), (b), where the relationships
beween xmax, K, and ƒÓ, in the case of standard
data, are shown.
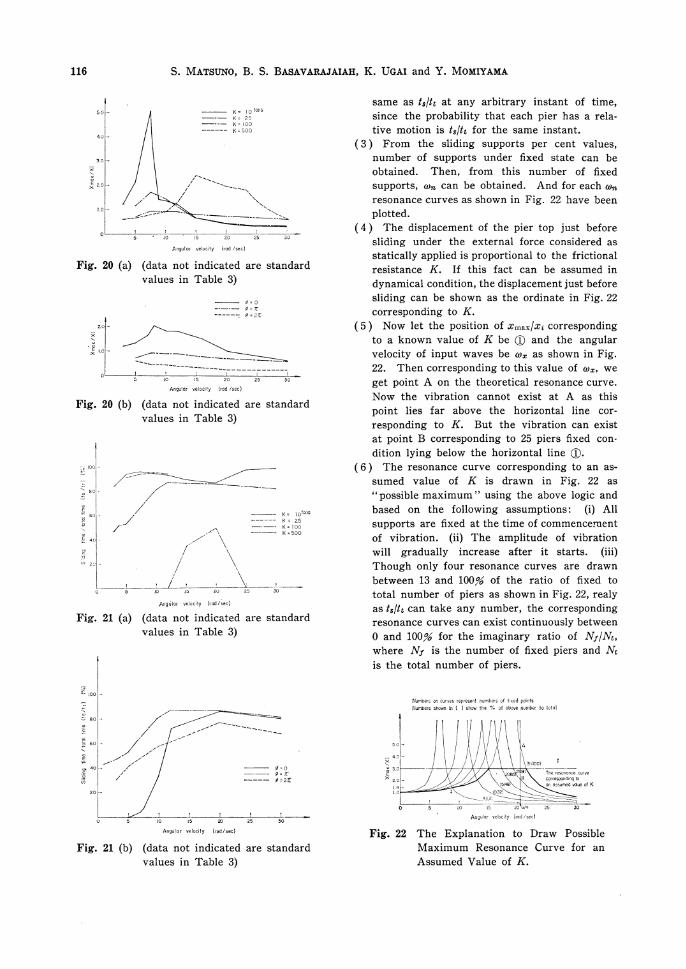
3.6 Resonance Curves
The ratio of xmax to xi is plotted against w in
Fig. 20 (a), (b), where xi is the semi-amplitude of
input waves. These curves may be designated as
resonance curves. In these figures such resonance
curves are plotted for different K-values and ƒÓ-
values. The curves do not exhibit remarkable
resonance but are flat. This phenomenon can be
explained as follows:
( 1 ) When the bridge vibrates, the ratio of ts,
which is the time interval of sliding condition
of any pier, to tt, which is the total time of
vibration will be existing for each pier, and it
shows almost same percentage each other. It
can be plotted vs. w for each K as shown in Fig. 21 (a), (b).
( 2 ) From this (1), it can be infered that the ratio of piers having relative motion with respect to
the total number of moveable piers must be the
Fig. 18 (c) Rleations between Displacement and Phase Difference in Superstructure.
Fig. 18 (d) Relations between Displacement and Phase Difference in Pier.
Fig. 19 (a) (data not indicated are standard values in Table 3)
Fig. 19 (b) (data not indicated are standard values in Table 3)
116 S. MATSUNO, B. S. BASAVARAJAIAH, K. UGAI and Y. MOMIYAMA
same as ts/tt at any arbitrary instant of time, since the probability that each pier has a rela-
tive motion is ts/tt for the same instant.
( 3 ) From the sliding supports per cent values, number of supports under fixed state can be
obtained. Then, from this number of fixed supports, con can be obtained. And for each con
resonance curves as shown in Fig. 22 have been
plotted. ( 4 ) The displacement of the pier top just before
sliding under the external force considered as statically applied is proportional to the frictional
resistance K. If this fact can be assumed in dynamical condition, the displacement just before
sliding can be shown as the ordinate in Fig. 22 corresponding to K.
( 5 ) Now let the position of xmax/xi corresponding to a known value of K be (1) and the angular
velocity of input waves be cox as shown in Fig. 22. Then corresponding to this value of cox, we
get point A on the theoretical resonance curve. Now the vibration cannot exist at A as this
point lies far above the horizontal line cor-responding to K. But the vibration can exist
at point B corresponding to 25 piers fixed con-dition lying below the horizontal line (1).
( 6 ) The resonance curve corresponding to an as-sumed value of K is drawn in Fig. 22 as " possible maximum " using the above logic and
based on the following assumptions: (i) All supports are fixed at the time of commencement
of vibration. (ii) The amplitude of vibration will gradually increase after it starts. (iii)
Though only four resonance curves are drawn between 13 and 100% of the ratio of fixed to
total number of piers as shown in Fig. 22, realy as ts/tt can take any number, the corresponding
resonance curves can exist continuously between 0 and 100% for the imaginary ratio of Nf/Nt,
where Arf is the number of fixed piers and Art is the total number of piers.
Fig. 20 (a) (data not indicated are standard values in Table 3)
Fig. 20 (b) (data not indicated are standard values in Table 3)
Fig. 21 (a) (data not indicated are standard values in Table 3)
Fig. 21 (b) (data not indicated are standard values in Table 3)
Fig. 22 The Explanation to Draw Possible
Maximum Resonance Curve for an
Assumed Value of K.
Studies on the Behaviour of a Multi-span Continuous Bridge in a Seismic Area 117
(iv) In case any point A corresponding to a given value of co on the 100% curve is above
the level of xmax/xi corresponding to a given K, the point A should move to a smaller per-
centage curve. Naturally the resonance curve is given by the 100% curve when the friction
of supports is sufficient to avoid sliding.
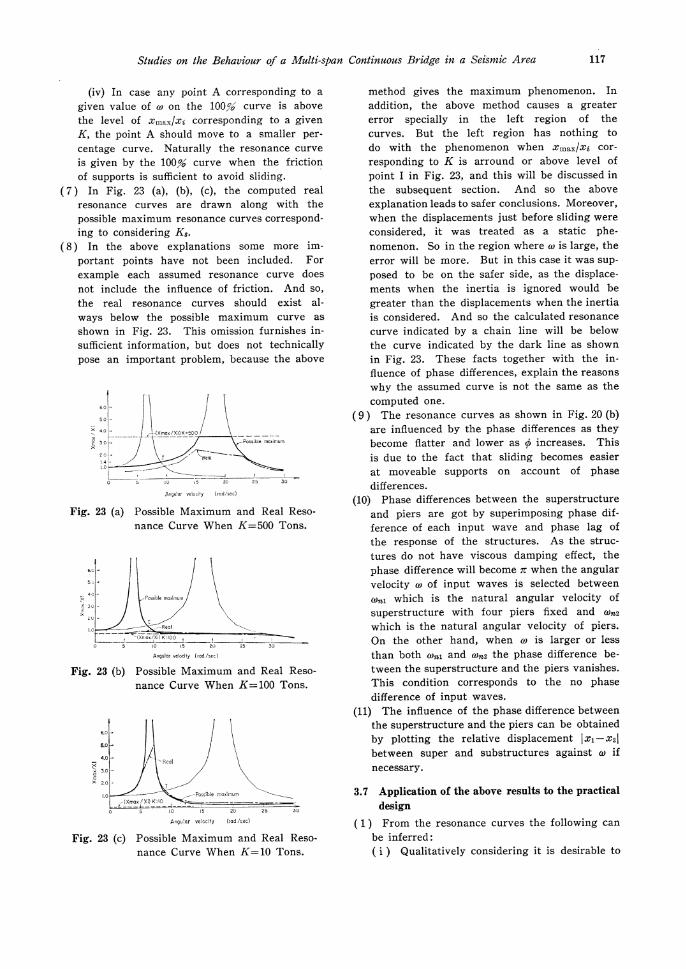
( 7 ) In Fig. 23 (a), (b), (c), the computed real resonance curves are drawn along with the
possible maximum resonance curves correspond-ing to considering K.
( 8 ) In the above explanations some more im-portant points have not been included. For
example each assumed resonance curve does not include the influence of friction. And so,
the real resonance curves should exist al-ways below the possible maximum curve as
shown in Fig. 23. This omission furnishes in-sufficient information, but does not technically
pose an important problem, because the above
method gives the maximum phenomenon. In
addition, the above method causes a greater
error specially in the left region of the
curves. But the left region has nothing to
do with the phenomenon when xmax/xi cor-
responding to K is arround or above level of
point I in Fig. 23, and this will be discussed in
the subsequent section. And so the above
explanation leads to safer conclusions. Moreover,
when the displacements just before sliding were
considered, it was treated as a static phe-
nomenon. So in the region where w is large, the
error will be more. But in this case it was sup-
posed to be on the safer side, as the displace-
ments when the inertia is ignored would be
greater than the displacements when the inertia
is considered. And so the calculated resonance
curve indicated by a chain line will be below
the curve indicated by the dark line as shown.
in Fig. 23. These facts together with the in-
fluence of phase differences, explain the reasons
why the assumed curve is not the same as the
computed one.
( 9 ) The resonance curves as shown in Fig. 20 (b)
are influenced by the phase differences as they
become flatter and lower as ƒÓ increases. This
is due to the fact that sliding becomes easier
at moveable supports on account of phase
differences.
(10) Phase differences between the superstructure
and piers are got by superimposing phase dif-
ference of each input wave and phase lag of
the response of the structures. As the struc-
tures do not have viscous damping effect, the
phase difference will become ƒÎ when the angular
velocity w of input waves is selected between
on1 which is the natural angular velocity of
superstructure with four piers fixed and (OW
which is the natural angular velocity of piers.
On the other hand, when w is larger or less
than both wn1 and wr2 the phase difference be-
tween the superstructure and the piers vanishes.
This condition corresponds to the no phase
difference of input waves.
(11) The influence of the phase difference between
the superstructure and the piers can be obtained
by plotting the relative displacement •bx1 —x2•b
between super and substructures against w if
necessary.
3.7 Application of the above results to the practical
design
( 1 ) From the resonance curves the following can
be inferred:
( i ) Qualitatively considering it is desirable to
Fig. 23 (a) Possible Maximum and Real Reso-nance Curve When K=500 Tons.
Fig. 23 (b) Possible Maximum and Real Reso-nance Curve When K=100 Tons.
Fig. 23 (c) Possible Maximum and Real Reso-nance Curve When K=10 Tons.

118 S.MATSUNO, B. S. BASAVARAJAIAH, K. UGAI and Y. MOMIYAMA
use the supports with small frictional re-
sistance in the case of large w and supports
with large frictional resistance in the case
of small w.
( ii ) When the real input waves have the wide
range of co, it is most desirable and safest
method to use the support with friction cor-
responding to the point I in Fig. 22. At this
point I, xmax= 1.4 •~ xi i.e., 2.8 cms and K can
be easily calculated by Hooke's law and is
equal to 200 t. As far as possible in practi-
cal design this value of K should be achieved.
(iii) As discussed before, the existance of phase
difference of input waves is a safety factor
for constant K. Hence the construction of
long bridges with many spans, which increase
φ is advantageous. But the influence ofƒÓ
beyond 2ƒÎ will not be appreciable as be seen
from Fig. 19 (b).
(2) As stated in chapter 2, there were two objects
in applying controlled friction at the supports.
One was to improve the resistance against
earthquake by incorporating the plastic condition
of piers into friction of supports by not allowing
the piers to attain the plastic state. Another
object was to decrease the influence of tempera-
ture changes specially at the end piers.
The temperature stress will be equal to seismic
stress at the known value of K corresponding
to I. At this stage, the ratio of seimic to
thermal allowable stress will be 1.3. It means
that the thermal stress will exceed allowable
stress by 30% in the pier section decided by
seismic stress calculation. This corresponds to
a safety factor of 1.15 with respect to thermal
stresses and 1.5 with respect to seismic stresses.
(3) The above descriptions about thermal stress
is true as long as the absolute maximum phe-
nomenon is concerned, and sometimes the re-
quirements for the design may demand it. But
in reality, as observed in Fig. 23, the real
resonance curves move downwards due to
friction. And, consequently, the point I which
is given by the intersection of these two curves
and K also would move down. In the calcu-
lation made in this chapter K was 200 tons.
But as shown in Fig. 23 (b), it proves the fact,
that the real resonance curves in the case of
100 tons (which is half the above value and
corresponding to the coefficient of friction ƒÊ
=0.33), which is drawn with thick line exist
below the 0% curve in its left part. Considering
from the fact, that it is possible to make the
value of K which is determined by the point I
smaller by 50%, it can be said that thermal
stress will not be serious in the design of moveable piers. In addition, the displacements of fixed and moveable piers will be nearly the same as seen from the Fig. 24 at the above value of K and the sizes of the fixed piers are unaffected by the thermal stress considering the distance to the extreme fixed end pier from the centre of the bridge (in this case it is assumed as 150 m), this will enable the piers to be made of the same size in design and construction.
( 4 ) From the above considerations, less number of fixed piers is better,but several fixed piers
are necessary for the superstructure to return to the initial position after the earthquake. In this chapter the bridge with four fixed piers is analysed, as it is generally recommended that 10% of the piers around the centre of the bridge should be fixed with the superstructure.
( 5 ) The relative displacements of the super and substructures at moveable supports are very
important factors in the design of moveable support. But when the value of K as de-termined by the method suggested in this chapter is used, the maximum displacement of super and substructures will be the same for the normal co of input waves. (Ref. Fig. 24). When the input waves possess the value of co which is near the natural frequency of pier, the displacement of superstructure is small but those of moveable
piers become very large. But for the piers (Height 6 m) used in this chapter the w is about 120 rad. per sec., which is not the value of normal earthquake. Hence in designing the supports on
pier tops, it is enough if twice the magnitude of maximum displacement of superstructure is
provided for the width of supports on either
Fig. 24 The Relationship between Maximum
Displacement of Superstructure and a
Pier in a Same Vibration.

Studies on the Behaviour of a Multi-span Continuous Bridge in a Seismic Area 119
side of centre, where the displacement corre-
sponds to the point I in Fig. 23, i.e. 1.4 times
amplitude of input seismic waves.
3.8 Conclusions
The following conclusions could be obtained
through the studies of this chapter, under the as-
sumptions mentioned in chapter 1.
( 1 ) In the continuous bridge with many spans
which was analysed in this chapter the number
of the sliding supports among the moveable
supports depends upon various parameters such
as ƒÖ, ƒÓ, K, m etc . . .
( 2 ) The resonance curves do not show remarkable
resonance points and are low and flat.
( 3 ) The displacement of superstructure at the
steady state of vibration can be generally reduced
by using the moveable supports with small
friction in the case of short period earthquake
and with large friction in the case of long period
earthquake.
( 4 ) Theoretically considering, there can exist the
most suitable friction of the support which can
accommodate any seismic wave with any period.
( 5 ) This value of friction could be obtained as
follows. First obtain the displacement corre-
sponding to the intersection of the two resonance
curves of the superstructure with all the piers
fixed and of the superstructure with minimum
number of fixed piers. Then the force which
produces this displacement in the case of a
single pier will give the most suitable friction K.
( 6 ) When the supports with this friction K are
used, the maximum displacement of the super-
structure will be always less than the absolute
maximum displacement corresponding to K.
(7) In this case the design of the size of moveable
piers were decided by thermal stresses.
( 8 ) The value of K can be reduced by 30% in
practical design without missing the effect of it,
if the technical considerations demand. Selecting
a suitable distance for the extreme fixed end
pier from the centre, the size of all piers can
be made the same for the seismic stresses, as
the behaviour of both fixed and moveable piers
at seismic time will be the same.
( 9 ) Also the width of the moveable support was
decided by taking 4 times the maximum dis-
placement of the superstructure, i.e. 5.6 times
the semi amplitude of seismic waves.
(10) When there are phase differences of input
waves the moveable supports enable easy sliding
for the same friction as that of no phase dif-
ferences. And consequently as the phase dif-ferences increase, it makes the resonance curve
flatter and lowers it. Hence the existance of
phase difference does not cause considerable difficulty in the design.
(11) Less number of fixed piers is better. But several fixed piers are necessary for the superstructure
to recover the initial position after the earth-
quake. It is generally recommended that 10% of piers, which are located near the centre of the
bridge should be fixed with the superstructure.
(12) As stated above, it is confirmed that the moveable supports with controlled friction im-
prove the behaviour of the superstructure at seismic time and can accommodate the thermal
expansion without causing excessive stress.
4. ACKNOWLEDGEMENT
The authors wish to express their sincere thanks
to Mr. Shimizu, Director, Design Department of
Kawada Industries Co. for having extended the
facility to work on their IBM 360 Computer. They
also wish to record their thanks to Dr. Koichi
Yoneyama, Asst. Professor of Civil Engineering,
Niigata University, to Mr. Makita, to Mr. Ito all
postgraduates in Civil Engg. of Niigata University
and to Mr. Isono and to Mr. Matsuda both graduate
students of the Civil Engg. Dept. of Niigata Uni-
versity for all the help they rendered during the
above research work.
REFERENCES
1) Matsuno, S.: Influence of Damping Mechanisms of Bridge Structures on Dynamic Responses, Proc. of JSCE, November, 1970 (In Japanese).
2) Matsuno, S.: Studies on the Vibrations of Bridges When They are Subjected to Seismic
Waves at Each Pier with Phase Differences, Proc. of JSCE, April 1971 (In Japanese).
3) Japan Roads Association: Specifications for the Design of the Substructures of the Highway
Bridges (In Japanese). 4) Seto, W. W.: Theory and Problems of Me-
chanical Vibrations. 5) Biggs, J. M.: Introduction to Structural Dy-
namics, McGraw Hill. 6) Hudson, D. E.: Dynamic Tests of Buildings
and Special Structures, ASME. 7) Hudson, D. E.: Experimental Technics in Shock
and Vibration, ASME.
(Received April 12, 1976)