Studies on Plant Density and Integrated Nutrient ... Volume 5, issue 2/IJPAB... · 1Ph.D. Scholar,...
13
Copyright © April, 2017; IJPAB 354 Studies on Plant Density and Integrated Nutrient Management for Growth, Yield, Quality and Shelf Life of Guava cv. Lalit in Rainy Season R. Kiran Kumar 1* , S. Jaganath 2 , T.R. Guruprasad 3 , C. K. Narayana 4 , A. N. Balakrishna 5 , R. Venugopalan 6 and S. Anilkumar 7 1 Ph.D. Scholar, 2 Professor of Fruit Science, COH, UHS Campus, Bengaluru-560065, 3 ADRE, RHREC, UHS Campus, Bengaluru, 4 Principle Scientist, Division of Post Harvest Technology, IIHR, Hessaraghatta, Bengaluru, 5 Professor of Microbiology, UAS, GKVK, Bengaluru, 6 Division of Economics and Statistics, Principle Scientist, IIHR, Hessaraghatta, Bengaluru, 7 Assistant Professor of Soil Science, RHREC, UHS Campus, Bengaluru-560065 *Corresponding Author E-mail: [email protected] Received: 27.02.2017 | Revised: 10.03.2017 | Accepted: 12.03.2017 INTRODUCTION Guava (Psidium guajava L.) is a popular fruit crop in India. It can be grown in tropical and subtropical climate fruits are highly nutritious, which were rich in vitamin 'C' 1 . The integrated approach of organic, inorganic and bio- fertilizers were used to know the effect on vegetative growth and its impact on yield parameters and quality parameters of cv. Lalit in rainy season. Available online at www.ijpab.com DOI: http://dx.doi.org/10.18782/2320-7051.2640 ISSN: 2320 – 7051 Int. J. Pure App. Biosci. 5 (2): 354-366 (2017) ABSTRACT The Field investigations were carried out know the effect of organic, inorganic and bio-fertilizers on growth and yield of guava (Psidium guajava L.) cv. Lalit" was carried out at Regional Horticulture Research Station, College of Horticulture, Bengaluru. The vegetative growth and yield was significantly influenced at different spacing levels (2 x 2, 3 x 3, 6 x 3 and 6 x 6 m). In rainy season the maximum plant height (2.81 m), plant spread (N-S direction) (2.85 m), plant spread (E-W direction) (2.69 m) and canopy volume (11.76 m 3 ), number of fruits (171.74), fruit yield per tree (12.63 kg), TSS (15.14°B), minimum titratable acidity (0.44 %), ascorbic acid (169.24 mg 100 -1 g pulp) was observed in 6 x 6 m spacing. Whereas, the fruit yield (16.74 t ha -1 ) was maximum in 2 x 2 m spacing, the minimum physiological loss of weight (8.51 %), mean shelf life of life (6.83 days) were observed in 2 x 2 m spacing whereas, the integrated nutrient management significantly influenced vegetative growth characteristics after 8 month of growth stage the maximum plant height (2.81 m), plant spread (N-S & E-W) 2.74 & 2.67 m respectively, and canopy volume (11.71 m 3 ), number of fruits (236.06), fruit yield per tree (15.71 kg), fruit yield (15.08 t ha -1 ), TSS (15.77°B), titratable acidity (0.34 %), ascorbic acid (184.52 mg 100 -1 g pulp), physiological loss of weight (6.85 %), mean shelf life of life (7.17 days) was observed in (T 10 ) Azotobacter @ 20 g + PSB @ 20 g + vermicompost @ 10 kg + 50 % recommended NPK. Key words: organic, inorganic and bio-fertilizers, guava, vegetative growth, yield, quality attributes. Research Article Cite this article: Kumar, R.K., Jaganath, S., Guruprasad, T.R., Narayana, C.K., Balakrishna, A.N., Venugopalan, R. and Anilkumar, S., Studies on Plant Density and Integrated Nutrient Management for Growth, Yield, Quality and Shelf Life of Guava cv. Lalit in Rainy Season, Int. J. Pure App. Biosci. 5(2): 354-366 (2017). doi: http://dx.doi.org/10.18782/2320-7051.2640
Transcript of Studies on Plant Density and Integrated Nutrient ... Volume 5, issue 2/IJPAB... · 1Ph.D. Scholar,...

Kumar et al Int. J. Pure App. Biosci. 5 (2): 354-366 (2017) ISSN: 2320 – 7051
Copyright © April, 2017; IJPAB 354
Studies on Plant Density and Integrated Nutrient Management for Growth,
Yield, Quality and Shelf Life of Guava cv. Lalit in Rainy Season
R. Kiran Kumar1*
, S. Jaganath2, T.R. Guruprasad
3, C. K. Narayana
4, A. N. Balakrishna
5,
R. Venugopalan6 and S. Anilkumar
7
1Ph.D. Scholar,
2Professor of Fruit Science, COH, UHS Campus, Bengaluru-560065,
3ADRE, RHREC, UHS Campus, Bengaluru,
4Principle Scientist, Division of Post Harvest Technology, IIHR,
Hessaraghatta, Bengaluru, 5Professor of Microbiology, UAS, GKVK, Bengaluru,
6Division of Economics and Statistics, Principle Scientist, IIHR, Hessaraghatta, Bengaluru,
7Assistant Professor of Soil Science, RHREC, UHS Campus, Bengaluru-560065
*Corresponding Author E-mail: [email protected]
Received: 27.02.2017 | Revised: 10.03.2017 | Accepted: 12.03.2017
INTRODUCTION
Guava (Psidium guajava L.) is a popular fruit
crop in India. It can be grown in tropical and
subtropical climate fruits are highly nutritious,
which were rich in vitamin 'C'1. The integrated
approach of organic, inorganic and bio-
fertilizers were used to know the effect on
vegetative growth and its impact on yield
parameters and quality parameters of cv. Lalit
in rainy season.
Available online at www.ijpab.com
DOI: http://dx.doi.org/10.18782/2320-7051.2640
ISSN: 2320 – 7051
Int. J. Pure App. Biosci. 5 (2): 354-366 (2017)
ABSTRACT
The Field investigations were carried out know the effect of organic, inorganic and bio-fertilizers
on growth and yield of guava (Psidium guajava L.) cv. Lalit" was carried out at Regional
Horticulture Research Station, College of Horticulture, Bengaluru. The vegetative growth and
yield was significantly influenced at different spacing levels (2 x 2, 3 x 3, 6 x 3 and 6 x 6 m). In
rainy season the maximum plant height (2.81 m), plant spread (N-S direction) (2.85 m), plant
spread (E-W direction) (2.69 m) and canopy volume (11.76 m3), number of fruits (171.74), fruit
yield per tree (12.63 kg), TSS (15.14°B), minimum titratable acidity (0.44 %), ascorbic acid
(169.24 mg 100-1
g pulp) was observed in 6 x 6 m spacing. Whereas, the fruit yield (16.74 t ha-1
)
was maximum in 2 x 2 m spacing, the minimum physiological loss of weight (8.51 %), mean shelf
life of life (6.83 days) were observed in 2 x 2 m spacing whereas, the integrated nutrient
management significantly influenced vegetative growth characteristics after 8 month of growth
stage the maximum plant height (2.81 m), plant spread (N-S & E-W) 2.74 & 2.67 m respectively,
and canopy volume (11.71 m3), number of fruits (236.06), fruit yield per tree (15.71 kg), fruit
yield (15.08 t ha-1
), TSS (15.77°B), titratable acidity (0.34 %), ascorbic acid (184.52 mg 100-1
g
pulp), physiological loss of weight (6.85 %), mean shelf life of life (7.17 days) was observed in
(T10) Azotobacter @ 20 g + PSB @ 20 g + vermicompost @ 10 kg + 50 % recommended NPK.
Key words: organic, inorganic and bio-fertilizers, guava, vegetative growth, yield, quality
attributes.
Research Article
Cite this article: Kumar, R.K., Jaganath, S., Guruprasad, T.R., Narayana, C.K., Balakrishna, A.N.,
Venugopalan, R. and Anilkumar, S., Studies on Plant Density and Integrated Nutrient Management for
Growth, Yield, Quality and Shelf Life of Guava cv. Lalit in Rainy Season, Int. J. Pure App. Biosci. 5(2):
354-366 (2017). doi: http://dx.doi.org/10.18782/2320-7051.2640

Kumar et al Int. J. Pure App. Biosci. 5 (2): 354-366 (2017) ISSN: 2320 – 7051
Copyright © April, 2017; IJPAB 355
Plant density and nutritional management
plays an important role in obtaining higher
yield and quality fruits. The use of organic
manures, bio-fertilizer and chemical fertilizer
play a crucial role in getting higher net returns.
However, systematic studies on integrated
nutrient management in high density planting
and its nutrient management are very meager
in guava crop. Hence, current investigation
was undertaken to study the effect of different
plant densities on fruit yield and integrated
nutrient management (INM). Continuous
application of huge amount of chemical
fertilizers hampers the fruit quality, soil health,
life span of crop and causes environmental
pollution. The integrated nutrient management
paves a way to overcome these problems. The
nutrients required by the plant can be supplied
from different sources, through bio-fertilizers,
organic manures and inorganic fertilizers; the
integrated nutrient management (INM) is the
best approach for sustainable crop production.
MATERIALS AND METHODS
The present research was carried out at the
Regional Horticultural Research Experimental
Centre (RHREC), UHS, Campus, Bengaluru
during the year 2012-13, research was
conducted on three year old guava trees.
Experiment was conducted on four different
plant densities included, (2 x 2 m, 3 x 3 m, 6 x
3 m and 6 x 6 m). The treatment aggregates of
T1: FYM (10 kg) + recommended NPK
(50:25:75 g plant-1
), T2: Vermicompost (10 kg)
+ recommended NPK, T3: FYM (5 kg) +
vermicompost (5 kg) + recommended NPK,
T4: FYM (10 kg) + vermicompost (10 kg) +
50% recommended NPK, T5: Azotobacter (20
g) + FYM (10 kg) + 50% recommended NPK,
T6: Azotobacter (20 g) + vermicompost (10
kg) + 50% recommended NPK, T7: PSB (20 g)
+ FYM (10 kg) + 50% recommended NPK,
T8: PSB (20 g) + vermicompost (10 kg) + 50%
recommended NPK, T9: Azotobacter (20 g) +
PSB (20 g) + FYM (10 kg) + 50%
recommended NPK, T10: Azotobacter (20 g) +
PSB (20 g) + vermicompost (10 kg) + 50%
recommended NPK. The bio-fertilizers were
procured from Department of Microbiology,
UAS, Bengaluru. The experiment was
statistically carried out by split plot design
with ten treatments replicated thrice with two
trees per replication.
The observations recorded for vegetative
growth, plant height (m) and plant spread (N-S
& E-W), Canopy volume2 was calculated by
using formula,
where, π – 2.14, h- Height of tree (m),
number of fruits, fruit yield per tree, fruit yield
per hectare
Chemical analysis: The guava fruits were
analysed for Total Soluble Solids (TSS),
titratable acidity, ascorbic acid.
Using “Digital-hand refractometer (0-
53°Brix)” the total soluble solids of the guava
fruits were recorded and expressed in degree
Brix (ºB).
Titratable acidity was determined by
titration method3. Ready to serve juice was
homogenized in a blender and 10 ml of extract
guava juice was mixed with distilled water and
volume was made up to 50 ml. A known
volume of the filtrate (10 ml) was titrated
against 0.01N NaOH using phenolphthalein as
indicator. Acidity was calculated as percentage
of citric acid equivalents using citric acid
standard curve.

Kumar et al Int. J. Pure App. Biosci. 5 (2): 354-366 (2017) ISSN: 2320 – 7051
Copyright © April, 2017; IJPAB 356
Vitamin C content was determined by 2, 6-
Dichlorophenol indophenol (DCPIP) method4.
Ten grams of extract guava juice was mixed
thoroughly with 4% oxalic acid solution,
squeezed through a muslin cloth and volume
was made up to 50 ml. Vitamin C content
present in the solution was estimated by
titrating a known quantity of the extract
against DCPIP. Vitamin C content was
calculated as mg of ascorbic acid equivalents
per 100 g fresh weight using a standard curve
of L-Ascorbic acid.
Shelf life studies: The guava fruits were
studied for physiological loss in weight and
mean shelf life during storage.
Physiological loss in weight of fruits
was done by taking fruit weight during storage
at regular intervals with the help of an
electronic balance. It was calculated by using
the following formula and data were expressed
in percentage.
Harvested fruits of each treatment were stored
at room temperature at 27 + or - 5 °C to study
the storage life of the fruits. The data were
statistically analyzed by adopting standard
procedures and interpreted using analysis of
variance.
RESULTS AND DISCUSSION
During rainy season crop (2013), plant spacing
S4 (6 x 6 m) resulted in highest plant height of
2.36 m and 2.81 m at initial and eighth month
growth stages respectively. Also, the least
plant height of 1.71 m and 2.04 m was
observed in spacing 2 x 2 m (S1) at the same
growth stages. Whereas, the INM treatments
revealed significant differences among the
treatments with T10: [Azotobacter (20 g) + PSB
(20 g) + vermicompost (10 kg) + 50%
recommended NPK] resulting in highest plant
height of 2.36 m and 2.97 m at initial and
eighth month growth stages respectively
followed by INM treatment T9: [Azotobacter
(20 g) + PSB (20 g) + FYM (10 kg) + 50%
recommended NPK] with plants exhibiting
plant heights 2.25 m and 2.68 m at the same
growth stages. The plant spacing S4 (6 x 6 m)
resulted in highest plant spread (N-S) of 2.40
m and 2.85 m at initial and eighth month
growth stages respectively. Also, the least
spread (N-S) of 1.56 m and 1.86 m was
observed in spacing 2 x 2 m (S1) at the same
growth stages. Whereas, the INM treatments
revealed significant differences among the
treatments with T10: [Azotobacter (20 g) + PSB
(20 g) + vermicompost (10 kg) + 50%
recommended NPK] resulting in highest plant
spread (N-S) of 2.30 m and 2.74 m at initial
and eighth month growth stages respectively
followed by INM treatment T9: [Azotobacter
(20 g) + PSB (20 g) + FYM (10 kg) + 50%
recommended NPK] with plants exhibiting
plant spread (N-S) of 2.23 m and 2.65 m at the
same growth stages (Table 1).
The highest plant spread (E-W) S4 (6 x
6 m) of 2.26 m and 2.69 m at initial and eighth
month growth stages respectively. Also, the
least plant spread (E-W) of 1.56 m and 1.86 m
was observed in spacing 2 x 2 m (S1) at the
same growth stages. Whereas, the INM
treatments revealed significant differences

Kumar et al Int. J. Pure App. Biosci. 5 (2): 354-366 (2017) ISSN: 2320 – 7051
Copyright © April, 2017; IJPAB 357
among the treatments with T10: [Azotobacter
(20 g) + PSB (20 g) + vermicompost (10 kg) +
50% recommended NPK] resulting in highest
plant spread (E-W) of 2.24 m and 2.67 m at
initial and eighth month growth stages
respectively followed by INM treatment T9:
[Azotobacter (20 g) + PSB (20 g) + FYM (10
kg) + 50% recommended NPK] with plants
exhibiting plant spread (E-W) of 2.17 m and
2.59 m at the same growth stages. The plant
spacing S4 (6 x 6 m) resulted in highest canopy
volume of 6.96 m3
and 11.76 m3 at initial and
eighth month growth stages respectively, the
least canopy volume of 2.28 m3 and 3.85 m
3
was observed in spacing 2 x 2 m (S1) at the
same growth stages. Whereas, the INM
treatments revealed significant differences
among the treatments with T10: [Azotobacter
(20 g) + PSB (20 g) + vermicompost (10 kg) +
50% recommended NPK] resulting in highest
canopy volume of 6.93 m3
and 11.71 m3
at
initial and eighth month growth stages
respectively followed by INM treatment T9:
[Azotobacter (20 g) + PSB (20 g) + FYM (10
kg) + 50% recommended NPK] with plants
exhibiting canopy volume of 6.19 m3
and
10.45 m3 at the same growth stages (Table 2).
The maximum number of fruits
(171.74) was in rainy season under wider
spaced (6 x 6 m) plots, application of
organic, inorganic and bio-fertilizers, the
number of fruits was maximum (236.06) in the
treatment T10 (Azotobacter @ 20 g + PSB @
20 g + vermicompost @ 10 kg + 50 %
recommended NPK) and the maximum fruit
yield per tree and the higher fruit yield per
tree was recorded under (6 x 6 m) spacing with
the yield about (12.63 kg tree-1
). The
adaptation of integrated nutrient management
gives the maximum fruit yield (15.71 kg tree-1
)
in the treatment (T10) Azotobacter @ 20 g +
PSB @ 20 g + vermicompost @ 10 kg + 50 %
recommended NPK (Table 4). The fruit yield
per hectare was recorded maximum in 2 x 2 m
(16.74 t ha-1
). The integrated nutrient
management had significantly influenced on
different source of organic and inorganic
sources of nutrients. The application of
Azotobacter @ 20 g + PSB @ 20 g +
vermicompost @ 10 kg + 50 % recommended
NPK (T10) results maximum fruit yield (15.08
t ha-1
), followed by the combination of
Azotobacter @ 20 g + PSB @ 20 g + FYM @
10 kg + 50 % recommended NPK (T9) (12.55 t
ha-1
) (Table 3).
The total soluble solids showed
significant impact by spacing and integrated
nutrient management, it vary at different
densities 2 x 2 m, 3 x 3 m, 6 x 3 m and 6 x 6 m
(14.77, 14.93, 14.97, 15.140Brix respectively).
The application of Azotobacter @ 20 g + PSB
@ 20 g + vermicompost @ 10 kg + 50 %
recommended NPK (T10) results higher total
soluble solids (15.77 0Brix), followed by the
combination of Azotobacter @ 20 g + PSB @
20 g + FYM @ 10 kg + 50 % recommended
NPK (T9) (15.44 0Brix). The titratable acidity
of guava fruits showed significant prominence
in spacing and integrated nutrient management
at 6 x 3 m and 6 x 6 m recorded minimum
acidity of 0.44 % respectively. Application of
Azotobacter @ 20 g + PSB @ 20 g +
vermicompost @ 10 kg + 50 % recommended
NPK (T10) were significantly influenced by
organic and inorganic sources of nutrients,
results in least titratable acidity (0.34 %) and
the highest titratable acidity (0.62 %) was
observed in (T1). The ascorbic acid content of
guava was influenced by integrated nutrient
management and different spacing. At the
different spacing 2 x 2 m, 3 x 3 m, 6 x 3 m & 6
x 6 m (162.75, 167.63, 167.67 & 169.24 mg
100-1
g pulp respectively) was observed. The
application of Azotobacter @ 20 g + PSB @
20 g + vermicompost @ 10 kg + 50 %
recommended NPK (T10) results higher

Kumar et al Int. J. Pure App. Biosci. 5 (2): 354-366 (2017) ISSN: 2320 – 7051
Copyright © April, 2017; IJPAB 358
amount of ascorbic acid content (184.52 mg
100-1
g pulp), the lowest ascorbic acid content
(152.80 mg 100-1
g pulp) observed in (T1)
FYM @ 10 kg + recommended NPK 50:25:75
g per plant (Table 4).
The physiological weight loss of fruits
was minimum (8.51 %) in 2 x 2 m spacing and
the minimum physiological weight loss was
(6.85 %) observed in T10 (Azotobacter @ 20 g
+ PSB @ 20 g + vermicompost @ 10 kg + 50
% recommended NPK). The maximum (6.83)
shelf life of fruits were observed in 2 x 2 m
and the maximum shelf life of fruits (7.17)
observed in T10 (Azotobacter @ 20 g + PSB @
20 g + vermicompost @ 10 kg + 50 %
recommended NPK) (Table 5).
The results of present study reveals the
variations in plant height is may be due to the
regular pruning was undertaken as a common
practice for all high density treatment except
the wider spaced plot. Thus, more or less
similar dwarf plant height was observed in the
entire high density plot. On the other side, the
highest plant was observed in wider spacing
plot. S4 (6 x 6 m) plant growth was not
restricted by adopting pruning. These results
were confirmed by earlier reports of guava
high density studies reported that a spacing of
6 x 6 m resulted the maximum tree height as
compared to 6 x 4 and 6 x 5 m spacing5. The
high density was coupled with the regular
pruning however, some studies without
pruning were conducted by many researches6,
and the application of organic manures would
have helped in the plant metabolism through
the supply of such important micronutrients in
the early growth phase7. The better efficiency
of organic manures in combination with
inorganic fertilizers might be due to the fact
that organic manures would have provided the
micronutrients such as zinc, iron, copper,
manganese, etc., in an optimum level. The
maximum plant spread was noticed in 6 x 6 m
spacing. Improvement of crop growth was
influenced by Azotobacter, the microbial
inoculants, which bring about fixation of
atmospheric nitrogen through free-living N2
fixers in rhizosphere. The vegetative growth of
guava was improved by the application of
different fertilizers, organic manure and bio-
fertilizers8. The increasing of canopy volume
might be due to the better nutritional
environment, application of organic matter
improve the soil health by improving
physicochemical and biological activities of
soil9. The favorable effect of vermicompost on
vegetative growth might be due to the fact that
in addition to improving the various aspects of
soil systems (physico-chemical and
biological), it also alters various enzymatic
activities in plants such as peroxidase, catalase
etc, which promotes cell elongation, root and
shoot growth and carbohydrate metabolism10
.
The integrated use of organic manures and
bio-fertilizers along with chemical fertilizers
improves physico-chemical properties of soil
besides improving the efficiency of applied
chemical fertilizers which helps in the
betterment of yield and its other components.
The bio-fertilizers encouraged better growth
and accumulate optimum dry matter with
induction of growth hormones, which
stimulated cell division, cell elongation,
activate the photosynthesis process11
, The
similar findings were reported in
guava12,13,14&15
. Application of 50 percent
pruning in May produced the highest yield
(25.8 kg tree-1
) than unpruned (7.6 kg tree-1
) in
winter crop of guava cv. „Sardar‟16
. The results
of long-term fertilizer experiments suggested
that neither organic manures alone nor
exclusive application of chemical fertilizers
could achieve the yield sustainability at a high
order under modern farming where the nutrient
turnover in the soil plant system is quite
high17
. A significant increase in yield and yield

Kumar et al Int. J. Pure App. Biosci. 5 (2): 354-366 (2017) ISSN: 2320 – 7051
Copyright © April, 2017; IJPAB 359
parameters in guava with integrated nutrient
application may be due to vigorous vegetative
growth and increased chlorophyll content,
which together accelerated the photosynthetic
rate and thereby increased the supply of
carbohydrates to plants. The beneficial role of
supplemented organic manures and bio-
fertilizers in improving soil physical, chemical
and biological role is well known, which in
turn helps in better nutrient absorption by
plants and resulting higher yield18
.
The chain reactions in these
components and beneficial effect of worms
which is brought about by mucoses deposit of
epidermal cells an coelomic fluids of
earthworms, rich in plant growth substances
and through rapid mineralization and
transformation of plant nutrients in soil and
also through the exertion of plant promoting
substances, vitamins and amino acid content
produced by the microorganism of bio-
fertilizers might have possibly been a reason
of the improvement in quality of the fruit19
.
The significant increase in TSS (°B) and
ascorbic acid content was observed with the
application of organic manures, leading to
availability of nutrients in rhizosphere for a
longer period. So, the application of organic
manures along with chemical fertilizers
improves the soil fertility status i.e. during the
decomposition of organic manures organic
acids were released which will solubilizing
some of the insoluble nutrient compounds and
make it available to the plant, it also improves
soil aeration, water holding capacity of soil
improves aggregate formation, suppresses the
some of the pests and diseases20&21
. The
similar findings were agreed that the fruit
quality in guava was governed by the
application of nutrients by integrated approach
will significantly increase in TSS may be
attributed to increased absorption of nutrients
by the plants as a result of improved physico-
chemical and biological activities in the soil
and the combined role of these inputs upon the
better portioning of metabolites from source to
the sink22
. The physiological loss in weight of
guava under ambient conditions, recorded for
the two year which declares that the shelf life
was increased up to the ten days after harvest
which was recorded when the trees were
treated with 50 per cent nitrogen through
supplemented through FYM and rest of
nitrogen through urea augmented with
Azotobacter. This may be due to altered
physiology and biochemistry of the fruit as
influenced by both organic and inorganic
fertilizers that reduces respiration and
transpiration in fruits which resulted in low
cumulative physiological loss in weight and
increased shelf life11
. The shelf life of guava
fruits were increased to 12.50 days by the
application of 75:75:100 g NPK + Azotobacter
@ 5 ml tree-1
+ PSB @ 5 ml per tree23
. The
shelf-life of mango fruits was influenced
significantly due to integrated nutrient
management treatments T7 (500 : 250 : 250 g
NPK + 50 kg FYM + Azotobacter 250 g)
resulted in the maximum period of storage or
shelf-life (15.43 days) at room temperature.
On the other hand, the control treatment
having full dose of NPK only (T1) reduced the
storage or shelf-life of mango fruits, i.e. only
up to 9.94 days24
. The increase in shelf life of
fruits by increasing shelf life (12.00 days) by
the application of 150:187.5:187.5 g NPK + 5
kg vermicompost + rhizosphere bacteria
culture per plant will minimizing post harvest
losses will go a long way in increasing fruit
production indirectly in papaya cv. Surya25
.

Kumar et al Int. J. Pure App. Biosci. 5 (2): 354-366 (2017) ISSN: 2320 – 7051
Copyright © April, 2017; IJPAB 360
Table 1: Effect of high density guava and integrated nutrient management on plant height (m) and plant spread (N-S direction) (m)
Treatments
Plant height (m) Plant spread (N-S)
Initial days Mean
After 8 months Mean
Initial days Mean
After 8 months Mean
S1 S2 S3 S4 S1 S2 S3 S4 S1 S2 S3 S4 S1 S2 S3 S4
T1 1.49 1.56 2.14 2.22 1.85 1.78 1.85 2.55 2.65 2.21 1.26 1.86 1.96 2.10 1.79 1.50 2.21 2.33 2.50 2.14
T2 1.57 1.99 2.15 2.28 2.00 1.87 2.37 2.56 2.72 2.38 1.50 1.89 2.24 2.17 1.95 1.79 2.25 2.67 2.58 2.32
T3 1.64 2.04 2.22 2.29 2.05 1.95 2.43 2.65 2.73 2.44 1.51 1.91 2.25 2.28 1.99 1.80 2.28 2.68 2.72 2.37
T4 1.70 2.08 2.25 2.32 2.09 2.02 2.48 2.68 2.76 2.49 1.55 2.06 2.28 2.35 2.06 1.85 2.45 2.71 2.80 2.45
T5 1.73 2.22 2.29 2.32 2.14 2.06 2.64 2.72 2.76 2.55 1.57 2.12 2.29 2.39 2.09 1.87 2.53 2.73 2.85 2.49
T6 1.72 2.22 2.31 2.34 2.15 2.04 2.64 2.75 2.78 2.56 1.58 2.17 2.35 2.45 2.13 1.88 2.58 2.79 2.91 2.54
T7 1.75 2.25 2.30 2.37 2.17 2.08 2.68 2.74 2.82 2.58 1.61 2.18 2.36 2.47 2.16 1.92 2.59 2.81 2.95 2.57
T8 1.82 2.25 2.35 2.46 2.22 2.16 2.68 2.80 2.93 2.64 1.65 2.19 2.38 2.49 2.18 1.96 2.61 2.83 2.97 2.59
T9 1.82 2.26 2.44 2.49 2.25 2.16 2.69 2.91 2.97 2.68 1.68 2.20 2.47 2.55 2.23 2.00 2.62 2.95 3.03 2.65
T10 1.88 2.59 2.46 2.50 2.36 2.24 3.09 2.93 2.97 2.81 1.69 2.29 2.50 2.70 2.30 2.02 2.73 2.98 3.22 2.74
Mean 1.71 2.15 2.29 2.36
2.04 2.55 2.73 2.81
1.56 2.09 2.31 2.40
1.86 2.48 2.75 2.85
S.E.m± CD @ 5% S.E.m± CD @ 5% S.E.m± CD @ 5% S.E.m± CD @ 5%
S 0.02 0.08 0.03 0.09 0.03 0.10 0.03 0.12
T 0.01 0.02 0.01 0.02 0.01 0.02 0.01 0.02
S x T 0.03 0.07 0.03 0.08 0.03 0.09 0.04 0.10
T1: FYM (10 kg) + recommended NPK (50:25:75 g plant-1
) T6: Azotobacter (20 g) + vermicompost (10 kg) + 50% recommended NPK
T2: Vermicompost (10 kg) + recommended NPK T7: PSB (20 g) + FYM (10 kg) + 50% recommended NPK
T3: FYM (5 kg) + vermicompost (5 kg) + recommended NPK T8: PSB (20 g) + vermicompost (10 kg) + 50% recommended NPK
T4: FYM (10 kg) + vermicompost (10 kg) + 50% recommended NPK T9: Azotobacter (20 g) + PSB (20 g) + FYM (10 kg) + 50% recommended NPK
T5: Azotobacter (20 g) + FYM (10 kg) + 50% recommended NPK T10: Azotobacter (20 g) + PSB (20 g) + vermicompost (10 kg) + 50% recommended NPK
S1- 2 x 2 m S2- 3 x 3 m S3- 6 x 3 m S4- 6 x 6 m
Kumar et al Int. J. Pure App. Biosci. 5 (2): 354-366 (2017) ISSN: 2320 – 7051
360

Kumar et al Int. J. Pure App. Biosci. 5 (2): 354-366 (2017) ISSN: 2320 – 7051
Copyright © April, 2017; IJPAB 361
Table 2: Effect of high density guava and integrated nutrient management on plant spread (E-W direction) (m) and canopy volume (m3)
Treat
ments
Plant spread (E-W) Canopy volume (m3)
Initial days Mean
After 8 months Mean
Initial days Mean
After 8 months Mean
S1 S2 S3 S4 S1 S2 S3 S4 S1 S2 S3 S4 S1 S2 S3 S4
T1 1.35 1.87 2.51 2.05 1.94 1.61 2.22 2.99 2.44 2.31 1.38 2.91 5.78 5.16 3.81 2.33 4.92 9.77 8.71 6.43
T2 1.37 1.92 2.21 2.08 1.89 1.64 2.28 2.63 2.47 2.26 1.75 3.89 5.76 5.56 4.24 2.96 6.57 9.73 9.39 7.16
T3 1.54 1.95 2.39 2.18 2.01 1.84 2.32 2.84 2.60 2.40 2.07 4.11 6.47 6.17 4.70 3.50 6.94 10.92 10.42 7.95
T4 1.56 2.02 2.26 2.21 2.01 1.86 2.41 2.69 2.63 2.40 2.23 4.69 6.27 6.51 4.92 3.76 7.91 10.58 11.00 8.31
T5 1.57 2.09 2.08 2.26 2.00 1.87 2.49 2.47 2.69 2.38 2.30 5.33 5.90 6.78 5.08 3.89 8.99 9.97 11.46 8.58
T6 1.59 2.12 2.05 2.29 2.01 1.90 2.52 2.44 2.73 2.40 2.33 5.52 6.02 7.08 5.24 3.93 9.33 10.17 11.96 8.85
T7 1.60 2.19 2.18 2.30 2.07 1.90 2.61 2.60 2.74 2.46 2.43 5.81 6.41 7.29 5.49 4.11 9.81 10.83 12.31 9.27
T8 1.67 2.30 2.30 2.33 2.15 1.99 2.74 2.74 2.78 2.56 2.70 6.11 6.95 7.74 5.87 4.56 10.33 11.73 13.07 9.92
T9 1.67 2.35 2.29 2.39 2.17 1.99 2.80 2.73 2.84 2.59 2.75 6.33 7.48 8.19 6.19 4.65 10.68 12.64 13.83 10.45
T10 1.67 2.47 2.33 2.51 2.24 1.99 2.94 2.78 2.99 2.67 2.88 7.92 7.77 9.16 6.93 4.86 13.38 13.12 15.47 11.71
Mean 1.56 2.13 2.26 2.26
1.86 2.53 2.69 2.69
2.28 5.26 6.48 6.96
3.85 8.89 10.95 11.76
S.E.m ± CD @ 5% S.E.m ± CD @ 5% S.E.m ± CD @ 5% S.E.m ± CD @ 5%
S 0.025 0.09 0.03 0.10 0.43 1.48 0.72 2.50
T 0.006 0.02 0.01 0.02 0.10 0.29 0.18 0.50
S x T 0.028 0.08 0.03 0.09 0.47 1.33 0.80 2.25
T1: FYM (10 kg) + recommended NPK (50:25:75 g plant-1
) T6: Azotobacter (20 g) + vermicompost (10 kg) + 50% recommended NPK
T2: Vermicompost (10 kg) + recommended NPK T7: PSB (20 g) + FYM (10 kg) + 50% recommended NPK
T3: FYM (5 kg) + vermicompost (5 kg) + recommended NPK T8: PSB (20 g) + vermicompost (10 kg) + 50% recommended NPK
T4: FYM (10 kg) + vermicompost (10 kg) + 50% recommended NPK T9: Azotobacter (20 g) + PSB (20 g) + FYM (10 kg) + 50% recommended NPK
T5: Azotobacter (20 g) + FYM (10 kg) + 50% recommended NPK T10: Azotobacter (20 g) + PSB (20 g) + vermicompost (10 kg) + 50% recommended NPK
S1- 2 x 2 m S2- 3 x 3 m S3- 6 x 3 m S4- 6 x 6 m
Kumar et al Int. J. Pure App. Biosci. 5 (2): 354-366 (2017) ISSN: 2320 – 7051
361
Kumar et al Int. J. Pure App. Biosci. 5 (2): 354-366 (2017) ISSN: 2320 – 7051
Copyright © April, 2017; IJPAB 362
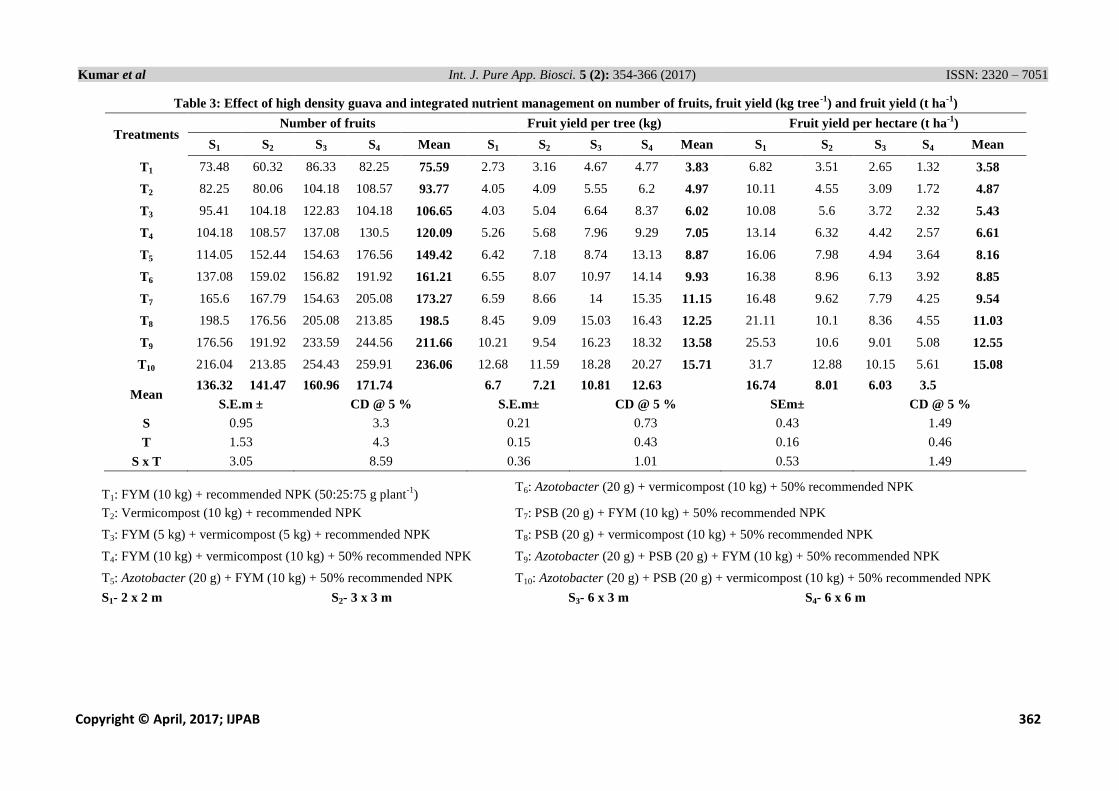
Table 3: Effect of high density guava and integrated nutrient management on number of fruits, fruit yield (kg tree-1
) and fruit yield (t ha-1
)
Treatments Number of fruits Fruit yield per tree (kg) Fruit yield per hectare (t ha
-1)
S1 S2 S3 S4 Mean S1 S2 S3 S4 Mean S1 S2 S3 S4 Mean
T1 73.48 60.32 86.33 82.25 75.59 2.73 3.16 4.67 4.77 3.83 6.82 3.51 2.65 1.32 3.58
T2 82.25 80.06 104.18 108.57 93.77 4.05 4.09 5.55 6.2 4.97 10.11 4.55 3.09 1.72 4.87
T3 95.41 104.18 122.83 104.18 106.65 4.03 5.04 6.64 8.37 6.02 10.08 5.6 3.72 2.32 5.43
T4 104.18 108.57 137.08 130.5 120.09 5.26 5.68 7.96 9.29 7.05 13.14 6.32 4.42 2.57 6.61
T5 114.05 152.44 154.63 176.56 149.42 6.42 7.18 8.74 13.13 8.87 16.06 7.98 4.94 3.64 8.16
T6 137.08 159.02 156.82 191.92 161.21 6.55 8.07 10.97 14.14 9.93 16.38 8.96 6.13 3.92 8.85
T7 165.6 167.79 154.63 205.08 173.27 6.59 8.66 14 15.35 11.15 16.48 9.62 7.79 4.25 9.54
T8 198.5 176.56 205.08 213.85 198.5 8.45 9.09 15.03 16.43 12.25 21.11 10.1 8.36 4.55 11.03
T9 176.56 191.92 233.59 244.56 211.66 10.21 9.54 16.23 18.32 13.58 25.53 10.6 9.01 5.08 12.55
T10 216.04 213.85 254.43 259.91 236.06 12.68 11.59 18.28 20.27 15.71 31.7 12.88 10.15 5.61 15.08
Mean 136.32 141.47 160.96 171.74
6.7 7.21 10.81 12.63
16.74 8.01 6.03 3.5
S.E.m ± CD @ 5 % S.E.m± CD @ 5 % SEm± CD @ 5 %
S 0.95 3.3 0.21 0.73 0.43 1.49
T 1.53 4.3 0.15 0.43 0.16 0.46
S x T 3.05 8.59 0.36 1.01 0.53 1.49
T1: FYM (10 kg) + recommended NPK (50:25:75 g plant-1
) T6: Azotobacter (20 g) + vermicompost (10 kg) + 50% recommended NPK
T2: Vermicompost (10 kg) + recommended NPK T7: PSB (20 g) + FYM (10 kg) + 50% recommended NPK
T3: FYM (5 kg) + vermicompost (5 kg) + recommended NPK T8: PSB (20 g) + vermicompost (10 kg) + 50% recommended NPK
T4: FYM (10 kg) + vermicompost (10 kg) + 50% recommended NPK T9: Azotobacter (20 g) + PSB (20 g) + FYM (10 kg) + 50% recommended NPK
T5: Azotobacter (20 g) + FYM (10 kg) + 50% recommended NPK T10: Azotobacter (20 g) + PSB (20 g) + vermicompost (10 kg) + 50% recommended NPK
S1- 2 x 2 m S2- 3 x 3 m S3- 6 x 3 m S4- 6 x 6 m
Kumar et al Int. J. Pure App. Biosci. 5 (2): 354-366 (2017) ISSN: 2320 – 7051
362

Kumar et al Int. J. Pure App. Biosci. 5 (2): 354-366 (2017) ISSN: 2320 – 7051
Copyright © April, 2017; IJPAB 363
Table 4: Effect of high density guava and integrated nutrient management on total soluble solids (%), titratable acidity (%) and ascorbic acid (mg 100-1
g pulp)
Treatments
Total soluble solids (°Brix) Titratable acidity (%) Ascorbic acid (mg 100-1
g pulp)
Mean S1 S2 S3 S4 Mean S1 S2 S3 S4 Mean S1 S2 S3 S4
T1 13.88 14.05 14.05 14.29 14.07 0.64 0.61 0.63 0.57 0.62 149.06 153.53 153.56 155.07 152.8
T2 14.09 13.75 14.29 14.49 14.15 0.56 0.56 0.53 0.54 0.55 151.64 156.19 156.22 157 155.26
T3 14.19 14.76 14.49 14.84 14.57 0.53 0.53 0.53 0.51 0.52 153.74 158.36 158.39 159.94 157.61
T4 14.39 14.69 14.69 14.9 14.67 0.48 0.48 0.49 0.46 0.48 160.4 165.21 165.24 166.86 164.43
T5 14.69 15.23 14.9 15.1 14.98 0.43 0.43 0.42 0.43 0.43 161.15 165.98 166.02 167.64 165.2
T6 14.9 15.27 15.1 15.3 15.14 0.4 0.39 0.39 0.41 0.4 163.18 168.07 168.1 169.75 167.27
T7 15.1 16.01 15.4 15.4 15.48 0.39 0.39 0.37 0.37 0.38 166.09 171.08 171.11 172.79 170.27
T8 15.3 14.79 15.5 15.5 15.28 0.37 0.38 0.35 0.37 0.37 168.8 173.87 173.9 175.61 173.05
T9 15.5 14.93 15.61 15.71 15.44 0.35 0.36 0.35 0.37 0.36 173.46 178.66 178.7 180.45 177.82
T10 15.71 15.77 15.71 15.91 15.77 0.34 0.35 0.32 0.32 0.34 180 185.4 185.44 187.26 184.52
Mean 14.77 14.93 14.97 15.14 0.45 0.45 0.44 0.44 162.75 167.63 167.67 169.24
S.E.m ± CD @ 5 % S.E.m ± CD @ 5 % S.E.m± CD @ 5 %
S 0.001 0.005 0.0001 0.0005 0.03 0.12
T 0.003 0.007 0.0011 0.003 0.06 0.17
S x T 0.005 0.015 0.0021 0.0058 0.12 0.33
T1: FYM (10 kg) + recommended NPK (50:25:75 g plant-1
) T6: Azotobacter (20 g) + vermicompost (10 kg) + 50% recommended NPK
T2: Vermicompost (10 kg) + recommended NPK T7: PSB (20 g) + FYM (10 kg) + 50% recommended NPK
T3: FYM (5 kg) + vermicompost (5 kg) + recommended NPK T8: PSB (20 g) + vermicompost (10 kg) + 50% recommended NPK
T4: FYM (10 kg) + vermicompost (10 kg) + 50% recommended NPK T9: Azotobacter (20 g) + PSB (20 g) + FYM (10 kg) + 50% recommended NPK
T5: Azotobacter (20 g) + FYM (10 kg) + 50% recommended NPK T10: Azotobacter (20 g) + PSB (20 g) + vermicompost (10 kg) + 50% recommended NPK
S1- 2 x 2 m S2- 3 x 3 m S3- 6 x 3 m S4- 6 x 6 m
Kumar et al Int. J. Pure App. Biosci. 5 (2): 354-366 (2017) ISSN: 2320 – 7051
363

Kumar et al Int. J. Pure App. Biosci. 5 (2): 354-366 (2017) ISSN: 2320 – 7051
Copyright © April, 2017; IJPAB 364
Table 5: Effect of high density guava and integrated nutrient management of guava fruits shelf life
studies in rainy season
Treat
ments
Physiological loss of weight (%) Mean
Mean shelf life of fruit (days) Mean
S1 S2 S3 S4 S1 S2 S3 S4
T1 9.54 10.68 9.62 10.8 10.16 6.53 6.49 6.51 6.53 6.52
T2 9.28 10.64 9.44 10.7 10.02 6.57 6.51 6.55 6.55 6.55
T3 8.99 10.63 9.44 10.58 9.91 6.58 6.53 6.57 6.59 6.57
T4 8.7 9.18 9.25 10.01 9.29 6.65 6.55 6.61 6.59 6.6
T5 8.52 9.04 8.97 9.26 8.95 6.75 6.67 6.65 6.61 6.67
T6 8.33 8.59 8.92 9.05 8.72 6.85 6.8 6.83 6.81 6.82
T7 8.04 7.85 8.75 8.94 8.4 6.95 6.85 6.87 6.85 6.88
T8 7.93 7.56 8.38 8.8 8.17 7.03 6.87 6.91 6.93 6.94
T9 7.87 6.97 8.22 7.64 7.67 7.15 7.03 7.01 7.03 7.06
T10 7.84 5.73 6.5 7.32 6.85 7.25 7.15 7.13 7.15 7.17
Mean 8.51 8.69 8.75 9.31 6.83 6.75 6.76 6.76
S.E.m ± CD @ 5 % S.E.m ± CD @ 5 %
S 0.07 0.24 0.003 0.01
T 0.12 0.34 0.009 0.025
S x T 0.24 0.67 0.017 0.048
T1: FYM (10 kg) + recommended NPK (50:25:75
g plant-1
)
T6: Azotobacter (20 g) + vermicompost (10 kg) + 50%
recommended NPK
T2: Vermicompost (10 kg) + recommended NPK T7: PSB (20 g) + FYM (10 kg) + 50% recommended NPK
T3: FYM (5 kg) + vermicompost (5 kg) +
recommended NPK
T8: PSB (20 g) + vermicompost (10 kg) + 50%
recommended NPK
T4: FYM (10 kg) + vermicompost (10 kg) + 50%
recommended NPK
T9: Azotobacter (20 g) + PSB (20 g) + FYM (10 kg) +
50% recommended NPK
T5: Azotobacter (20 g) + FYM (10 kg) + 50%
recommended NPK
T10: Azotobacter (20 g) + PSB (20 g) + vermicompost (10
kg) + 50% recommended NPK
S1- 2 x 2 m S2- 3 x 3 m S3- 6 x 3 m S4- 6 x 6 m
CONCLUSION
The effect of bio-fertilizer along with
inorganic fertilizer on quality of guava cv.
Lalit was studied. Experimental findings
revealed that different treatments of bio-
fertilizers and inorganic fertilizer significantly
increased the plant height, plant spread,
canopy volume, number of fruits, fruit yield
per tree, fruit yield per hectare, total soluble
solids, ascorbic acid content. Physiological
loss weight and mean shelf life was minimum
in fruits, whereas, the minimum acidic content
was declined in fruits was observed in the
combination of Azotobacter (20 g) + PSB (20
g) + vermicompost (10 kg) + 50 %
recommended NPK while control recorded
minimum. Inoculation of Azotobacter and PSB
along with inorganic fertilizers also proved
effective.
REFERENCES
1. Singh, U. R., Pandey, J. C., Upadhyay, N.
P. and Tripathi, B. M., Description of
some guava varieties (P. guajava L.).
Haryana J. Hortl. Sci., 5(3-4): 142-149
(2007).
2. Roose, M. L., Coel, D. A., Atkin, D. and
Kuper, R. S., Yield and tree size of four
citrus cultivars on 21 rootstocks in
California. J. Amer. Soc. Hort. Sci., 114:
135-140 (1986).
3. AOAC. In Official Methods of Analysis,
17th edn, Titratable acidity of fruit
products, 942.15. Association of Official

Kumar et al Int. J. Pure App. Biosci. 5 (2): 354-366 (2017) ISSN: 2320 – 7051
Copyright © April, 2017; IJPAB 365
Analytical Chemists International,
Gaithersburg (2000).
4. AOAC. In: Official Methods of Analysis,
Ascorbic acid, 967.21, 45.1.14.
Association of Official Analytical
Chemists International, Gaithersburg
(2006).
5. Bal, J. S. and Dhaliwal, G. S., High
density planting studies in guava. Haryana
J. Hort. Sci., 32(1&2): 19-20 (2003).
6. Kundu, S., Effect of high density planting
on growth, flowering and fruiting of guava
(Psidium guajava L.). Acta Hort., 735:
267 – 270 (2007).
7. Barani, P. and Anburani, A., Influence of
vermicompost on growth parameters in
bhendi. South Indian Hort., 52: 351-354
(2004).
8. Pathak R. K. and Ram, R. A., Integration
of organic farming practices for
sustainable of guava. In: 1st international
Guava Symposium, 5-8 Dec., CISH,
Lucknow, India, pp. 144-145 (2005).
9. Shukla, A. K., Sarolia, D. K., Bhavana
Kumari, R. A., Kaushik, R. A., Mahawer,
L. N. and Bairwa, Evaluation of substrate
dynamics for integrated nutrient
management under high density planting
of guava cv. Sardar. Indian J. Hort., 66(4):
461-464 (2009).
10. Schnitzer, M., Soil organic matter for the
next 75 years. Soil Sci., 151: 41-59 (1991).
11. Sharma, A., P. Wali, Bakshi and Jasrotia,
A., Effect of organic and inorganic
fertilizers on quality and shelf life of
guava (Psidium guajava L.) cv. Sardar.
The Bioscan, 8(4): 1247-1250 (2013).
12. Dey, P., Rai, M., Kumar, S., Nath, V.,
Das, B. and Reddy, N. N., Effect of bio-
fertilizers on physico-chemical
characteristics of guava (Psidium guajava)
fruit. Indian J. Agril. Sci., 75: 95-96
(2005).
13. Kumar, P., Tiwari, J. P. and Lal, S., Effect
of varying levels of N, P and K
fertilization on plant growth, yield, fruit
quality and leaf nutrient status of guava
(Psidium guajava L.) cv. „Pant Prabhat‟.
1st
International Guava Symposium. Dec.
5-8, CISH, Lucknow p: 80 (2005).
14. Athani, S. I., Ustad, A. I., Prabhuraj, H. S.,
Swamy, G. S. K., Patil, P. B. and Kotikal,
Y. K., Influence of vermicompost on
growth, fruit yield and quality of guava cv.
Sardar. Acta Hort., 735: 381-385 (2007).
15. Dwivedi, D. H., Lata, R. and Ram, R. B.,
Effect of bio-fertilizer and organic
manures on yield and quality of „Red
Fleshed‟ guava. Journal of Scientific
Temper, 1: 193-198 (2010).
16. Mishra, H. K. and Pathak, R. A., Effect of
shoot pruning on crop regulation in guava
(Psidium guajava L.) cv. „Sardar‟. Prog.
Hort., 30: 78-81 (1998).
17. Nambiar, K. K. M., Soil fertility and crop
productivity under long-term fertilizer use
in India. ICAR, New Delhi (1994).
18. Prabu, T., Narwadkar, P. R., Sajindranath,
A. K. and Rathod, N. G., Integrated
nutrient management in coriander. South
Indian Hort., 50: 680-684 (2002).
19. Binepal, M. K., Tiwari, R. and Kumawat,
B. R., Effect of integrated nutrient
management on physico-chemical
parameters of guava under Malwa Plateau
conditions of Madhya Pradesh. Annals
Plant & Soil Res., 15(1): 47-49 (2013).
20. Madhavi, A., Prasad, M., Reddy, I.P. and
Girwani, A., Integrated nutrient
management for increased productivity
and quality in guava. 1st International
Guava Symposium, Dec. 5-8, CISH,
Lucknow pp. 83 (2005).
21. Madhavi, A., V. Maheshwara Prasad and
Girwani, A., Influence of manures,
fertilizers and bio-fertilizers on yield and
quality of guava cv. L-49 (Sardar). J.
Asian Hort., 3(2): 112-117 (2007).
22. Dwivedi, V., Effect of integrated nutrient
management on yield, quality and
economics of guava. Annals Plant and Soil
Res., 15(2): 149-151 (2013).
23. Godage, S. S., N. S. Parekh, D. S. Nehete
and V. M. Jagtap, Influence of chemical
and bio-fertilizers on growth, flowering,
fruit yield and quality of guava (Psidium
Kumar et al Int. J. Pure App. Biosci. 5 (2): 354-366 (2017) ISSN: 2320 – 7051
Copyright © April, 2017; IJPAB 366
guajava) cv. Allahabad Safeda. Bioinfolet,
10(2A): 480-485 (2013).
24. Gautam, U. S., R. Singh, N. Tiwari, P. S.
Gurjar and A. Kumar, Effect of integrated
nutrient management in mango cv.
Sunderja. Indian J. Hort., 69(2): 151-155
(2012).
25. Singh K. K., S. Barche and D. B. Singh,
Integrated nutrient management in papaya
(Carica papaya L.) cv. Surya.
Proceedings of 2nd
International
Symposium on Papaya. Acta Hort., 851:
377-380 (2010).