Studies on Phosphatidylcholine Vesicles · Studies on Phosphatidylcholine Vesicles ... are c =...
7
THE Jonnlva~ OFT~X.OGI~AL CKEX.XIBTHY Vol. 246, No. 8, Issue of April 25, pp. 2555-2560, 1871 Printed ir U.S.A. Studies on Phosphatidylcholine Vesicles DETERMINATION OF PARTIAL SPECIFIC VOLUMES BY SEDIMENTATION VELOCITY METHOD* (Received for publication, December 14, 1970) CHING-HSIEN HUANG AND JAMES P. CHARLTON From the Department of Biochemistry, University of Virginia School of Medicine, Charlottesville, Virginia 22901 SUMMARY The partial specific volume of phospholipid vesicles was determined by the sedimentation velocity method in various concentrations of hydrogen and deuterium oxide mixture. Since the density of D20 is very much greater than the re- ciprocal of the specific volume of phospholipids, the density of DzO-Hz0 medium corresponding to zero redistribution of phospholipids during sedimentation can be obtained with high precision by inferpolafion of the data. This method is therefore direct and accurate for phospholipids. Similar measurements on phospholipid vesicles in various concentra- tions of potassium chloride and sodium chloride solutions have also been made. The apparent isodensity point in the KC1 solution was found to be approximately equal to that ob- tained in NaCl solution but smaller than that obtained in D,O-Hz0 medium. This difference can be attributed to the influence of preferential interaction of the vesicle with water. The partial specific volume and effective specific volumes of phosphatidylcholine vesicles are c = 0.9814 f 0.0004 ml per g9 ~‘KCI = 0.9883 f 0.0002, and #N&1 = 0.9886 f 0.0006 ml per g. The accuracy of the calculation of molecular weight and other related hydrodynamic properties obtained from sedimentation measurements depends heavily upon a knowledge of the partial specific volume, B, of the macromolecule under study. This is the case because all basic sedimentation equations contain the term (1 - tip), where p is the density of the solution. For pro- teins, ti is typically near 0.74 ml per g, and thus the usual error in 8 of 0.3% results in an error of 1% in the molecular weight. For phosphatidylcholine vesicles (l), a closed shell-like sphere with a continuous phosphatidylcholine bilayer surrounding a volume of solvent, the situation is much less satisfactory. The partial specific volume of these objects is very close to unity, and hence the accuracy of the term (1 - tip) becomes extremely sensi- tive to the accuracy of 0. An error of 0.3% in I? magnifies to an error of 15% in the molecular weight. The partial specific volume is calculated from density deter- minations on solutions of varying concentrations, according to * This research was supported in part by Grant GM-14628 from the United States Public Health Service and a grant from the Smith Kline and French Laboratories. the definition, C = (&/dwi)T,P,Wi, where w; is the weight of the ith component added at constant temperature, pressure, and at constant weight of the other components of the system. Densi- ties are, in general, determined by means of a pycnometer. It was recently reported that the determination of the partial specific volume of phosphatidylcholine vesicles by this method is unsatisfactory because the density of phosphatidylcholine vesicles is very close to that of the aqueous solvent (I). The magnetic densitometer (2, 3), perhaps the most sensitive method for determining C accurately, may not be entirely satisfactory because the possibility of phospholipid adsorption to the surface of the glass buoy could introduce an appreciable error in the measurements. This communication describes the determination of the partial specific volume of phosphatidylcholine vesicles by sedimentation in D20-H20 mixtures of differing density. At the zero value of the viscosity corrected sedimentation coefficient, where the phosphatidylcholine vesicles neither sediment nor float, the corresponding density of the suspending DPO-HPO medium is taken as the density of the vesicle. The partial specific volume of the vesicle is the reciprocal of this density. The sedimentation velocity method for determining partial specific volumes has been applied to viruses (4), proteins (5), and serum lipoproteins (6). Similar determinations in DZO-HZ0 media on lipids per se, however, have not been reported. This method should be ideal for phospholipid vesicles, since the density of the DC0 is considerably greater than that of phospho- lipids and thus the vesicles can be caused to float in a wide con- centration range of DzO in HzO. Consequently, the density of the D20-H20 medium corresponding to zero redistribution of the phospholipid vesicles can be obtained with high precision by interpolation, not extrapolation, of the data. Furthermore, since there are no exchangeable hydrogen atoms present in phos- phatidylcholine in the pH range of 5 to 8, no corrections for deu- terium exchange are necessary. The fact that phosphatidyl- choline bears no net charge in this pH range eliminates theeffects of charge on sedimentation. In addition to the measurements with DZO-HZ0 media, sedi- mentation rates of phosphatidylcholine vesicles suspended in potassium chloride and sodium chloride solutions of varying densities were also investigated. Using the effective specific volume of the vesicle obtained from this data together with the information obtained in the HtO-D20 medium, the preferential hydration of the phosphatidylcholine vesicles has been deter- mined. by guest on June 7, 2018 http://www.jbc.org/ Downloaded from
Transcript of Studies on Phosphatidylcholine Vesicles · Studies on Phosphatidylcholine Vesicles ... are c =...

THE Jonnlva~ OF T~X.OGI~AL CKEX.XIBTHY Vol. 246, No. 8, Issue of April 25, pp. 2555-2560, 1871
Printed ir U.S.A.
Studies on Phosphatidylcholine Vesicles
DETERMINATION OF PARTIAL SPECIFIC VOLUMES BY SEDIMENTATION VELOCITY METHOD*
(Received for publication, December 14, 1970)
CHING-HSIEN HUANG AND JAMES P. CHARLTON
From the Department of Biochemistry, University of Virginia School of Medicine, Charlottesville, Virginia 22901
SUMMARY
The partial specific volume of phospholipid vesicles was determined by the sedimentation velocity method in various concentrations of hydrogen and deuterium oxide mixture. Since the density of D20 is very much greater than the re- ciprocal of the specific volume of phospholipids, the density of DzO-Hz0 medium corresponding to zero redistribution of phospholipids during sedimentation can be obtained with high precision by inferpolafion of the data. This method is therefore direct and accurate for phospholipids. Similar measurements on phospholipid vesicles in various concentra- tions of potassium chloride and sodium chloride solutions have also been made. The apparent isodensity point in the KC1 solution was found to be approximately equal to that ob- tained in NaCl solution but smaller than that obtained in D,O-Hz0 medium. This difference can be attributed to the influence of preferential interaction of the vesicle with water. The partial specific volume and effective specific volumes of phosphatidylcholine vesicles are c = 0.9814 f 0.0004 ml
per g9 ~‘KCI = 0.9883 f 0.0002, and #N&1 = 0.9886 f 0.0006 ml per g.
The accuracy of the calculation of molecular weight and other related hydrodynamic properties obtained from sedimentation measurements depends heavily upon a knowledge of the partial specific volume, B, of the macromolecule under study. This is the case because all basic sedimentation equations contain the term (1 - tip), where p is the density of the solution. For pro- teins, ti is typically near 0.74 ml per g, and thus the usual error in 8 of 0.3% results in an error of 1% in the molecular weight. For phosphatidylcholine vesicles (l), a closed shell-like sphere with a continuous phosphatidylcholine bilayer surrounding a volume of solvent, the situation is much less satisfactory. The partial specific volume of these objects is very close to unity, and hence the accuracy of the term (1 - tip) becomes extremely sensi- tive to the accuracy of 0. An error of 0.3% in I? magnifies to an error of 15% in the molecular weight.
The partial specific volume is calculated from density deter- minations on solutions of varying concentrations, according to
* This research was supported in part by Grant GM-14628 from the United States Public Health Service and a grant from the Smith Kline and French Laboratories.
the definition, C = (&/dwi)T,P,Wi, where w; is the weight of the ith component added at constant temperature, pressure, and at constant weight of the other components of the system. Densi- ties are, in general, determined by means of a pycnometer. It was recently reported that the determination of the partial specific volume of phosphatidylcholine vesicles by this method is unsatisfactory because the density of phosphatidylcholine vesicles is very close to that of the aqueous solvent (I). The magnetic densitometer (2, 3), perhaps the most sensitive method for determining C accurately, may not be entirely satisfactory because the possibility of phospholipid adsorption to the surface of the glass buoy could introduce an appreciable error in the measurements.
This communication describes the determination of the partial specific volume of phosphatidylcholine vesicles by sedimentation in D20-H20 mixtures of differing density. At the zero value of the viscosity corrected sedimentation coefficient, where the phosphatidylcholine vesicles neither sediment nor float, the corresponding density of the suspending DPO-HPO medium is taken as the density of the vesicle. The partial specific volume of the vesicle is the reciprocal of this density.
The sedimentation velocity method for determining partial specific volumes has been applied to viruses (4), proteins (5), and serum lipoproteins (6). Similar determinations in DZO-HZ0 media on lipids per se, however, have not been reported. This method should be ideal for phospholipid vesicles, since the density of the DC0 is considerably greater than that of phospho- lipids and thus the vesicles can be caused to float in a wide con- centration range of DzO in HzO. Consequently, the density of the D20-H20 medium corresponding to zero redistribution of the phospholipid vesicles can be obtained with high precision by interpolation, not extrapolation, of the data. Furthermore, since there are no exchangeable hydrogen atoms present in phos- phatidylcholine in the pH range of 5 to 8, no corrections for deu- terium exchange are necessary. The fact that phosphatidyl- choline bears no net charge in this pH range eliminates theeffects of charge on sedimentation.
In addition to the measurements with DZO-HZ0 media, sedi- mentation rates of phosphatidylcholine vesicles suspended in potassium chloride and sodium chloride solutions of varying densities were also investigated. Using the effective specific volume of the vesicle obtained from this data together with the information obtained in the HtO-D20 medium, the preferential hydration of the phosphatidylcholine vesicles has been deter- mined.
by guest on June 7, 2018http://w
ww
.jbc.org/D
ownloaded from

2556 Studies on Phosphatidylcholine Vesicles Vol. 246, No. 8
EXPERIMENTAL SECTION
Mate&&-The phosphatidylcholine was isolated from hen egg yolk by the column chromatographic method (1). The purity of the preparation was checked by thin layer chromatog- raphy (7). Deuterium oxide (-90 mole per cent I&O, lot 4566) was purchased from Bio-Rad, Richmond, California. DsO-HZ0 media of different densities were made by mixing volumetrically the deuterium oxide with doubly glass-distilled water. Other chemicals were of reagent grade.
Preparatim of Phosphaticlylchdine Vesicle+-Lyophilized phos- phatidylcholine (300 to 400 mg) was suspended in 8 ml of buffered 0.1 M KC1 solution (0.1 M KC1 in 0.01 M acetate buffer) at pH 5.0. The suspension was ultrasonically irradiated (20 kHz) under nitrogen at 2” for 2.5 hours and then centrifuged at 105,000 x g, at 4”, for 60 min. The resulting supernatant was subjected to gel filtration, at 4”, on a column (2.5 x 50 cm) of Sepharose 4B which had been previously equilibrated with the same buffered KC1 solution. The elution diagram of the phosphatidylcholine dispersipn consists of two distinct fractions (I and II). Those portions of Fraction II which show a linear relation between absorbance at 300 nm and lipid phosphorous content and that from which the linear regression line passes through the origin were collected and dialyzed overnight against redistilled water at 4”. The detailed experimental procedures for sonic disruption, gel filtration, and collection of the homogeneous vesicles solution in those portions of Fraction II have been published elsewhere (8). In order to remove trace amounts of free salt present in the dispersion, the dialyzed material was first concentrated in a Sartorius collodion bag and was then subjected to gel filtration on a Sepharose column which had been previously washed ex- haustively with redistilled water. The effluent phosphatidyl- choline vesicle solution was then mixed volumetrically with various portions of deuterium oxide for the sedimentation experi- ments. Phosphatidylcholine concentration in the vesicle solu- tion was expressed in terms of lipid phosphorus (Pi) as deter- mined spectrophotometrically (9).
For those experiments with various concentrations of sodium and potassium chloride as suspending media, the phosphatidyl- choline vesicles were prepared in buffered 0.1 M NaCl or KC1 solution at pH 8.0. The vesicle solution, collected from the efflu-
ent of those proper portions of Fraction II (8), was mixed volu- metrically with the appropriate concentration of buffered KC1 or NaCl solution. The mixed solutions were stirred gently at room temperature for 3 hour before the beginning of the centri- fuge run to allow for the complete equilibration of KC1 or NaCl between the inner volume of the vesicles and the outer suspend- ing medium. The buffer used throughout this work was 0.01 M Tris-HCl.
Viscosity and Density Mea;surement+--A Cannon-Ubbelhode semimicro dilution viscometer with a shear rate of about 1500 SCC‘-’ and a water flow time of about 287 set was used in all the viscosity measurements on the different suspending media. No kinetic energy correction was necessary. The viscosity of the medium relative to that of water, Q., was calculated using the relation qr = (td/t&J, where t is the flow time and d the density of the medium. The subscript, w, represents the measurements with redistilled water. Flow times determined with an electric timer were the result of a minimum of five experiments. The density measurements of each suspending medium was deter- mined in triplicate with a 5-ml calibrated pycnometer. Weigh- ings were made with a Mettler H30T analytical balance to an accuracy of ho.01 mg. Both the viscosity and density measure- ments were carried out at 20” in a thermostated bath with a temperature control of +0.005”.
Sedimentation Velocity MeasurementiSedimentation velocity studies were carried out at 20” f 0.05” in a Beckman-Spine0 model E analytical ultracentrifuge, equipped with a schlieren optical system fitted with a phase plate and a RTIC temperature- control unit. The An-D rotor, operated at 42,040 or 50,740 rpm, was employed; a double sector, capillary-type synthetic boundary cell with a 12-mm optical path was used in most of the experi- ments. The phosphatidylcholine vesicle solutions employed were freshly prepared. The relative amounts of vesicle solution and its corresponding suspending medium introduced separately into the two sectors of the centerpiece were so chosen as to allow the formation of the boundary near the center of the cell. When the density of the suspending medium was higher than that of the phospholipids, the bar angle was set to be above 90”, thus converting schlieren pattern from a trough to a peak (10).
Since the vesicles were homogeneous with respect to size (I),
FIG. 1. Ultracentrifuge schlieren patterns of a sedimentation velocity experiment on the phosphatidylcholine vesicles suspended in 10% DzO medium. Time in minutes after rotor attained a speed of 50,740 rpm. The phase plate angle was 70” throughout. Initial concentration 10.8 pmoles per ml (Pi).
by guest on June 7, 2018http://w
ww
.jbc.org/D
ownloaded from
Issue of April 25, 1971 C. Huang and J. P. Charlton 2557
30 “1. . . .
-1 - :-.
-2 c
-2 t i
1-l--I-~-L-- 1.00 1.01 1.02 I .03
I , I , , , 1 I I
0 2 4 6 8 10 12 14 16 18
LIPID PHOSPHORUS (u molev’ml I
FIG. 2. Relationship between the sedimentation rate of phos- phatidylcholine vesicles suspended in various percentage of deu- terium oxide solution and the concentration of the vesicles in the suspension.
and the schlieren patterns were highly symmetrical (Fig. l), sedimentation coefficient, amedium, was calculated from least squares of t versus log rH, where rH is the radial distance from the center of rotation of the centrifuge rotor to the point of the maxi- mum ordinate on the schlieren peak at time, t. The maximum ordinate positions on schlieren patterns were measured with a Nikon shadowgraph (model 6).
RESULTS
To determine the partial specific volume of phosphatidylcho- line vesicles, the sedimentation coefficients of the vesicles are first measured over a large range of phospholipid concentrations in various mixtures of DQO-H20. The DQO-HQO suspended me- dium can reasonably be considered to be a one-component solvent in which preferential binding of the different forms of water would
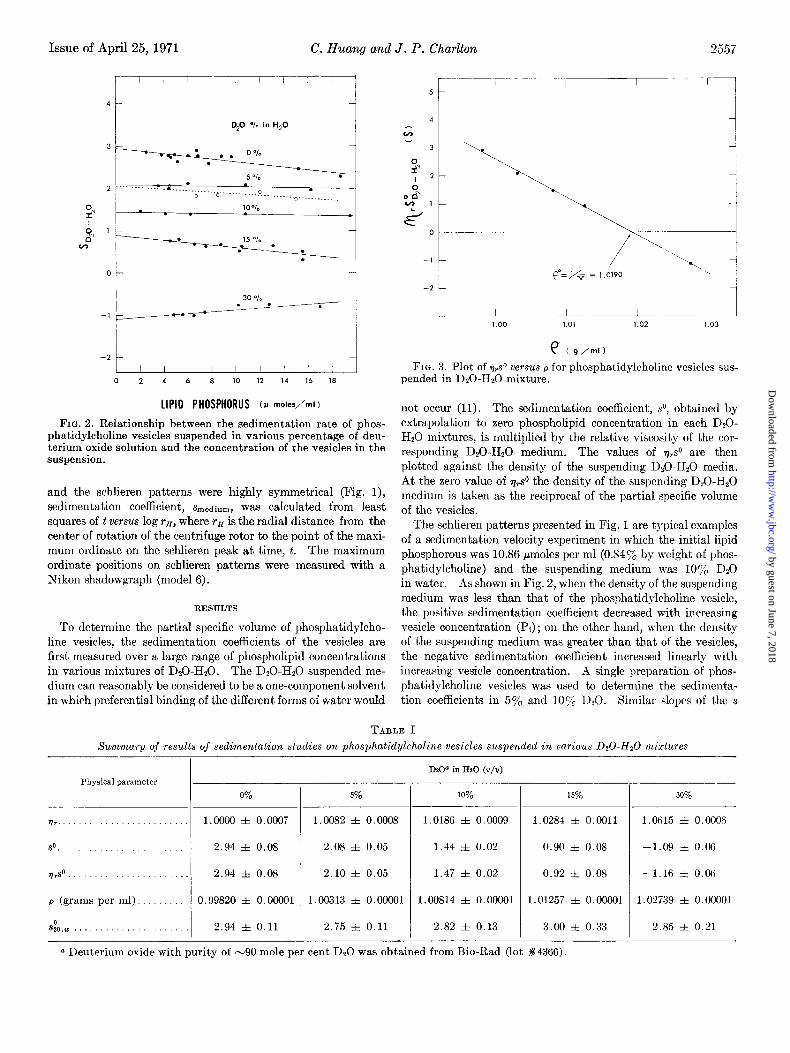
e (g/ml) FIG. 3. Plot of &’ versus p for phosphatidylcholine vesicles sus-
pended in DzO-Hz0 mixture.
not occur (11). The sedimentation coefficient, so, obtained by extrapolation to zero phospholipid concentration in each D*O- Hz0 mixtures, is multiplied by the relative viscosity of the cor- responding D,O-HZ0 medium. The values of r],s” are then plotted against the density of the suspending D,O-HZ0 media. At the zero value of r],.sO the density of the suspending D,O-H,O medium is taken as the reciprocal of the partial specific volume of the vesicles.
The schlieren patterns presented in Fig. 1 are typical examples of a sedimentation velocity experiment in which the initial lipid phosphorous was 10.86 pmoles per ml (0.84% by weight of phos- phatidylcholine) and the suspending medium was 10% DzO in water. As shown in Fig. 2, when the density of the suspending medium was less than that of the phosphatidylcholine vesicle, the positive sedimentation coefficient decreased with increasing vesicle concentration (Pi) ; on the other hand, when the density of the suspending medium was greater than that of the vesicles, the negative sedimentation coefficient increased linearly with increasing vesicle concentration. A single preparation of phos- phatidylcholine vesicles was used to determine the sedimenta- tion coefficients in 57, and 107, I&O. Similar slopes of the s
TABLE I Summary of results of sedimentation studies on phosphatidylcholine vesicles suspended in various D&Hz0 mixtures
DzOO in Hz0 (v/v) Physical parameter
0% 5% 10%
TT. 1.0000 f 0.0007 1.0082 f 0.0008 I.0186 f 0.0009
so. 2.94 f 0.08 2.08 f 0.05 1.44 f 0.02
7jrS0 . . 2.94 f 0.08 2.10 f 0.05 1.47 x!z 0.02
p (grams per ml). 0.99820 f 0.00001 1.00313 f 0.00001 1.00814 zk 0.00001
s;o.w . . 2.94 f 0.11 2.75 f 0.11 2.82 f 0.13
15%
1.0284 f 0.0011
0.90 f 0.08
0.92 f 0.08
1.01257 f 0.00001
3.00 * 0.33
30%
I.0615 f O.OOOG
-1.09 f 0.06
-1.16 zt 0.06
1.02739 f 0.00001
2.85 f 0.21
0 Deuterium oxide with purity of -90 mole per cent DzO was obtained from Bio-Rad (lot ,+# 4366).
by guest on June 7, 2018http://w
ww
.jbc.org/D
ownloaded from

2558 Studies on Phosphatidylcholine Vesicles Vol. 246, No. 8
versus Pi curves determined in 5yC1 and 1001, D20, shown in Fig. 2 as -, were observed. Several different vesicle preparations were used to determine the sedimentation coefficients in pure HzO, and in 15% DzO (Fig. 2). Although the slopes of the two regression lines obtained under these conditions are parallel to each other, they are not parallel to those obtained in 5% and 10% D,O. In addition, it is apparent that the data scatter is less when a single phosphatidylcholine vesicle preparation was used. Sedimentation coefficients for vesicles suspended in 30% D,O were determined with a single vesicle preparation.
As is evident from Fig. 2, the slopes of the s versus Pi plot vary somewhat with different vesicle preparations, although there is a linear relationship between s and Pi for all prepara-
5
4
co 3
2
= 02
2’ 0
-I
-2
T--- I
I ( I I 1.00 1.01 1.02 1.03
? ( 9 /ml )
FIG. 4. Plot of qrso versus p for phosphatidylcholine vesicles suspended in potassium chloride and sodium chloride solutions of various densities. The straight line was calculated by the method of least squares to fit all the experimental data obtained in KC1 solutions (0) and the value of po was obtained from the point of intersection of the least square line with the density axis. Results of the sedimentation studies in NaCl solutions (A) are closely similar to those obtained in KC1 solutions.
tions. Since it is the so values that are used in the calculation of B, the slope of the s versus Pi plot is not important provided each preparation gives the same value of so under identical conditions. In order to establish that phosphatidylcholine vesicles obtained from a different preparation show the same so value, sedimentation velocity experiments with a second vesicle preparation were performed in the 5% DSO medium. These experiments are shown in Fig. 2 as ---. The results indicate that although the slope of the s versus Pi line differs from that of the previous experiment, the value of so for the two preparations are identical within the limit of experimental error.
Fig. 3 shows the viscosity-corrected sedimentation coefficient, q,s”, of phosphatidylcholine vesicles versus the density of the suspending medium, the D20-H20 mixture. The least squares method was used to calculate the linear regression line for the plot. A correlation coefficient of 0.9992 was found, which is indicative of a nearly perfect conformity of the experimental data to a straight line. The value of pa, the density of D0 H20 medium corresponding to zero redistribution of phospha- tidylcholine vesicles, can readily be obtained from the point where the least squares line intersects with the density axis. The availability of experimental data both above and below the point of intersection yields the value of p”, 1.0190, accurate to +O.OOOP g per ml. The partial specific volume of phospha- tidylcholine, which is equal to the reciprocal of the value of p”, was calculated to be 0.9814 f: 0.0004 ml per g.
The results of the sedimentation studies on phosphatidyl- choline vesicles suspended in various proportions of D0H20 mixture and the density and viscosity data of the suspending medium are summarized in Table I. Values of .s&,~ were cal- culated from the experimental data by the relation &,,,, = sOq,(l - @nZo)/(l - fi~~~~-u~o), where ti is taken as l/p0 ob- tained from Fig. 3.
Fig. 4 shows the relationship between the corrected sedimenta- tion rate of phosphatidylcholine vesicles and the density of potassium chloride solution employed as the suspending me- dium. The linear regression line, shown in Fig. 4, with a cor- relation coefficient of 0.9998 was determined by the method of least squares. In this case the density corresponding to zero sedimentation rate is 1.0118 + 0.0002 g per ml, which is smaller
TABLE II
Summary of sedimentation results obtained for phosphatidylcholine vesicles suspended in H20 solutions containing various concentrations L either KC1 or NaCl d
-i Molarity of KW
Physical parameter 0.000 M 0.100 M 0.250 Y 0.400 M
,,y. _. 1.0000 f 1.0010 f 0.9983 f 0.9942 f 0.0007 0.0011 0.0006 0.0010
so............ 2.94 f 1.84 f 0.24 i -1.15 f 0.08 0.09 0.04 0.05
qrsQ . . . . 2.94 f 1.84 z!z 0.24 f -1.14 f 0.08 0.09 0.04 0.05
p (grams per ml) 0.99820 f 1.00340 f 1.01040 f 1.01732 Z!C
0.00003 0.00003 0.00003 0.00003 0 .QO,~. . . . . 2.94 f 2.99 f 2.39 f 2.77 f
0.10 0.17 0.52 0.16
-
--
-
0.500 At
0.9927 f 0.0011
-2.19 f 0.07
-2.17 f 0.07
-.
-.
-
1.02190 zk 0.00003
2.89 f 0.12
Molarity of NaW
0.100 Id 0.200 P 0.300 M 0.400 P
1.0104 f 1.0514 f 1.0223 f 1.0339 f 0.0010 0.0009 0.0010 0.0010
1.76 f 0.91 f 0.16 f -0.51 f 0.08 0.02 0.02 0.10
1.78 f 0.93 f 0.17 f -0.53 f 0.08 0.02 0.02 0.10
1.00256 f 1.00664 f 1.01030 f 1.01496 zt 0.00003 0.00003 0.00003 0.00003
2.63 f 2.49 f 1.70 f 2.14 f 0.24 0.33 0.80 0.58
0.500 Y
1.0412 f 0.0007
-1.55 zk 0.16
-1.61 i 0.16
1.01888 * 0.00003
2.98 zt 0.41
o The salt solutions were adjusted to pH 8.0 by addition of 0.01 M Tris-HCl.
by guest on June 7, 2018http://w
ww
.jbc.org/D
ownloaded from

Issue of April 25, 1971 C. Huang and J. P. Charlton 2559
TABLE III
Comparison of vulues of specific volumes of phosphatidylcholine vesicles obtained by di$erent methods at %I0
Solvent i v Method
ml/g ml/g
DZO-HzO.. . 0.9814 f 0.0004 Sedimentation velocity
KCl-H20a. 0.9883 f 0.0002 Sedimentation velocity
NaCl-HzOa. 0.9886 f 0.0006 Sedimentation velocity
NaCl-HnO”.. 0.9885 f 0.0005 Magneticdensi- tometer (1)
NaCl-H20b.. . 0.986 f 0.003 Pycnometer (1) c . . . . . 0.9833 Method not
specified (13)
o The solvent contained 0.01 M of Tris-KC1 buffer (pH 8.0). * The solvent contained 0.01 M of Tris-WC1 buffer (pH 8.5). c Aqueous solvent of unspecified composition.
than that obtained in D20-H20 media by 0.0072 g per ml. The reciprocal of the density gives an effective specific volume of 0.9883 f 0.0002 ml per g. The sedimentation results and their related density and viscosity data are summarized in Table II. Values of .s!&,~ presented in Table II were calculated according to the equation s!&,, = s”v4 - +‘P,,,)lu - ~‘PB&HZO), where 4’ is the reciprocal of pa (12).
The results of the sedimentation studies on phosphatidyl- choline vesicles suspended in sodium chloride solutions of various densities are also presented in Fig. 4 and Table II. In this case, the linear regression line of the q,s” versus p plot shows a slope of 213.33 x lo-l3 with a correlation coefficient of 0.9967. The intercept of the linear regression line on the p-axis gives a value of 1.0115 f 0.0006 g per ml as the density, p”, at which zero sedimentation occurs. The effective specific volume, #, can thus be calculated from the reciprocal of p” as 0.9886 f 0.0006 ml per g, which is essentially identical, within the limit of ex- perimental error, to the value obtained in potassium chloride solution.
A comparison of the specific volumes of phosphatidylcholine vesicles obtained by the sedimentation velocity method with those obtained by other methods is made in Table III. A value of a reported by Saunders, Perrin, and Gammack (13) is also included for comparison. The 4’ values obtained by sedimenta- tion are in excellent agreement with that determined by the magnetic densitometer. This agreement suggests that the possibility of error with the magnetic densitometer due to ad- sorption of phosphatidylcholine to the glass buoy is minimal.
DISCUSSION
For a two-component system, the behavior of a hydrated, sedimenting vesicle component at infinite dilution in a medium (Component 1) of density, p, and viscosity, 7, at constant tem- perature is described by
(m + hp,) - (m0 + h)p = f’qs” (1)
where m is the anhydrous mass of the vesicle, h the volume of the hydrated and enclosed medium with density, ps, and f’ is a func- tion of the size and shape of the solvated vesicle (12).
When the vesicles are sedimented in DgO-Hz0 medium, it
seems likely that both the solvating medium and the medium enclosed within the vesicle have a density equal to that of the suspending medium, i.e. ps = p, and since Nm = M, where N is Avogadro’s number and M is the molecular weight, Equa- tion 1 reduces to Equation 2
M(1 - fip)/Nf’ = qs” (2)
Dividing both sides of Equation 2 by the viscosity of water, qO, yields Equation 3
M(1 - @)/Nqaj = vrs” (3)
where lr is the viscosity of DzO-H,O medium relative to that of water.
Equation 3 describes the sedimentation behavior of vesicles at infinite dilution in media of different densities, and provides the theoretical justification that the point of zero sedimentation corresponds to a D20-H20 density (p”) equal to the reciprocal of the partial specific volume.
Application of Equation 3 to the phosphatidylcholine vesicle depends on the plausible assumption that ps = p. The linearity in the QSO versus p plot (Fig. 4) is a necessary, although not a sufficient, condition for this assumption to be valid. Moreover, the fact that the water permeability coefficients of the planar phosphatidylcholine bilayer membrane determined in Hz0 and D20, respectively, are identical (14) indicates that the structure of the phosphatidylcholine bilayer is not perturbed by the pres- ence of deuterium oxide. In addition, the self-diffusion co- efficient of water molecules across the planar bilayer membrane is extremely fast (about 4 /.J per set) (14); hence, the complete equilibration of different forms of water molecules between the inner volume of the vesicles and the suspending medium must have been reached within seconds. This further suggests that the DzO-Hz0 medium enclosed within the interior of the phos- phatidylcholine vesicle can be regarded as a one-component medium with a density equal to the bulk suspending medium.
In a three-component system comprised of water (Component l), phosphatidylcholine vesicle (Component 2), and monovalent salt (Component 3), the sedimentation velocity of vesicles at infinite dilution depends on the partial specific volume of the vesicle and on the preferential interaction with solvent com- ponents. For such a system we may write (15)
78 = (1 - 4’p)Mmhf (4)
where p is the density of the solvent mixture (Components 1 and 3) in the absence of Component 2, and Q is the viscosity of the solvent mixture relative to that of water. Equation 4 is similar to Equation 3, except that the term fi used in two-com- ponent system is replaced by #, an effective specific volume, which is related to the true partial specific volume of Component 2 and the influence of preferential interaction with solvent Com- ponents 1 and 3 (expressed in terms of 6 and & respectively) by the following Equation (16, 17)
where the interaction coefficient, .$, is the weight of a solvent component in grams to be removed (Component 3) or added (Component 1) per g of Component 2, and B,, I&, and &X are the partial specific volume of components 1, 2, and 3, respectively.
At the condition of +s” = 0 and assuming that the partial specific volume of the vesicles is unaffected by the presence of
by guest on June 7, 2018http://w
ww
.jbc.org/D
ownloaded from

2560 Xtudies on Phosphatidylcholine Vesicles Vol. 246, No. 8
KC1 at the concentration (0.286 M) corresponding to zero sedi- mentation, the interaction coefficient, .$, can he calculated by the following equation obtained from Equations 4 and 5
E3 = (4’ - 02)/(+’ - 83) (6)
W’ith the values of GZ = 0.9814 f 0.0004 ml per g (Fig. 3 and Table III), 4’ = 0.9883 f 0.0002 ml per g (Fig. 4 and Table III) and Gs = 0.3649 + 0.0002 ml per g obtained within the concentration range of 0 to 0.23 M KC1 (18), Equation 6 gives a value of 0.0111 f 0.0007 for Ea. .$a can be converted to & by the relationship & = lo3 &/Msrns (17), where Ms is the molecular weight of Component 3 and ma the molal concentration of Com- ponent 3. A value of 0.51 f 0.04 g of water bound per g of phosphatidylcholine vesicle can be calculated for & as the net hydration or preferential solvation of vesicles in KCl-H20 mix- ture at a concentration corresponding to zero sedimentation.
This sizable amount of water (& = 0.51), preferentially bound to the vesicle in a dilute monovalent salt solution, can be cal- culated to account for 1.6 layers of water molecules on both the outer and inner surfaces of the vesicle. This calculation is based on the assumption that the diameter of the water molecule is 4 A, the outer and inner radius of the vesicle are 124 A and 84 A, respectively (l), and the molecular weight of the vesicle is 2.13 x 10⁶. The molecular weight is calculated from the Svedberg equation [M = (RT&,,)/(l - QJ)D~~,~] using values of B = 0.9814 ml per g (Table III), s!$,~ = 2.63 S determined in 0.1 M NaCl solution (Table II) and D~o,~ = 1.87 X 1O-7 cm2 set? determined in 0.1 M NaCl solution (1). This value of vesicle weight (2.13 X 10⁶) based on new values for S and s&,~ is slightly larger (only 3%) than that reported previously (1).
Electron paramagnetic resonance studies of the spin-labeled vesicles show that the polar head part of the enclosed phospha- tidylcholine bilayer structure is not an impermeable region to small uncharged molecules because the maleimide spin labels can penetrate into this region to react with -SH groups located near the interface between the nonpolar hydrocarbon portion of the structure and the polar head region (8). In addition, this polar head region of the enclosed bilayer structure is flexible enough to permit the rapid anisotropic motions of the label (8). Hence, the water molecules may easily penetrate into this flex- ible polar head region of the same structure. Therefore, the above calculated result of 1.6 layers of water molecules around the surfaces of the vesicle has to be considered as an upper limit.
The presence of preferential hydration for vesicles suspended in dilute KC1 medium can, in part, be qualitatively interpreted by the concept of steric exclusion of the more bulky component of the solvent from the neighborhood of the macromolecule (19). Based on purely geometrical reasoning, a sedimenting vesicle would be expected to behave as if it bound the water molecules in preference to hydrated salt ions because the larger molecules, i.e. the hydrated salt ions, cannot come as close to the surface of the sedimenting vesicle as the smaller water molecules. The deficiency of hydrated salt ions in the immediate neighborhood of the sedimenting vesicle results in a decrease in the effective density of the vesicle in KC1 suspending medium.
The determination of partial specific volume of macromole- cules by sedimentation equilibrium method has been described by Edelstein and Schachman (11). The sedimentation velocity technique in D,O-H20 media reported in this communication is extremely useful for phospholipids, because it is accurate, con- venient, reproducible, and requires only small amounts of mate- rials. In principle, the sedimentation rate of proteins and en- zymes can also be carried out in D,O-H,O medium, but, in terms of accuracy the sedimentation velocity technique cannot opera- tionally rival the standard methods. This is due to the fact that the density of D20, 1.1054 g per ml at 20”, is not sufficiently dense enough to reduce the sedimentation rate of proteins, with an averaged density of about 1.35 g per ml, to zero. Conse- quently, the value of p” can be obtained only by a long extrapo- lation of the experimental data in a QSO versus p plot. Recently it was reported that deuterium oxide can cause alterations of the association-dissociation equilibrium of subunit proteins (20). Such alterations would further severely limit the application. of the sedimentation technique in the determination of the partial specific volume of these proteins.
Ack?aowZ&ments-The authors are very grateful to Dr. Lian- Pin Lee for performing the viscosity measurements described in this paper. We are indebted to Dr. T. E. Thompson for con- tinued encouragement and invaluable discussions. Thanks are also due to Drs. D. W. Kupke and D. J. Cox for comments re- garding this manuscript.
REFERENCES
1. HUANG, C., Biochemistry, 8, 344 (1969). 2. KUPKE, D. W., Fed. Proc., 26, 990 (1966). 3. FAHEY, P. F., KUPKE, D. W., AND BEAMS, J. W., Proc. Nat.
Acad. Sci. U. S. A., 63, 548 (1969). 4. LAUFFER, M. A., AND BENDET, I. J., Advan. virus Res., 2, 241
(1954). 5. GAGEN, W. L., Biochemistry, 6, 2553 (1966). 6. HAZELWOOD, R. N., J. Amer. Chem. Sot., 80, 2152 (1958). 7. SKIPSKI, V. P., PETERSON, R. F., AND BARCLAY, M., Biochem.
J., 90, 374 (1964). 8. HUANG, C., CHARLTON, J. P., SHYR, C. I., AND THOMPSON,
T. E., Biochemistry, 9, 3422 (1970). 9. GOMORI, G., J. Lab. Clin. Med., 27,955 (1942).
10. HILL, J., AND Cox, D. J., J. Phys. Chem., 69, 3032 (1965). 11. EDELSTEIN, S. J., AND SCHACHMAN, H. K., J. Biol. Chem., 242,
306 (1967). 12. SCHACHMAN, H. K., AND LAUFFER, M. A., J. Amer. Chem. Sot.,
72, 4266 (1950). 13. SAUNDERS, L., PERRIN. J., AND GAMMACK, D., J. Pharm.
Pharmacol., i4, 567 (i962j. 14. HUANG. C.. AND THOMPSON. T. E.. J. Mol. Biol.. 16.539 (1966). 15. TANFO$D, ‘C., KAWAHARA; K., AND LAPANJE; S:, J. ‘Ame;.
Chem. Sot., 89, 729 (1967). 16. CASASSA, E. F., AND EISENBERG, H., J. Phys. Chem., 66, 427
(1961). 17. COHEN, G., AND EISENBERG, H., Biopolymers, 6, 1077 (1968). 18. SENTER, J. P., Ph.D. thesis, University of Virginia (1966). 19. SCHACHMAN. H. K., AND LAUFFBR. M. A., J. Amer. Chem. Sot..
71, 536 (lb49). ’ 20. HENDERSON, R. F., HENDERSON, T. R., AND WOODFIN, B. M..
J. Biol. Chem., 246, 3733 (1970).
by guest on June 7, 2018http://w
ww
.jbc.org/D
ownloaded from

Ching-Hsien Huang and James P. CharltonSPECIFIC VOLUMES BY SEDIMENTATION VELOCITY METHOD
Studies on Phosphatidylcholine Vesicles: DETERMINATION OF PARTIAL
1971, 246:2555-2560.J. Biol. Chem.
http://www.jbc.org/content/246/8/2555Access the most updated version of this article at
Alerts:
When a correction for this article is posted•
When this article is cited•
to choose from all of JBC's e-mail alertsClick here
http://www.jbc.org/content/246/8/2555.full.html#ref-list-1
This article cites 0 references, 0 of which can be accessed free at
by guest on June 7, 2018http://w
ww
.jbc.org/D
ownloaded from


![I i pase-cat al y zed hydrolysis phosphatidylcholine of ... · PDF filephosphatidylcholine of guinea pig very low density ... [ ''C]palm~toyl phosphatidylcholine and purified bovine](https://static.fdocuments.us/doc/165x107/5a83b0f17f8b9a682c8ef22c/i-i-pase-cat-al-y-zed-hydrolysis-phosphatidylcholine-of-of-guinea-pig-very-low.jpg)