
STUDIES ON ENDOGENOUS HORMONAL CHANGES DURING GRAIN ... · PDF fileSTUDIES ON ENDOGENOUS...
192
STUDIES ON ENDOGENOUS HORMONAL CHANGES DURING GRAIN DEVELOPMENT IN WHEAT GENOTYPES GUTAM SRIDHAR DIVISION OF PLANT PHYSIOLOGY INDIAN AGRICULTURAL RESEARCH INSTITUTE NEW DELHI-110 012 2003 Nature Precedings : hdl:10101/npre.2010.4821.1 : Posted 25 Aug 2010
Transcript of STUDIES ON ENDOGENOUS HORMONAL CHANGES DURING GRAIN ... · PDF fileSTUDIES ON ENDOGENOUS...

STUDIES ON ENDOGENOUS HORMONAL CHANGES DURING GRAIN DEVELOPMENT
IN WHEAT GENOTYPES
GUTAM SRIDHAR
DIVISION OF PLANT PHYSIOLOGYINDIAN AGRICULTURAL RESEARCH INSTITUTE
NEW DELHI-110 012
2003
Nat
ure
Pre
cedi
ngs
: hdl
:101
01/n
pre.
2010
.482
1.1
: Pos
ted
25 A
ug 2
010

Dedicated to My Parents,
Teachers, Friends &
Well wishersNat
ure
Pre
cedi
ngs
: hdl
:101
01/n
pre.
2010
.482
1.1
: Pos
ted
25 A
ug 2
010

ACKNOWLEDGEMENTS
I express my deep sense reverent and gratitude to the chairman of my
advisory committee Dr. Virendra Nath, Principal Scientist, Division of Plant
Physiology for his inspiring guidance during the course of this investigation. I am
immensely indebted to him for his affection and help rendered to me in several
ways. I must acknowledge that it has been a rare privilege for me to work under
his valuable guidance during my research programme.
I express my gratitude and reverence to Dr. G.C. Srivastava, Co-Chairman
of my Advisory committee and Head, Division of Plant Physiology for his unstinted
support, inspiring attitude and ever-willing help throughout the period of my study
and research.
I sincerely thank all the members of my Advisory Committee, Dr. Santosh
Kumari, Dr. S.D. Singh, Dr. Ranbir Singh who helped me now and then with useful
suggestions and guidance. I am particularly grateful to Dr. Santosh Kumari for
helping me in extraction of plant hormones, critically going through the manuscript
during my course of investigation.
I express my sincere thanks to Dr. P.S. Deshmukh, Professor, Division of
Plant Physiology, for his inspiring suggestions, love and affection during my study
and research.
A formal note of acknowledgement is scarcely adequate to express my deep
sense of gratitude to Dr. S.S. Singh, Principal Scientist & Progamme Leader,
Wheat Improvement, Division of Genetics, for providing me the seed material, Dr.
Devakumar and Dr. Prem Dureja, Principal Scientists, Division of Agricultural
Chemicals, for providing me the necessary facilities and guidance in analyzing the
hormones by HPLC, Dr. Malavika Dadlani, Principal Scientist, Mrs. Veena Vashisht,
Division of Seed Science and Technology, for providing me the necessary facilities
for sugar and starch estimation in seeds.
Nat
ure
Pre
cedi
ngs
: hdl
:101
01/n
pre.
2010
.482
1.1
: Pos
ted
25 A
ug 2
010

It is a privilege to express my gratitude to Dr. M. Pandey, Former
Professor, Dr. U.K. Sengupta, Dr. J.D.S. Panwar, Dr. R.K. Sai Ram, Dr. M.C.
Ghildiyal, Dr. Madan Pal, Dr. V.P. Singh, Dr. C. Viswanathan and other scientists
and faculty, Division of Plant Physiology for their inspiring suggestions, constant
help during the course of the investigation.
I find no suitable words and appreciation to Dr. M.B. Chetti, Professor and
Head, Department of Crop Physiology, University of Agricultural Sciences,
Dharwad for his constant guidance, valuable suggestions, fruitful criticism and
ever ending affection. I confess that it had been a proud privilege for me to be
associated with him since my M. Sc. (Agri.) programme. I am also thankful to Mrs.
Abhinetri Chetti and lavanya for their ever lasting love and affection bestowed on
me.
I am very thankful to Mrs. Sangeetha Khetrapal, Dr. Attar Singh, Dr. Sita
Ram, Dr. D.V. Singh, and Mrs. Smitha for their ever-willing help and kind co-
operation during my studies.
I am very thankful to all my seniors Dr. B. Sreekanth, Dr. Pankaj Kumar, Dr.
Pravin Prakash, Dr. T. Sivakumar, Dr. V.G.S. Naidu, Dr. Renu Pandey, Satchidanand
& Vijaya and to all my batch mates and juniors, Rajib-Das, Sumesh, Kiran, Smitha,
Sarika, Pushpalatha, Jagadeeshan, Prabhu, Vaibhav, Chandra-Gupta, Vijai, Sujatha,
Naveen, Linga, Ezhilmathi, Tejpal-Singh for their kind help, guidance, love and
care showed on me during my stay at the campus.
My stay at the campus was very fantastic and rich because of my friends, I
am very much indebted to Siddhartha & Sumi, Chakri & Maya, Tsering & Dekyi,
Meera & Satya, Salim, Chalpi, Laddu, Malthakka, Padmajakka, Muniratnam sir,
Kalps, Rapaka, Vijay, Suwerna, Pratik, Subrato-Dutta & Mittu, Patil, SuriBabu,
Naidu, Debasis, Vasu, Tallatam, G.V., Seshu sir, Srinu, Phani, Nirupa, Chukka,
Dipali, Krishna Rao, Sambaiah, Barathidasan, Hemanth, Anji, Senthil, Patro,
Prasad, Sribash Roy, Parag, Girish, Azghar, Ramesh, Suresh-A, Lijo, Anil, Jagan,
Regi, Tarun Amit, chandrashekar, Bijul, Mrinal, Siva Kumar, Jagdish, Jain, Lal,
Khayuum, Trinadh, Suchi, Rampi, Prasanta da, Ranjan da, Petikam, Janiah, Jeevan,
Nat
ure
Pre
cedi
ngs
: hdl
:101
01/n
pre.
2010
.482
1.1
: Pos
ted
25 A
ug 2
010

Manohar, Biju, Gavas, Prasad-tv, Venku, Satish, Praveen, Suresh, Vani, JP,
Emmanuel, SP-Ananadakumar, Mahavishunu, Bhurhan, Anoop-Das, Satish-Kawade,
Sandeep, Rambabu, Velumurgan, Ashok, Adarsha, Dayanand, Dr. Rajendra-Prasad,
Chandru, Mohan, Surendra, Dr. Kaplana, Pratima, and many others. This list is not
an end, many more persons are to be acknowledged.
My deep sense of gratitude is due to Mrs. and Mr. Hooda for their love,
affection and constant help during my stay at this campus. I will be failing in my
duty if I forget to extend my sincere thanks to all those at IARI, New Delhi and
also at UAS, Dharwad who rendered their helping hand either directly or
indirectly, kind co-operation and contribution to this endeavour.
One uses the choicest of words to measure the encouragement rendered
by someone who is close to heart. But, I find any such measure inadequate to
quantify the sacrifice, help, love and affection shown to me by beloved friend
Parus and sister Radhoos.
I find no words to express my indebtedness for being the reason of my
happiness, smile on my face, charm in my life and confidence of my future i.e., my
Sailu kuttu.
Above all I must thank my mother, father, brothers, sisters, chinnanas,
chinnamas, uncle, aunty, brother-in-laws, vadina, niece, nephew, and grand father
for their sacrifices, encouragement and affection for the success of my studies.
I am grateful to IARI for all the necessary facilities and for the award of
Institute Fellowship during my period of study.
Finally, I must be grateful to D. Vijay who has neatly designed my
manuscript and was there when I am in need and Mounica for helping in formatting
the manuscript of this thesis in the final form.
Date: 31-12-2003 (Gutam Sridhar)New Delhi
Nat
ure
Pre
cedi
ngs
: hdl
:101
01/n
pre.
2010
.482
1.1
: Pos
ted
25 A
ug 2
010
1. INTRODUCTION
The success of food grain production in India over the years is
attributed mainly to the performance of wheat crop. Wheat is the
most important Rabi season crop in the country, occupying about 50
per cent of the total area under food crops and accounting for more
than 70 per cent of the total grain production in Rabi The present
world wheat production is about 600 million tonnes. During the crop
year 2000, India harvested 75.57 million tonnes of wheat and for the
last four years it is the second largest producer of wheat in the world
(Anonymous, 2002). The latest estimate for the 2002-2003, is about
70.26 million tones from an area of 24.34 million hectares with a
productivity 2.9 t/ha. (Anonymous, 2004).
The native Indian wheat grain is globally recognized for its
quality and has always been in demand from overseas clients. One
reason for its popularity is that, unlike other cereals, wheat contains a
high amount of gluten, the protein that provides the elasticity
necessary for excellent bread making. Although over 30, 000 varieties
of wheat exist, two major types are bread and durum wheat. The
durum wheat, which is used today to make pasta, macaroni etc., is a
tetraploid; while, the one which is used for batter based products is
hexaploid (Triticum aestivum). Durum is a high value crop owing to its
Nat
ure
Pre
cedi
ngs
: hdl
:101
01/n
pre.
2010
.482
1.1
: Pos
ted
25 A
ug 2
010

use in value-added products. The commercially grown hexaploid
bread and tetraploid pasta wheat occupy one fourth of the world’s
cultivated area and account for 30 per cent of total world grain
production (Salunkhe et al., 1985).
The development of new plant architecture with semi-dwarf
types replacing the traditional tall types resulted in increasing wheat
yields from 1.0 t/ha in early 1960’s to nearly 2.9 t/ha in late 1990’s
was a remarkable achievement, due to which, India witnessed green
revolution. Still, to keep pace with the burgeoning population, it is
expected that India would need 109 million tons of wheat by 2020
and to achieve this, the productivity has to be increased to 4.0 t/ha
from the present level of 2.9 t/ha. Efforts are being made in this
direction and Indian Agricultural Research Institute (IARI) has initiated
strategic research to develop new plant types in 1994-95. The
process of creating a new variety takes several years. Nevertheless,
the new plant types developed at IARI in 2000 has large panicles,
higher number of grains per spike, 1000-grain weight, biomass and
increased sink size.
Efficient assimilate partitioning has generally being considered
as a factor in the regulation of plant productivity, but the basis of its
control has not been fully exploited. However, Jenner (1974) affirmed
that the genotypic variation in grain weight of wheat results from the
interaction between potential storage capacity/volume and realization
2N
atur
e P
rece
ding
s : h
dl:1
0101
/npr
e.20
10.4
821.
1 : P
oste
d 25
Aug
201
0

of this potential. The variation in grain filling is also the result of
interaction between the availability of assimilates to the grain,
metabolism of intermediates and synthesizing complex (Jenner and
Rathjen, 1978).
The concept of source response to requirement of sink
envisages that the path of assimilate flow is not a limiting factor.
Vascular bundles could resist the movement of assimilates but this
resistance might be overcome by strong sink. The question, thus,
arises as what is the basis for differences in translocation behavior
between cultivars (Bhardwaj and Verma, 1985). There are many
reports that auxins, gibberellins, abscisic acid are involved in the
regulation of grain development (Karssesn, 1982; Davies, 1987;
Kende and Zeevaart, 1997; Hansen and Grossmann, 2000).
Suggestions have been made that plant hormones exert regulatory
effects on the direction and rate of translocation of assimilates,
though such a control has been denied by Wardlaw and Moncur
(1976).
Experiments initiated at Division of Plant Physiology, IARI, by
Virendra Nath and his associates has shown that the exogenous
application of benzyl adenine (@ 2 µg/ear) at the base of wheat ear in
PBW-343 and triticale (DT-46) at 6 days after anthesis (DAA)
significantly increased photosynthetic rate of flag leaf and developing
ear (Sivakumar and Virendra Nath, 2000). A study of shriveling
problem in triticale (poorly filled grains); BA treatment increased grain
3N
atur
e P
rece
ding
s : h
dl:1
0101
/npr
e.20
10.4
821.
1 : P
oste
d 25
Aug
201
0

dry matter accumulation which in turn resulted in better filling of
grains and increased grain weight, better filling of grains. Thus it
appears that variation in grain weight between wheat and triticale
might be due to different availabilities of growth promoting hormones
such as cytokinins (CKs) and assimilates (Sivakumar et al., 2001).
To understand role of cytokinins and abscisic acid (ABA) during
grain development in wheat PBW-343 and triticale, DT-46 and Eronga-
83, endogenous level of both hormones were quantified with High
Performance Liquid Chromatography (HPLC) along with invertase
activity in developing grains from 15 to 35 DAA at an interval of 10
days and noticed that high level of ABA content in the grains of
triticale might inhibits the grain growth by reducing photo assimilates
unloading to the developing grains in the earlier phase of grain
development, however, its reduction in later phase might be causing
gain shriveling due to improper maturation of the gains. The high
level of invertase activity in wheat might have increased the phloem
unloading process effectively to the developing grains from the
source leaves and rachis, which might be the factor contributing for
better grain development n wheat than triticale (Sivakumar, 2002).
However little is known about the grain filling rate, which is a
key factor in increasing the yield potential of new plant types
developed at IARI, and whether and how plant hormones are involved
in the process. Keeping this in view, the present work regarding grain
filling rate among hexaploid and tetraploid wheat genotypes and
4N
atur
e P
rece
ding
s : h
dl:1
0101
/npr
e.20
10.4
821.
1 : P
oste
d 25
Aug
201
0

quantification of endogenous levels of IAA, gibberellic acid (GA3) and
ABA during post anthesis was initiated with the following objectives,
1. to determine the grain growth rate in various wheat
genotypes,
2. to determine the changes in endogenous hormonal content
in the grains during grain development and
3. to correlate changes in endogenous hormonal content with
grain development and yield components.
5N
atur
e P
rece
ding
s : h
dl:1
0101
/npr
e.20
10.4
821.
1 : P
oste
d 25
Aug
201
0

2. REVIEW OF LITERATURE
The role of plant growth hormones during the grain
development process and their effect on different physiological
processes is reviewed here under different crops.
2. 1 HORMONAL REGULATION OF GRAIN DEVELOPMENT
Plant hormones are considered as key regulators to seed
development (Davies, 1987; Brenner and Cheik, 1995). The evidence
for the regulatory functions of cytokinins has been obtained by
correlation between grain weight and the level of endogenous
cytokinins in barley and wheat by Michael et al. (1970) and Herzog
and Geisler (1982). The highest amounts of cytokinins were recorded
at the early growth stages, viz., heading or anthesis or at milk stage,
suggesting that the cytokinins may play important role in grain
development (Takagi et al., 1989). Analysis of cytokinin levels in
developing grains of wheat and rice grains has shown a large
transient increases in zeatin (Z) and zeatin riboside (ZR) contents,
which coincided with the period of maximum endosperm cell division
(Morries et al., 1993). Analysis of maize grains by Dietrich et al.
(1995) reported that Z and ZR concentrations peaked 9 days after
pollination (DAP) and during the period 8-10 DAP, significant increase
in cytokinin oxidase specific activity, thus indicating that the cytokinin
Nat
ure
Pre
cedi
ngs
: hdl
:101
01/n
pre.
2010
.482
1.1
: Pos
ted
25 A
ug 2
010
catabolism was enhanced as endosperm cell division stopped. Yang
et al. (2000) reported that grain filling per cent was significantly
correlated with Z+ZR contents in the grains and roots at the early
and middle grain filling stages, but IAA and GA (GA1+GA3+GA4)
contents in the grains and roots were not significantly correlated with
the grain filling per cent suggesting that the cytokinins in the grains
and roots during the early phase of grain development play an
important role in regulating the grain filling pattern and consequently
influence the grain filling percentage.
In an experiment, Borkovec et al. (1990) reported that the
higher levels of zeatin and zeatin riboside contents in grains of wheat
cultivars and suggested that at the time or before anthesis there
would be substantial accumulation (due to intensive transport,
probably from the roots) of cytokinins, available for the early grain
development. Wheeler (1976) reported that the change in cytokinin
activity in the ears was possibly related to the early flowering in the
middle of the ear. In an experiment, Herzog (1982) reported that the
effects of exogenous cytokinins (CK’s) were consistent with the
spikelet removal, suggesting that CK’s participate in a joint regulation
of source and sink activity during grain filling.
Results of Asthir et al. (1998) revealed that gibberellins and
cytokinins act as positive modulators of grain sink activity, whereas,
ABA acts as a negative modulator. It was confirmed by Ahmadi and
Baker (1999) by exogenous application of ABA, (0.1 mM) that there
6N
atur
e P
rece
ding
s : h
dl:1
0101
/npr
e.20
10.4
821.
1 : P
oste
d 25
Aug
201
0

was a reduction in transport of sucrose into the grains and lowered
the ability of starch synthesis in intact grains. Ober (1991)
demonstrated that ABA could be translocated from leaf tissue to
grains and acts as a sensory link between developing reproductive
structures and maternal tissues deprived of water and also ABA may
influence early establishment of sink size through regulation of cell
number. Lee et al., (1989) stated that by limiting sucrose supply to
the ear, did not alter the levels of IAA or zeatin/zeatin riboside in
either grains or bracts of detached ears except for ABA, which
increased in the distal and proximal grains showing the regulatory
role of ABA. Both field and pot trials of Goldbach (1975) indicated
that ABA content in the grain increased up to the start of grain
ripening and then decreased gradually with the cessation of dry
matter accumulation and rapidly later as the moisture content of the
grain decreased.
Experiments with 14C-IAA by Wardlaw and Moncur (1976)
suggested that the auxin production in the developing grain was not
responsible for the assimilate translocation through the peduncle.
Bangerth et al. (1985) reported that the IAA content in grains at
various positions within wheat cultivars (Solo and Kolibri) increased
rapidly from approximately 8 to 20-30 days after anthesis, and then
decreased. Differences in spikelet IAA content in different regions of
the ear and among florets within a spikelet were positively correlated
with the differences in dry matter accumulation. IAA inhibited the
7N
atur
e P
rece
ding
s : h
dl:1
0101
/npr
e.20
10.4
821.
1 : P
oste
d 25
Aug
201
0

seed set and grain filling in later developed panicles due to apical
dominance on grain development (Xu et al., 1997). The levels of
endogenous growth regulators (IAA, ABA, GA and zeatin) were
estimated in the developing wheat grains collected at 10, 20, 30 and
40 days after anthesis (DAA) using GLC by Singh et al. (1989) and
found that Zeatin (11.0 µg/grain) and GA (0.45 µg/grain) contents
were maximum at 10 and 20 DAA, respectively; whereas, IAA and
ABA contents were highest (4.3 and 2.2 µg/grain, respectively) at 30
DAA. They suggested that growth regulators act as mobilizing centers
in the developing grains.
Grains in the upper and/or the lower part of the panicle were
analysed for endogenous plant hormones by Duan et al., (1999) and
found peak contents of ABA and/or GA1+3 in the developing grains at
about the same stage when the highest rate of increase of grain
appeared in the upper and in the lower part of the panicle,
respectively. After heading, the IAA content in developing grains
decreased steadily in both upper and the lower parts of the panicle,
while GA4+7 content decreased at first and then increased, and
decreased again. At early grain-filling stage, the ABA and GA1+3
contents in the developing grains were higher in the upper than in the
lower part of the panicle.
There was an increase in ABA content during grain development
in wheat and loss of ABA from the grain occurred on cessation of
grain growth and drying of the grain (King, 1979). In pot trials with
8N
atur
e P
rece
ding
s : h
dl:1
0101
/npr
e.20
10.4
821.
1 : P
oste
d 25
Aug
201
0
spring wheat cultivars Kolibri and Solo, the dry weight distribution and
auxin levels were investigated at various positions on the ear by
Aufhammer and Bangerth (1982). They found that auxin levels reach
the maximum before the dry weight increase. The auxin levels
between different grain fractions from the basal, central or upper
regions of the ear were found to be positively correlated with grain
weight. Bhardwaj and Verma (1987) reported that the developing
grains are capable of producing higher levels of auxins and could
mobilize greater proportions of assimilates from flag leaf to grains,
leading to their higher accumulation in grains and resulting in bold
size grains at maturity.
You et al. (1997) showed that the contents of IAA and GA1+3+4+7
were less in young wheat panicles of male sterile lines, WAV41A and
KV41A compared to V41B during the period when the young panicle
developed. It was suggested that the level of male sterility is related
to the loss of endogenous hormone especially, IAA. Hess et al. (2002)
quantified the hormones in the developing embryo and ovules in
wheat and found that IAA content remained low through 9 days post
anthesis (DPA) at about 6 μmol kg-1 dry weight and then increased
sharply to about 38 μmol kg-1 dry weights by 19 and 25 DPA. In
contrast, embryo IAA content decreased from about 38μ mol kg-1 dry
weight at 13 DPA to about 15 μmol kg-1 dry weights at 19 and 25 DPA.
Endosperm ABA content fluctuated between 1.0 and 4.5 μmol kg-1 dry
weight between 6 and 25 DPA; while embryo ABA content fluctuated
9N
atur
e P
rece
ding
s : h
dl:1
0101
/npr
e.20
10.4
821.
1 : P
oste
d 25
Aug
201
0

between 3.4 and 4.8 μmol kg-1 dry weight between 13 and 25 DPA.
They were of the opinion that these hormonal changes may be
involved in the co-ordinated development of embryos in ovule.
2. 2 PHYSIOLOGICAL PARAMETERS
Saha et al. (1980) reported that the total photosynthetic area
above the flag leaf node, comprising leaf sheath, flag leaf, peduncle
and head, was highly correlated with grain yield per ear and among
them, the highest correlation was found for flag leaf area. A strong
dependence of flag leaf photosynthesis in wheat was found on the
level of requirement for assimilates by the developing grains (Birecka
and Dakic Wlodkowska, 1963; King et al., 1967). However,
photosynthesis was shown to be independent of the level of
assimilate requirement by the ear (Lupton, 1968; Apel et al., 1973;
Austin and Edrich, 1975). Pearman et al. (1979) reported that the
photosynthetic productivity of the second leaf during the grain filling
period was about half that of the flag leaf.
Herzog (1980) reported that in the first half of the linear phase
of growth phase (14 to 28-35 days from heading), the grain
development was not related to leaf characteristics like chlorophyll
content, assimilation rate per unit area and no marked transport of
assimilates from the leaves took place. In the second half of the linear
growth phase (28-35 to 42-49 days from heading) the relation
between leaf characteristics and grain growth became closer and the
10N
atur
e P
rece
ding
s : h
dl:1
0101
/npr
e.20
10.4
821.
1 : P
oste
d 25
Aug
201
0
latter was correlated with the degree of leaf senescence. Vos et al.
(1979) reported that under controlled conditions of high irradiance,
maximum rates of photosynthesis in the wheat varieties Opal and
Orca were 29.4 and 23.5 mg CO2/dm2/h, respectively. Measurements
of net photosynthesis of the flag leaf blade and ear for each at
intervals after anthesis indicated that at the completion of grain
development period, a sources of carbohydrate were still available for
continued development at all temperatures (Chowdhury and
Wardlaw, 1978). Three tall and 33 short bread wheats derived from
Norin 10, eight short durum wheats and four triticales were examined
by Fischer et al. (1981), and among the short bread wheats,
photosynthetic activity four weeks before anthesis and pre-anthesis
growth rate were positively correlated with the mature plant height.
Photosynthetic activity was also positively correlated with the growth
rate during grain filling and yield. Muller (1986) reported that the
estimated characteristics of maximum net photosynthetic rate, gas
phase diffusive conductance and photorespiration rates decreased
from ear emergence to waxy ripeness.
Caley et al. (1990) observed that the peak photosynthetic
activity at 20 d after anthesis was coinciding with the maximum
chlorophyll content in the pericarp green layer. Dong (1991) reported
that the canopy photosynthesis during grain filling was positively
correlated with the grain yield and 1000-grain weight. Pande et al.
(1995) found that the rate of post-anthesis flag leaf photosynthesis
11N
atur
e P
rece
ding
s : h
dl:1
0101
/npr
e.20
10.4
821.
1 : P
oste
d 25
Aug
201
0

reduced drastically in IWP-5308 genotype resulting in lower grain
density. Gent and Kiyomoto (1992) reported that wheat yields are
correlated with the photosynthesis and dark respiration per unit
ground area from heading to anthesis (r=0.7).
Wang et al. (1997) reported that over 60 per cent of total 14CO2
assimilated by late sown winter wheat during grain filling was
assimilated in the leaf blades; while, 15, 11 and 11 per cent was in
the spikes, leaf sheaths and stem internodes, respectively. Foti (1994)
reported that the net photosynthesis of durum wheat spikes was
almost completely due to activity in the awns and spikes grown
without awns produced a grain dry weight almost 8 per cent lower
than awned spikes. Guo et al. (1995) observed that sink capacity
increased with the higher increase in leaf photosynthesis and the
translocation of photosynthates to ears. Flag-leaf photosynthesis
measured by Reynolds et al. (1994) at booting, anthesis and at grain
filling stages on different sowing dates was significantly correlated
with the grain yield. Shuting (1994) found maximum values for
canopy apparent photosynthesis (CAP) between 4-6 g CO2/m2/h at
anthesis stage and it decreased with the age and at grain filling
stage.
Liu (1980) reported that the chlorophyll content was positively
correlated with the net photosynthetic rate, but, Ashraf et al. (1995)
reported that the leaf chlorophyll content was not correlated with
higher yield in the genotypes tested. Austin et al. (1987) reported
12N
atur
e P
rece
ding
s : h
dl:1
0101
/npr
e.20
10.4
821.
1 : P
oste
d 25
Aug
201
0

that the diploid species have greater total chlorophyll and chl. a/b
ratio than hexaploids. Siddique et al. (1989) were of the opinion that
decrease in chl. a/b ratio in modern varieties indicates a decrease in
PSII reaction center complex relative to light harvesting chl. a/b
protein complexes and thus suggesting a loss of adaptation to high
irradiance.
Stomatal conductance was also significantly correlated with the
performance at all the three stages. The rate of post-anthesis flag leaf
photosynthesis declined drastically in IWP5308 when compared with
the Sel-111, which could explain its lower grain density. The study
showed that the rate of post-anthesis flag leaf photosynthesis and
water relation parameters of the developing grain could largely
explain the constraints in realization of potential synthetic and
storage capacity of wheat genotypes with improved structural
components (Pande et al., 1995).
Pramod Kumar et al. (1998) reported that the stomatal
conductance and transpiration rate, although possessed a significant
positive association with photosynthesis, their association with grain
yield was not significant. Frederick (1997) found in the cultivars of
wheat that flag leaf CO2 exchange rate (CER) and stomatal
conductance began to decrease near the beginning of grain filling.
The photosynthesis was found to be positively and significantly
associated with stomatal conductance, transpiration rate and total
biomass in buck wheat (Subrahmanyam and Dutta, 2000).
13N
atur
e P
rece
ding
s : h
dl:1
0101
/npr
e.20
10.4
821.
1 : P
oste
d 25
Aug
201
0

2. 3 SUGARS AND STARCH
Jiang et al. (2001) reported that total soluble sugars and
sucrose contents in the grain of winter wheat (Triticum aestivum)
decreased during grain filling stage. Studies of Kumar (1980) revealed
that the levels of total sugars, reducing and non-reducing sugars,
fructose and sucrose increased up to 14 days after anthesis (DAA)
and then declined up to 28 DAA in wheat. The active starch synthesis
started at 14 DAA and continued up to 35 DAA and starch
phosphorylase activity was especially higher during early grain
development, while starch synthase I (ADP glucose α-glucan 4-α-
glucosyltransferase) had a maximum activity during grain filling
(Mengel and Judel, 1981). Major differences between as well as within
genotypes for protein and carbohydrate accumulation during seed
development over the growth stages were observed by Singhal et al.
(1989) and the 18-24 days after anthesis was favorable for
carbohydrate biosynthesis.
The experiments of Kumar and Singh (1981) revealed that
active starch synthesis started from 14 days onwards and continued
until 35 days after anthesis and the free sugars (total, reducing and
non-reducing sugars and sucrose) per grain closely followed the
changes in the rate of starch accumulation and, in general, were
maximum at 14-day stage followed by a decline up to 28 days, with
no significant alteration afterwards. None of the sugars had a
14N
atur
e P
rece
ding
s : h
dl:1
0101
/npr
e.20
10.4
821.
1 : P
oste
d 25
Aug
201
0
significant relationship with either grain size or starch content.
Similarly, Zamski and Grunberger (1995) found a gradual increase in
insoluble sugar concentration (starch and fructan) in the ear peduncle
during the first month after anthesis, followed by a sharp decrease
later in both control and GA treated plants.
Jenner (1979) stated that there is a mechanism operating
during the early stages of grain development (before grain-filling
begins), which can influence the capacity of the endosperm to
accumulate starch, while the capacity to accumulate protein is not
subject to the same kind of control. During grain filling (12-27 days
after anthesis) there was a decrease in sucrose consumption in high-
yielding varieties than the low yielding ones (Biryukov and Komarova,
1986). The former accumulated more dry matter in the ear than the
latter; while, the latter tended to accumulate more dry matter in the
ear-bearing stem. The lower yielding group had a higher starch/sugar
ratio than the high yielding group.
Changes in carbohydrate metabolism in developing wheat
grains were studied by Kaur and Singh (1987) and found that most of
the biochemical activities occurred between 20 and 30 DAA. Jenner et
al. (1990) concluded that the rate and duration of starch and protein
deposition in the grain are essentially independent events and are
controlled and influenced by different factors. Caley et al. (1990)
suggested that starch synthase may be a rate-limiting enzyme for
starch accumulation and hence the dry weight. They also concluded
15N
atur
e P
rece
ding
s : h
dl:1
0101
/npr
e.20
10.4
821.
1 : P
oste
d 25
Aug
201
0
that termination of starch deposition might not be due to lack of
starch synthase activity. The starch content was found to increase
during grain maturation and reached 65.1, 70.2 and 74.4 per cent in
the wheat cultivars Roblin, Dongnong 7742 and Xinkehan 9,
respectively (Liu and Li, 1996)
In field studies at Rajkot, Chanda et al. (1999) observed that the
absolute rates of starch and dry matter accumulation were highest in
Lok-1 followed by Sonera and Raj-1555. The reducing and non
reducing sugars were found to be high during early stage and
declined with advancement in growth up to almost middle of the grain
growth. However, at later stages, there was again increase in the
levels of reducing and non reducing sugars. Takahashi et al. (1994)
were of the opinion that water soluble sugars accumulate in the culm
during day time and are translocated to the grains at night. While
total soluble sugars increased throughout the grain development
(Sekhon and Singh, 1994).
2. 4 GROWTH PARAMETERS
Takahashi et al. (1993) divided the grain filling period in wheat
into four phases:
• Initial grain filling (from anthesis to cessation of culm elongation)
where assimilates are used mainly for culm elongation and the
dry weight of the grains increase slightly.
16N
atur
e P
rece
ding
s : h
dl:1
0101
/npr
e.20
10.4
821.
1 : P
oste
d 25
Aug
201
0

• Early grain filling (from cessation of culm elongation to milk ripe
stage) where assimilates are used for both grain growth and culm
reserve.
• Late grain filling (from milk ripe stage to termination of
photosynthesis) where assimilates are used entirely for grain
growth and the culm reserve is also translocated to the grain and
• Final grain filling (from the end of photosynthesis to maturity)
where grain growth is supported only by translocation of the
culm reserve, because assimilates are no longer being actively
produced.
LAI measurements made by Whitfield (1990) between ear
emergence and physiological maturity ranged from a maximum of 8
to a minimum of 0.2. The leaf area, LAI and leaf area duration were
found to have high significant positive association with grain yield
(Saharan et al., 1985). While, the differences for CGR, specific leaf
area and leaf area ratio were evident and significant between the
cultivars, but had no relationship with yield. El-Gawad et al. (1985)
found higher LAI at heading in cultivars Stork, Giza 155 and Sakha;
while, NAR and RGR increased with age until harvest and highest
whole plant RGR was achieved at 65-80 days after sowing.
Crop growth analysis by Gales (1983) showed that total dry
matter production was strongly correlated with light absorption,
which depended on seasonal variation in LAI. Plant growth analysis of
spring wheat cultivars by Spitters and Kramer (1986) showed that
17N
atur
e P
rece
ding
s : h
dl:1
0101
/npr
e.20
10.4
821.
1 : P
oste
d 25
Aug
201
0
relative growth rate decreased steadily with time due to decline in
leaf area/unit plant weight (LAR) and reduction in leaf weight ratio.
Herzog (1980) reported that grain growth was slow in the lag phase
(0-14 days from heading) and the specific leaf dry weight increased in
six winter wheat cultivars. The green area duration from heading to
ripening has been found to be very closely correlated to grain yield
(Welbank et. al., 1966 and Spiertz et. al., 1971).
Rahman et al. (2000) reported that leaf photosynthesis and
crop growth rate were highest at anthesis (70-75 DAS) and leaf area
index was maximum at booting stage (60 DAS). Van et al. (1996)
stated that wheat cultivars with highest leaf area ratio had higher
RGR. He further stated that plants potential RGR is one of the many
traits that influence the final biomass production in annual crop
species like wheat. Under optimal conditions, plants with higher
inherent RGR can potentially produce more biomass and exploit
resources to a larger extent than those with lower growth rate.
Pramod Kumar et. al. (1998) reported that a positive association of
leaf photosynthetic rate, total dry matter production, specific leaf
weight, absolute growth rate, relative growth rate, net assimilation
rate and harvest index with grain yield in various wheat genotypes.
Simane et al. (1993) concluded that biomass allocation is the
major factor explaining variations in RGR among the investigated
durum wheat (Triticum turgidum L. var. durum) cultivars.
Subrahmanyam and Dutta (2000) reported that the specific leaf mass
18N
atur
e P
rece
ding
s : h
dl:1
0101
/npr
e.20
10.4
821.
1 : P
oste
d 25
Aug
201
0

of buckwheat exhibited a strong positive association with the rate of
photosynthesis and total dry matter. But, according to Ashraf et al.
(1995), leaf area was not correlated with grain yield in the tested
genotypes of wheat. Gent and Kiyomoto (1992) reported in their
experiments in 1986 and 1987, that the grain yield was positively
correlated with positively high leaf area before heading (r=0.8).
While, Frederick (1997) reported a decline in LAI prior to grain filling.
2. 5 TRANSLOCATION AND GRAIN FILLING
The growth of a wheat grain follows a recognized pattern of
three phases. Following anthesis, there is a short period of
exponential growth, sometimes referred to as the lag phase. During
the lag phase, the endosperm cells divide rapidly and the potential
size of the grain is determined (Brocklehurst, 1977). During the
second phase, starch is deposited in the endosperm with an increase
in grain milk and become dough-like consistency. In this phase, the
rate at which dry matter is deposited in the grains is usually
considered to be constant. The final phase begins when lipids start
depositing in the phloem strands supplying the grain with assimilate
and the growth of the grain ceases (Zee and O’Brien, 1970).
Estimated grain growth rates during the liner phase was 0.5 mg day-1
(Simons and Crookston, 1979) to 2.3 mg day-1 (Sofield et al., 1977)
depending upon the temperature, genotype, grain position, moisture
and nutrient status of the plant.
19N
atur
e P
rece
ding
s : h
dl:1
0101
/npr
e.20
10.4
821.
1 : P
oste
d 25
Aug
201
0

The pattern of translocation of 14C-labelled compounds in flag
leaf assimilates in wheat (Triticum aestivum L. cv. Gabo) during grain
development indicated that there was greater assimilate requirement
by the ear, the more rapid was the speed of movement of assimilates
through the peduncle to the ear and lower was their concentration
(Wardlaw and Moncur, 1976). Cruz-Aguado et al. (1999) reported that
changing inherent source-sink ratio modified the pattern of flag leaf
14C assimilate partitioning and resulted in increased retention of 14C in
flag leaf and changed the pattern of outflow to other organs. The
participation of stem reserves in grain filling and the existence of
genotypic differences corroborated in response to availability of
photoassimilates.
Blum et al. (1994) observed genotypic differences in the pattern
of allocation and mobilization of dry matter in the stem of wheat.
Yang et al. (2001) stated that remobilization and transfer of the pre-
stored food in vegetative tissues to the grains in monocarpic plants
require the initiation of whole plant senescence. Herzog (1982)
concluded that changing the ratio of source and sink size influence
grain weight by creating different intrinsic growth potentials in the
grains. The estimated duration of grain growth from anthesis to
physiological maturity vary from 17 days (Van Sanford, 1985) to 38
days (Gebeyehou et al., 1982). The genotypes with highest grain dry
weight had shorter duration and higher maximum rates of grain filling
(Duguid and Brule-Babel, 1994).
20N
atur
e P
rece
ding
s : h
dl:1
0101
/npr
e.20
10.4
821.
1 : P
oste
d 25
Aug
201
0

2. 6 YIELD AND YIELD COMPONENTS
Grain yield of wheat is determined by the number of ears per
unit area, number of grains per ear and grain weight (Evans, 1978).
Grain number and the duration of grain filling determine individual
grain weight (Ralph, 1984). Grain weight is also determined by factors
that affect grain volume (Millet and Pinthus, 1984). Differences in
grain weight of wheat genotypes as well as differences in weight
between the grains within a single wheat spike have been found to be
due primarily to differences in the rate of dry matter accumulation in
the grain (Pinthus and Sar-Shalom, 1978; Simmons and Crookston,
1979).
Whether grain filling and yield are limited by sink capacity or
assimilate supply depends strongly on the cultivar and environmental
conditions. It is thus probable that there will be more than one route
to increased yield and that the most appropriate route will depend on
cultivars and weather (Peat, 1985). The hexaploids generally have
more grains per ear than the tetraploids and the biomass and grain
yield/plant will be in the order of hexaploids, followed by diploids and
tetraploids (Kosina, 1981; Guzy et al., 1989).
Tuttobene et al. (1996) reported that there was increase in
grain yield of durum wheat increased with an increase in LAI up to a
value of 7.8 for Amedeo and 10.2 for Creso. Results of the Zamski and
Grunberger (1995) suggested that of the two high-yielding wheat
21N
atur
e P
rece
ding
s : h
dl:1
0101
/npr
e.20
10.4
821.
1 : P
oste
d 25
Aug
201
0

cultivars that usually give identical yields, the one with long
multispikelet ears (LE) and lighter grains had significantly greater
unexpressed potential for high yield than the cultivars with shorter
ears (SE) and heavier grains. The size of flag leaf was found to be
significantly correlated with grain yield/ear (r=0.512) and a relatively
close correlation (r=0.874) existed between the grain number/ear and
grain weight/ear (Apel and Lehmann, 1970). The grain fresh and dry
weights increased up to 40 DAA and decreased thereafter with
maturation in the studies of Singh et al. (1989) and the rate of dry
matter accumulation was maximum (1.8 mg/grain/day) between 20-
30 DAA. Duan et al., (1999) reported that the grain fresh weight and
grain filling rate at early grain development stage in rice (Oryza
sativa L.) were higher in the upper than in the lower part of panicles
during grain filling. Cai (1991) reported that rate of grain filling
increased to its highest rate at about 20 days after the beginning of
filling and then decreased.
Flag leaf labeled at flowering transported nearly 90 per cent of
14C assimilates to stem and glumes, and then reallocated to grain
before maturity Duan et al., (2000). While 70 per cent of total 14C-
assimilates in the flag leaf were exported to grain, which was the
predominant sink during grain filling. At the dough stage, only 13 per
cent of assimilates were exported to grain; while about 25 per cent
were partitioned to roots first and then redistributed to grain before
the full ripe stage. The grain fresh weight and grain filling rate at the
22N
atur
e P
rece
ding
s : h
dl:1
0101
/npr
e.20
10.4
821.
1 : P
oste
d 25
Aug
201
0

early grain development stage in rice (Oryza sativa L.) were found to
be higher in the upper than in the lower part of panicles during grain
filling (Duan et al., 1999; 2000).
Rawson and Ruwali (1972) divided the central spikelets of the
main ear in Kalyansona into 5 groups (a to e) from base to the apex.
They found that the grain growth rates for the greater part of filling
were in the order of b > a > c > d > e and the final weight/grain for
these florets was 42, 40, 37, 26 and 12 mg, respectively. Assimilate
deposition in the ears of spring wheat cvs. Kolibri and Solo (high and
low individual grain weights, respectively) was studied by Stamp and
Geisler (1976) and found that there was little difference between the
two cultivars in the rate of assimilate deposition in the ears during
first three weeks after ear emergence, but from the 4th and 5th
weeks, the rate of dry matter accumulation in individual grains was
26-29 per cent greater in Kolibri; than in Solo, which was mainly
responsible for the higher grain weight in Kolibri even though there
was longer period (5 days) of assimilate deposition.
Average harvest index and 100-grain weight were higher in
spring wheat populations with long grain-filling period (GFP) than
those with shorter GFP lines (Sharma, 1994). Many researchers
reported a positive correlation between GFP and grain yield (Spiertz
et al., 1971; Gebeyehon et al., 1982).
23N
atur
e P
rece
ding
s : h
dl:1
0101
/npr
e.20
10.4
821.
1 : P
oste
d 25
Aug
201
0

Guzy et al. (1989) reported that among fourteen diploids,
tetraploids and hexaploids of Triticum aestivum accessions, biomass
and grain yield per plant were highest for the hexaploids followed by
diploid and tetraploids while, the spike number was highest in diploids
followed by hexaploids and tetraploids. Bamakhramah et al. (1984)
examined twenty-nine accessions of Triticum for different yield
components and found that mean whole plant and main shoot
harvest index for the ploidy groups exhibited significant (p<0.01)
increase from diploid to tetraploids and from tetraploids to
hexaploids. They further found a marked reduction in shoot number
and per cent of fertile shoots per plant and increase in grain number
per spikelet and grain size from diploids to early tetraploids.
24N
atur
e P
rece
ding
s : h
dl:1
0101
/npr
e.20
10.4
821.
1 : P
oste
d 25
Aug
201
0

3. MATERIALS AND METHODS
Experiments were carried out to study the endogenous
hormonal changes during grain development in three hexaploid (DL
1266-1, DL 1266-2 and PBW 343) and three tetraploid (HD 4530,
8498 and PDW 233) wheat lines grown in cement pots of 30 cm x 30
cm x 50 cm size at the Pot culture of the Division of Plant Physiology,
Indian Agricultural Research Institute, New Delhi during Rabi seasons
of 2001-02 and 2002-03. The details of materials used and methods
adopted during the course of investigation are given in this chapter.
3.1 PLAN OF EXPERIMENT
The experiment consisted of the following details,
Location : Pot culture, Division of Plant Physiology, IARI,
New Delhi
Plant material:-
Hexaploid lines : DL 1266-1, DL 1266-2 (new plant types) and
PBW 343
Tetraploid lines : HD 4530, HI 8498 and PDW 233
3.2 SAMPLING PROCEDURE
Nat
ure
Pre
cedi
ngs
: hdl
:101
01/n
pre.
2010
.482
1.1
: Pos
ted
25 A
ug 2
010

The heading and flowering dates of individual panicles were
labeled and recorded. Ten to twelve labeled panicles were sampled at
7, 15, 25 and 35 days after anthesis (DAA) in each line. The spikelets
were divided into two parts: one was frozen in liquid nitrogen for
hormonal assay and the other one dried in oven at 80°C till a constant
weight was achieved, then dehulled and weighed for determining the
grain growth rate. For recording growth analysis parameters,
five pots were selected at random and the plants were sampled at 5,
15, 25 and 35 DAA and at harvest. Stem, leaves and ear portions of
the plants were separated and the data pertaining to growth analysis
were recorded.
3.3 GROWTH AND MORPHOLOGICAL CHARACTERS
3.3.1Plant height
The plant height was recorded from base of the plant to the
growing tip in five plants at different dates of sampling and the
average plant height was expressed in centimeters.
3.3.2Number of tillers per plant
The tillers were counted separately for five different plants and
the average value was recorded.
3.3.3Leaf Area (LA)
23N
atur
e P
rece
ding
s : h
dl:1
0101
/npr
e.20
10.4
821.
1 : P
oste
d 25
Aug
201
0
Leaf area was measured by leaf area meter (LICOR 3100) and
expressed as cm2/plant.
3.3.4Leaf weight (LW)
After the leaf area was recorded, the samples were dried at 80°
C for till a constant weight was achieved and dry weights were
recorded ad expressed as g/plant.
3.4 GROWTH ANALYSIS
For recording growth analysis, five pots were taken at each
sampling. Leaves stem and ear portions were separated and their dry
weights were determined. Leaf area was measured using leaf meter
(LICOR – 3100, USA). The data of dry weights of different plant parts,
total dry weight and leaf area were used for computing various
growth parameters. Grain growth rate, absolute grain growth rate,
relative growth rate of ear and absolute growth rate of ear was also
recorded simultaneously.
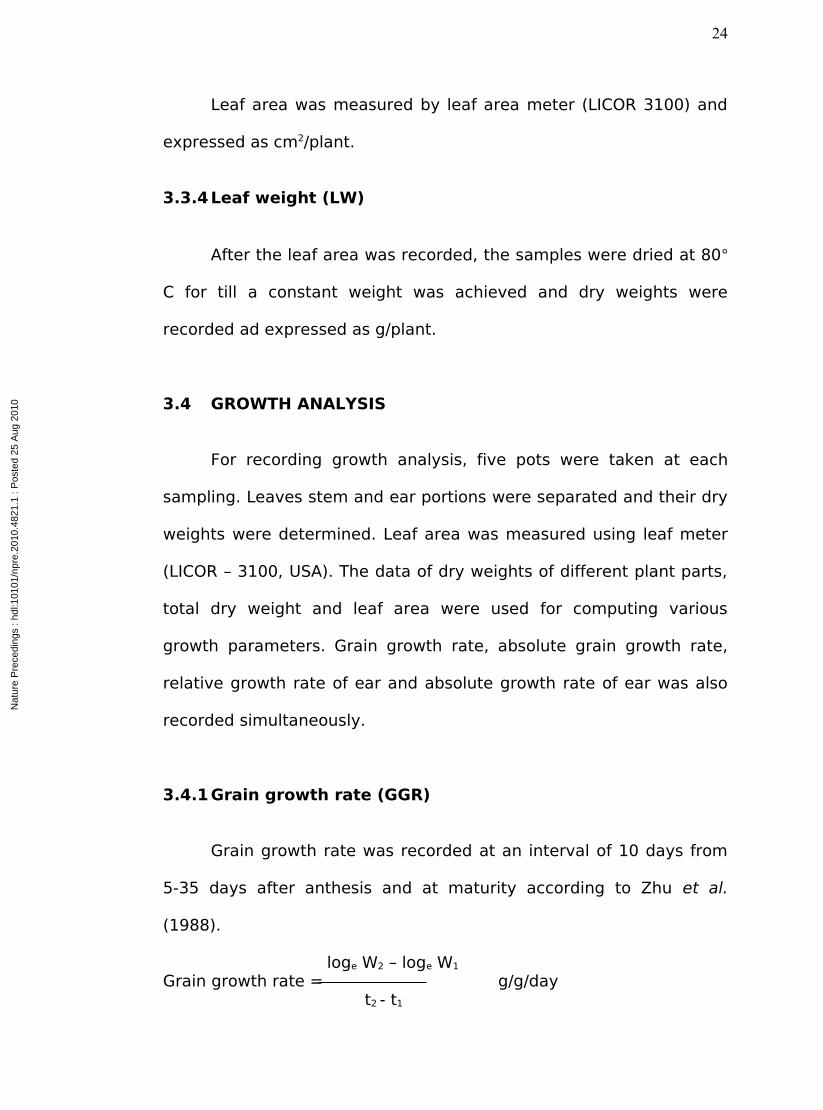
3.4.1Grain growth rate (GGR)
Grain growth rate was recorded at an interval of 10 days from
5-35 days after anthesis and at maturity according to Zhu et al.
(1988).
loge W2 – loge W1
Grain growth rate = g/g/day t2 - t1
24N
atur
e P
rece
ding
s : h
dl:1
0101
/npr
e.20
10.4
821.
1 : P
oste
d 25
Aug
201
0
where,
W1 and W2 are dry weights of grains at time t1 and t2,
respectively.
3.4.2 Absolute growth rate seed (AGR)
The absolute grain growth rate was calculated by using the
formula given by Radford (1967) and expressed in g/day.
W2 – W1
Absolute grain growth rate = g/day t2 – t1
where,
W1 and W2 are dry weights of grains at time t1 and t2,
respectively.
3.4.3Relative growth rate of ear (RGR)
Relative growth rate of ear was recorded at an interval of 10
days from 5-35 days after anthesis and at maturity according to Zhu
et al. (1988).
loge W2 – loge W1
Grain growth rate = g/g/day t2 - t1
where,
W1 and W2 are dry weights of ears at time t1 and t2, respectively.
3.4.4 Absolute growth rate of ear (AGR)
25N
atur
e P
rece
ding
s : h
dl:1
0101
/npr
e.20
10.4
821.
1 : P
oste
d 25
Aug
201
0

The absolute grain growth rate was calculated by using the
formula given by Radford (1967) and expressed in g/day.
W2 – W1
Absolute grain growth rate = g/day t2 – t1
where,
W1 and W2 are dry weights of ears at time t1 and t2, respectively.
3.4.5Relative growth rate (RGR)
Relative growth rate is the increase in dry weight per unit dry
weight per unit time and is expressed as g/g/day and calculated by
the formula of Blackman (1919) as follows,
loge W2 – loge W1
Relative growth rate = g/g/day t2 - t1
where, W1 and W2 are total dry weights of samples at t1and t2,
respectively.
3.4.6Net assimilation rate (NAR)
Net assimilation rate is the rate of increase in dry weight per
unit leaf area per unit time (Watson, 1952) and is expressed as g/m-
2/day. It was calculated by the formula of Radford (1967) as follows,
(W2 – W1) (loge L2 – loge L1) Net assimilation rate = g/cm2/day
(L2 – L1) (t 2 – t1)where,
26N
atur
e P
rece
ding
s : h
dl:1
0101
/npr
e.20
10.4
821.
1 : P
oste
d 25
Aug
201
0
W1 and W2 are total dry weights of plant at time t1 and final t2
respectively and L 2 and L1 are the total leaf area at time t1 and
t2, respectively.
3.3.7Leaf area ratio (LAR)
Leaf area ratio was calculated as the green leaf area (cm2)
divided by total dry matter (g).
Lead area ratio = Leaf area /total dry matter (cm2/g)
3.4.8Specific leaf area (SLA)
Specific leaf area was computed as green leaf area (dm2)
divided by green leaf weight (g).
Specific leaf area = Leaf area/leaf weight (dm2/g)
3.4.9Specific leaf weight (SLW)
Specific leaf weight was computed as green leaf weight (g)
divided by green leaf area (dm2).
Specific leaf weight = Leaf weight/leaf area (dm2/g)
3.5 PHYSIOLOGICAL PARAMETERS
3.5.1 Measurement of Photosynthetic rate and Stomatal
conductance
Photosynthetic rate of the flag leaf of all the lines was
measured at 10, 20 and 30 DAA using the portable photosynthetic
27N
atur
e P
rece
ding
s : h
dl:1
0101
/npr
e.20
10.4
821.
1 : P
oste
d 25
Aug
201
0

system, (LICOR 6200, USA). This is a closed system that measures
changes in CO2 concentration over time. Measurements were made
between 10:00 A.M. to 12:00 noon. The leaf was enclosed in
assimilation chamber and the net exchange of CO2 between the flag
leaf and the atmosphere was measured. The photosynthetic rate was
expressed as µmol CO2 m-2 s-1 and the stomatal conductance was
expressed as cm s-1.
3.5.2Chlorophyll content
The chlorophyll content of the flag leaf at 10, 20 and 30 DAA
was estimated by Hiscox and Israelton (1979). In this method, 50 mg
of leaf samples were incubated in 7.0 ml dimethyl sulfoxide (DMSO)
at 65°C for 2 hours. At the end of the incubation period, supernatant
was decanted and the volume was made up to 10 ml with DMSO. The
absorbance of the extract was read at 645 and 663 nm in spectronic-
20 keeping DMSO as blank. The amount of chlorophyll was calculated
by using the following formulae;
VChlorophyll a = (12.7 x A 663) – (2.69 x A 645) x (mg/g fr. wt.)
1000 x W
VChlorophyll b = (22.9 x A 645) – (4.68 x A 663) x (mg/g fr. wt.)
1000 x W
VTotal Chlorophyll = (20.2 x A 645) – (8.02 x A 663) x (mg/g fr. wt.)
28N
atur
e P
rece
ding
s : h
dl:1
0101
/npr
e.20
10.4
821.
1 : P
oste
d 25
Aug
201
0

1000 x W
where,
A645 and A663 are the absorbance at 645 and 663 nm,
respectively;
V = volume of solvent and W = the weight of the sample (50
mg).
3.6 HORMONE EXTRACTION
3.6.1Procedure
Endogenous plant hormones were extracted by the modified
procedures of Sundberg (1990), Kojima (1995) and Yang et al (2000).
Samples corresponding to 2.0 g dehulled and frozen grains
were homogenized in a mortar (on ice) with 80% methanol
supplemented with 10 mg/l butylated hydroxytoluene (BHT) as an
antioxidant. The homogenate was filtered and the solid residue was
further extracted twice with the same solvent. The methanolic
extracts were kept for continuous stirring at 4ºC in the dark for about
4 hours and centrifuged at 10,000 rpm for 10 min at the same
temperature. The supernatants were combined and concentrated to a
water residue in vacuum at 40º C by rotatory evaporation. The
volume was adjusted to 10 ml with 0.05 M Na-phosphate buffer, pH
7.5, and neutral compounds were removed by partitioning with 2 x 5
ml fresh diethyl ether in a 20 ml glass vial. The ether was layered on
29N
atur
e P
rece
ding
s : h
dl:1
0101
/npr
e.20
10.4
821.
1 : P
oste
d 25
Aug
201
0

to the aqueous phase and the two-phase system was gently stirred
for 3 min on a multipoint magnetic stirrer.
After discarding the ether phase, the aqueous phase was
adjusted to pH 2.7 with 1 M HCl and partitioned as described above
with 3 x 5 ml fresh diethyl ether. Saving the aqueous phase for
further purification of gibberellins, the combined ether phases were
reduced to dryness (anhydrous Na2SO4 was added to remove water
from the ether phase) and used for the estimation of IAA and ABA.
The aqueous phase after partitioning against diethyl ether was
partitioned two times against 10 ml of ethyl acetate and the aqueous
phase was discarded. The ethyl acetate layer was partitioned two
times against 10 ml of 0.2 M K2HPO4 and the organic layer was
discarded. The aqueous phase was adjusted to pH 2.5 with H3PO4. The
acidified phase was partitioned two times against 10 ml of ethyl
acetate. The ethyl acetate layer was dried over anhydrous Na2SO4
overnight and used for the estimation of GA.
3.6.2Hormone analysis
The dried extracted samples were reconstituted in 5 ml HPLC
grade methanol and were analysed by a Thermo Separation Product
model Spectra System P2000 liquid chromatograph, equipped with a
variable wavelength UV-150, UV-VIS detector and a Rheodyne injector
(20 µl loop), and connected to Datajet reporting integrator.
30N
atur
e P
rece
ding
s : h
dl:1
0101
/npr
e.20
10.4
821.
1 : P
oste
d 25
Aug
201
0
The chromatographic conditions were as follows,
Stationary phase : LiChrosorb RP 18 (7µm) packed in a stainless
steel
column (250 mm x 4.6 mm i.d.)
Mobile phase : Methanol:Water (60:40 v/v)
Flow rate : 0.7 ml/min
Detector : 265 nm
Sensitivity : 0.08 a.u.f.s
The retention time of the peaks in authentic hormones and in
the samples obtained by the chromatograph was compared and the
peak area was measured with single channel computing integrator
and was used to quantify the amount of hormone present in the
sample.
3.7 ESTIMATION OF TOTAL SOLUBLE SUGARS
Total soluble sugars in seeds were estimated colorimetrically in
two replications as per the procedure given by Dubois et al. (1951).
3.7.1Extraction
Five grams of seed sample was boiled in water for 20 minutes
and after cooling, it was ground in about 15 ml of distilled water. The
homogenate was centrifuged at 3,000 rpm for 15 minutes. The
31N
atur
e P
rece
ding
s : h
dl:1
0101
/npr
e.20
10.4
821.
1 : P
oste
d 25
Aug
201
0
supernatant was used for soluble sugar estimation. The remaining
pellet was stored in refrigerator for starch estimation.
3.7.2Estimation
To 0.1 ml of aliquot, 1 ml of 5 per cent phenol solution was
added, to which, 5 ml of concentrated H2SO4 was added with the
help of automatic dispenser in such a way that it hits the surface of
reaction mixture directly. The contents were shaken and cooled at
room temperature. A blank was prepared in the same way with water
instead of the aliquot. The intensity of the colour was read at 490 nm
in a spectrophotometer (Beckman DU-640, USA). A standard curve
was prepared using 10 to 100 µg/ml of glucose solution. Total soluble
sugars were calculated using the standard curve.
3.8 ESTIMATION OF STARCH
The starch content in the seeds was estimated by the method
of Colowick and Kaplan (1957).
3.8.1Extraction
The pellet obtained after centrifugation earlier for the
estimation of sugars was dried overnight in an oven at 110°C and
cooled in a desiccator. From this, 0.25 g was taken into centrifuge
tube, to which, 5 ml of water was added and stirred with a glass rod,
then 6.5 ml of 52% perchloric acid was added by continuous stirring
32N
atur
e P
rece
ding
s : h
dl:1
0101
/npr
e.20
10.4
821.
1 : P
oste
d 25
Aug
201
0

for five minutes. The extraction was repeated two times and the
supernatant was collected in 100 ml volumetric flask and then the
volume was made up to 100 ml with distilled water.
3.8.2Estimation
The amount of glucose present in the aliquot was determined
by phenol sulphuric acid method as described by Dubois et al. (1951).
The starch content was calculated according to formula, Starch =
glucose x 0.9
3.9 YIELD AND YIELD COMPONENTS
Plants were harvested when the ears were fully matured. Each
pot was taken as replication and the yield and yield components viz.,
number of ears per plant, ear weight, number of grains per ear, 1000-
seed weight, total seed yield per plant were recorded. Finally harvest
index was calculated as ratio of the economic yield to the biological
yield and expressed in per cent and fruiting co-efficient was also
calculated as ratio of grain yield to the total dry matter at harvest.
3.10 STATISTICAL ANALYSIS
33N
atur
e P
rece
ding
s : h
dl:1
0101
/npr
e.20
10.4
821.
1 : P
oste
d 25
Aug
201
0
The experimental data was subjected to statistical analysis
following completely randomized block design as described by Panse
and Sukhatme (1967).
34N
atur
e P
rece
ding
s : h
dl:1
0101
/npr
e.20
10.4
821.
1 : P
oste
d 25
Aug
201
0
4. EXPERIMENTAL RESULTS
Experiments were conducted to study the hormonal changes
during grain development in hexaploid and tetraploids of wheat
during Rabi seasons of 2001 and 2002 at Pot culture of the Division of
Plant Physiology, Indian Agricultural Research Institute, New Delhi. It
was intended to determine grain growth rate and changes in
biophysical, biochemical, growth and endogenous hormonal levels in
the grains during grain growth and development. It was also intended
to relate the changes in endogenous hormonal levels with grain
growth during both the seasons. Since, the trend was similar during
both the seasons, the data were subjected for pooled analysis and the
results are presented in this chapter.
4.1 YIELD PERFORMANCE OF HEXAPLOID AND TETRAPLOID
WHEATS
Varieties with the difference in the production of grains among
tetraploid and hexaploids wheat genotypes were examined for two
consecutive seasons and studied for morphological as well as
physiological parameters of seed yield and the data are furnished in
Table 1 & 2 and also represented graphically in Fig. 1.
Nat
ure
Pre
cedi
ngs
: hdl
:101
01/n
pre.
2010
.482
1.1
: Pos
ted
25 A
ug 2
010

High yield of hexaploids was associated with the high 1000-gain
weight (Table 1 & Fig. 1). The number of ears/plant was almost at par.
Data on grain weight/plant showed that hexaploids were having more
seed yield as compared to tetraploids. Leaf area recorded at 25 DAA
clearly indicated that it is much more in hexaploids (DL-1266-1 & DL-
1226-2) followed by PBW-343 (Table 2 & Fig.1). As regarded to
fruiting coefficient (seed yield per gram of total dry matter produced)
was much more in hexaploids than tetraploids. Thus it is obvious that
hexaploids had recorded higher seed yield/plant by virtue of having
more 1000-grain weight.
4.2 YIELD AND YIELD COMPONENTS
Genotypic differences in yield and yield components at harvest
among hexaploids and tetraploids of wheat are presented in Table 3.
The grain yield differed significantly between the genotypes and
among the genotypes, hexaploids recorded significantly higher grain
yield over tetraploids. Among hexaploids the maximum grain yield
was recorded in DL-1266-2 (17.54 g/plant), while among tetraploids
the maximum grain yield of 12.51 g/plant was recorded in HD-4530.
The seed number/ear also varied significantly among the
genotypes and the genotypes DL-1266-2 and PDW-233 respectively
recorded higher seed number/ear among hexaploids and tetraploids.
The data on seed weight/ear presented in Table 18 indicated
34
Nat
ure
Pre
cedi
ngs
: hdl
:101
01/n
pre.
2010
.482
1.1
: Pos
ted
25 A
ug 2
010
significant differences between the genotypes with DL-1266-2 of
hexaploids having significantly higher seed weight/ear, but it was on
par with DL-1266-1, PBW-343 and HI-8498. The lowest seed weight of
2.01 g/ear was recorded in HD-4530; however, it was on par with
PBW-343 of hexaploids. The data on 1000-grain weight indicated that
it was maximum in DL-1266-2 of hexaploids, which was on par with
DL-1266-1 and were significantly superior over all other genotypes,
irrespective of hexaploids or tetraploids. However, the other
genotypes did not differed significantly with each other. The chaff
weight/ear also differed significantly among genotypes with DL-1266-
1 and DL-1266-2 of hexaploids having significantly higher values over
all other genotypes. However, the lowest chaff weight of 1.12 g/ear
was recorded in HD-4530 of tetraploids. The data on harvest index
showed that it was higher among hexaploids compared to tetraploids.
The maximum harvest index of 58.9 was recorded in DL-1266-2 of
hexaploids, which was on par with other genotypes among
hexaploids. The lowest harvest index of 45.46 was recorded in PDW-
233 of tetraploids.
4.3 MORPHOLOGICAL CHARACTERS
The data on various morphological characters viz., plant height,
tiller number/plant, ear number/plant and ear length were collected at
harvest and presented in Table 4. The data indicated significant
differences between the genotypes for all the parameters. It was
35
Nat
ure
Pre
cedi
ngs
: hdl
:101
01/n
pre.
2010
.482
1.1
: Pos
ted
25 A
ug 2
010
observed that among the genotypes, the plant height and ear lengths
were significantly higher in hexaploids over tetraploids. Among
hexaploids, the plant height was significantly higher in DL-1266-1
over all others except, DL-1266-2. It did not differ significantly with
HD-4530 of tetraploids. Similarly, the genotypes PBW-343 among
hexaploids and HI-8498 among tetraploids had significantly lower
plant height and were at par with each other. The genotypes PDW-
233 and HD-4530 among tetraploids also did not differ significantly
with each other.
It was observed that hexaploids had significantly higher ear
length compared to tetraploids. But, no significant differences were
observed between the genotypes among hexaploids and tetraploids.
The data on tiller number indicated significant differences between
the genotypes with PBW-343 of hexaploids having significantly higher
tiller number over all others except, PDW-233 of tetraploids. Similarly,
DL-1266-1 and DL-1266-2 of hexaploids and PBW-343 and HI-8498 of
tetraploids did not differ significantly among themselves. It was
observed that PBW-343 of hexaploids had significantly higher ear
number/plant but did not differ significantly with any of the genotypes
among tetraploids. The lower ear number of 3.7 was recorded in DL-
1266-2, which was on par with DL-1266-1.
4.4 PLANT GROWTH AND DEVELOPMENT
36
Nat
ure
Pre
cedi
ngs
: hdl
:101
01/n
pre.
2010
.482
1.1
: Pos
ted
25 A
ug 2
010

The data on various plant growth and development parameters
were computed and presented in Tables 5 to 14.
4.4.1Leaf area (cm2/plant)
The data on leaf area presented in Table 5 indicated significant
differences among the genotypes at all the days after anthesis (DAA).
The leaf area increased from 5-25 DAA and declined thereafter at 35
DAA in all the genotypes. The genotype DL-1266-2 recorded
significantly higher leaf area over all other genotypes, irrespective of
hexaploids or tetraploids. At 15 DAA, the genotype DL-1266-2 had
significantly higher leaf area over all others and the genotypes DL-
1266-1 and PBW-343 of hexaploids and PDW-233, PBW-343 and HI-
8498 of tetraploids did not differ significantly with each other. A
similar trend was observed at 25 and 35 DAA with DL-1266-2 having
significantly higher leaf area over all other genotypes.
4.4.2Leaf dry weight (g/plant)
The leaf dry weight presented in Table 6 showed significant
differences among genotypes and the mean leaf dry weight increased
from 5 to 25 DAA and decreased at later stages. In general,
hexaploids showed significantly higher values over tetraploids at all
the stages. Among hexaploids, at 5 DAA, the genotype DL-1266-1
recorded higher value. But, it did not have significant difference with
37
Nat
ure
Pre
cedi
ngs
: hdl
:101
01/n
pre.
2010
.482
1.1
: Pos
ted
25 A
ug 2
010
other genotypes. Among the tetraploids, a similar tread was seen with
the genotype PDW-233 having significantly lower value. Similarly at
15, 25 DAA and at harvest, the genotypes DL-1266-2 and PDW-233
recorded significantly higher and lower values, respectively. All the
hexaploids and tetraploids did not differ significantly among
themselves at 25, 35 DAA and at harvest.
4.4.3Specific leaf area (dm2/g)
The data on specific leaf area presented in Table 7 indicated
significant differences among the genotypes at all the days after
anthesis. Among the genotypes, the hexaploids had higher SLA over
tetraploids at 5 and 35 DAA; while, tetraploids had higher SLA at 15
and 25 DAA. The genotype DL-1266-2 among hexaploids and PDW-
233 among tetraploids recorded significantly higher SLA over others
in their respective groups at 5DAA. While, PBW-343 among
hexaploids and HI-8498 among tetraploids had significantly lower
SLA. At 15 DAA, the genotypes belonging to tetraploids recorded
higher values over hexaploids. Among the genotypes, PDW-233 of
tetraploids had significantly higher SLA over all other genotypes
irrespective of hexaploids or tetraploids. While, DL-1266-1, DL-1266-
2, PBW-343, HD-4530 and HI-8498 were at par with each other. A
similar trend was observed at 25 DAA with PDW-233 having
significantly higher value over others, but was on par with PBW-343,
HD-4530 and HI-8498. At 35 DAA DL-1266-2 of hexaploids recorded
38
Nat
ure
Pre
cedi
ngs
: hdl
:101
01/n
pre.
2010
.482
1.1
: Pos
ted
25 A
ug 2
010
significantly higher SLA over all other genotypes while PDW-233
recorded significantly lower value.
4.4.4Specific leaf weight (g/dm2)
The data on specific leaf weight presented in Table 8 indicated
significant differences among the genotypes at all the stages. The
hexaploids had higher values at 15 and 25 DAA; while at 35 DAA,
tetraploids recorded higher values. At 5 DAA, PBW-343 recorded
higher value over all other genotypes irrespective of tetraploids or
hexaploids. While, the genotypes DL-1266-2 and PDW-233 belonging
to hexaploids and tetraploids respectively had significantly lower
values but were on par with each other. No significant differences
were found between any of the genotypes among hexaploids at 15
DAA. While, PDW-233 of tetraploids had significantly lower SLW over
all others at this stage. At 25 DAA, the genotypes DL-1266-1, DL-
1266-2 of hexaploids and HD-4530 and HI-8498 of tetraploids were at
par with each other. Similarly, PBW-343 of hexaploids and HD-4530
and HI-8498 of tetraploids did not differ significantly with each other.
However, none of the genotypes among tetraploids differed
significantly with each other. At 35 DAA, the lowest SLW of 0.65 was
recorded in DL-1266-2 of hexaploids, which was on par with PBW-343,
HD-4530 and HI-8498. A maximum SLW of 0.78 was recorded in PDW-
233 of tetraploids.
39
Nat
ure
Pre
cedi
ngs
: hdl
:101
01/n
pre.
2010
.482
1.1
: Pos
ted
25 A
ug 2
010

4.4.5Leaf area ratio (cm2/g)
The data pertaining to leaf area ratio showed significant
differences among the genotypes at all the stages (Table 9). In
general, it decreased continuously from 5 to 35 DAA in all the
genotypes and in general, the genotypes belonging to hexaploids had
higher LAR at 25 and 35 DAA; while, the genotypes belonging to
tetraploids had higher LAR at 5 and 15 DAA. The maximum LAR of
25.6 was recorded in HD-4530 belonging to tetraploids but was on par
with PBW-343 of hexaploids and PDW-233 and HI-8498 of tetraploids.
Significantly lower LAR was recorded in DL-1266-1 of hexaploids but
was on par with all the genotypes among hexaploids and PDW-233 of
tetraploids at 5 DAA. A similar trend was noticed at 15 DAA with DL-
1266-1 of hexaploids having significantly lower LAR but was on par
with DL-1266-2 and PBW-343 of hexaploids and PDW-233 of
tetraploids.
The leaf area ratio decreased at 25 DAA compared to 15 and 5
DAA. Among genotypes, PBW-343 of hexaploids recorded significantly
higher LAR of 14.6 over all other genotypes except, DL-1266-2,
irrespective of tetraploids or hexaploids. Whereas, the lowest LAR of
12.32 was recorded in PDW-233 of tetraploids, but it was on par with
HI-8498. At 35 DAA, the genotype DL-1266-2 recorded significantly
higher LAR, but it was on par with PBW-343 and HD-4530. The lowest
40
Nat
ure
Pre
cedi
ngs
: hdl
:101
01/n
pre.
2010
.482
1.1
: Pos
ted
25 A
ug 2
010

LAR of 8.19 was recorded in DL-1266-1 of hexaploids which was on
par with PDW-233 of tetraploids.
4.4.8Stem dry weight (g/plant)
The data on stem dry weight presented in Table 10 indicated
significant differences between the genotypes at all the days after
anthesis, except at 25 DAA. Among genotypes, the stem dry weight
was significantly higher in hexaploids compared to tetraploids at all
the stages. At 5 DAA, the genotype DL-1266-2 belonging to
hexaploids recorded significantly higher stem dry weight over all
other genotypes, irrespective of hexaploids or tetraploids but was on
par with DL-1266-1. Similarly, the genotypes PBW-343 of hexaploids
PDW-233, HD-4530 and HI-8498 of tetraploids did not differ
significantly with each other. A similar trend was observed at 15 DAA
with DL-1266-2 having significantly higher stem dry weight of 9.57
g/plant followed by DL-1266-1 (9.31 g/plant).
At 25 DAA also, DL-1266-2 recorded higher stem dry weight,
but was on par with all the genotypes except HI-8498 belonging to
tetraploids. However, no significant differences were observed
between the genotypes at this stage. At 35 DAA, the genotypes
belonging to hexaploids did not differ significantly with each other.
41
Nat
ure
Pre
cedi
ngs
: hdl
:101
01/n
pre.
2010
.482
1.1
: Pos
ted
25 A
ug 2
010
Similarly the genotypes belonging to tetraploids also were at par with
each other. At harvest, DL-1266-1 of hexaploids had significantly
higher stem dry weight, but was on par with DL-1266-2 and both
differed significantly with all other genotypes, irrespective of
hexaploids or tetraploids. No significant differences were observed
between the genotypes among tetraploids and these genotypes also
were on par with PBW-343 of hexaploids.
4.4.9Ear dry weight (g/plant)
The data on ear dry weight indicated significant differences
between the genotypes at all the stages (Table 11). The data further
indicated that the ear dry weight increased continuously from 5 DAA
until harvest in all the genotypes. At 5 DAA, the genotype DL-1266-2
belonging to hexaploids recorded significantly higher ear dry weight
over all other genotypes except DL-1266-1 of hexaploids. However,
no significant differences were observed between any of the
genotypes among tetraploids and these genotypes were at par with
each other and with PBW-343 of hexaploids.
It was further observed that the ear dry weight was significantly
higher in hexaploids compared to tetraploids at all the stages until
harvest. At 15 DAA, the genotype DL-1266-2 belonging to hexaploids
recorded significantly higher ear dry weight over all other genotypes.
42
Nat
ure
Pre
cedi
ngs
: hdl
:101
01/n
pre.
2010
.482
1.1
: Pos
ted
25 A
ug 2
010

Similarly, no significant differences were observed between any of the
genotypes among tetraploids. At all other stages, i.e. at 25, 35 DAA
and harvest, tetraploids showed no significant differences. But,
hexaploids differed significantly at these stages. The genotypes DL-
1266-2 recorded significantly higher ear dry weight at all the stages.
At harvest with DL-1266-2 recorded significantly higher ear dry
weight of 27.89 g/plant.
4.4.10 Total dry weight (g/plant)
The data on total dry weight presented in Table 12 indicated
significant differences among the genotypes at all stages. Among the
genotypes, the genotypes belonging to hexaploids recorded higher
total dry weight at all the stages compared to tetraploids. It was
further observed that the total dry weight increased continuously
from 5 DAA until harvest in all the genotypes. At 5 DAA, the genotype
DL-1266-2 belonging to hexaploids recorded significantly higher total
dry weight over all other genotypes among hexaploids and
tetraploids, except DL-1266-1. None of the genotypes among
tetraploids differed significantly with each other and also PBW-343 of
hexaploids. At 15 DAA, again DL-1266-2 followed by DL-1266-1 of
hexaploids recorded significantly higher total dry weight over all other
genotypes.
43
Nat
ure
Pre
cedi
ngs
: hdl
:101
01/n
pre.
2010
.482
1.1
: Pos
ted
25 A
ug 2
010

The genotypes belonging to tetraploids did not differ
significantly with each other at this stage. Similarly the genotypes DL-
1266-1 and PBW-343 of hexaploids were at par with ach other. A
similar trend was noticed at 25 and 35 DAA with DL-1266-1 and DL-
1266-2 of hexaploids having significantly higher total dry weight over
all other genotypes. However, a lower total dry weight of 24.08
g/plant was recorded in HI-8498 at 25 DAA and 28.06 g/plant in PDW-
233 at 35 DAA. The genotype DL-1266-2 of hexaploids continued to
maintain higher total dry weight at harvest also, but it was on par
with DL-1266-1. The genotypes belonging to tetraploids did not differ
significantly among themselves and these genotypes also were on
par with PBW-343 of hexaploids.
4.4.12 Relative growth rate (g/g/day)
The mean relative growth rate decreased continuously from 5–
15 DAA to 25–35 DAA and at 35 DAA–harvest, it has slightly increased
in all the genotypes of both hexaploids and tetraploids (Table 13). The
relative growth rate was significantly higher in the genotypes
belonging to tetraploids at 5–15, 15–25 and 25-35 DAA; while, it was
higher among hexaploids at the 35 DAA-harvest stage. At 5–15 DAA,
the genotypes belonging to tetraploids recorded significantly higher
rates of RGR compared to hexaploids. Among the genotypes,
tetraploids showed no significant differences but hexaploids differed
significantly. Interestingly, the new plant types recorded lower of
44
Nat
ure
Pre
cedi
ngs
: hdl
:101
01/n
pre.
2010
.482
1.1
: Pos
ted
25 A
ug 2
010

lower rates. At 15–25, there were no significant differences among
tetraploids and hexaploids. But at 25–35 DAA, the genotypes showed
significant differences among themselves. And at this stage, the
hexaploid genotype DL-1266-2 recorded lowest RGR of 0.01 g/g/day.
Other genotypes of hexaploids were at par with PDW-233 of
tetraploid. When compared at 35 DAA–harvest stage, the genotype
DL-1266-1 belonging to hexaploids recorded significantly higher RGR
than any other genotype however, it was on par with the genotype
DL-12661.
4.4.13 Net assimilation rate (mg/cm2/day)
The net assimilation rate decreased continuously from 5–15
DAA to 25–35 DAA in all the genotypes, irrespective of hexaploids or
tetraploids (Table 14). It was observed in general, that the genotypes
belonging to tetraploids had higher NAR at all the stages compared to
hexaploids. At 5–5 DAA, the genotype PDW-233 of tetraploids had
higher NAR, but it was on par with all other genotypes in that group
and also with PBW-343 among hexaploids. Significantly lower NAR
was recorded in DL-1266-1 of hexaploids compared to all other
genotypes, except DL-1266-2. At, 15–25 DAA, the genotypes
belonging to tetraploids recorded significantly higher NAR over
hexaploids but were on par with each other. The genotype PBW-343
of hexaploids had significantly lower NAR compared to all other
genotypes but it was on par with other genotypes in that group. At
45
Nat
ure
Pre
cedi
ngs
: hdl
:101
01/n
pre.
2010
.482
1.1
: Pos
ted
25 A
ug 2
010

25–35 DAA, the genotypes HI-8498 of tetraploids recorded
significantly higher NAR over all other genotypes irrespective of
hexaploids or tetraploids. Similarly, the genotype DL-1266-1 of
hexaploids recorded lower NAR over all other genotypes at this stage.
4.5 SEED AND EAR GROWTH PARAMETERS
The data on various seed and ear growth parameters were
computed and presented in Tables 15 to 19.
4.5.1 Absolute growth rate of ear (mg/day)
The data on absolute growth rate of ear presented in Table 15
indicated significant differences between the genotypes at all the
stages. The AGR of ear decreased from 5–15 DAA to 25–35 DAA and
increased at 25–35 DAA and decreased thereafter among hexaploids
and tetraploids. Among hexaploids, the AGR of ear was maximum at
5–15 DAA and decreased there after and again at 25–35 DAA, it
increased until 35 DAA–harvest. At 5–15 DAA, the genotype DL-1266-
2 of hexaploids recorded significantly higher AGR over all other
genotypes. The lowest AGR of 0.202 g/day was recorded in HI–8498 of
tetraploids at this stage. At 15–25 DAA also, DL-1266-2 of hexaploids
recorded significantly higher AGR over all other genotypes. The
genotype PBW-343 of hexaploids and PDW-233 and HD-4530 of
tetraploids were at par with each other. A lower AGR of 0.197 g/day
46
Nat
ure
Pre
cedi
ngs
: hdl
:101
01/n
pre.
2010
.482
1.1
: Pos
ted
25 A
ug 2
010
was recorded in HI-8498 of tetraploids, but it was on par with PDW-
233 and HD–4530.
At 25–35 DAA, the genotype DL-1266-2 followed by DL-1266-1
of hexaploids recorded significantly higher AGR over all other
genotypes. At 35 DAA–harvest, the genotype DL-1266-1 belonging to
hexaploids recorded significantly higher AGR. A lower AGR of 0.116
g/day was registered in HI-8498 of tetraploids and among hexaploids,
it was with PBW-343 (0.178 g/day). The new plant types, at all the
stages, recorded significantly higher RGR values than any other
genotype
4.5.15 Relative growth rate of ear (g/g/day)
The data pertaining to relative growth rate of ear presented in
Table 16 indicated significant differences between the genotypes at
all the stages. It was observed that RGR of ear was significantly
higher in the genotypes belonging to hexaploids compared to
tetraploids at all the stages except at 25–35 DAA where a slight
increase in RGR of tetraploids was seen. Here also, the hexaploid new
plant type Dl-1266-2 recorded higher rate than other genotypes
though it was at par with PDW-233 and HI-8498. The RGR decreased
continuously from 5–15 DAA until 35 DAA–harvest in all the
genotypes. At 5–15 DAA, the genotypes DL-1266-1 and DL-1266-2
belonging to hexaploids had higher RGR, thought they were at par
47
Nat
ure
Pre
cedi
ngs
: hdl
:101
01/n
pre.
2010
.482
1.1
: Pos
ted
25 A
ug 2
010
with each other. The tetraploids showed no significant differences.
Significantly lower RGR was recorded in HI-8498 of tetraploids over all
other genotypes at this stage. At 15–25 DAA, all the genotypes
irrespective of tetraploid or hexaploid, showed no significant
differences. At 25–35 DAA DL-1266-2 recorded higher rate but it was
on par with PDW-233 and HI-8498. The genotype PBW-343 belonging
to hexaploids recorded significantly lower RGR over all other
genotypes, except with HD-4530 at this stage. At 35 DAA–harvest, the
genotype DL-1266-1 of hexaploids had significantly higher RGR and
the genotype HD-4530 of tetraploids had lowest RGR and it was at
par with other genotypes within the tetraploids and also with PBW-
343 of hexaploids.
4.5.18 Seed weight (mg/grain)
The data on seed weight presented in Table 17 indicated
significant differences between the genotypes at all stages. It was
observed that the seed weight increased continuously from 5 DAA
until harvest in all the genotypes, irrespective of hexaploids or
tetraploids. It was further observed from the mean values that, the
hexaploids had significantly higher seed weight compared to
tetraploids at all the stages. At 5 DAA and at all the stages of growth,
the genotypes DL-1266-1 and DL-1266-2 belonging to hexaploids
recorded significantly higher seed weight while, all other genotypes
did not differ significantly with each other.
48
Nat
ure
Pre
cedi
ngs
: hdl
:101
01/n
pre.
2010
.482
1.1
: Pos
ted
25 A
ug 2
010

At 15 DAA, the genotypes DL-1266-1 and DL-1266-2 again had
significantly higher seed weight over all other genotypes except with
HI-8498. Here at this stage, and the lowest seed weight (11.83 mg)
was recorded in HD-4530 of tetraploids. At 25 DAA and other later
stages, the genotypes Dl-1266-1 and DL-1266-2 among hexaploids
had significantly higher seed weight compared to all other genotypes
though they were at par with each other. At harvest, DL-1266-1 and
DL-1266-2 of hexaploids recorded significantly higher seed weight of
60.15 mg and 61.25 mg respectively over all other genotypes, while,
all other genotypes were at much lower weights and showed any
significant differences with each other.
4.5.16 Absolute growth rate of seed (mg/day)
The data on absolute growth rate of seed indicated significant
differences between the genotypes at all the stages (Table 18). The
data further indicated that the AGR of seed increased from 5–15 DAA
to 15–25 DAA and decreased thereafter until 35DAA–harvest in all the
genotypes. Among the genotypes, the mean values indicated that the
AGR was higher among hexaploids compared to tetraploids at all the
stages. At 5–15 DAA, the genotype DL-1266-2 belonging to
hexaploids recorded significantly higher AGR over all other genotypes
but it was on par with DL-1266-1. The lowest AGR of 0.671 mg/day
49
Nat
ure
Pre
cedi
ngs
: hdl
:101
01/n
pre.
2010
.482
1.1
: Pos
ted
25 A
ug 2
010

was recorded in HD-4530 of tetraploids, but it was on par with all
other genotypes in tetraploids.
A similar trend was noticed at other stages with DL-1266-2 of
hexaploids having significantly higher AGR over all other genotypes.
At 15–25 DAA, highest AGR was recorded in DL-1266-1 (2.201
mg/day) and DL-1266-2 (2.212 mg/day). At 35 DAA–harvest, the
genotypes DL-1266-1 and DL-1266-2 were significantly superior over
all other genotypes, irrespective of hexaploids or tetraploids and the
genotypes within tetraploids did not differ significantly among
themselves and also with the PBW-343 of hexaploids.
4.5.17 Grain growth rate (g/g/day)
The grain growth rate of seed decreased continuously from 5–
15 DAA to 35 DAA–harvest in all the genotypes (Table 19). It was
further observed that GGR was more in the hexaploids at all the
stages. At 5–15 DAA, the genotypes DL-1266-2 belonging to
hexaploids recorded significantly higher RGR but was on par with
other hexaploids and also with PDW 233 of tetraploids. The lower RGR
was also recorded in HI-8498 of tetraploids.
At 15–25 DAA, the genotype DL-1266-1 recorded higher RGR
but was on par with genotypes in hexaploids and also with PDW 233
of tetraploids. Significantly lower RGR of 0.077 g/g/day was recorded
50
Nat
ure
Pre
cedi
ngs
: hdl
:101
01/n
pre.
2010
.482
1.1
: Pos
ted
25 A
ug 2
010

in HI-8498 of tetraploids compared to all other genotypes. Similarly,
at 25–35 DAA also DL-1266-1 of hexaploids recorded significantly
higher RGR but was on par with other hexaploids. At 35 DAA–harvest
the genotypes did not show any significant differences.
4.6 BIOPHYSICAL AND BIOCHEMICAL PARAMETERS
The data on various biophysical and biochemical parameters
were collected and presented in Tables 20 to 27.
4.6.1 Stomatal conductance (cm/s)
The data on stomatal conductance presented in Table 20
indicated significant differences between the genotypes at all the
days after anthesis. It was observed that the stomatal conductance
was higher in the genotypes belonging to hexaploids compared to
tetraploids at all the stages. At 7 DAA, the genotypes DL-1266-1 and
DL-1266-2 of hexaploids recorded significantly higher stomatal
conductance over all other genotypes. The lowest stomatal
conductance of 1.408 cm/s was recorded in PDW-233 and it was on
par with HI-8498 among tetraploids. At 15 DAA also DL-1266-1 and
DL-1266-2 maintained higher stomatal conductance and PDW-233
had lower stomatal conductance. At 25 DAA no significantly
differences were observed in the stomatal conductance between any
51
Nat
ure
Pre
cedi
ngs
: hdl
:101
01/n
pre.
2010
.482
1.1
: Pos
ted
25 A
ug 2
010

of the genotypes among hexaploids and they also did not differed
significantly with HD-4530 of tetraploids. However, PDW-233 of
tetraploids recorded significantly lower stomatal conductance over all
other genotypes irrespective of hexaploids or tetraploids. It was
further observed at 35 DAA that no significant differences were
observed between the genotypes of hexaploids or tetraploids.
However, the genotypes of hexaploids differed significantly with
tetraploids in stomatal conductance.
4.6.3 Flag leaf photosynthetic rate (µmol/m2/s)
Flag leaf photosynthetic rate recorded at 5, 15, 25 and 35 DAA
indicated significant differences among the genotypes at all the
stages (Table 21). In general, the mean values indicated that the flag
leaf photosynthetic rate was higher among the hexaploids compared
to tetraploids at all the stages. It was noticed that DL-1266-2 of
hexaploids recorded significantly higher flag leaf photosynthetic rate
over all other genotypes irrespective of hexaploids or tetraploids at 7
DAA. While, HD-4530 of tetraploids recorded significantly lower flag
leaf photosynthetic rate over all other genotypes. At 15 DAA, no
significant differences were observed between DL-1266-1 and DL-
1266-2 of hexaploids and PDW-233 of tetraploids. Similarly, the
genotype PBW-343 of hexaploids, PDW-233 and HI-8498 of
tetraploids were at par with each other. At 25 DAA, the genotypes DL-
1266-1and DL-1266-2 of hexaploids and HD-4530 of tetraploids were
52
Nat
ure
Pre
cedi
ngs
: hdl
:101
01/n
pre.
2010
.482
1.1
: Pos
ted
25 A
ug 2
010

at par with each other. Maximum photosynthetic rate was observed in
DL-1266-2 of hexaploids (21.23 µmol/m2/s) and the minimum
photosynthetic rate of 16.89 µmol/m2/s was observed in PBW-343 of
hexaploids at this stage. The photosynthetic rate decreased
continuously from 7 until 35 DAA in all the genotypes irrespective of
hexaploids or tetraploids. At 35 DAA, no significant differences were
observed between the genotypes among hexaploids, while the lowest
photosynthetic rate of 9.97 µmol/m2/s was recorded in HD-4530 of
tetraploids.
4.6.4Flag leaf chlorophyll ‘a’ content (mg/g fr. wt.)
The data on flag leaf chlorophyll ‘a’ content presented in Table
22 indicated significant differences between the genotypes at 10, 20
and 30 DAA. The chlorophyll ‘a’ content was maximum at 10 DAA and
declined continuously until 30 DAA in all the genotypes. Among the
genotypes, the mean chlorophyll a content was higher in hexaploids
compared to tetraploids at all the stages. It was observed that no
significant differences were observed between genotypes among
hexaploids and these genotypes did not differ significantly with PDW-
233 and HD-4530 of tetraploids at 10 DAA. However lower chlorophyll
‘a’ content was recorded in HI-8498 of tetraploids over all other
genotypes. At 20 DAA, the genotypes DL-1266-2 of hexaploids
recorded higher chlorophyll ‘a’ content over all other genotypes
53
Nat
ure
Pre
cedi
ngs
: hdl
:101
01/n
pre.
2010
.482
1.1
: Pos
ted
25 A
ug 2
010

irrespective of hexaploids or tetraploids. No significant differences
were observed between the genotypes among tetraploids and the
genotypes PDW-233 recorded the lowest chlorophyll ‘a’ content at
this stage. At 30 DAA also, the genotype DL-1266-2 of hexaploids
maintained significantly higher chlorophyll ‘a’ content over all other
genotypes. While, the genotype PDW-233 of tetraploids recorded
significantly lower chlorophyll ‘a’ content at this stage compared to all
other genotypes.
4.6.5 Flag leaf chlorophyll ’b’ content (mg/g fr. wt)
The flag leaf chlorophyll ‘b’ content presented in Table 23
indicated significant differences among the genotypes at all the
stages. Among the genotypes, hexaploids recorded higher chlorophyll
‘b’ content over tetraploids at all the stages. The flag leaf chlorophyll
‘b’ content was higher at 10 DAA and declined continuously until 30
DAA in all the genotypes. At 10 DAA, the genotype DL-1266-2 of
hexaploids recorded significantly higher chlorophyll ‘b’ content over
all other genotypes, except DL-1266-1. However, no significant
differences were observed between the genotypes among tetraploids.
A similar trend continued at 20 DAA with DL-1266-2 followed by DL-
1266-1 having significantly higher chlorophyll ‘b’ content compared to
all other genotypes and the rest of genotypes were at par with each
other. At 30 DAA, the genotype DL-1266-2 of hexaploids and PDW-
233 of tetraploids recorded significantly higher and lower chlorophyll
‘b’ content respectively.
54
Nat
ure
Pre
cedi
ngs
: hdl
:101
01/n
pre.
2010
.482
1.1
: Pos
ted
25 A
ug 2
010
4.6.6Flag leaf total chlorophyll content (mg/g fr. wt.)
The data on flag leaf total chlorophyll content indicated
significant differences among the genotypes at all the stages (Table
24). It was observed that the total chlorophyll content was maximum
at 10 DAA and declined continuously thereafter until 30 DAA and the
genotypes belonging to hexaploids had higher total chlorophyll
content over tetraploids at all the stages. At 10 DAA, no significant
differences were observed between the genotypes among hexaploids
or tetraploids. However, the maximum chlorophyll content was
recorded in DL-1266-2 of hexaploids and the minimum in PDW-233 of
tetraploids at all the stages. At 10 DAA, no significant differences
were observed between genotypes among hexaploids and tetraploids.
However the genotype DL-1266-2 of hexaploids and PDW-233 of
tetraploids recorded higher and lower total chlorophyll respectively
over all other genotypes. At 30 DAA, the genotypes DL-1266-2 and
PBW-343 of hexaploids recorded significantly higher total chlorophyll
content over all other genotypes while, PDW-233 had significantly
lower total chlorophyll content over all other genotypes, but was on
par with HD-4530 of tetraploids.
4.6.7Chlorophyll a/b ratio
55
Nat
ure
Pre
cedi
ngs
: hdl
:101
01/n
pre.
2010
.482
1.1
: Pos
ted
25 A
ug 2
010

The data on chlorophyll a/b ratio presented in Table 25
indicated that it was maximum at 10 DAA and declined thereafter
continuously up to 30 DAA. Among the genotypes, tetraploids had
higher a/b ration at 10 and 30 DAA; while, hexaploids had higher ratio
at 20 DAA and no significant differences were observed between the
genotypes at 10 DAA. At 20 DAA, the genotype DL-1266-2 belonging
to hexaploids had significantly higher chlorophyll a/b ratio over DL-
1266-1 and HD-4530. While, all other genotypes were at par with
each other. At 30 DAA, no significant differences were observed
between the genotypes among hexaploids and the genotype HI-8498
of tetraploids recorded significantly lower ratio over all other
genotypes, irrespective of hexaploids or tetraploids except PDW-233.
4.6.8 Total sugars content (mg/g dry wt.)
Total sugars content varied significantly among the genotypes
at all the stages (Table 26). It was further observed that the total
sugars content was significantly higher in the genotypes belonging to
hexaploids compared to tetraploids at all the stages and it decreased
continuously from 15 DAA until harvest in all the genotypes. At 15
DAA, the genotype DL-1266-2 followed by DL-1266-1 recorded
significantly higher total sugars content over all other genotypes;
while, the rest of genotypes were at par with each other at this stage.
The lowest total sugars content (106.41 mg/g dry wt.) was recorded
in PDW-233 of tetraploids. At 25 DAA, the genotype DL-1266-2
56
Nat
ure
Pre
cedi
ngs
: hdl
:101
01/n
pre.
2010
.482
1.1
: Pos
ted
25 A
ug 2
010

belonging to hexaploids recorded significantly higher total sugars
content (91.84 mg/g dry wt.) compared to all other genotypes,
irrespective of hexaploid or tetraploid. While, the other two genotypes
i.e., DL-1266-1 and PBW-343 among hexaploids were at par with each
other. Similarly, no significant differences were observed between
any of the genotypes among tetraploids at this stage. At 35 DAA, the
genotype DL-1266-2 of hexaploids recorded significantly higher total
sugars content over all other genotypes irrespective of hexaploids or
tetraploids. The genotypes DL-1266-1 and PBW-343 of hexaploids and
PDW-233, HD-4530 and HI-8498 of tetraploids did not differ
significantly among themselves. A similar trend continued at harvest
with DL-1266-2 having significantly higher total sugars content over
all other genotypes.
4.6.9Starch content (mg/g dry wt.)
The data on starch content presented in Table 27 indicated
significant differences among the genotypes at all the stages. The
starch content increased continuously from 15 DAA until harvest in all
the genotypes. Among the genotypes, the mean starch content was
higher in hexaploids compared to tetraploids at all the stages. At 15
DAA, the genotype DL-1266-2 followed by DL-1266-1 recorded
significantly higher starch content over all other genotypes,
irrespective of hexaploids or tetraploids. The lowest starch content of
222.0 mg/g dry wt. was recorded in PDW-233 of tetraploids and the
57
Nat
ure
Pre
cedi
ngs
: hdl
:101
01/n
pre.
2010
.482
1.1
: Pos
ted
25 A
ug 2
010
maximum starch content was 342.0 mg/g dry wt. in DL-1266-2 of
hexaploids. No significant differences were observed between the
genotypes among hexaploids at 25 DAA. Similarly, the genotypes
among tetraploids also were at par with each other. However, the
maximum starch content was recorded in DL-1266-2 of hexaploids
and minimum in PDW-233 of tetraploids. At 35 DAA, DL-1266-2
continued to maintain higher starch content (699 mg/g dry wt.) But, it
was on par with DL-1266-1 of hexaploids. None of the genotypes
among tetraploids differed significantly in starch content at this
stage. At harvest also, no significant differences were observed
between the genotypes of either hexaploids or tetraploids. However,
the maximum starch content of 710.0 mg/g dry wt. was recorded in
DL-1266-2 of hexaploids and the minimum in HI-8498 of tetraploids
(614.0 mg/g dry wt.).
4.7 ENDOGENOUS HORMONAL CONTENT IN GRAINS
The endogenous hormonal content in the developing grains of
hexaploid and tetraploid wheat is presented in Tables 28 to 30.
4.7.1 Indole acetic acid content (μg/g fr. wt.)
The indole-acetic acid content (IAA) among the genotypes
differed significantly at all the days after anthesis (Table 28). The IAA
content increased from 7 to 15 DAA in both hexaploids and
58
Nat
ure
Pre
cedi
ngs
: hdl
:101
01/n
pre.
2010
.482
1.1
: Pos
ted
25 A
ug 2
010

tetraploids and declined thereafter at 25 and 35 DAA in all the
genotypes. Further, among the genotypes, the IAA content was
significantly higher in hexaploids compared to tetraploids at all the
stages. At 7 DAA, the genotype DL-1266-2 followed by DL-1266-1
recorded significantly higher IAA content over all other genotypes.
While, no significant differences were observed between the
genotypes among tetraploids and with PBW-343 of hexaploids.
At 15 DAA, a similar trend continued with DL-1266-2 followed by
DL-1266-1 having significantly higher IAA content over all other
genotypes. The lower IAA content of 19.84 μg/g fr. wt. was recorded
in PDW-233 of tetraploids and it was on par with HI-8498 and PBW-
343. At 25 DAA, no significant differences were observed between the
genotypes either among hexaploids or among tetraploids, but still the
maximum IAA content was recorded in DL-1266-1 of hexaploids and
minimum in PDW-233 of tetraploids. At 35 DAA also, no significant
differences were observed between the genotypes either among
hexaploids or among tetraploids. The maximum IAA content of 11.16
μg/g fr. wt. was recorded in DL-1266-1 of hexaploids and the
minimum of 9.09 μg/g fr. wt in PDW-233 of tetraploids.
4.7.2 Gibberellic acid content (μg/g fr. wt.)
The data on gibberellic acid (GA) content presented in Table 29
indicated significant differences between the genotypes at all the
59
Nat
ure
Pre
cedi
ngs
: hdl
:101
01/n
pre.
2010
.482
1.1
: Pos
ted
25 A
ug 2
010
stages. The gibberellic acid content decreased continuously from 7 to
35 DAA among both hexaploids and tetraploids and among the
genotypes the mean GA content was significantly higher in
hexaploids compared to tetraploids at all the stages. It was observed
that at 7 DAA, the genotype DL-1266-2 followed by DL-1266-1 of
hexaploids recorded significantly higher GA content over all other
genotypes, irrespective of hexaploids or tetraploids. The genotypes
among tetraploids did not vary with each other at this stage and were
also on par with PBW-343 of hexaploids.
At 15 DAA, DL-1266-2 of hexaploids recorded significantly
higher GA content over all other genotypes and the genotype HI-8498
of tetraploids recorded the lowest GA content of 17.58 μg/g fr. wt.
But, it was on par with PDW-233 and HD-4530 of tetraploids and PBW-
343 of hexaploids. At 25 DAA, no significant differences were
observed among the genotypes between tetraploids and hexaploids.
However, the genotypes belonging to hexaploids recorded higher GA
content over the genotypes belonging to tetraploids. A similar trend
continued even at 35 DAA with the genotypes among hexaploids
having higher GA content over the genotypes of tetraploids. The
maximum GA content of 4.56 μg/g fr. wt. was recorded in DL-1266-1
of hexaploids and minimum in HI-8498 of tetraploids (2.14 μg/g fr.
wt).
4.7.3Abscisic acid content (μg/g fr. wt.)
60
Nat
ure
Pre
cedi
ngs
: hdl
:101
01/n
pre.
2010
.482
1.1
: Pos
ted
25 A
ug 2
010

The abscisic acid content presented in Table 30 indicated
significant differences between the genotypes at all the stages with
the genotype belonging to hexaploids having higher values compared
to tetraploids at all the stages. It was further observed that ABA
content increased from 7 to 25 DAA and decreased thereafter at 35
DAA. At 7 DAA, no significant differences were observed between the
genotypes of either hexaploids or tetraploids. But, the genotypes of
hexaploids had higher ABA content over tetraploids. The maximum
ABA content of 10.47 μg/g fr. wt and the minimum of 6.46 μg/g fr. wt.
were recorded in DL-1266-2 and HI-8498 of hexaploids and
tetraploids, respectively.
At 15 DAA, the genotype DL-1266-2 belonging to hexaploids
recorded significantly higher ABA content over all other genotypes,
irrespective of groups. However, the genotypes among tetraploids did
not differ significantly with each other. Similarly, the genotypes DL-
1266-1 and PBW-343 of hexaploids were at par with each other. At 25
DAA, DL-1266-2 followed by DL-1266-1 had significantly higher GA
content over all other genotypes. However, the genotypes belonging
to tetraploids were at par with each other. At 35 DAA, a similar trend
continued with DL-1266-2 and DL-1266-1 of hexaploids having high
ABA content over all other genotypes and the lowest ABA content was
observed in HD-4530 of tetraploids. However, no significant
differences were observed between the genotypes among tetraploids.
61
Nat
ure
Pre
cedi
ngs
: hdl
:101
01/n
pre.
2010
.482
1.1
: Pos
ted
25 A
ug 2
010

4.8 CORRELATION STUDIES
The correlation co-efficients among hormonal content and with
the grain growth parameters is presented in Tables 31 to 34.
4.8.1Correlation co-efficients among endogenous hormones
The data on correlation co-efficients between endogenous
hormones among hexaploids and tetraploids of wheat grains
presented in Table 31 indicated that IAA at 7 DAA had significant
positive correlation with IAA at 15 DAA, GA and ABA at 7 DAA and
ABA at 25 and 35DAA. While, IAA at 15 DAA was found to have highly
significant correlation with only GA and ABA at 7 DAA. The correlation
between IAA at 25 DAA with the endogenous hormones at other
stages indicated that it had a highly significant positive correlation
only with IAA at 30 DAA, while IAA at 30 DAA was found to have
highly significant correlation with GA at 21 DAA and ABA at 15 DAA.
GA at 7 DAA was again found to have highly significant correlation
with GA at 15 and 21DAA and ABA at 7 DAA. While, GA at 15 DAA was
found to have highly significant correlation with GA at 21 DAA and
ABA at 7 and 15 DAA while GA 25 DAA was found to have high
significant correlation only with ABA at 15 DAA. The inter-relationship
between the other endogenous hormones and days after anthesis
were found to be non significant.
62
Nat
ure
Pre
cedi
ngs
: hdl
:101
01/n
pre.
2010
.482
1.1
: Pos
ted
25 A
ug 2
010

4.8.2 Correlation between hormonal content and absolute
grain growth rate.
The data on correlation co-efficients between hormonal content
and absolute grain growth rate presented in Table 32 indicated that
the AGR of grains were significantly correlated with all the
endogenous hormonal content at different days after anthesis except
that IAA at 30 DAA did not have any significant correlation with
absolute grain growth rate at 5–15 DAA and ABA at 21 DAA did not
have any significant correlation with 15–25 DAA and 25–35 DAA.
It was further observed that correlation co-efficients between
IAA at 7 DAA and AGR 5–15 and 15–25 DAA were highly significant.
IAA at 15 DAA showed highly significant correlation with AGR at all
the stages. IAA at 25 DAA also showed highly significant correlation
with AGR at all the stages except at 5–15 DAA where it was less
significant. IAA at 35 DAA showed highly significant correlation with
AGR only at 35 DAA–harvest. GA at 7 DAA was highly significantly
correlated with 5–15 and 15–25 DAA; while, GA at 35 DAA was highly
significantly correlated with 25–35 DAA and 35 DAA–harvest. ABA at 7
and 35 DAS was highly significantly correlated with 5–15 DAA.
4.8.3 Correlation co-efficients of hormonal content with grain
growth rate
63
Nat
ure
Pre
cedi
ngs
: hdl
:101
01/n
pre.
2010
.482
1.1
: Pos
ted
25 A
ug 2
010
The correlation co-efficients between hormonal content and the
grain growth rate (Table 33) among hexaploids and tetraploids of
wheat indicated significant correlation between the grain growth rate
at 5–15 DAA and the hormonal content at different days after
anthesis. At all other stages, the was no significant correlation with
the hormonal content except that the IAA at 21 DAA showed
significant correlation with 15–25 DAA, 25–35 DAA and 35 DAA–
harvest and GA 30 at DAA showed significant correlation with 25–35
DAA and 35 DAA–harvest.
4.8.4 Correlation between some selected characters.
The data on interrelationship between various yield, growth,
biochemical, biophysical and endogenous hormonal levels presented
in Table 34 indicated that the grain yield was found to have highly
significant positive relationship with total dry matter at harvest, seed
AGR at 25–35 DAA, seed RGR at 35 DAA–harvest, 1000-grain weight,
stomatal conductance at 15 DAA, total chlorophyll content at 20 DAA,
total sugars content at 15 DAA, starch content at harvest and IAA at
15 DAA. While, it had negative significant relationship with tiller
number, NAR at 5–15 DAA and ear RGR at 5–15 DAA. The specific leaf
weight at 25 DAA was found to have a very highly significant
correlation with seed RGR at 35 DAA–harvest only. It had a negative
significant correlation with NAR at 5–15 DAA and ear RGR at 5–15
DAA. Similarly, the total dry matter at harvest was found to have
64
Nat
ure
Pre
cedi
ngs
: hdl
:101
01/n
pre.
2010
.482
1.1
: Pos
ted
25 A
ug 2
010
negative significant correlation with NAR at 5–15 DAA and ear RGR at
5–15 DAA. It had a high significant positive correlation with seed RGR
at harvest, 1000 grain weight, total chlorophyll at 20 DAA, total
sugars at 15 DAA, starch content at harvest, IAA at 15 DAA, GA at 7
DAA and ABA at 21 DAA. The stomatal conductance at 15 DAA was
found to have highly significant correlation with total sugars at 15
DAA while it had negative significant relationship with ear RGR at 5–
15 DAA. While photosynthetic rate was found to have a highly
significant positive correlation with seed AGR at 25–35 DAA, seed RGR
at 35 DAA–harvest and GA at 7 DAA while it had a significantly
negative relationship with ear RGR at 5–15 DAA.
65
Nat
ure
Pre
cedi
ngs
: hdl
:101
01/n
pre.
2010
.482
1.1
: Pos
ted
25 A
ug 2
010

LIST OF FIGURES
Fig. No.
TitleAfter page
1.Yield performance of hexaploid and wheat tetraploid wheat genotypes
33
2.Seed weight at different growth stages of wheat genotypes
72
3. Grain growth rate of different wheat genotypes 72
4.Endogenous hormonal content in developing grains of hexaploid wheat DL-1266-1
75
5.Endogenous hormonal content in developing grains of hexaploid wheat DL-1266-2
75
6.Endogenous hormonal content in developing grains of hexaploid wheat PDW-343
75
7.Endogenous hormonal content in developing grains of tetraploid wheat PDW-233
75
8.Endogenous hormonal content in developing grains of tetraploid wheat HD-4530
75
9.Endogenous hormonal content in developing grains of tetraploid wheat HI-8498
75
10.Total sugar content in developing grains of wheat genotypes
78
11.Starch content in developing grains of wheat genotypes
78
LIST OF TABLES
Nat
ure
Pre
cedi
ngs
: hdl
:101
01/n
pre.
2010
.482
1.1
: Pos
ted
25 A
ug 2
010
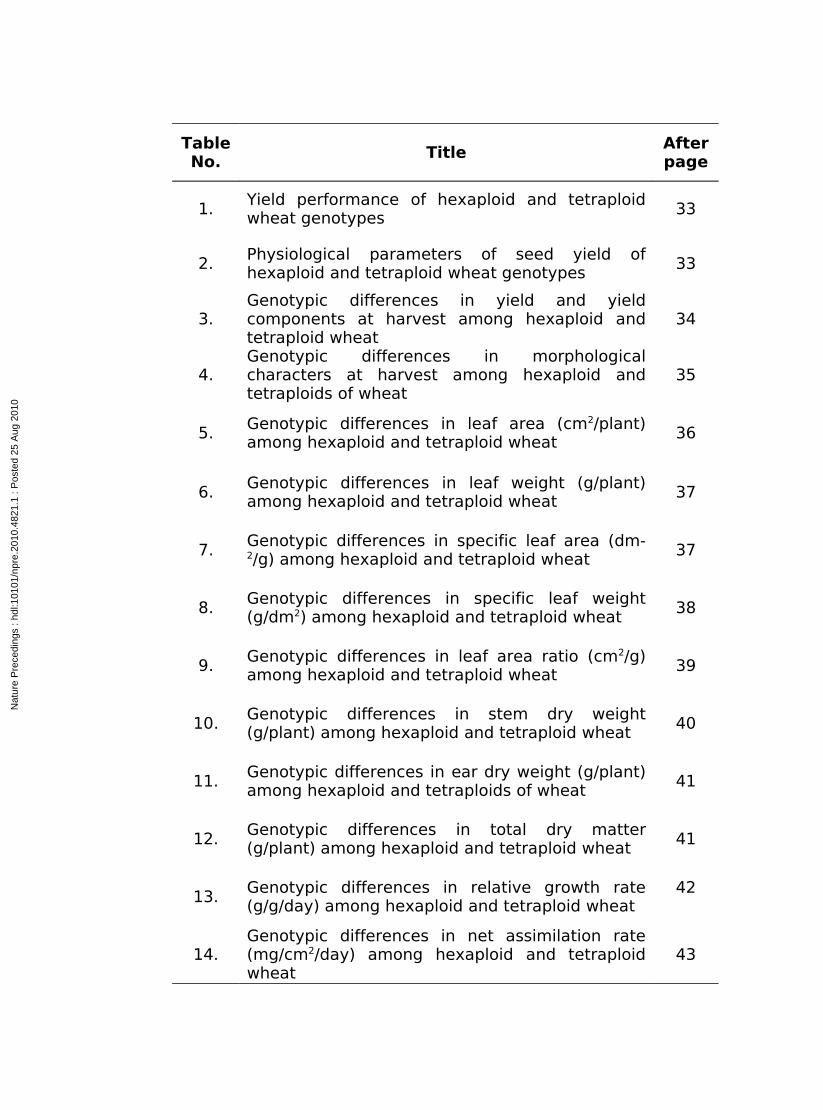
Table No.
TitleAfter page
1.Yield performance of hexaploid and tetraploid wheat genotypes
33
2.Physiological parameters of seed yield of hexaploid and tetraploid wheat genotypes
33
3.Genotypic differences in yield and yield components at harvest among hexaploid and tetraploid wheat
34
4.Genotypic differences in morphological characters at harvest among hexaploid and tetraploids of wheat
35
5.Genotypic differences in leaf area (cm2/plant) among hexaploid and tetraploid wheat
36
6.Genotypic differences in leaf weight (g/plant) among hexaploid and tetraploid wheat
37
7.Genotypic differences in specific leaf area (dm-2/g) among hexaploid and tetraploid wheat
37
8.Genotypic differences in specific leaf weight (g/dm2) among hexaploid and tetraploid wheat
38
9.Genotypic differences in leaf area ratio (cm2/g) among hexaploid and tetraploid wheat
39
10.Genotypic differences in stem dry weight (g/plant) among hexaploid and tetraploid wheat
40
11.Genotypic differences in ear dry weight (g/plant) among hexaploid and tetraploids of wheat
41
12.Genotypic differences in total dry matter (g/plant) among hexaploid and tetraploid wheat
41
13.Genotypic differences in relative growth rate (g/g/day) among hexaploid and tetraploid wheat
42
14.Genotypic differences in net assimilation rate (mg/cm2/day) among hexaploid and tetraploid wheat
43
Nat
ure
Pre
cedi
ngs
: hdl
:101
01/n
pre.
2010
.482
1.1
: Pos
ted
25 A
ug 2
010
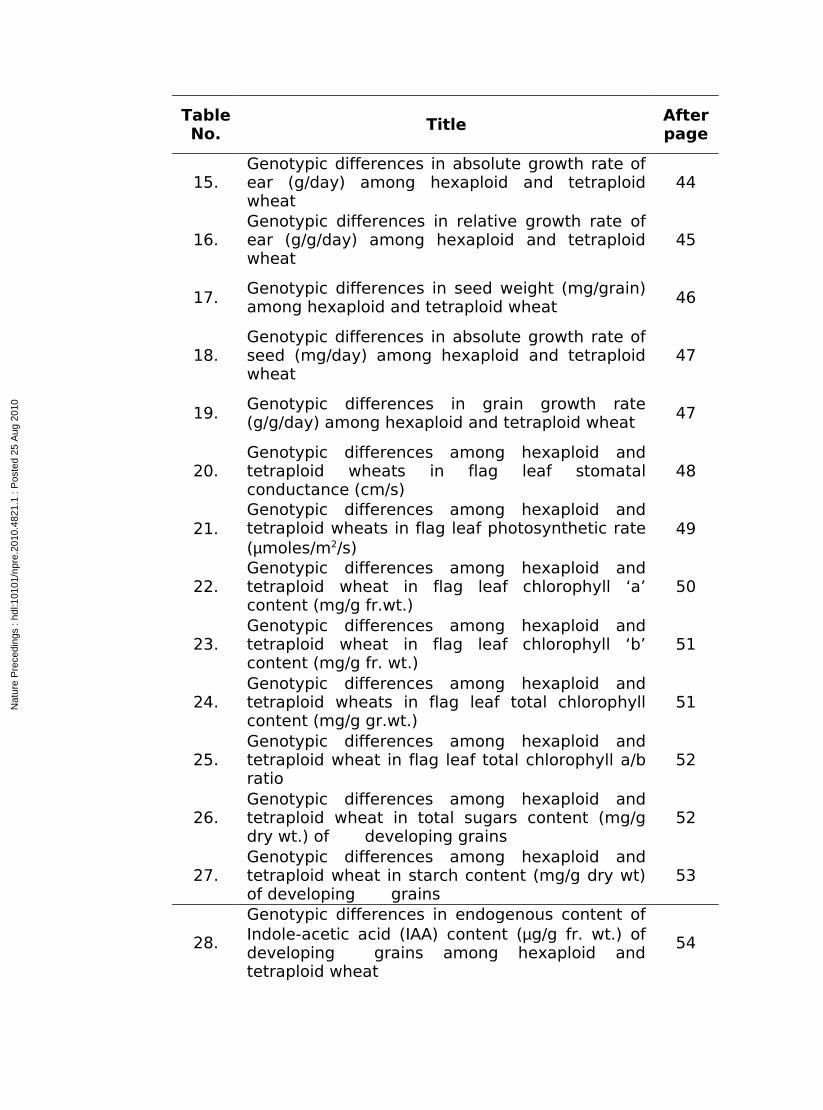
Table No.
TitleAfter page
15.Genotypic differences in absolute growth rate of ear (g/day) among hexaploid and tetraploid wheat
44
16.Genotypic differences in relative growth rate of ear (g/g/day) among hexaploid and tetraploid wheat
45
17.Genotypic differences in seed weight (mg/grain) among hexaploid and tetraploid wheat
46
18.Genotypic differences in absolute growth rate of seed (mg/day) among hexaploid and tetraploid wheat
47
19.Genotypic differences in grain growth rate (g/g/day) among hexaploid and tetraploid wheat
47
20.Genotypic differences among hexaploid and tetraploid wheats in flag leaf stomatal conductance (cm/s)
48
21.Genotypic differences among hexaploid and tetraploid wheats in flag leaf photosynthetic rate (µmoles/m2/s)
49
22.Genotypic differences among hexaploid and tetraploid wheat in flag leaf chlorophyll ‘a’ content (mg/g fr.wt.)
50
23.Genotypic differences among hexaploid and tetraploid wheat in flag leaf chlorophyll ‘b’ content (mg/g fr. wt.)
51
24.Genotypic differences among hexaploid and tetraploid wheats in flag leaf total chlorophyll content (mg/g gr.wt.)
51
25.Genotypic differences among hexaploid and tetraploid wheat in flag leaf total chlorophyll a/b ratio
52
26.Genotypic differences among hexaploid and tetraploid wheat in total sugars content (mg/g dry wt.) of developing grains
52
27.Genotypic differences among hexaploid and tetraploid wheat in starch content (mg/g dry wt) of developing grains
53
28.
Genotypic differences in endogenous content of Indole-acetic acid (IAA) content (µg/g fr. wt.) of developing grains among hexaploid and tetraploid wheat
54
Nat
ure
Pre
cedi
ngs
: hdl
:101
01/n
pre.
2010
.482
1.1
: Pos
ted
25 A
ug 2
010

Table No.
TitleAfter page
29.Genotypic differences in endogenous Gibberellic acid (GA3) content (µg/g fr. wt.) of developing grains among hexaploid and tetraploid wheat
55
30.Genotypic differences in endogenous Abscisic acid (ABA) content (µg/g fr. wt.) of developing grains among hexaploid and tetraploid wheat
56
31.Correlation co-efficients between the endogenous hormones among hexaploid and tetraploid wheat
57
32.Correlation co-efficients between hormonal contents and absolute grain growth rate among hexaploid and tetraploid wheat
58
33.Correlation co-efficients between hormonal contents and grain growth rate among hexaploid and tetraploid wheat
59
34.Correlation coefficients between few selected characters among hexaploid and tetraploid wheat
59
35.Yield attributes and physiological parameters of seed yield per cent wise over hexaploid wheat DL-1266-2
66
Nat
ure
Pre
cedi
ngs
: hdl
:101
01/n
pre.
2010
.482
1.1
: Pos
ted
25 A
ug 2
010

LIST OF PLATES
Plate No.
TitleAfter page
1.Seeds of Hexaploids: New Plant Types (Dl-1266-1 & DlL-1266-2) and extant variety (PBW-343)
62
2.Seeds of Tetraploids: HD-4530, HI-8498 and PDW-233
62
3.Spikes of Hexaploids: New Plant Types (Dl-1266-1 & DlL-1266-2) and extant variety (PBW-343)
67
4.Spikes of Tetraploids: HD-4530, HI-8498 and PDW-233
67
Nat
ure
Pre
cedi
ngs
: hdl
:101
01/n
pre.
2010
.482
1.1
: Pos
ted
25 A
ug 2
010
CONTENTS
ChapterNo.
Title Page No.
1. INTRODUCTION 1-4
2. REVIEW OF LITERATURE 5-21
3. MATERIALS AND METHODS 22-32
4. EXPERIMENTAL RESULTS 33-60
5. DISCUSSION 61-78
6. SUMMARY AND CONCLUSIONS 79-83
BIBLIOGROPHY i-xxviii
Nat
ure
Pre
cedi
ngs
: hdl
:101
01/n
pre.
2010
.482
1.1
: Pos
ted
25 A
ug 2
010
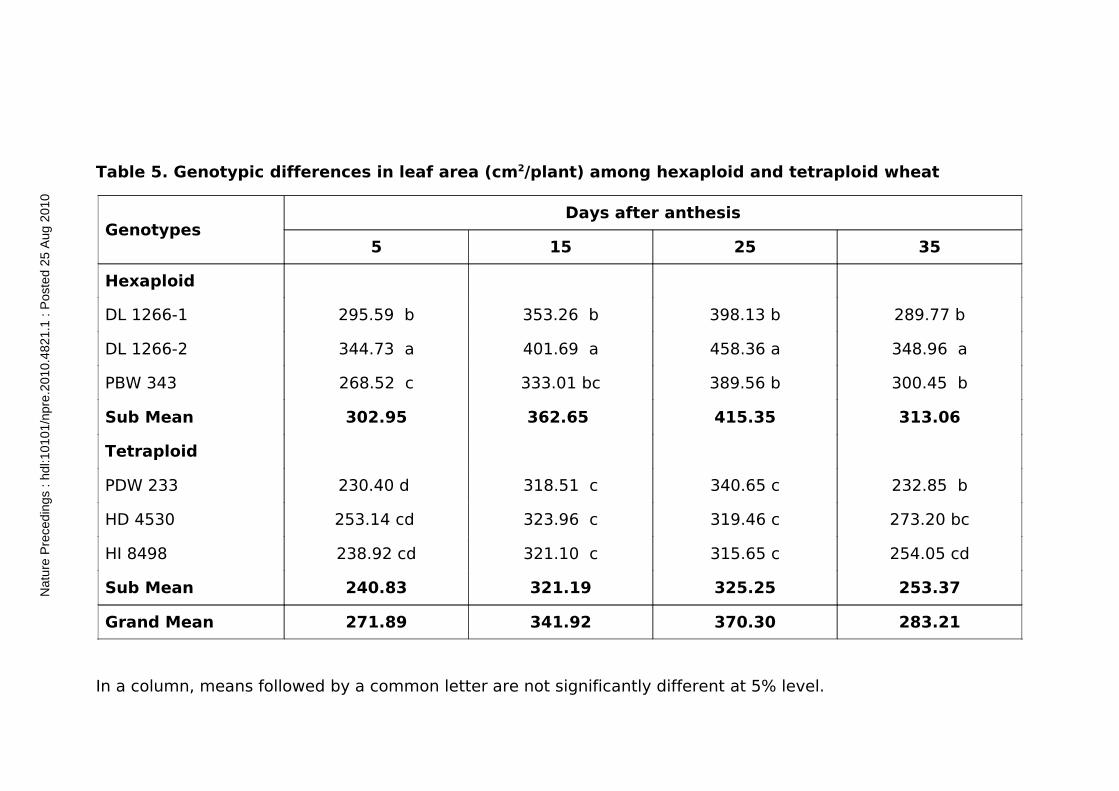
Table 5. Genotypic differences in leaf area (cm2/plant) among hexaploid and tetraploid wheat
In a column, means followed by a common letter are not significantly different at 5% level.
GenotypesDays after anthesis
5 15 25 35
Hexaploid
DL 1266-1 295.59 b 353.26 b 398.13 b 289.77 b
DL 1266-2 344.73 a 401.69 a 458.36 a 348.96 a
PBW 343 268.52 c 333.01 bc 389.56 b 300.45 b
Sub Mean 302.95 362.65 415.35 313.06
Tetraploid
PDW 233 230.40 d 318.51 c 340.65 c 232.85 b
HD 4530 253.14 cd 323.96 c 319.46 c 273.20 bc
HI 8498 238.92 cd 321.10 c 315.65 c 254.05 cd
Sub Mean 240.83 321.19 325.25 253.37
Grand Mean 271.89 341.92 370.30 283.21
Nat
ure
Pre
cedi
ngs
: hdl
:101
01/n
pre.
2010
.482
1.1
: Pos
ted
25 A
ug 2
010

Table 6. Genotypic differences in leaf weight (g/plant) among hexaploid and tetraploid wheat
In a column, means followed by a common letter are not significantly different at 5% level.
GenotypesDays after anthesis
5 15 25 35 Harvest
Hexaploid
DL 1266-1 2.84 a 3.59 b 4.23 ab 2.45 a 1.98 a
DL 1266-2 2.86 a 4.28 a 4.99 a 2.27 ab 1.99 a
PBW 343 2.62 ab 3.49 b 3.30 bc 2.12 bc 1.96 a
Sub Mean 2.77 3.79 4.17 2.28 1.98
Tetraploid
PDW 233 2.09 a 2.31 d 2.59 c 1.81 c 1.59 b
HD 4530 2.33 bc 2.94 c 3.21 bc 1.83 c 1.68 b
HI 8498 2.22 c 2.85 c 3.06 bc 1.82 c 1.67 b
Sub Mean 2.21 2.70 2.95 1.82 1.65
Total Mean 2.49 3.24 3.56 2.05 1.81
Nat
ure
Pre
cedi
ngs
: hdl
:101
01/n
pre.
2010
.482
1.1
: Pos
ted
25 A
ug 2
010

Table 7. Genotypic differences in specific leaf area (dm2/g) among hexaploid and tetraploid wheat
In a column, means followed by a common letter are not significantly different at 5% level.
GenotypesDays after anthesis
5 15 25 35
Hexaploid
DL 1266-1 1.053 c 0.984 bcd 0.941 c 1.348 d
DL 1266-2 1.031 bc 0.939 d 0.924 c 1.551 a
PBW 343 1.020 dc 0.954 cd 1.180 ab 1.417 c
Sub mean 1.034 0.959 1.015 1.438
Tetraploid
PDW 233 1.098 a 1.379 a 1.219 a 1.286 e
HD 4530 1.087 a 1.102 bc 1.061 bc 1.493 b
HI 8498 1.075 b 1.127 b 1.044 b 1.396 c
Sub Mean 1.087 1.202 1.108 1.391
Total Mean 1.091 1.081 1.062 1.415
Nat
ure
Pre
cedi
ngs
: hdl
:101
01/n
pre.
2010
.482
1.1
: Pos
ted
25 A
ug 2
010

Table 8. Genotypic differences in specific leaf weight (g/dm2) among hexaploid and tetraploid wheat
In a column, means followed by a common letter are not significantly different at 5% level.
GenotypesDays after anthesis
5 15 25 35
Hexaploid
DL 1266-1 0.95 ab 1.02 a 1.06 a 0.74 ab
DL 1266-2 0.97 a 1.07 a 1.08 a 0.65 d
PBW 343 0.98 a 1.05 a 0.85 cd 0.71 bcd
Sub mean 0.92 1.05 1.00 0.70
Tetraploid
PDW 233 0.91 c 0.73 c 0.82 d 0.78 a
HD 4530 0.92 bc 0.91 b 0.94 bc 0.67 cd
HI 8498 0.93 bc 0.89 b 0.96 b 0.72 abc
Sub Mean 0.92 0.84 0.91 0.72
Total Mean 0.92 0.95 0.95 0.71
Nat
ure
Pre
cedi
ngs
: hdl
:101
01/n
pre.
2010
.482
1.1
: Pos
ted
25 A
ug 2
010
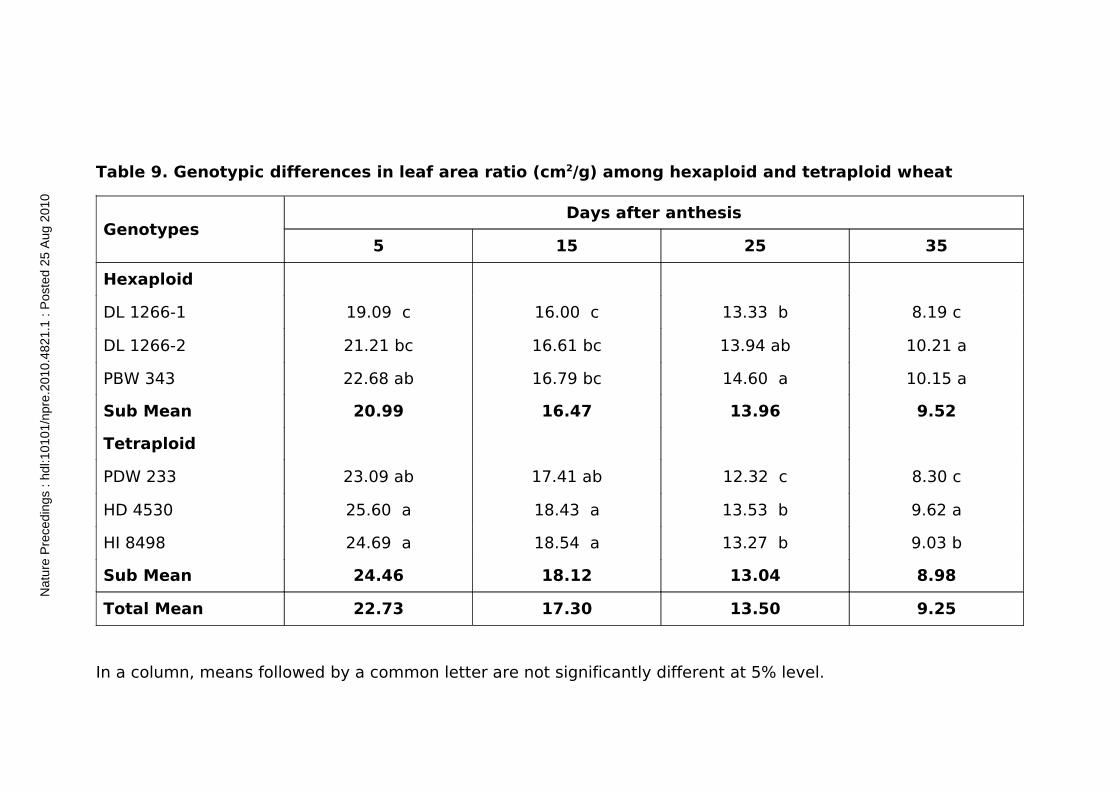
Table 9. Genotypic differences in leaf area ratio (cm2/g) among hexaploid and tetraploid wheat
In a column, means followed by a common letter are not significantly different at 5% level.
GenotypesDays after anthesis
5 15 25 35
Hexaploid
DL 1266-1 19.09 c 16.00 c 13.33 b 8.19 c
DL 1266-2 21.21 bc 16.61 bc 13.94 ab 10.21 a
PBW 343 22.68 ab 16.79 bc 14.60 a 10.15 a
Sub Mean 20.99 16.47 13.96 9.52
Tetraploid
PDW 233 23.09 ab 17.41 ab 12.32 c 8.30 c
HD 4530 25.60 a 18.43 a 13.53 b 9.62 a
HI 8498 24.69 a 18.54 a 13.27 b 9.03 b
Sub Mean 24.46 18.12 13.04 8.98
Total Mean 22.73 17.30 13.50 9.25
Nat
ure
Pre
cedi
ngs
: hdl
:101
01/n
pre.
2010
.482
1.1
: Pos
ted
25 A
ug 2
010

Table 10. Genotypic differences in stem dry weight (g/plant) among hexaploid and tetraploid wheat
In a column, means followed by a common letter are not significantly different at 5% level.
GenotypesDays after anthesis
5 15 25 35 Harvest
Hexaploid
DL 1266-1 6.62 a 9.31 a 12.17 ab 13.12 a 15.69 a
DL 1266-2 6.99 a 9.57 a 12.35 a 13.48 a 15.54 a
PBW 343 5.84 b 8.59 b 11.92 b 13.17 a 14.16 b
Sub Mean 6.48 9.16 12.15 13.26 15.13
Tetraploid
PDW 233 5.16 c 8.54 b 11.78 b 12.69 b 13.47 b
HD 4530 5.22 c 8.44 b 11.89 b 12.58 b 13.52 b
HI 8498 5.12 c 8.56 b 11.73 b 12.36 b 13.24 b
Sub Mean 5.17 8.51 11.80 12.54 13.41
Total Mean 5.83 8.83 11.97 13.06 14.27Nat
ure
Pre
cedi
ngs
: hdl
:101
01/n
pre.
2010
.482
1.1
: Pos
ted
25 A
ug 2
010
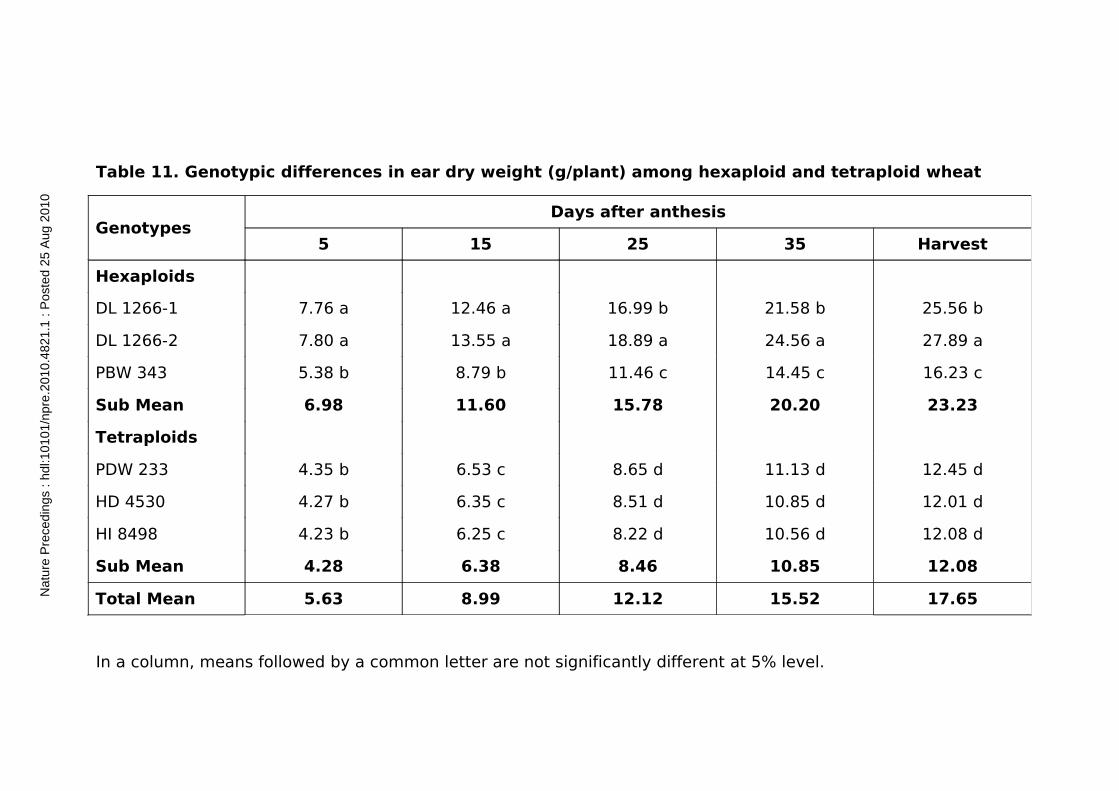
Table 11. Genotypic differences in ear dry weight (g/plant) among hexaploid and tetraploid wheat
In a column, means followed by a common letter are not significantly different at 5% level.
GenotypesDays after anthesis
5 15 25 35 Harvest
Hexaploids
DL 1266-1 7.76 a 12.46 a 16.99 b 21.58 b 25.56 b
DL 1266-2 7.80 a 13.55 a 18.89 a 24.56 a 27.89 a
PBW 343 5.38 b 8.79 b 11.46 c 14.45 c 16.23 c
Sub Mean 6.98 11.60 15.78 20.20 23.23
Tetraploids
PDW 233 4.35 b 6.53 c 8.65 d 11.13 d 12.45 d
HD 4530 4.27 b 6.35 c 8.51 d 10.85 d 12.01 d
HI 8498 4.23 b 6.25 c 8.22 d 10.56 d 12.08 d
Sub Mean 4.28 6.38 8.46 10.85 12.08
Total Mean 5.63 8.99 12.12 15.52 17.65Nat
ure
Pre
cedi
ngs
: hdl
:101
01/n
pre.
2010
.482
1.1
: Pos
ted
25 A
ug 2
010

Table 14. Genotypic differences in absolute growth rate of ear (g/day) among hexaploid and tetraploid
wheat
GenotypesDays after anthesis
5 15 25 35
Hexaploid
DL 1266-1 0.520 b 0.445 b 0.467 b 0.398 a
DL 1266-2 0.566 a 0.534 a 0.567 a 0.333 b
PBW 343 0.341 c 0.267 c 0.299 c 0.178 c
Sub Mean 0.476 0.415 0.444 0.303
Tetraploid
PDW 233 0.218 d 0.212 cd 0.248 cd 0.132 d
HD 4530 0.208 d 0.216 cd 0.234 d 0.116 d
HI 8498 0.202 d 0.197 d 0.234 d 0.122 d
Sub Mean 0.209 0.208 0.239 0.123
Total Mean 0.343 0.312 0.341 0.213
Nat
ure
Pre
cedi
ngs
: hdl
:101
01/n
pre.
2010
.482
1.1
: Pos
ted
25 A
ug 2
010
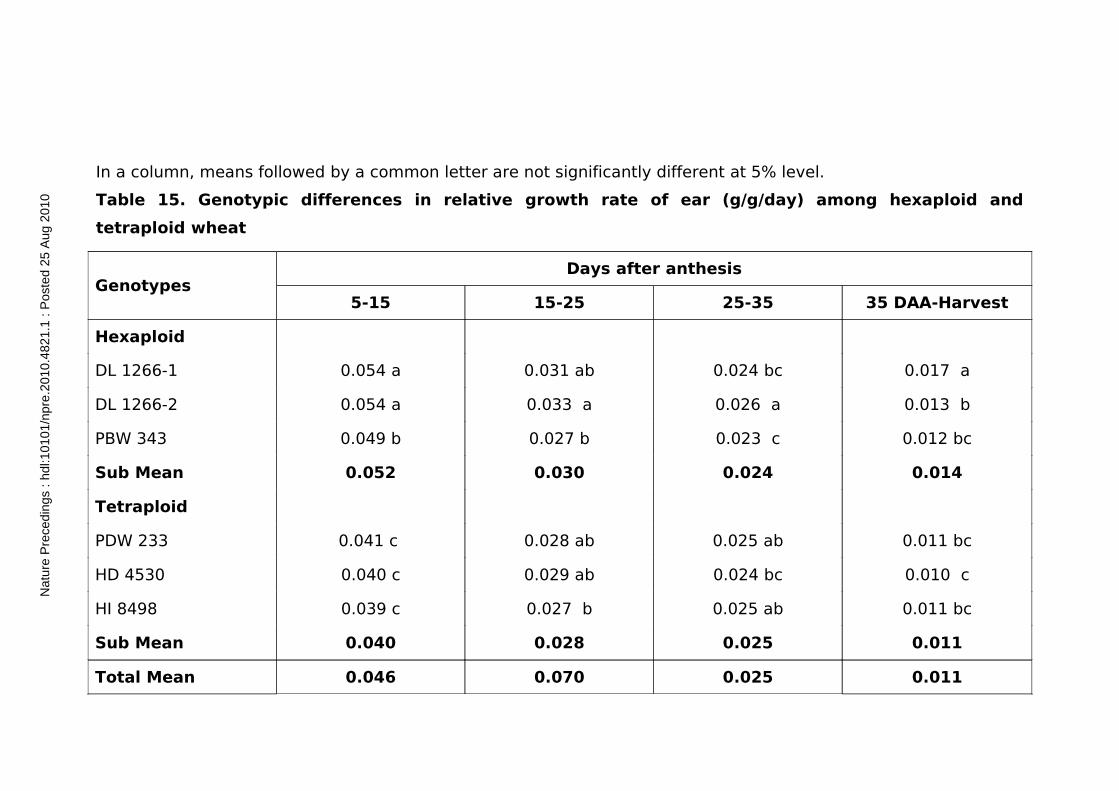
In a column, means followed by a common letter are not significantly different at 5% level.
Table 15. Genotypic differences in relative growth rate of ear (g/g/day) among hexaploid and
tetraploid wheat
GenotypesDays after anthesis
5-15 15-25 25-35 35 DAA-Harvest
Hexaploid
DL 1266-1 0.054 a 0.031 ab 0.024 bc 0.017 a
DL 1266-2 0.054 a 0.033 a 0.026 a 0.013 b
PBW 343 0.049 b 0.027 b 0.023 c 0.012 bc
Sub Mean 0.052 0.030 0.024 0.014
Tetraploid
PDW 233 0.041 c 0.028 ab 0.025 ab 0.011 bc
HD 4530 0.040 c 0.029 ab 0.024 bc 0.010 c
HI 8498 0.039 c 0.027 b 0.025 ab 0.011 bc
Sub Mean 0.040 0.028 0.025 0.011
Total Mean 0.046 0.070 0.025 0.011
Nat
ure
Pre
cedi
ngs
: hdl
:101
01/n
pre.
2010
.482
1.1
: Pos
ted
25 A
ug 2
010

In a column, means followed by a common letter are not significantly different at 5% level.
Table 16. Genotypic differences in seed weight (mg/grain) among hexaploid and tetraploid wheat
GenotypesDays after anthesis
5 15 25 35 Harvest
Hexaploid
DL 1266-1 6.27 a 15.56 a 37.57 a 54.89 a 60.15 a
DL 1266-2 6.43 a 16.35 a 38.47 a 56.12 a 61.25 a
PBW 343 5.24 b 13.15 bc 30.56 b 45.27 b 49.58 b
Sub Mean 5.98 15.02 35.53 52.09 56.99
Tetraploid
PDW 233 5.17 b 12.26 bc 28.69 b 40.35 b 43.69 b
HD 4530 5.12 b 11.83 c 26.14 b 36.45 b 39.54 b
HI 8498 5.27 b 14.29 ab 26.57 b 37.12 b 40.26 b
Sub Mean 5.19 12.80 27.13 37.97 41.16
Total Mean 5.58 13.91 31.33 45.03 49.08
Nat
ure
Pre
cedi
ngs
: hdl
:101
01/n
pre.
2010
.482
1.1
: Pos
ted
25 A
ug 2
010

In a column, means followed by a common letter are not significantly different at 5% level.
Table 17. Genotypic differences in absolute growth rate of seed (mg/day) among hexaploid and
tetraploid wheat
GenotypesDays after anthesis
5 – 15 15 – 25 25 – 35 35 - Harvest
Hexaploid
DL 1266-1 0.929 a 2.201 a 1.732 a 0.526 a
DL 1266-2 0.992 a 2.212 a 1.765 a 0.513 a
PBW 343 0.788 b 1.741 b 1.471 b 0.431 b
Sub Mean 0.903 2.051 1.656 0.490
Tetraploid
PDW 233 0.709 bc 1.643 b 1.166 c 0.334 c
HD 4530 0.671 c 1.431 b 1.031 c 0.309 c
HI 8498 0.701 c 1.428 b 1.055 c 0.314 c
Sub Mean 0.693 1.500 1.084 0.319
Total Mean 0.798 1.776 1.370 0.405
Nat
ure
Pre
cedi
ngs
: hdl
:101
01/n
pre.
2010
.482
1.1
: Pos
ted
25 A
ug 2
010

In a column, means followed by a common letter are not significantly different at 5% level.
Table 18. Genotypic differences in grain growth rate (g/g/day) among hexaploid and tetraploid wheat
Genotypes Days after anthesis
5 – 15 15 – 25 25 – 35 35 - Harvest
Hexaploid
DL 1266-1 0.091 a 0.088 a 0.041 a 0.009 a
DL 1266-2 0.093 a 0.086 a 0.037 abc 0.009 a
PBW 343 0.092 a 0.084 ab 0.039 ab 0.009 a
Sub Mean 0.092 0.086 0.039 0.009
Tetraploid
PDW 233 0.086 ab 0.085 a 0.034 bc 0.008 a
HD 4530 0.079 b 0.079 bc 0.033 c 0.009 a
HI 8498 0.077 b 0.077 c 0.033 c 0.008 a
Sub Mean 0.081 0.080 0.033 0.008
Total Mean 0.086 0.083 0.036 0.009
Nat
ure
Pre
cedi
ngs
: hdl
:101
01/n
pre.
2010
.482
1.1
: Pos
ted
25 A
ug 2
010
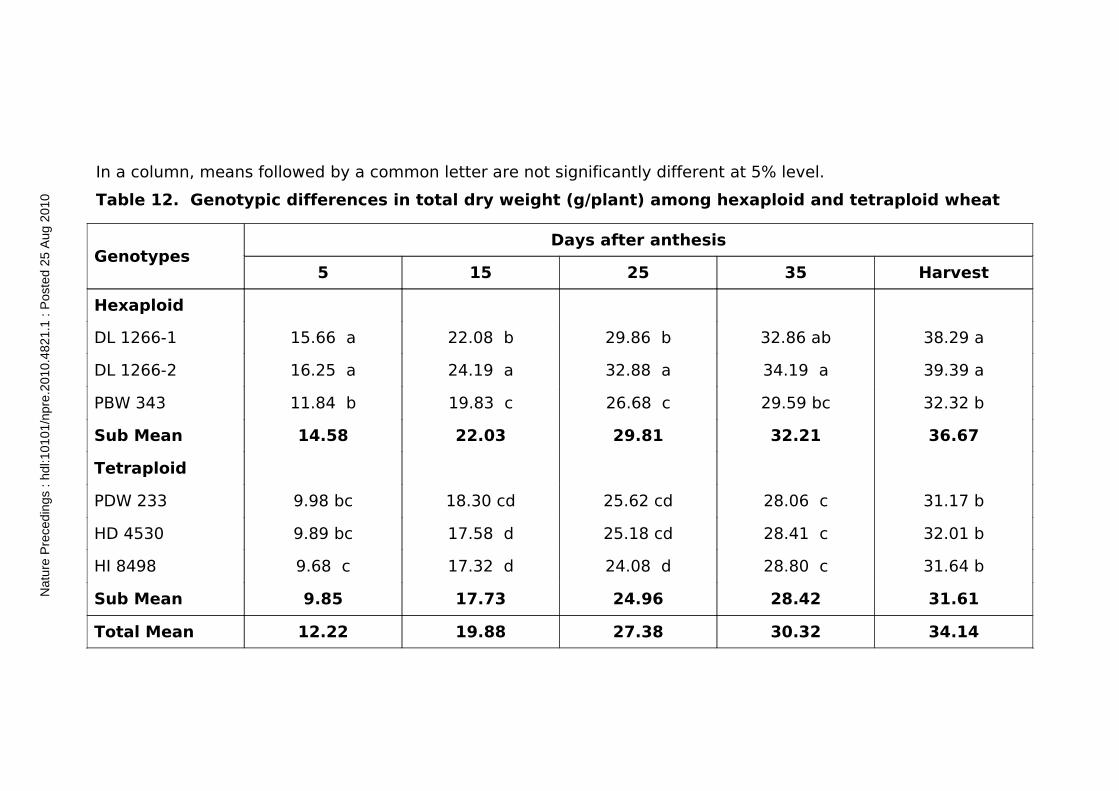
In a column, means followed by a common letter are not significantly different at 5% level.
Table 12. Genotypic differences in total dry weight (g/plant) among hexaploid and tetraploid wheat
GenotypesDays after anthesis
5 15 25 35 Harvest
Hexaploid
DL 1266-1 15.66 a 22.08 b 29.86 b 32.86 ab 38.29 a
DL 1266-2 16.25 a 24.19 a 32.88 a 34.19 a 39.39 a
PBW 343 11.84 b 19.83 c 26.68 c 29.59 bc 32.32 b
Sub Mean 14.58 22.03 29.81 32.21 36.67
Tetraploid
PDW 233 9.98 bc 18.30 cd 25.62 cd 28.06 c 31.17 b
HD 4530 9.89 bc 17.58 d 25.18 cd 28.41 c 32.01 b
HI 8498 9.68 c 17.32 d 24.08 d 28.80 c 31.64 b
Sub Mean 9.85 17.73 24.96 28.42 31.61
Total Mean 12.22 19.88 27.38 30.32 34.14
Nat
ure
Pre
cedi
ngs
: hdl
:101
01/n
pre.
2010
.482
1.1
: Pos
ted
25 A
ug 2
010
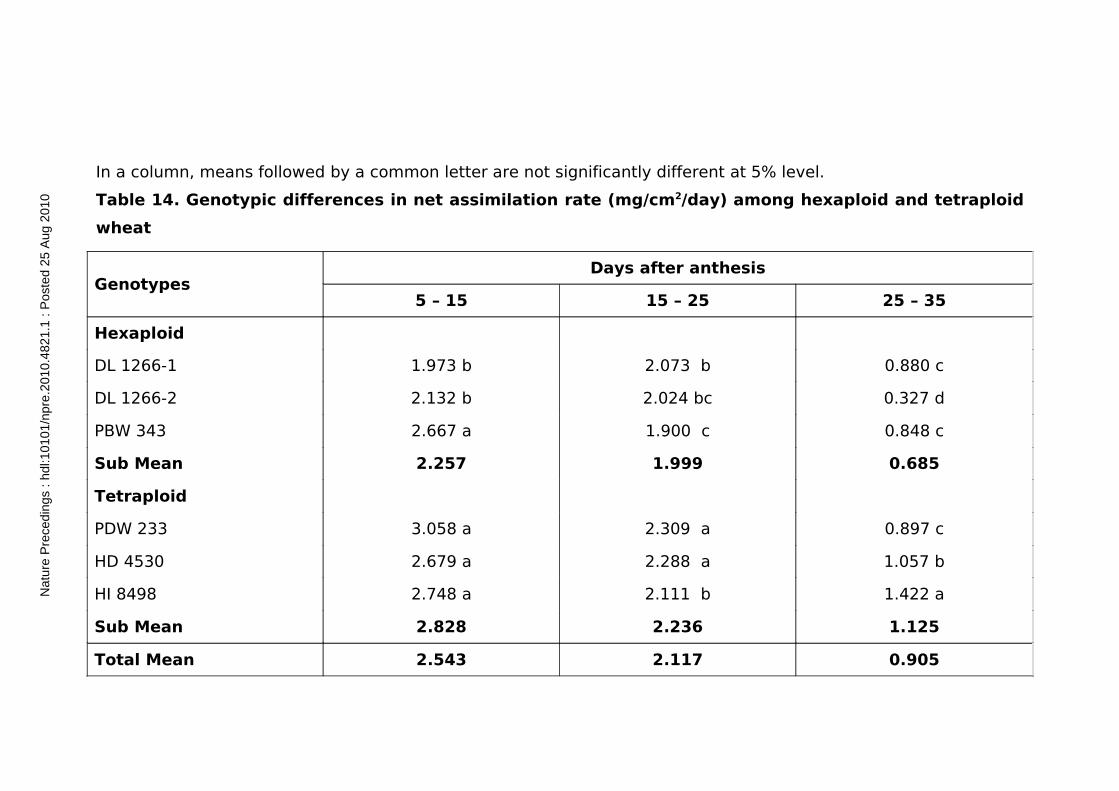
In a column, means followed by a common letter are not significantly different at 5% level.
Table 14. Genotypic differences in net assimilation rate (mg/cm2/day) among hexaploid and tetraploid
wheat
GenotypesDays after anthesis
5 – 15 15 – 25 25 – 35
Hexaploid
DL 1266-1 1.973 b 2.073 b 0.880 c
DL 1266-2 2.132 b 2.024 bc 0.327 d
PBW 343 2.667 a 1.900 c 0.848 c
Sub Mean 2.257 1.999 0.685
Tetraploid
PDW 233 3.058 a 2.309 a 0.897 c
HD 4530 2.679 a 2.288 a 1.057 b
HI 8498 2.748 a 2.111 b 1.422 a
Sub Mean 2.828 2.236 1.125
Total Mean 2.543 2.117 0.905
Nat
ure
Pre
cedi
ngs
: hdl
:101
01/n
pre.
2010
.482
1.1
: Pos
ted
25 A
ug 2
010
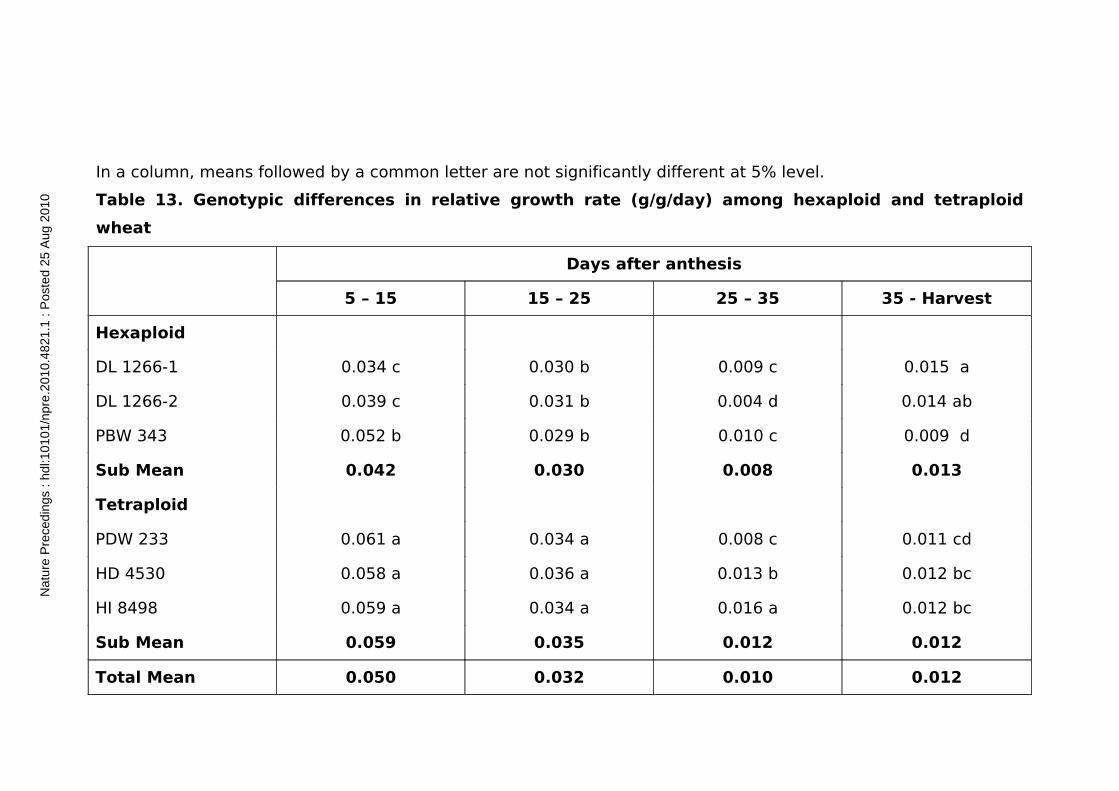
In a column, means followed by a common letter are not significantly different at 5% level.
Table 13. Genotypic differences in relative growth rate (g/g/day) among hexaploid and tetraploid
wheat
Days after anthesis
5 – 15 15 – 25 25 – 35 35 - Harvest
Hexaploid
DL 1266-1 0.034 c 0.030 b 0.009 c 0.015 a
DL 1266-2 0.039 c 0.031 b 0.004 d 0.014 ab
PBW 343 0.052 b 0.029 b 0.010 c 0.009 d
Sub Mean 0.042 0.030 0.008 0.013
Tetraploid
PDW 233 0.061 a 0.034 a 0.008 c 0.011 cd
HD 4530 0.058 a 0.036 a 0.013 b 0.012 bc
HI 8498 0.059 a 0.034 a 0.016 a 0.012 bc
Sub Mean 0.059 0.035 0.012 0.012
Total Mean 0.050 0.032 0.010 0.012
Nat
ure
Pre
cedi
ngs
: hdl
:101
01/n
pre.
2010
.482
1.1
: Pos
ted
25 A
ug 2
010

In a column, means followed by a common letter are not significantly different at 5% level.
Table 22. Genotypic differences among hexaploid and tetraploid wheat in flag leaf chlorophyll ‘a’
content (mg/g fr.wt.)
Nat
ure
Pre
cedi
ngs
: hdl
:101
01/n
pre.
2010
.482
1.1
: Pos
ted
25 A
ug 2
010

In a column, means followed by a common letter are not significantly different at 5% level.
GenotypesDays after anthesis
10 20 30
Hexaploid
DL 1266-1 2.892 a 1.990 b 1.239 b
DL 1266-2 2.919 a 2.440 a 1.331 a
PBW 343 2.775 a 1.727 b 1.087 c
Sub Mean 2.862 2.052 1.219
Tetraploid
PDW 233 2.634 a 1.551 c 0.869 d
HD 4530 2.587 a 1.616 c 0.962 d
HI 8498 1.694 b 1.588 c 0.973 e
Sub Mean 2.305 1.585 0.934
Total Mean 2.584 1.819 1.077
Nat
ure
Pre
cedi
ngs
: hdl
:101
01/n
pre.
2010
.482
1.1
: Pos
ted
25 A
ug 2
010

Table 23. Genotypic differences among hexaploid and tetraploid wheat in flag leaf chlorophyll ‘b’
content (mg/g fr. wt.)
GenotypesDays after anthesis
10 20 30
Hexaploid
DL 1266-1 1.602 ab 1.501 a 0.991 b
DL 1266-2 1.725 a 1.679 a 1.104 a
PBW 343 1.446 bc 1.255 b 0.935 c
Sub Mean 1.591 1.478 1.010
Tetraploid
PDW 233 1.412 bc 1.102 b 0.735 f
HD 4530 1.381 c 1.211 b 0.828 e
HI 8498 1.317 c 1.155 b 0.876 d
Sub Mean 1.370 1.156 0.813
Total Mean 1.481 1.317 0.911
Nat
ure
Pre
cedi
ngs
: hdl
:101
01/n
pre.
2010
.482
1.1
: Pos
ted
25 A
ug 2
010

In a column, means followed by a common letter are not significantly different at 5% level.
Table 25. Genotypic differences among hexaploid and tetraploid wheat in flag leaf total chlorophyll
a/b ratio
GenotypesDays after anthesis
10 20 30
Hexaploid
DL 1266-1 1.805 ab 1.326 b 1.250 a
DL 1266-2 1.688 b 1.453 a 1.206 b
PBW 343 1.863 ab 1.376 ab 1.163 c
Sub Mean 1.785 1.385 1.206
Tetraploid
PDW 233 1.665 b 1.420 a 1.114 d
HD 4530 1.873 ab 1.334 b 1.162 c
HI 8498 1.970 a 1.375 ab 1.111 d
Sub Mean 1.836 1.376 1.129
Total Mean 1.811 1.381 1.168
Nat
ure
Pre
cedi
ngs
: hdl
:101
01/n
pre.
2010
.482
1.1
: Pos
ted
25 A
ug 2
010

In a column, means followed by a common letter are not significantly different at 5% level.
Table 24. Genotypic differences among hexaploid and tetraploid wheat in flag leaf total chlorophyll
content
(mg/g fr. wt.)
GenotypesDays after anthesis
10 20 30
Hexaploid
DL 1266-1 3.113 a 3.841 ab 2.224 b
DL 1266-2 3.096 a 3.878 a 2.437 a
PBW 343 2.887 ab 2.882 abc 2.154 b
Sub Mean 3.028 3.534 2.272
Tetraploid
PDW 233 2.192 c 2.553 b 1.391 d
HD 4530 2.517 bc 2.827 b 1.573 c
HI 8498 2.238 c 2.743 b 1.497 cd
Sub Mean 2.316 2.708 1.487
Total Mean 2.672 3.121 1.879
Nat
ure
Pre
cedi
ngs
: hdl
:101
01/n
pre.
2010
.482
1.1
: Pos
ted
25 A
ug 2
010
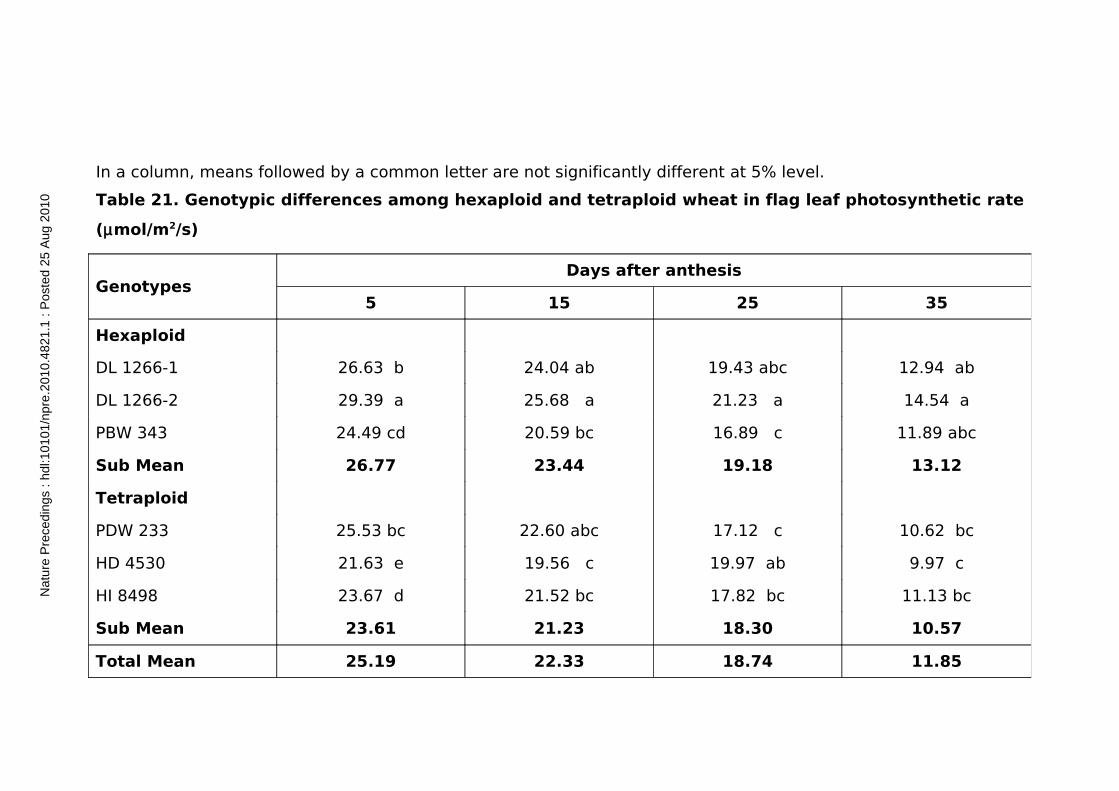
In a column, means followed by a common letter are not significantly different at 5% level.
Table 21. Genotypic differences among hexaploid and tetraploid wheat in flag leaf photosynthetic rate
(µmol/m2/s)
GenotypesDays after anthesis
5 15 25 35
Hexaploid
DL 1266-1 26.63 b 24.04 ab 19.43 abc 12.94 ab
DL 1266-2 29.39 a 25.68 a 21.23 a 14.54 a
PBW 343 24.49 cd 20.59 bc 16.89 c 11.89 abc
Sub Mean 26.77 23.44 19.18 13.12
Tetraploid
PDW 233 25.53 bc 22.60 abc 17.12 c 10.62 bc
HD 4530 21.63 e 19.56 c 19.97 ab 9.97 c
HI 8498 23.67 d 21.52 bc 17.82 bc 11.13 bc
Sub Mean 23.61 21.23 18.30 10.57
Total Mean 25.19 22.33 18.74 11.85
Nat
ure
Pre
cedi
ngs
: hdl
:101
01/n
pre.
2010
.482
1.1
: Pos
ted
25 A
ug 2
010

In a column, means followed by a common letter are not significantly different at 5% level.
Table 20. Genotypic differences among hexaploid and tetraploid wheat in flag leaf stomatal
conductance (cm/s)
GenotypesDays after anthesis
5 15 25 35
Hexaploid
DL 1266-1 1.784 ab 2.129 b 1.961 ab 1.093 a
DL 1266-2 1.853 a 2.592 a 2.019 a 1.126 a
PBW 343 1.702 bc 2.001 c 1.818 abc 1.086 a
Sub Mean 1.780 2.241 1.933 1.102
Tetraploid
PDW 233 1.408 d 1.551 e 1.164 c 0.867 b
HD 4530 1.612 c 1.856 d 1.790 ab 0.812 b
HI 8498 1.481 d 1.817 d 1.692 b 0.853 b
Sub Mean 1.500 1.741 1.549 0.844
Total Mean 1.640 1.991 1.741 0.973
Nat
ure
Pre
cedi
ngs
: hdl
:101
01/n
pre.
2010
.482
1.1
: Pos
ted
25 A
ug 2
010
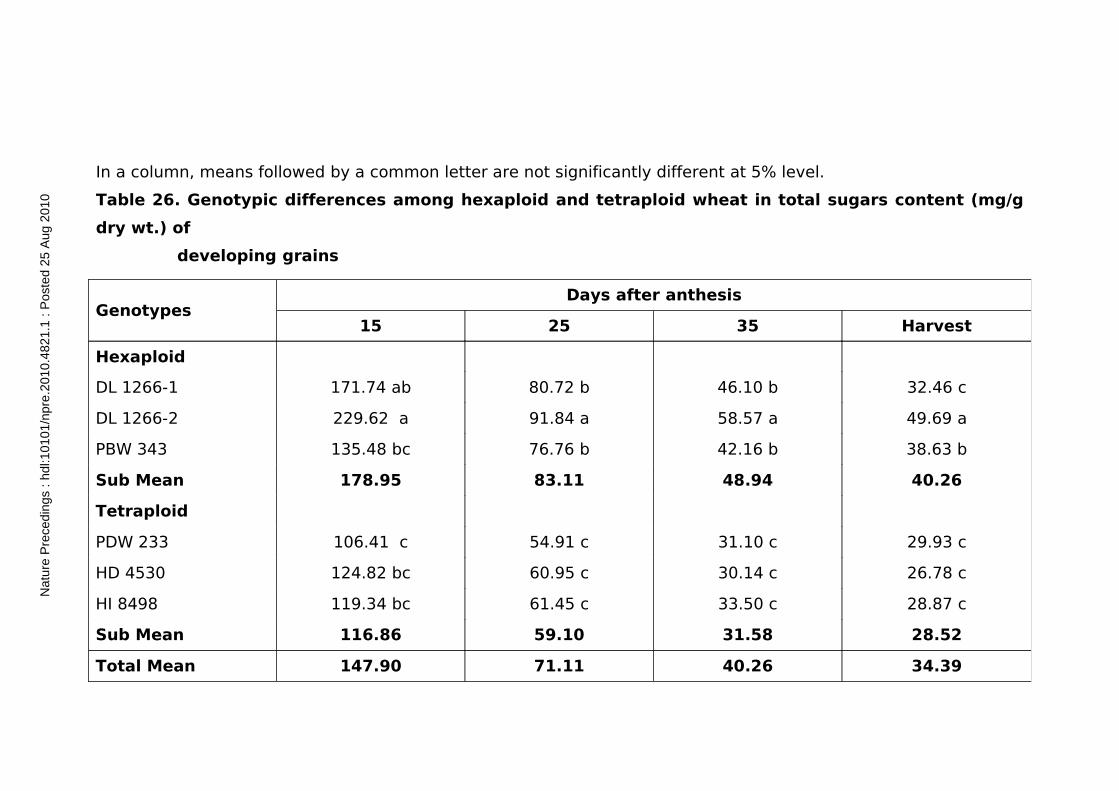
In a column, means followed by a common letter are not significantly different at 5% level.
Table 26. Genotypic differences among hexaploid and tetraploid wheat in total sugars content (mg/g
dry wt.) of
developing grains
GenotypesDays after anthesis
15 25 35 Harvest
Hexaploid
DL 1266-1 171.74 ab 80.72 b 46.10 b 32.46 c
DL 1266-2 229.62 a 91.84 a 58.57 a 49.69 a
PBW 343 135.48 bc 76.76 b 42.16 b 38.63 b
Sub Mean 178.95 83.11 48.94 40.26
Tetraploid
PDW 233 106.41 c 54.91 c 31.10 c 29.93 c
HD 4530 124.82 bc 60.95 c 30.14 c 26.78 c
HI 8498 119.34 bc 61.45 c 33.50 c 28.87 c
Sub Mean 116.86 59.10 31.58 28.52
Total Mean 147.90 71.11 40.26 34.39
Nat
ure
Pre
cedi
ngs
: hdl
:101
01/n
pre.
2010
.482
1.1
: Pos
ted
25 A
ug 2
010
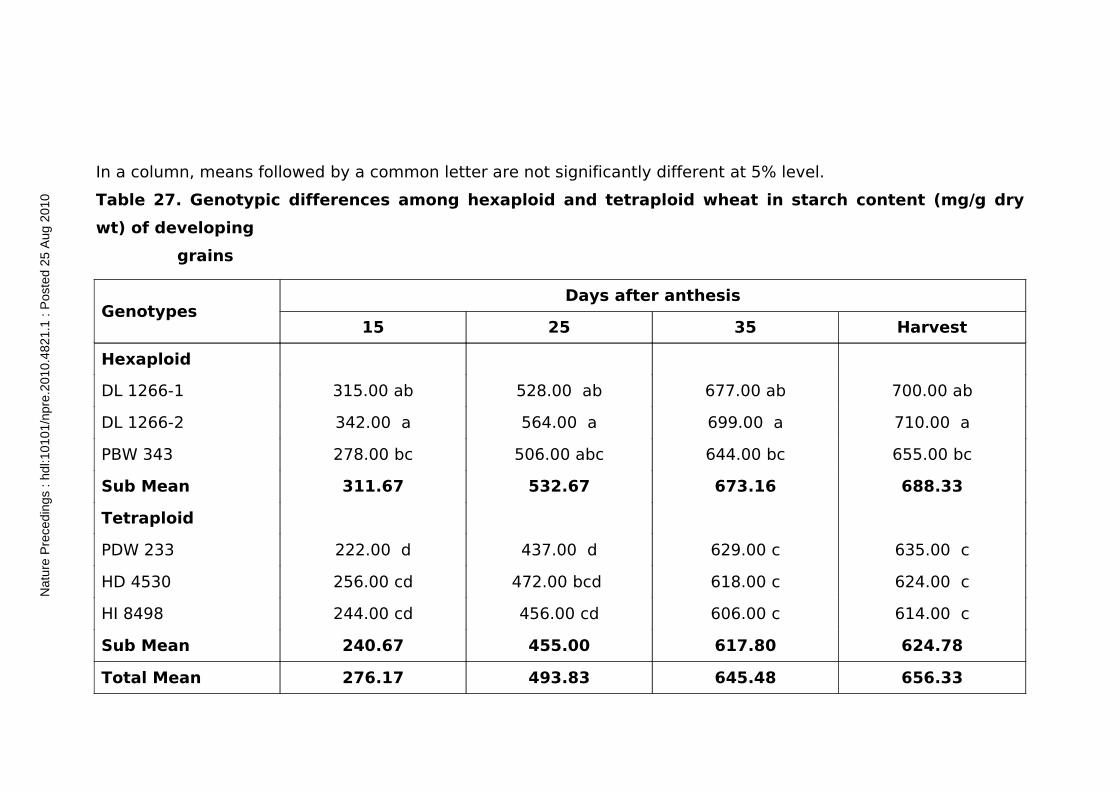
In a column, means followed by a common letter are not significantly different at 5% level.
Table 27. Genotypic differences among hexaploid and tetraploid wheat in starch content (mg/g dry
wt) of developing
grains
GenotypesDays after anthesis
15 25 35 Harvest
Hexaploid
DL 1266-1 315.00 ab 528.00 ab 677.00 ab 700.00 ab
DL 1266-2 342.00 a 564.00 a 699.00 a 710.00 a
PBW 343 278.00 bc 506.00 abc 644.00 bc 655.00 bc
Sub Mean 311.67 532.67 673.16 688.33
Tetraploid
PDW 233 222.00 d 437.00 d 629.00 c 635.00 c
HD 4530 256.00 cd 472.00 bcd 618.00 c 624.00 c
HI 8498 244.00 cd 456.00 cd 606.00 c 614.00 c
Sub Mean 240.67 455.00 617.80 624.78
Total Mean 276.17 493.83 645.48 656.33
Nat
ure
Pre
cedi
ngs
: hdl
:101
01/n
pre.
2010
.482
1.1
: Pos
ted
25 A
ug 2
010

In a column, means followed by a common letter are not significantly different at 5% level.
Table 28. Genotypic differences in endogenous content of Indole-acetic acid (IAA) content (µg/g fr.
wt.) of developing
grains among hexaploid and tetraploid wheat
GenotypesDays after anthesis
7 15 25 35
Hexaploid
DL 1266-1 11.25 a 29.48 a 18.49 a 11.16 a
DL 1266-2 12.58 a 31.24 a 17.25 ab 10.38 b
PBW 343 8.68 b 22.10 bc 16.47 b 10.26 b
Sub Mean 10.84 27.61 17.40 10.60
Tetraploid
PDW 233 8.15 b 19.48 c 13.89 c 9.09 c
HD 4530 8.24 b 22.47 b 15.43 bc 9.45 c
HI 8498 8.22 b 20.20 cd 14.26 c 9.48 c
Sub Mean 8.20 20.72 14.53 9.34
Total Mean 9.52 24.16 15.97 9.97
Nat
ure
Pre
cedi
ngs
: hdl
:101
01/n
pre.
2010
.482
1.1
: Pos
ted
25 A
ug 2
010
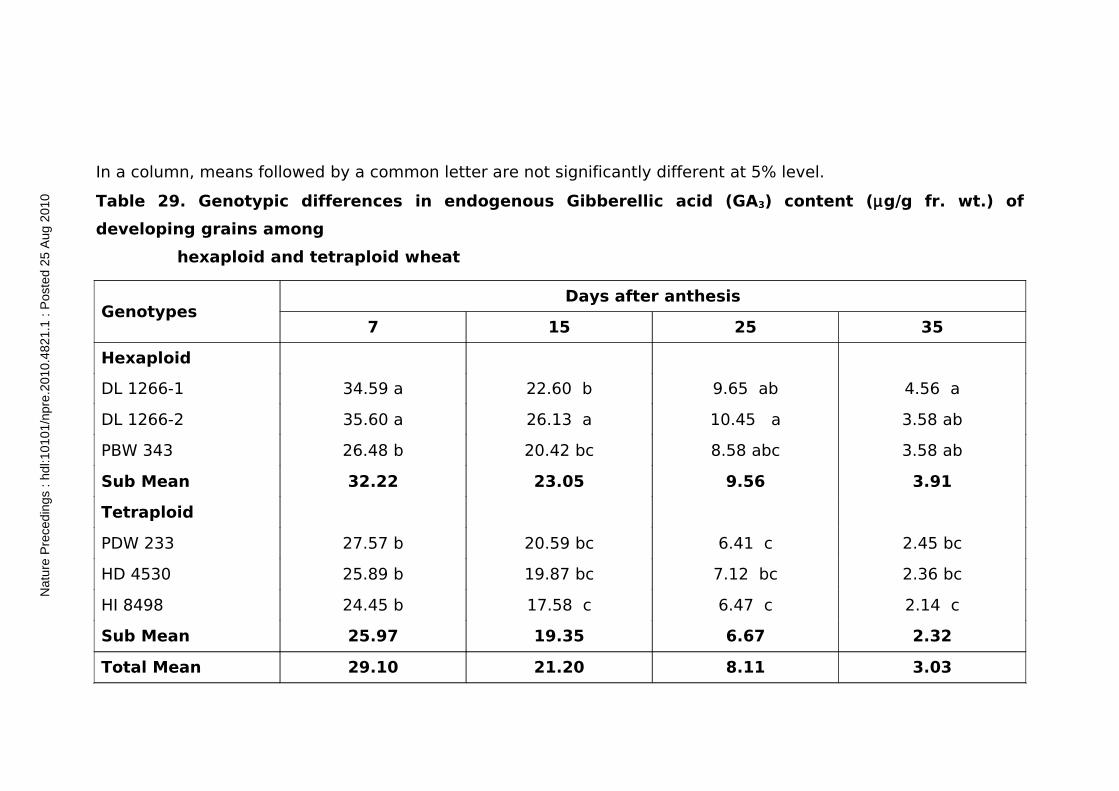
In a column, means followed by a common letter are not significantly different at 5% level.
Table 29. Genotypic differences in endogenous Gibberellic acid (GA3) content (µg/g fr. wt.) of
developing grains among
hexaploid and tetraploid wheat
GenotypesDays after anthesis
7 15 25 35
Hexaploid
DL 1266-1 34.59 a 22.60 b 9.65 ab 4.56 a
DL 1266-2 35.60 a 26.13 a 10.45 a 3.58 ab
PBW 343 26.48 b 20.42 bc 8.58 abc 3.58 ab
Sub Mean 32.22 23.05 9.56 3.91
Tetraploid
PDW 233 27.57 b 20.59 bc 6.41 c 2.45 bc
HD 4530 25.89 b 19.87 bc 7.12 bc 2.36 bc
HI 8498 24.45 b 17.58 c 6.47 c 2.14 c
Sub Mean 25.97 19.35 6.67 2.32
Total Mean 29.10 21.20 8.11 3.03
Nat
ure
Pre
cedi
ngs
: hdl
:101
01/n
pre.
2010
.482
1.1
: Pos
ted
25 A
ug 2
010

In a column, means followed by a common letter are not significantly different at 5% level.
Table 30. Genotypic differences in endogenous Abscisic acid (ABA) content (µg/g fr. wt.) of developing
grains among
hexaploid and tetraploid wheat
GenotypesDays after anthesis
7 15 25 35
Hexaploid
DL 1266-1 9.48 ab 22.35 b 32.59 b 13.66 ab
DL 1266-2 10.47 a 26.58 a 34.58 a 14.59 a
PBW 343 7.54 abc 20.36 b 25.48 d 12.45 bc
Sub Mean 9.16 23.10 30.88 13.57
Tetraploid
PDW 233 7.58 c 19.48 bc 26.48 cd 11.98 c
HD 4530 7.87 bc 16.58 c 28.48 c 11.14 c
HI 8498 6.46 c 19.58 bc 27.58 c 12.36 bc
Sub Mean 7.30 18.55 27.51 11.83
Total Mean 8.23 20.82 29.20 12.70
Nat
ure
Pre
cedi
ngs
: hdl
:101
01/n
pre.
2010
.482
1.1
: Pos
ted
25 A
ug 2
010
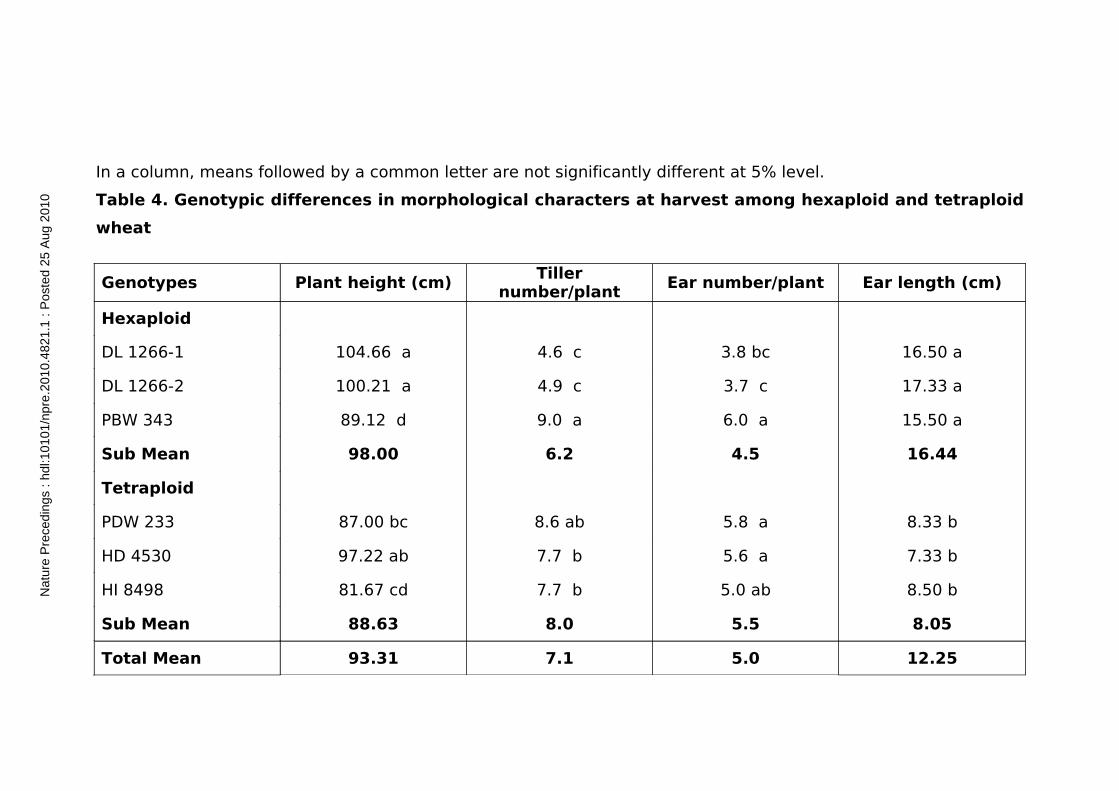
In a column, means followed by a common letter are not significantly different at 5% level.
Table 4. Genotypic differences in morphological characters at harvest among hexaploid and tetraploid
wheat
Genotypes Plant height (cm)Tiller
number/plantEar number/plant Ear length (cm)
Hexaploid
DL 1266-1 104.66 a 4.6 c 3.8 bc 16.50 a
DL 1266-2 100.21 a 4.9 c 3.7 c 17.33 a
PBW 343 89.12 d 9.0 a 6.0 a 15.50 a
Sub Mean 98.00 6.2 4.5 16.44
Tetraploid
PDW 233 87.00 bc 8.6 ab 5.8 a 8.33 b
HD 4530 97.22 ab 7.7 b 5.6 a 7.33 b
HI 8498 81.67 cd 7.7 b 5.0 ab 8.50 b
Sub Mean 88.63 8.0 5.5 8.05
Total Mean 93.31 7.1 5.0 12.25
Nat
ure
Pre
cedi
ngs
: hdl
:101
01/n
pre.
2010
.482
1.1
: Pos
ted
25 A
ug 2
010

In a column, means followed by a common letter are not significantly different at 5% level.
Table 3. Genotypic differences in yield and yield components at harvest among hexaploid and
tetraploid wheat
GenotypesYield
(g/plant)Seed
number/ear
Seed weight/ear
(g)
1000-grain weight (g)
Chaff/ear (g) HI %
Hexaploid
DL 1266-1 16.49 ab 70.00 ab 3.84 ab 54.25 a 2.83 a 56.96 ab
DL 1266-2 17.54 a 73.00 a 3.89 a 55.44 a 2.73 a 58.90 a
PBW 343 16.46 ab 63.00 c 2.63 bc 46.92 b 1.49 bc 50.67 abc
Sub Mean 16.83 68.70 3.45 52.20 2.35 55.51
Tetraploid
PDW 233 11.14 c 65.00 bc 3.38 abc 44.98 b 1.39 c 45.46 c
HD 4530 12.51 abc 60.00 bc 2.01 c 45.62 b 1.12 c 49.71 bc
HI 8498 12.22 bc 63.00 b 3.29 bc 46.67 b 1.93 b 48.64 bc
Sub Mean 11.96 62.70 2.89 45.75 1.48 47.94
Total Mean 14.39 65.67 3.17 49.04 1.92 51.72
Nat
ure
Pre
cedi
ngs
: hdl
:101
01/n
pre.
2010
.482
1.1
: Pos
ted
25 A
ug 2
010

In a column, means followed by a common letter are not significantly different at 5% level.
Table 32. Correlation co-efficients between hormonal contents and absolute grain growth rate among
hexaploid and
tetraploid wheat
Hormones 5-15 DAA 15-25 DAA 25-35 DAA 35 DAA - Harvest
IAA 7 DAA 0.975** 0.942** 0.907* 0.902*
IAA 15 DAA 0.968** 0.981** 0.930** 0.924**
IAA 25 DAA 0.883* 0.951** 0.952** 0.959**
IAA 35 DAA 0.809 0.875* 0.887* 0.918**
GA 7 DAA 0.955** 0.925** 0.884* 0.891*
GA 15 DAA 0.930** 0.871* 0.858* 0.836*
GA 25 DAA 0.925** 0.850* 0.883* 0.879*
GA 35 DAA 0.846* 0.886* 0.926** 0.948**
ABA 7 DAA 0.948** 0.929** 0.880* 0.864*
ABA 15 DAA 0.935** 0.876* 0.870* 0.839*
ABA 25 DAA 0.838* 0.797 0.716 0.728*
Nat
ure
Pre
cedi
ngs
: hdl
:101
01/n
pre.
2010
.482
1.1
: Pos
ted
25 A
ug 2
010

ABA 35 DAA 0.909** 0.829* 0.842* 0.851*
* Significant at 5% r = 0.811 ** Significant at 1% r = 0.917
Table 33. Correlation co-efficients between hormonal contents and grain growth rate among
hexaploid and tetraploid
wheat
Hormones 5-15 DAA 15-25 DAA 25-35 DAA 35 DAA - Harvest
IAA 7 DAA 0.978** 0.651 0.0608 0.607
IAA 15 DAA 0.971** 0.789 0.639 0.618
IAA 25 DAA 0.881* 0.929** 0.838* 0.841*
IAA 35 DAA 0.815* 0.829 0.790 0.883
GA 7 DAA 0.969** 0.616 0.570 0.605
GA 15 DAA 0.931** 0.575 0.615 0.546
GA 25 DAA 0.927** 0.526 0.721 0.711
GA 35 DAA 0.849* 0.809 0.873* 0.931**
ABA 7 DAA 0.953** 0.684 0.579 0.526
ABA 15 DAA 0.929** 0.601 0.645 0.546
ABA 25 DAA 0.855* 0.440 0.313 0.387
Nat
ure
Pre
cedi
ngs
: hdl
:101
01/n
pre.
2010
.482
1.1
: Pos
ted
25 A
ug 2
010

ABA 35 DAA 0.910* 0.459 0.614 0.670
* Significant at 5% (r = 0.811); ** Significant at 1% (r = 0.917)
Nat
ure
Pre
cedi
ngs
: hdl
:101
01/n
pre.
2010
.482
1.1
: Pos
ted
25 A
ug 2
010

Table 31. Correlation co-efficients between the endogenous hormones among hexaploid and tetraploid wheat
* Significant at 5% (r = 0.811); ** Significant at 1% (r = 0.917)
IAA 7 DAA
IAA 15 DAA
IAA 25 DAA
IAA 35 DAA
GA 7 DAA
GA 15 DAA
GA 25 DAA
GA 35 DAA
ABA 7 DAA
ABA 15 DAA
ABA 25 DAA
ABA 35 DAA
IAA 7 DAA
1.000 0.977** 0.802 0.735 0.963** 0.909* 0.870* 0.739 0.946** 0.917* 0.933** 0.939**
IAA 15 DAA 1.000 0.882* 0.798 0.944** 0.882* 0.825* 0.789 0.951** 0.892* 0.882* 0.860*
IAA 25 DAA 1.000 0.958** 0.796 0.715 0.905* 0.665 0.840* 0.810 0.614 0.696
IAA 35 DAA 1.000 0.746 0.584 0.958** 0.788 0.718 0.967** 0.766 0.900*
GA 7DAA 1.000 0.935** 0.922** 0.778 0.963** 0.907* 0.908* 0.880*
GA 15DAA 1.000 0.958** 0.686 0.975** 0.990** 0.777 0.800
GA 25DAA 1.000 0.788 0.905* 0.933** 0.724 0.833*
GA 35DAA 1.000 0.718 0.665 0.552 0.695
ABA 7 DAA 1.000 0.375 0.840* 0.800
ABA 15 DAA 1.000 0.766 0.810
ABA 25 DAA 1.000 0.900*
ABA 35 DAA 1.000
Nat
ure
Pre
cedi
ngs
: hdl
:101
01/n
pre.
2010
.482
1.1
: Pos
ted
25 A
ug 2
010
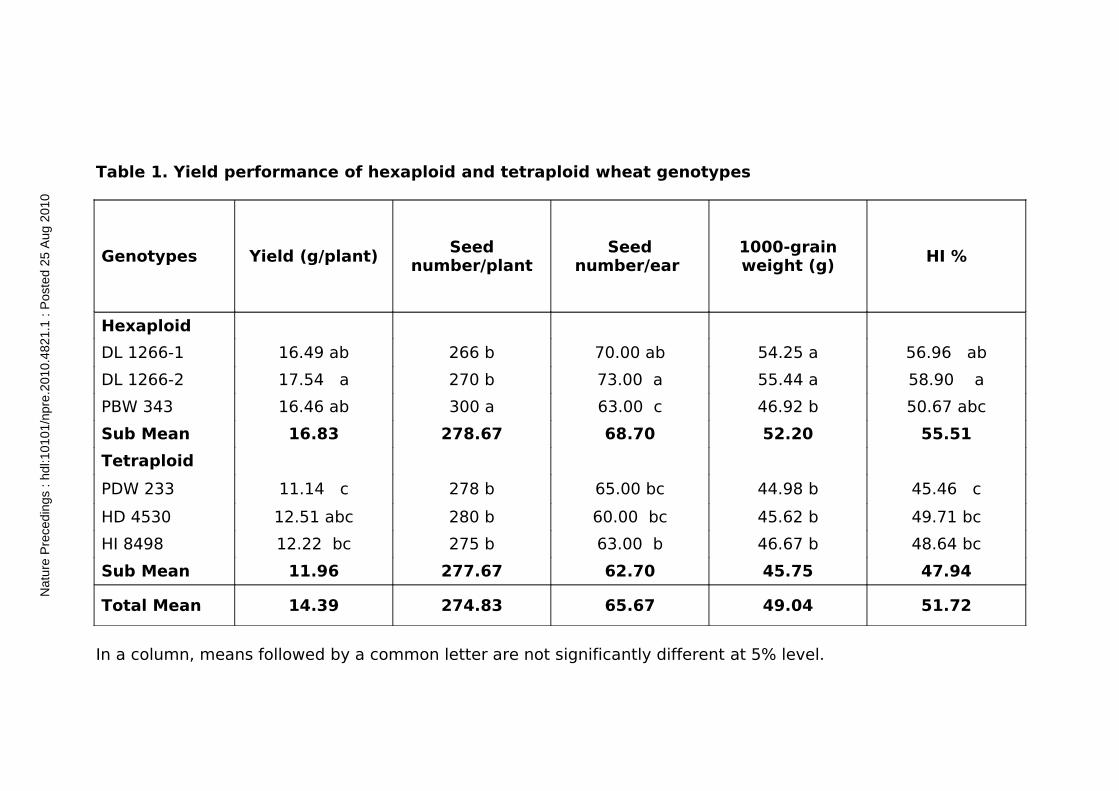
Table 1. Yield performance of hexaploid and tetraploid wheat genotypes
Genotypes Yield (g/plant)Seed
number/plantSeed
number/ear 1000-grain weight (g)
HI %
Hexaploid
DL 1266-1 16.49 ab 266 b 70.00 ab 54.25 a 56.96 ab
DL 1266-2 17.54 a 270 b 73.00 a 55.44 a 58.90 a
PBW 343 16.46 ab 300 a 63.00 c 46.92 b 50.67 abc
Sub Mean 16.83 278.67 68.70 52.20 55.51
Tetraploid
PDW 233 11.14 c 278 b 65.00 bc 44.98 b 45.46 c
HD 4530 12.51 abc 280 b 60.00 bc 45.62 b 49.71 bc
HI 8498 12.22 bc 275 b 63.00 b 46.67 b 48.64 bc
Sub Mean 11.96 277.67 62.70 45.75 47.94
Total Mean 14.39 274.83 65.67 49.04 51.72
In a column, means followed by a common letter are not significantly different at 5% level.
Nat
ure
Pre
cedi
ngs
: hdl
:101
01/n
pre.
2010
.482
1.1
: Pos
ted
25 A
ug 2
010
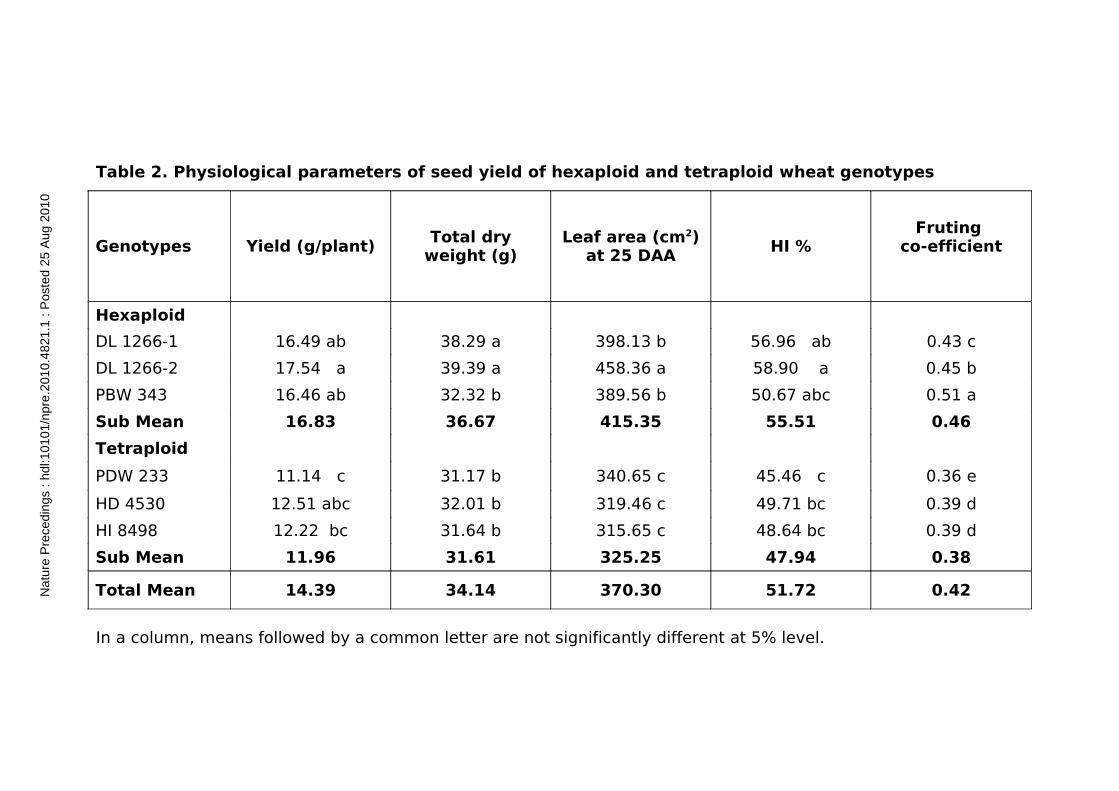
Table 2. Physiological parameters of seed yield of hexaploid and tetraploid wheat genotypes
Genotypes Yield (g/plant)Total dry
weight (g)Leaf area (cm2)
at 25 DAAHI %
Fruting co-efficient
Hexaploid
DL 1266-1 16.49 ab 38.29 a 398.13 b 56.96 ab 0.43 c
DL 1266-2 17.54 a 39.39 a 458.36 a 58.90 a 0.45 b
PBW 343 16.46 ab 32.32 b 389.56 b 50.67 abc 0.51 a
Sub Mean 16.83 36.67 415.35 55.51 0.46
Tetraploid
PDW 233 11.14 c 31.17 b 340.65 c 45.46 c 0.36 e
HD 4530 12.51 abc 32.01 b 319.46 c 49.71 bc 0.39 d
HI 8498 12.22 bc 31.64 b 315.65 c 48.64 bc 0.39 d
Sub Mean 11.96 31.61 325.25 47.94 0.38
Total Mean 14.39 34.14 370.30 51.72 0.42
In a column, means followed by a common letter are not significantly different at 5% level.
Nat
ure
Pre
cedi
ngs
: hdl
:101
01/n
pre.
2010
.482
1.1
: Pos
ted
25 A
ug 2
010
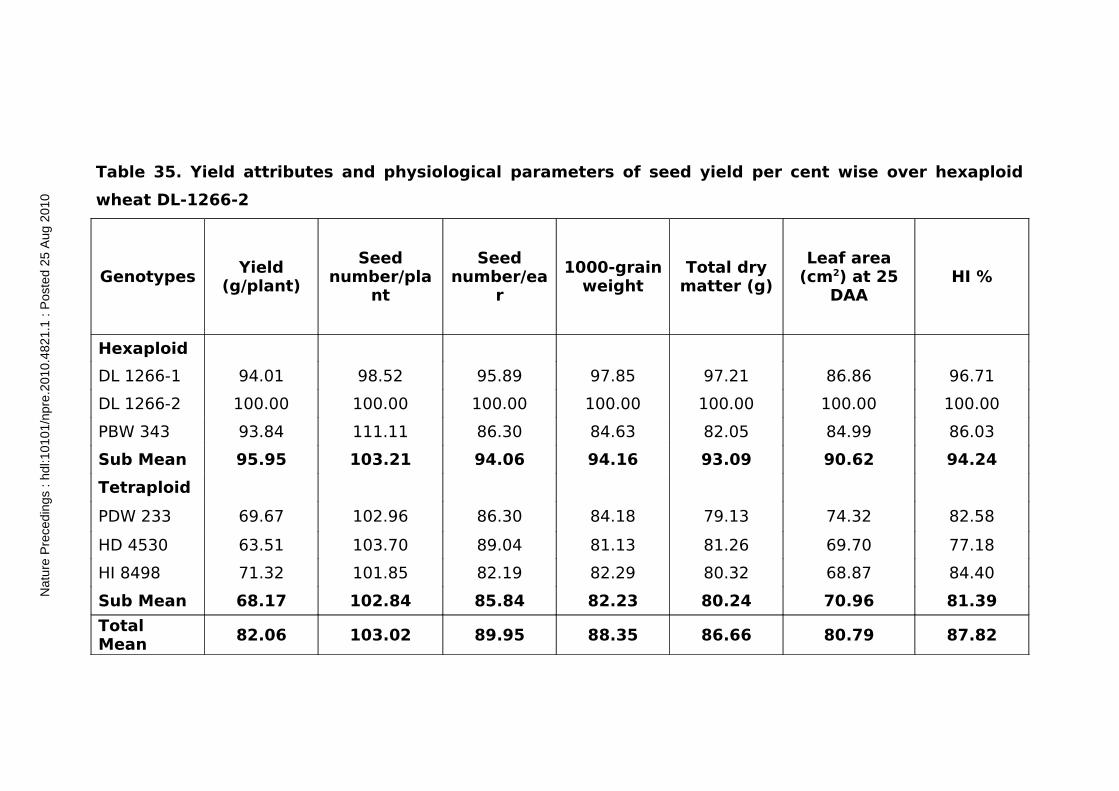
Table 35. Yield attributes and physiological parameters of seed yield per cent wise over hexaploid
wheat DL-1266-2
GenotypesYield
(g/plant)
Seed number/pla
nt
Seed number/ea
r
1000-grain weight
Total dry matter (g)
Leaf area (cm2) at 25
DAAHI %
Hexaploid
DL 1266-1 94.01 98.52 95.89 97.85 97.21 86.86 96.71
DL 1266-2 100.00 100.00 100.00 100.00 100.00 100.00 100.00
PBW 343 93.84 111.11 86.30 84.63 82.05 84.99 86.03
Sub Mean 95.95 103.21 94.06 94.16 93.09 90.62 94.24
Tetraploid
PDW 233 69.67 102.96 86.30 84.18 79.13 74.32 82.58
HD 4530 63.51 103.70 89.04 81.13 81.26 69.70 77.18
HI 8498 71.32 101.85 82.19 82.29 80.32 68.87 84.40
Sub Mean 68.17 102.84 85.84 82.23 80.24 70.96 81.39
Total Mean
82.06 103.02 89.95 88.35 86.66 80.79 87.82
Nat
ure
Pre
cedi
ngs
: hdl
:101
01/n
pre.
2010
.482
1.1
: Pos
ted
25 A
ug 2
010
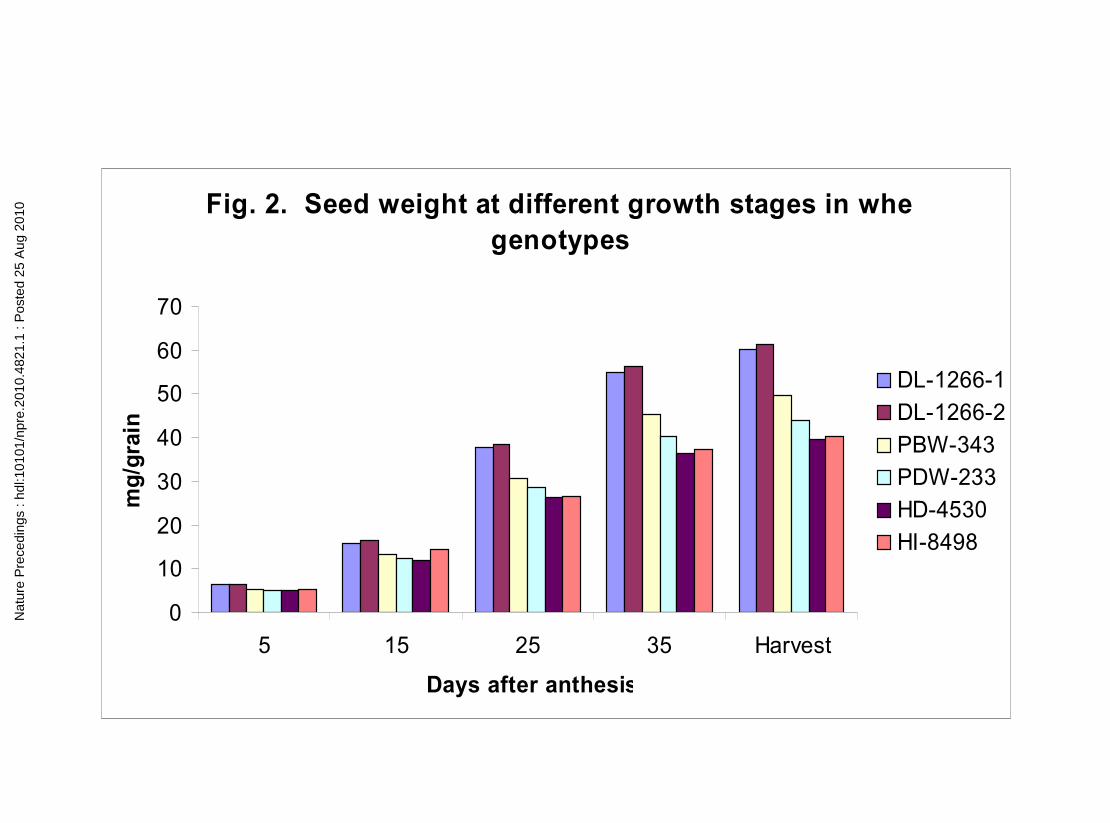
Fig. 2. Seed weight at different growth stages in wheat genotypes
0
10
20
30
40
50
60
70
5 15 25 35 Harvest
Days after anthesis
mg
/gra
in
DL-1266-1
DL-1266-2
PBW-343
PDW-233
HD-4530
HI-8498
Nat
ure
Pre
cedi
ngs
: hdl
:101
01/n
pre.
2010
.482
1.1
: Pos
ted
25 A
ug 2
010
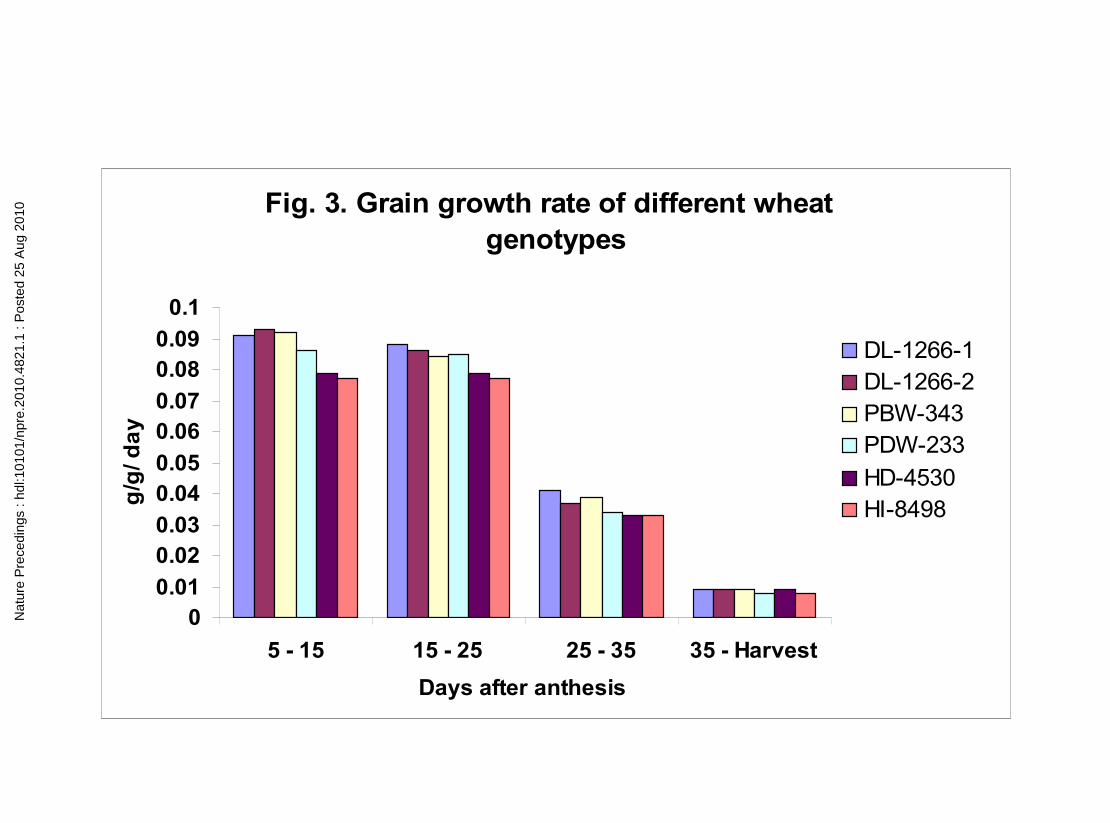
Fig. 3. Grain growth rate of different wheat genotypes
00.01
0.020.03
0.040.05
0.060.07
0.080.09
0.1
5 - 15 15 - 25 25 - 35 35 - Harvest
Days after anthesis
g/g
/ da
y
DL-1266-1DL-1266-2PBW-343PDW-233
HD-4530HI-8498
Nat
ure
Pre
cedi
ngs
: hdl
:101
01/n
pre.
2010
.482
1.1
: Pos
ted
25 A
ug 2
010
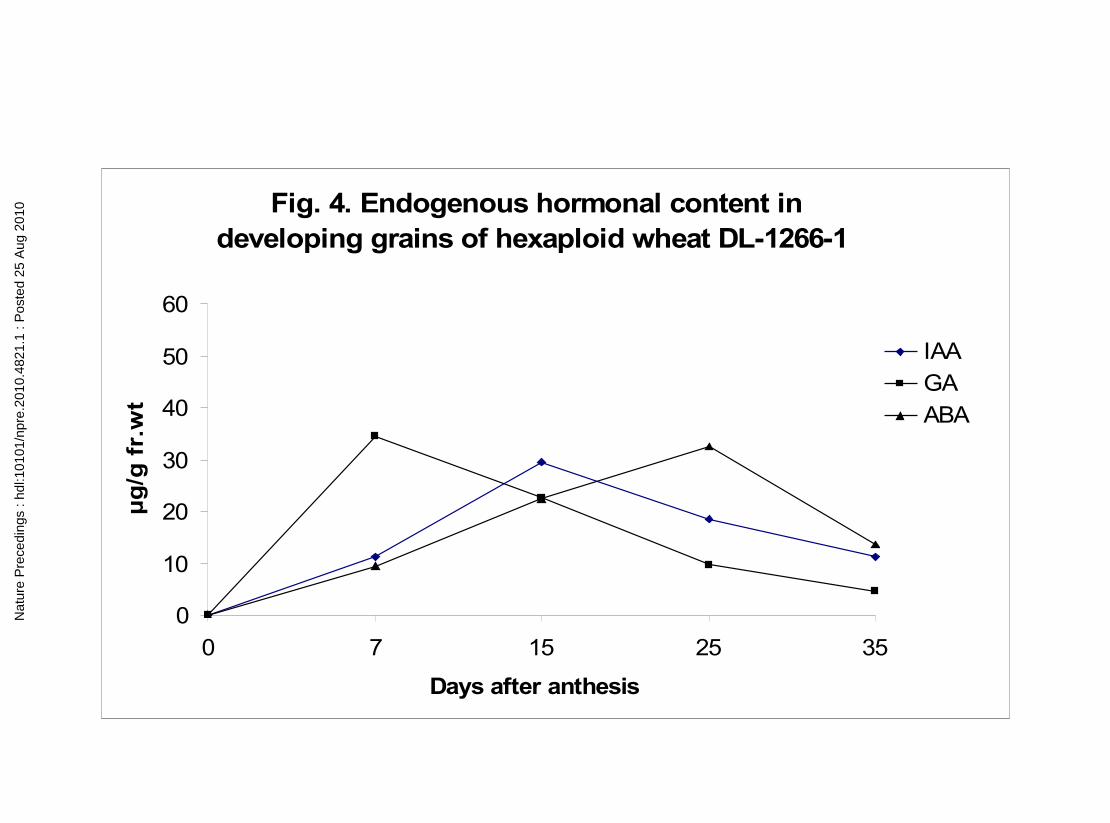
Fig. 4. Endogenous hormonal content in developing grains of hexaploid wheat DL-1266-1
0
10
20
30
40
50
60
0 7 15 25 35
Days after anthesis
μg
/g f
r.w
t.
IAA
GA
ABA
Nat
ure
Pre
cedi
ngs
: hdl
:101
01/n
pre.
2010
.482
1.1
: Pos
ted
25 A
ug 2
010

Fig. 5. Endogenous hormonal content in developing grains of hexaploid wheat DL-1266-2
0
10
20
30
40
50
60
0 7 15 25 35
Days after anthesis
μg
/g fr
.wt.
IAA
GA
ABA
Nat
ure
Pre
cedi
ngs
: hdl
:101
01/n
pre.
2010
.482
1.1
: Pos
ted
25 A
ug 2
010

Fig. 6. Endogenous hormonal content in developing grains of hexaploid wheat PDW-343
0
10
20
30
40
50
60
0 7 15 25 35
Days after anthesis
μd
/g f
r.w
t.
IAA
GA
ABA
Nat
ure
Pre
cedi
ngs
: hdl
:101
01/n
pre.
2010
.482
1.1
: Pos
ted
25 A
ug 2
010
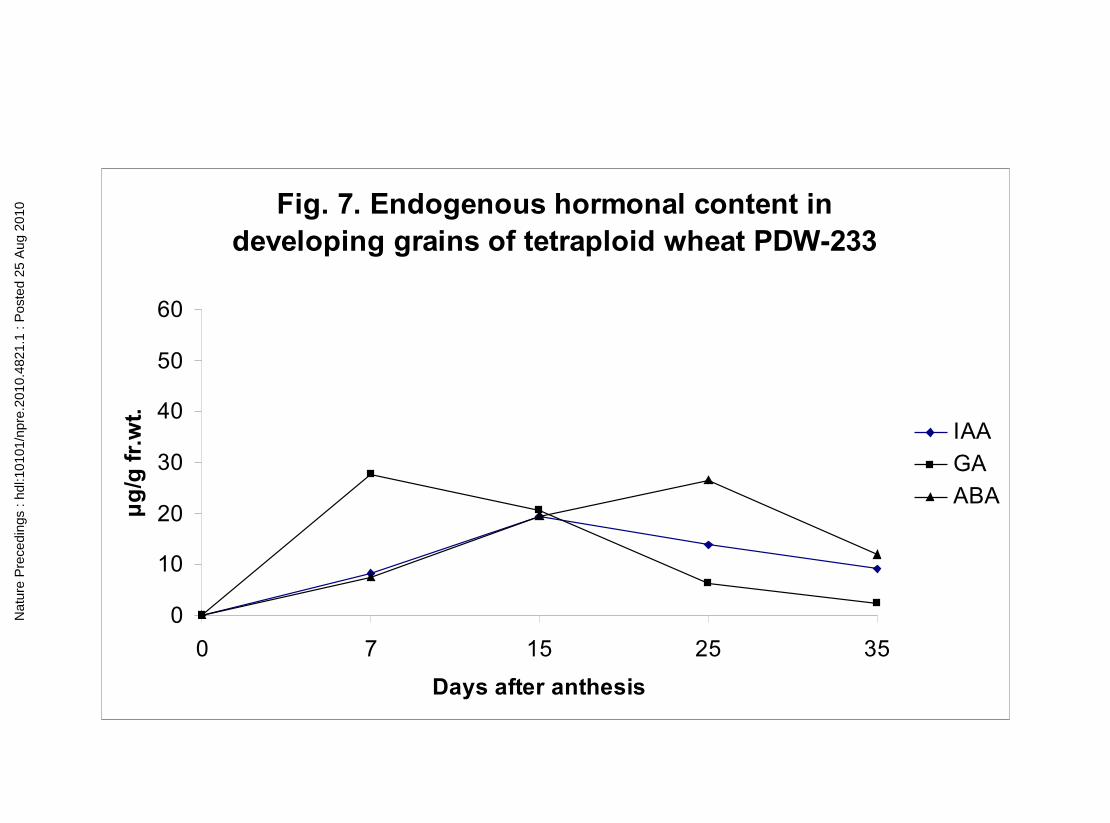
Fig. 7. Endogenous hormonal content in developing grains of tetraploid wheat PDW-233
0
10
20
30
40
50
60
0 7 15 25 35
Days after anthesis
μg
/g f
r.w
t.
IAA
GA
ABA
Nat
ure
Pre
cedi
ngs
: hdl
:101
01/n
pre.
2010
.482
1.1
: Pos
ted
25 A
ug 2
010

Fig. 8. Endogenous hormonal content in developing grains of tetraploid wheat HD-4530
0
10
20
30
40
50
60
0 7 15 25 35
μg
/g f
r.w
t.
IAA
GA
ABA
Nat
ure
Pre
cedi
ngs
: hdl
:101
01/n
pre.
2010
.482
1.1
: Pos
ted
25 A
ug 2
010

Fig. 9. Endogenous hormonal content in developing grains of tetraploid wheat HI-8498
0
10
20
30
40
50
60
0 7 15 25 35
μg
/g f
r.w
t
IAA
GA
ABA
Nat
ure
Pre
cedi
ngs
: hdl
:101
01/n
pre.
2010
.482
1.1
: Pos
ted
25 A
ug 2
010

Fig. 10. Total sugar content in developing grains of wheat genotypes
0
50
100
150
200
250
15 25 35 Harvest
Days after anthesis
mg
/g d
ry w
t.
DL-1266-1
DL-1266-2
PBW-343
PDW-233
HD-4530
HI-8498
Nat
ure
Pre
cedi
ngs
: hdl
:101
01/n
pre.
2010
.482
1.1
: Pos
ted
25 A
ug 2
010

Fig. 1. Yield performance of wheat genotypes70
54.25
16.49
38.29
56.96
73
55.44
17.54
39.39
58.963
46.92
16.46
32.32
50.67
63
46.67
12.22
31.64
48.64
65
44.98
11.14
31.17
45.46
60
45.62
12.51
32.01
49.71
0
10
20
30
40
50
60
70
80
GrainNumber/Ear
1000-grainweight (g)
Grain Yieldg/plant
TDM g/plant HI
DL-1266-1
DL--1266-2
PBW-343
PDW-233
HD-4530
HI-8498
Nat
ure
Pre
cedi
ngs
: hdl
:101
01/n
pre.
2010
.482
1.1
: Pos
ted
25 A
ug 2
010

Fig. 11. Starch content in developing grains of wheat genotypes
0
100
200
300
400
500
600
700
800
15 25 35 Harvest
Days after anthesis
mg
/g d
ry w
t.
DL-1266-1
DL-1266-2
PBW-343
PDW-233
HD-4530
HI-8498
Nat
ure
Pre
cedi
ngs
: hdl
:101
01/n
pre.
2010
.482
1.1
: Pos
ted
25 A
ug 2
010
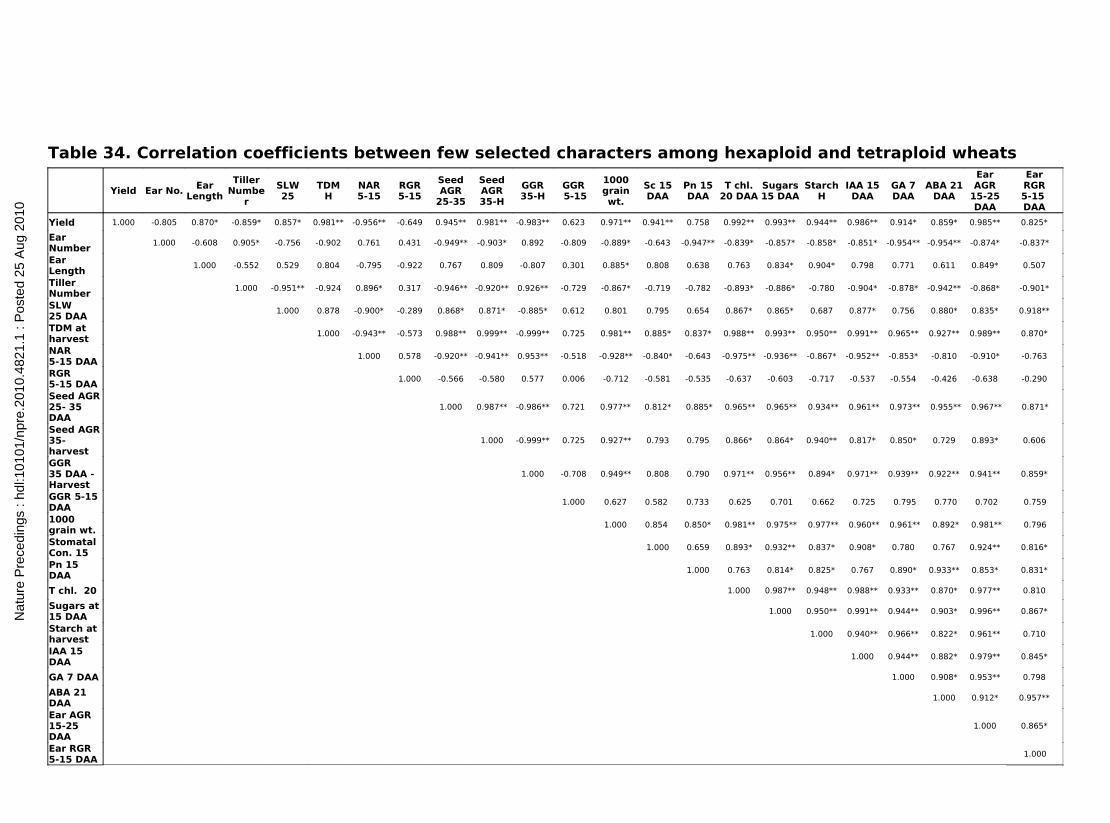
Table 34. Correlation coefficients between few selected characters among hexaploid and tetraploid wheats
Yield Ear No. EarLength
TillerNumbe
r
SLW25
TDMH
NAR5-15
RGR5-15
SeedAGR
25-35
SeedAGR 35-H
GGR 35-H
GGR 5-15
1000grain wt.
Sc 15 DAA
Pn 15 DAA
T chl.20 DAA
Sugars15 DAA
StarchH
IAA 15 DAA
GA 7 DAA
ABA 21 DAA
EarAGR
15-25 DAA
EarRGR5-15 DAA
Yield 1.000 -0.805 0.870* -0.859* 0.857* 0.981** -0.956** -0.649 0.945** 0.981** -0.983** 0.623 0.971** 0.941** 0.758 0.992** 0.993** 0.944** 0.986** 0.914* 0.859* 0.985** 0.825*
Ear Number
1.000 -0.608 0.905* -0.756 -0.902 0.761 0.431 -0.949** -0.903* 0.892 -0.809 -0.889* -0.643 -0.947** -0.839* -0.857* -0.858* -0.851* -0.954** -0.954** -0.874* -0.837*
Ear Length
1.000 -0.552 0.529 0.804 -0.795 -0.922 0.767 0.809 -0.807 0.301 0.885* 0.808 0.638 0.763 0.834* 0.904* 0.798 0.771 0.611 0.849* 0.507
Tiller Number
1.000 -0.951** -0.924 0.896* 0.317 -0.946** -0.920** 0.926** -0.729 -0.867* -0.719 -0.782 -0.893* -0.886* -0.780 -0.904* -0.878* -0.942** -0.868* -0.901*
SLW 25 DAA
1.000 0.878 -0.900* -0.289 0.868* 0.871* -0.885* 0.612 0.801 0.795 0.654 0.867* 0.865* 0.687 0.877* 0.756 0.880* 0.835* 0.918**
TDM at harvest
1.000 -0.943** -0.573 0.988** 0.999** -0.999** 0.725 0.981** 0.885* 0.837* 0.988** 0.993** 0.950** 0.991** 0.965** 0.927** 0.989** 0.870*
NAR 5-15 DAA
1.000 0.578 -0.920** -0.941** 0.953** -0.518 -0.928** -0.840* -0.643 -0.975** -0.936** -0.867* -0.952** -0.853* -0.810 -0.910* -0.763
RGR 5-15 DAA
1.000 -0.566 -0.580 0.577 0.006 -0.712 -0.581 -0.535 -0.637 -0.603 -0.717 -0.537 -0.554 -0.426 -0.638 -0.290
Seed AGR 25- 35 DAA
1.000 0.987** -0.986** 0.721 0.977** 0.812* 0.885* 0.965** 0.965** 0.934** 0.961** 0.973** 0.955** 0.967** 0.871*
Seed AGR 35-harvest
1.000 -0.999** 0.725 0.927** 0.793 0.795 0.866* 0.864* 0.940** 0.817* 0.850* 0.729 0.893* 0.606
GGR35 DAA - Harvest
1.000 -0.708 0.949** 0.808 0.790 0.971** 0.956** 0.894* 0.971** 0.939** 0.922** 0.941** 0.859*
GGR 5-15 DAA
1.000 0.627 0.582 0.733 0.625 0.701 0.662 0.725 0.795 0.770 0.702 0.759
1000grain wt.
1.000 0.854 0.850* 0.981** 0.975** 0.977** 0.960** 0.961** 0.892* 0.981** 0.796
Stomatal Con. 15
1.000 0.659 0.893* 0.932** 0.837* 0.908* 0.780 0.767 0.924** 0.816*
Pn 15 DAA
1.000 0.763 0.814* 0.825* 0.767 0.890* 0.933** 0.853* 0.831*
T chl. 20 1.000 0.987** 0.948** 0.988** 0.933** 0.870* 0.977** 0.810
Sugars at 15 DAA
1.000 0.950** 0.991** 0.944** 0.903* 0.996** 0.867*
Starch at harvest
1.000 0.940** 0.966** 0.822* 0.961** 0.710
IAA 15 DAA
1.000 0.944** 0.882* 0.979** 0.845*
GA 7 DAA 1.000 0.908* 0.953** 0.798
ABA 21 DAA
1.000 0.912* 0.957**
Ear AGR 15-25 DAA
1.000 0.865*
Ear RGR 5-15 DAA
1.000
Nat
ure
Pre
cedi
ngs
: hdl
:101
01/n
pre.
2010
.482
1.1
: Pos
ted
25 A
ug 2
010

5. DISCUSSION
The present study was carried out to investigate the factors
affecting grain growth of hexaploids and tetraploids and the
relationship of endogenous growth hormones (IAA, GA3 & ABA) to
regulate translocation of assimilates during grain development.
YIELD DETERMINING ATTRIBUTES
In wheat, modern cultivars like DL-1266-1 & DL-1266-2, and
PBW-343 was compared with tetraploids (PDW-233, HD-4530 & HI-
8498) (Plate 1 and 2). Grain size differed widely not only between the
cultivars but also on the location of the mature ear. Grains formed in
the middle spikelets are bolder than those located in apical and basal
positions of the ear. Crop yield is the ultimate outcome of the whole
life cycle and the differences in economic productivity are generally
caused owing to variation in the photosynthesis (i.e., area, duration or
efficiency) or the capacity of the sink (i.e., developing grains) to grow
and the partitioning co-efficient of the photo assimilates into
economically useful (grains) and un-useful components. Opinions
differ in respect of their merits (Stoy, 1969; Thorne, 1971; Wardlaw,
1968; Neals and Incoll, 1968; Watson, 1971).
Nat
ure
Pre
cedi
ngs
: hdl
:101
01/n
pre.
2010
.482
1.1
: Pos
ted
25 A
ug 2
010

Yield potential is an extremely complex character, a matter for
recognition rather than delight. Some of the important parameters
determining the yielding ability of wheat are summarized as follows:
Sl.
No.
Attributes Authority
1 Source-sink manipulation to influence
photosynthetic rate
A. For Reduced demand from
leaves: removal of ears/ grains.
B. For enhanced demand from
leave: Ear photosynthesis
inhibited/removal or shading of
leaves.
Atsmon et al. (1986),
Slafer and Andrade
(1983), Slafer and
Savin (1994).
King et al. (1976),
Atsmon et al. (1967),
Watson and Duffus
(1988), Reynolds et al.
(1994).2. Some responses of photosynthetic
rate to changed demand
A. Fall in CER with reduced
demand
B. Rise in CER with increased
demand
Rawson et al. (1976),
Atsmon et al. (1986).
King et al. (1967).
3. Duration of the foliage at flowering
cum maturity phase
Bingham (1969),
Sharma and Sandha
(1993).4. Production efficiency of the foliage Carr and Wardlaw
62
Nat
ure
Pre
cedi
ngs
: hdl
:101
01/n
pre.
2010
.482
1.1
: Pos
ted
25 A
ug 2
010
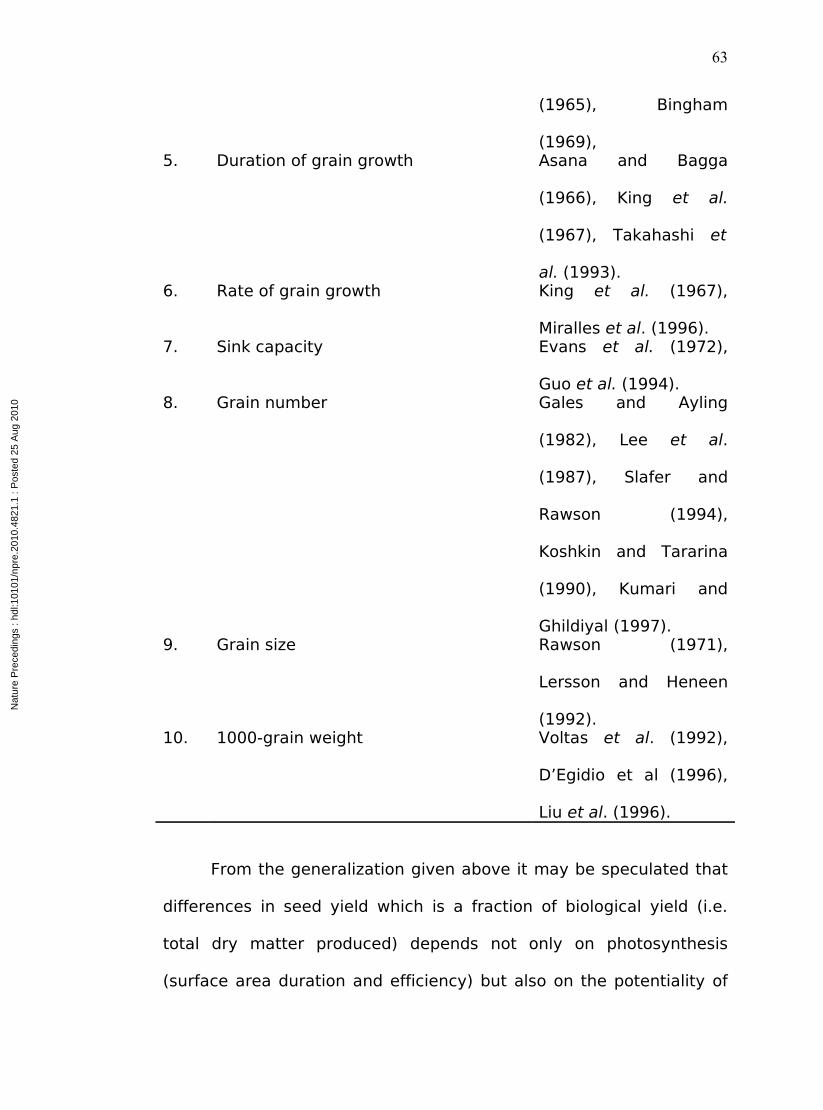
(1965), Bingham
(1969),5. Duration of grain growth Asana and Bagga
(1966), King et al.
(1967), Takahashi et
al. (1993).6. Rate of grain growth King et al. (1967),
Miralles et al. (1996).7. Sink capacity Evans et al. (1972),
Guo et al. (1994).8. Grain number Gales and Ayling
(1982), Lee et al.
(1987), Slafer and
Rawson (1994),
Koshkin and Tararina
(1990), Kumari and
Ghildiyal (1997).9. Grain size Rawson (1971),
Lersson and Heneen
(1992).10. 1000-grain weight Voltas et al. (1992),
D’Egidio et al (1996),
Liu et al. (1996).
From the generalization given above it may be speculated that
differences in seed yield which is a fraction of biological yield (i.e.
total dry matter produced) depends not only on photosynthesis
(surface area duration and efficiency) but also on the potentiality of
63
Nat
ure
Pre
cedi
ngs
: hdl
:101
01/n
pre.
2010
.482
1.1
: Pos
ted
25 A
ug 2
010
the seed to accumulate organic assimilates as well. No one process
provides the master key to greater yield potential and quite different
process may limit the yield of different cultivars at one site and
season, or of one cultivar at different site (Crosbie and Mock, 1981;
Willman et al., 1987). Mnay more factors within a spikelet at different
positions of the ear may also have effect on the seed yield. Some of
the notable among them are:
1. Inter-gain competition (Yoshida, 1987; Ho, 1988; Bai et al.
1989; Farrar, 1993, Slafer and Rawson, 1994).
2. Vascular supply and flow of assimilates (Patrick and Wardlaw,
1984, Wardlaw, 1990; Komor et al., 1993; Wood et al., 1994).
3. Duration and rate of grain growth (Chang, 1982; Takahashi,
1993; Miralles et al. 1996).
4. Capacity of the grain to accumulate assimilates resulting from
augmented sink strength through endogenously produced plant
growth regulators within the developing grain (Warrier et al.
1987; Kondaiah, 1991; Rabie, 1996).
It still remains to be seen which of the above attributes have a
greater relevance. The present study stepped up further in
understanding the differences in grain size vis-à-vis the role played by
endogenous IAA, GA3 and ABA along with sugar and starch
accumulation.
GRAIN SIZE AS DETERMINANT OF SEED YIELD
64
Nat
ure
Pre
cedi
ngs
: hdl
:101
01/n
pre.
2010
.482
1.1
: Pos
ted
25 A
ug 2
010
The 1000-gain weight is the important yield determinant
parameter and it will give the idea of grain filling and size. Analysis of
hexaploid and tetraploid wheat having different grain size showed
that DL-1266-2 had higher 1000-grain weight (55.44 g) than the
tetraploids which is ranging from 44 to 46 g. The yield determining
attributed like seed number/ear and grain number/plant showed that
by virtue of possessing higher seed weight, hexaploids registered
higher 1000-grain weight than tetraploids. Hexaploids registered
more leaf area and total dry matter production as compared to
tetraploids (Table 35).
In spite of higher seed number/plant to the tune of 3 per cent,
tetraploids showed 32 percent reduction in seed yield/plant than
hexaploids (Dl-1266-2) and in the other attributes like grain
number/ear and 1000-grain weight they showed reductions of 9 and
12 per cent respectively (Table 35). It indicates a complex
phenomenon govern the yield in plants.
YIELD AND YIELD COMPONENTS
Yield is the ultimate manifestation of morphological,
physiological, biochemical processes and growth parameters and is
considered to result from trapping and the conversion of solar energy
efficiently. Improvement in yield can be realised in two ways i.e., by
65
Nat
ure
Pre
cedi
ngs
: hdl
:101
01/n
pre.
2010
.482
1.1
: Pos
ted
25 A
ug 2
010
adopting the existing varieties to grow better in their environment or
by altering the relative proportion of different plant parts so as to
increase the yield of economically important parts (Humphries and
Bond, 1969).
In the present investigation, the hexaploids especially new plant
types recorded higher grain yield when compared to tetraploids.
Evans (1978) reported that the grain yield in wheat is determined by
three components viz., number of ears per unit area, number of
kernels per ear and weight of kernels. The data on yield and yield
components showed that the tetraploids had higher ear number per
plant but lesser number of seeds per ear and lower seed weight per
ear. Whereas, the hexaploids particularly, new plant types had fewer
tillers per plant but more number of seeds per ear by virtue of longer
ear length and higher seed weight per ear. The most important yield
component, 1000-grain weight was also more in hexaploids (Plate 1
and 2). The higher grain yield in new plant types was mainly due to
the higher number of grains per ear and the heavier individual grain
weight. The higher starch content (Fig. 11) in new plant types was
also contributed towards to the higher grain yield. Increase in both
the components might have helped in increased distribution of
assimilates to the developing grains and less to the stem leading to
higher grain yield. Spiertz and Van de Haar (1978) also reported that
higher the yield components better will be grain yield and harvest
index.
66
Nat
ure
Pre
cedi
ngs
: hdl
:101
01/n
pre.
2010
.482
1.1
: Pos
ted
25 A
ug 2
010
MORPHOLOGICAL CHARACTERS
The available land for agriculture is decreasing day by day due
to urbanization and also there is increase in the cost of production.
Hence, it is necessary to improve yield per unit area to meet the
challenges ahead in self-sufficiency of food requirements. In this
direction, introspection of the genetic variation in various morpho-
physiological changes that have occurred in the developing high
yielding varieties in future. Such studies can be used as powerful
physiological indices both for screening the available genotypes for
desirable traits and for directing the research efforts towards evolving
plant ideotypes for various purposes.
The mean plant height was found to be higher in hexaploids
over tetraploids in general, and among them DL-1266-1 and DL-1266-
2 (new plant types) recorded higher plant height compared to any
other genotype. Similarly, the ear length was also higher in these new
plant types (Plate. 3 and 4). But, the tiller number/plant and ear
number/plant were significantly higher in tetraploids. The new plant
types bred for the higher ear length for maximisation of yield/plant
characteristically possessed few tillers/plant and spikes/plant. From
this, it is inferred that the modern hexaploids in the process of
evolution and selection had reduced the infertile tillers and possessed
longer ear heads having more grains/spike. This is supported by the
67
Nat
ure
Pre
cedi
ngs
: hdl
:101
01/n
pre.
2010
.482
1.1
: Pos
ted
25 A
ug 2
010
correlation studies that between ear number/plant had significant
positive correlation (r=0.905) with tiller number/plant. While, there
was significant negative correlation between tiller number/plant and
yield/plant (r = -0.859) and ear number/plant (r=- 805). A negative
correlation though non-significant was also found between ear
number/plant and ear length/plant.
The new plant types possessing higher plant height and longer
ear heads recorded higher grain yield. In the present investigation, it
seems that the higher plant height (Table 4 and stem weight (Table
10) offered minimum competition for the assimilate accumulation in
the developing grains which ultimately resulted in higher grain yield.
Bhat (1976) reported that a better allocation of assimilates to the
grains in hexaploid wheat is a variable and heritable character. While,
Syme (1972) and Fischer and Kertesz (1976) reported a close
relationship of resource allocation to the grains with yield potential.
PLANT GROWTH AND DEVELOPMENT
Crop growth and yield are the manifestation of morphological,
physiological, biochemical and growth parameters. Future strategies,
for obtaining higher yields should lay emphasis on tapping the
biological potential of the crop. For this, a better understanding of
morpho-physiological traits that influence crop yields would provide
the basis for exploiting genetic potentiality for realising higher yields.
68
Nat
ure
Pre
cedi
ngs
: hdl
:101
01/n
pre.
2010
.482
1.1
: Pos
ted
25 A
ug 2
010

Growth and productivity of crop cultivars is achieved through a series
of growth and developmental processes.
Significant differences were observed between the genotypes in
total dry matter accumulation and its distribution between plant
parts. The hexaploids in general accumulated higher biomass and the
allocation of assimilates in the grains were also more, thus resulting
in higher grain yield. A significant positive relationship (r=0.981)
was also found between the total dry matter at harvest and grain
yield. Whan et al. (1996) also found a positive correlation between
dry matter production and grain yield.
In the process of evolution and domestication of wheat, the
hexaploids have been found to have lesser biological yield than the
tetraploids (Bamakhramah et al., 1984). But, in the present
investigation, the tetraploids on the contrary possessed lesser
biological yield compared to hexaploids. Since, the present study
comprised of new plant types of hexaploids which were specially bred
to match the plant ideotypes developed by Donald (1968) possessing
a single culm, strong stem, dwarf stature and large spike. This
altogether resulted in higher biomass, due to heavier stem and thick
broad leaves. If we take into account the hexaploids other than the
new plant types mentioned earlier (DL-1266-1 and DL-1266-2), the
others has lower total dry matter, which is in agreement with
Bamakhramah et al. (1984). Dobben (1962) reported that the harvest
69
Nat
ure
Pre
cedi
ngs
: hdl
:101
01/n
pre.
2010
.482
1.1
: Pos
ted
25 A
ug 2
010
index of cereal cultivars tend to rise progressively with little change in
biological yield.
The growth, development and biomass production in plant
largely depends in photosynthates produced by green leaves and the
flag leaf blade is the principal source of photo-assimilates imported by
the grains during grain filling (Rawson et al., 1976). The data on mean
leaf area in the present study was found to increase from 5 to 25 DAA
and declined later at 35 DAA. Interestingly, the new plant type DL-
1266-2 recorded the maximum leaf area at all the stages and yielded
higher and the genotypes, HD-4530 and HI-8498 which had an early
reduction in leaf area (at 25 DAA) yielded less. This clearly
demonstrates the significance of leaf area duration in yield
determination in wheat. Our results are in accordance with the earlier
reports of Duncan et al. (1981), Rosenow et al. (1983) Ludlow and
Muchow (1990) and Ashraf et al. (1992).
The leaf area ratio (LAR) indicates the size of the assimilatory
surface area in relation to the total dry matter. Simane et al. (1993)
reported that it is determined partly by biomass allocation (LWR) and
partly by leaf morphology (SLA). The data on LAR showed that the
tetraploids had higher LAR at 5 and 15 DAA, whereas at 25 and 35
DAA, hexaploids showed higher LAR but the mean LAR of the
genotypes showed a steady decline from 5 to 35 DAA. This decline in
LAR at later stages could be due to decrease in leaf area due to
senescence and translocation of all assimilates to the growing sink.
70
Nat
ure
Pre
cedi
ngs
: hdl
:101
01/n
pre.
2010
.482
1.1
: Pos
ted
25 A
ug 2
010
Van den Boogaard, (1996), also reported a decline in LAR at later
stages. The higher LAR at initial stages could be due to higher leaf
area and growth rates.
The mean specific leaf area (SLA) declined from 5 to 25 DAA
and increased further at 35 DAA. Among the genotypes, hexaploids
recorded higher SLA at 5 and 35 DAA; while, the tetraploids recorded
higher SLA at 15 and 25 DAA. It is known that there is inverse
relationship between SLA and SLW and decrease in SLA at 15 and 25
DAA could be due to higher specific leaf weight (SLW). The specific
leaf weight, which indicates leaf thickness, was found to be higher in
hexaploids and it was maximum at 15 and 25 DAA. The increase in
SLW could be due to stacking of mesophyll cells and increased
photosynthetic activity leading to higher accumulation of
photosynthates (Konings, 1989; Poorter, 1989). For meeting the
requirements of assimilates, either the SLA has to be more or SLW. In
the present study, there is a decline in SLA and this decrease is more
than compensated by an increase of SLW and it has supported the
demand of assimilates at grain filling stage. Further, correlation study
indicated a positive relationship between SLW and grain yield.
Pramod Kumar et al. (1998) and Subrahmanyam and Dutta (2000)
also found a positive relationship of SLW with grain yield, as have
been observed in the present investigation.
71
Nat
ure
Pre
cedi
ngs
: hdl
:101
01/n
pre.
2010
.482
1.1
: Pos
ted
25 A
ug 2
010

The relative growth rate (RGR) represents the increase in dry
matter per unit dry matter already present per unit time and it was
found to be maximum in tetraploids at 5 – 15 DAA in the present
study. The plants with higher RGR have opportunity to acquire a
larger share of limiting resources like moisture than slow growing
ones (Poorter, 1989). The RGR of genotypes in the present
investigation decreased from 5–15 DAA to 25–35 DAA. Simane et al.
(1993) also reported similar results. This may be due to the decline of
leaf area/unit plant (Spitters and Kramer, 1986). Interestingly, the
genotypes with higher LAR recorded higher RGR, which is in
agreement with the reports of Van den Boogaard et al. (1996).
Simane et al (1993) also reported a positive significant correlation
between RGR and LAR. As the components of RGR are NAR, LAR, LWR
and SLA, any variation in these parameters will bring changes in RGR.
The net assimilation rate (NAR) in the present study decreased
with advancement in growth in all the genotypes from 5 – 15 DAA to
25 – 35 DAA and the higher rates of NAR were recorded by
tetraploids. In contrast to the earlier report by Pramod Kumar et al.
(1998), showed a positive association between NAR and grain yield,
negative correlation was found in the present study between NAR at 5
– 15 DAA and yield.
GRAIN FILLING AND GRAIN GROWTH
72
Nat
ure
Pre
cedi
ngs
: hdl
:101
01/n
pre.
2010
.482
1.1
: Pos
ted
25 A
ug 2
010
Analysis of ear growth and development of the genotypes in
study revealed that the mean absolute growth rate of ear had
increased from 5–15 DAA to 25–35 DAA. When compared among the
genotypes, the hexaploids had higher AGR of ear at the early stages
i.e., at 5 DAA and at 15 DAA and maintained at a higher rate till the
harvest stage. The hexaploids especially, new plant types recorded
higher AGR of ear. This increase in rate is both due to the increase in
seed weight (Table 14, Fig. 2 and Fig. 3) and the chaff (Table 17).
When the growth of ear heads is analysed in terms of relative growth
rate, the RGR of ear was also higher for hexaploids at 5 – 15 DAA and
thereafter, it declined in both the hexaploids and tetraploids until 35
DAA – harvest. The mean RGR had decreased from 5 – 15 DAA to 35
DAA – harvest. At rapid growth of grain growth phase (7 to 14 DAA),
the AGR of ear in hexaploids recorded slightly higher than tetraploids.
This might be because of the substantial increase in seed weight of
hexaploids than the tetraploids at the end of rapid growth phase (Fig.
1 & 2). But, the higher AGR of ear found at 25–35 DAA in tetraploids
infers that they are slow at grain filling initially and at this stage, the
ear might have filled up all its spikelets. Looking at the RGR of ear
values, which were higher in hexaploids than tetraploids, it can be
said that they were faster than the tetraploids in ear growth and also
they were with relatively higher growth of seed. The correlation study
between the AGR of ear and RGR of ear and with yield shows
significant positive relationship with yield. The relationship between
RGR of ear and AGR of ear was also positive and significant.
73
Nat
ure
Pre
cedi
ngs
: hdl
:101
01/n
pre.
2010
.482
1.1
: Pos
ted
25 A
ug 2
010

The absolute grain growth rate of hexaploids and tetraploids
were found to be at higher rate at all the. With the increment in time,
the hexaploids especially the new plant types continued to increase
at faster rate than the tetraploids. The mean grain growth rate of
seed in the genotypes was found to be higher initially and then
declined with the increase of time. Though the hexaploids (especially
new plant types) had initially higher relative grain growth rate, they
were slightly similar as that of tetraploids at 25–35 DAA and 35 DAA–
harvest. This infers that the hexaploids with higher rates of grain
filling (RGR of ear) could be able to fill all the spikelets in the ear head
and increase the grain weight. The hexaploids with higher grain filling
rates initially and at rapid growth stage (15 DAA) might have filled up
all the spikelets and also increased the seed weights. The new plant
types had higher rate of GA content at initial stages of grain growth
and also IAA at the end of (Fig. 3 & 4). This might have caused the
new plant types to increase in the cell size and cell division at the
initial stages by GA and at later stages, IAA might have exerted
pressure in the translocation of assimilates. The ABA content was
increased at the end soft dough stage (14 to 21 DAA) this might have
also helped in the translocation of assimilates to the sink which was
high at capacity due to endogenous hormonal activity (Seth and
Waering, 1967; Singh and Gerung, 1982).
74
Nat
ure
Pre
cedi
ngs
: hdl
:101
01/n
pre.
2010
.482
1.1
: Pos
ted
25 A
ug 2
010

Sayed and Gadallah (1983) reported that grain yield in wheat
was more closely related to the rate than the duration of grain filling.
The correlations between yield and AGR of seed with yield and RGR of
seed and yield were significantly and strongly positive. Gebeyehoue
et al. (1982) found that both rate and duration of grain filling were
positively associated with final grain weight. In the present
investigation, the hexaploids with higher rates of ear growth had
increased the chaff weight as well as seed weight and the tetraploids
had increased only the seed weight more than chaff weight. Though
the chaff weight (Table 17) was found to be higher in hexaploids, it
had relatively lesser percent contribution towards the ear weight had
resulted in higher yields in hexaploid new plant types. Darroch and
Baker (1990) have reported significant genotypic differences in rate
and duration of grain filling in spring wheat.
HORMONAL REGULATION OF SEED DEVELOPMENT
Results showed that the endogenous hormonal contents in
grains during grain development changed in sequence. At 7 DAA,
gibberellic acid (GA) content was maximum and at 15 DAA (rapid
growth phase), indole-acetic acid (IAA) reached the maximum; while
at 21 DAA (dough stage), the ABA was maximum. Further, ABA
reached all time high, GA the least, IAA being intermediate at 30 DAA.
Among the genotypes, hexaploids (Fig. 4, 5, and 6) recorded higher
75
Nat
ure
Pre
cedi
ngs
: hdl
:101
01/n
pre.
2010
.482
1.1
: Pos
ted
25 A
ug 2
010
concentrations of endogenous hormones compared to tetraploids
(Fig. 6, 7, and 8).
Increase in GA content at early embryonic stage where a rapid
enlargement of embryo (Qin and Tang, 1984) takes place implies that
GA had signaled the translocation of metabolites to the active sink
such as the developing grain (Monula et al., 1980). The characteristic
decrease in GA content at 21 DAA can be explained by the hypothesis
put forth by Krishnamoorthy (1981) that at that stage, conjugation
might have taken place and it existed in the storage from in the
matured grain to be used during germination. IAA content of the
developing grains increased as the grains entered into the rapid grain
growth phase (7 – 14 DAA). Bangerth et al. (1985), Lur and Setter
(1993) and Yang et al. (2001) also found similar results.
The increase in auxin concentration stimulates cell division
which in turn enhances the translocation of photosynthates towards
developing sinks (Seth and Waering, 1967; Singh and Gerung, 1982).
Abscisic acid content in the grain was found to be low at the early
grain filling stage is in accordance with Yang et al. (2001) but at 25
DAA (dough stage); it reached the highest level. Apart from synthesis
of ABA by the inner layers of the pericarp containing chloroplasts
(Radely, 1976), the hormone might have been translocated from
other parts of the plant and resulted in higher concentration. The
higher ABA concentration found in new plant types might have
76
Nat
ure
Pre
cedi
ngs
: hdl
:101
01/n
pre.
2010
.482
1.1
: Pos
ted
25 A
ug 2
010

enhanced the import of assimilates and it resulted in the higher grain
filling and ultimately, higher grain yield. Similar results were reported
by Dewdney and Mc Wha (1979); Patrick (1983) and Schussler et al.
(1984). There are also reports by earlier workers that the ABA is
elevated in the grains during maturation for induction of dormancy.
The higher levels of ABA (hard dough stage), minimal level of GA and
intermediate levels of IAA at 30 DAA suggests that at this stage,
maintenance of embryo dormancy appears to be an active process
involving ABA (Morris et al., 1991).
BIOPHYSICAL AND BIOCHEMICAL CHARACTERS
The stomatal conductance increased after 7 DAA and reached
maximum at 15 DAA and then declined thereafter until 35 DAA.
Maximum stomatal conductance was found in hexaploids, especially
the new plant types at 15 DAA. Sudden increase in stomatal
conductance at this stage could be due to higher demand of
photosynthates for grain filling. Whenever, there is increased
demand, it has to be met by increasing the rate of CO2 exchange and
other mechanisms. Earlier reports of Rawson and Evans (1970) and
Evans and Rawson (1971) support the present findings. They
observed a decline in the net CO2 exchange rate of flag leaf just after
anthesis which increased during rapid grain filling stage indicating the
demand by the developing ear. The present findings are in
accordance with the Frederick and Camberato (1995) also who
77
Nat
ure
Pre
cedi
ngs
: hdl
:101
01/n
pre.
2010
.482
1.1
: Pos
ted
25 A
ug 2
010

reported that there was an increase in leaf net CO2 exchange rate
(CER) at anthesis and decrease rapidly during the grain filling stage.
Correlation study indicated that stomatal conductance is having a
positive and highly significant association with grain yield and AGR of
seeds and ear. Pramod Kumar et al. (1998) also reported a similar
correlation between yield and stomatal conductance.
The data on photosynthetic rate indicated higher values in
hexaploids over tetraploids. Such variability among the genotypes
could be attributed to differences, in structural and anatomical
differences in mesophyll and carboxylation resistance between the
species. Similarly, Sharma-Natu and Ghildiyal (1993) also reported
species differences in phototsynthetic rate. The photosynthetic rate
was more at 7 and 15 DAA compared to 25 and 35 DAA. Since there
was higher demand for photosynthates at grain filling periods which
coincided with 7 and 15 DAA and hence the photosynthetic rate was
more at these stages. A strong dependence of flag leaf
photosynthesis in wheat on the requirement for assimilates by the
developing grains has been reported earlier by Birecka and Dakic
Wlodkowska (1963) and King et al. (1967). In the present
investigation, a significant positive correlation between
photosynthetic rate and AGR of seed (r=0.885) was observed which is
in accordance with the earlier reports. The higher photosynthetic rate
in DL-1266-2 can be attributed mainly to higher SLW and stomatal
conductance. Subrahmanyam and Dutta (2000) reported a positive
association between SLW, stomatal conductance and photosynthetic
78
Nat
ure
Pre
cedi
ngs
: hdl
:101
01/n
pre.
2010
.482
1.1
: Pos
ted
25 A
ug 2
010

rate. The results of the present investigation also showed a significant
positive relationship with stomatal conductance (r=0.885) and
photosynthetic rate (r=0.837) with total dry matter. The flag leaf has
for a long time been regarded as the most important source of
assimilate supply to the ears in wheat (Trorne, 1965; Evans and
Dustaone, 1970).
The total chlorophyll content in flag leaves of hexaploids was
higher than in tetraploids. The mean total chlorophyll content
increased slightly at 20 DAA when compared to 10 DAA and it
decreased at 30 DAA. This shows that there was more chlorophyll
content at rapid grain growth stage, during which there is a great
demand for photosynthates and this might help the plant to fix more
co2 and meet the increasing demand for photosynthates. Wright and
Smith (1983), Ashraf and Khan (1990), Sinha and Patil (1986) and
Estill et al. (1991) reported a wide variation in chlorophyll contents
within species. In the present investigation also the genotypes
differed significantly in chlorophyll content.
SUGARS AND STARCH DURING GRAIN FILLING
Results revealed significant differences in the total sugar
content of seeds among the genotypes which gradually decreased
from 15 DAA until harvest (Fig. 10). Among the genotypes,
hexaploids showed higher sugar content than tetraploids at all the
79
Nat
ure
Pre
cedi
ngs
: hdl
:101
01/n
pre.
2010
.482
1.1
: Pos
ted
25 A
ug 2
010

stages. Kumar and Singh (1981), Singhal et al. (1989) and Sekhon
and Singh (1994) found similar results. Mi et al (2002) reported that
the soluble sugar content of the grains were greater at anthesis and
then decreased during grain filling. The data in the present
investigation showed that the genotypes possessed higher sugar
content at 14 DAA and then decreased thereafter. Kumar and Singh
(1981) also reported similar results.
The starch content of seeds increased from 15 DAA (where
sugar content was found to be decreasing) till harvest in all the
genotypes (Fig. 11). Among the genotypes, hexaploids (new plant
types) had significantly higher starch content compared to
tetraploids. The slow starch synthesis in the grains of tetraploids
might be one of the reasons for slow grain filling. The tetraploids
should have had more endogenous cells, hence cell division might
have taken longer time than in hexaploids and starch accumulation
might have been delayed (Mi et al. 2002). A delayed starch synthesis
resulted in weak sink strength at early stages (Jenner et al., 1991)
and might have induced a negative feed back on carbohydrate
remobilisation from stem and leaf sheath to the grains (Wardlaw,
1990). An almost equal weight of stems of hexaploids and tetraploids
found in the present investigation is in support of this hypothesis. The
heavier stems of hexaploids would have benefited the genotypes in
resisting lodging at grain filling stage when large spike grown heavier
(Austin, 1980).
80
Nat
ure
Pre
cedi
ngs
: hdl
:101
01/n
pre.
2010
.482
1.1
: Pos
ted
25 A
ug 2
010
The new plant types with a high photosynthetic rate, higher
chlorophyll content had high rate of grain filling as seen from Table
12. It has been reported that during grain filling which is a process of
starch accumulation, 33 major enzymes are involved in carbohydrate
metabolism in developing endosperm (Nakmura et al., 1992). The
predominant pathway for starch biosynthesis in plant is composed of
three reaction catalysts viz., AGPase, Stsase and BE enzyme
(Nakamura et al., 1989; Presis et al., 1991; Okita, 1992; Martin and
Smith, 1995). Activates of these three enzymes are closely associated
with an increase in starch content during the development of rice
endosperm (Nakamura and Yuki, 1992). The new plant types might
have had maximum activity of these three enzymes and this may be
the probable reason for higher starch synthesis that resulted in higher
grain yield.
81
Nat
ure
Pre
cedi
ngs
: hdl
:101
01/n
pre.
2010
.482
1.1
: Pos
ted
25 A
ug 2
010
6. SUMMARY AND CONCLUSION
The present investigation on the role of endogenous hormonal
levels during grain development in various genotypes involving
hexaploids and tetraploids, with the main objective of determining the
grain growth rate and its correlation with the endogenous hormonal
levels is summarised as follows.
• The mean plant height was found to be higher in hexaploids
over tetraploids in general, and among them DL-1266-1 and DL-1266-
2 (new plant types) recorded higher plant height.
• Similarly, the ear length was also higher in these new plant
types. But, the tiller number/plant and ear number/plant were
significantly higher in tetraploids.
• The hexaploids in general accumulated higher biomass and the
allocation of assimilates in the grains were also more, thus resulting
in higher grain yield. A significant positive relationship (r = 0.981)
was also found between the total dry matter at harvest and grain
yield.
• The data on mean leaf area was found to increase from 5 to 25
DAA and declined later at 35 DAA. Interestingly, the new plant type
DL-1266-2 recorded the maximum leaf area at all the stages and
Nat
ure
Pre
cedi
ngs
: hdl
:101
01/n
pre.
2010
.482
1.1
: Pos
ted
25 A
ug 2
010

yielded higher and the genotypes, HD-4530 and HI-8498 which had a
early reduction in leaf area (at 25 DAA) yielded less.
• The tetraploids had higher LAR at 5 and 15 DAA, whereas at 25
and 35 DAA, hexaploids showed higher LAR but the mean LAR of the
genotypes showed a steady decline from 5 to 35 DAA.
• The mean specific leaf area (SLA) declined from 5 to 25 DAA
and increased further at 35 DAA. Among the genotypes, hexaploids
recorded higher SLA at 5 and 35 DAA; while, the tetraploids recorded
higher SLA at 15 and 25 DAA.
• The RGR of genotypes in the present investigation decreased
from 5 – 15 DAA to 35 DAA – harvest. Interestingly, the genotypes
with higher LAR recorded higher RGR,
• The net assimilation rate (NAR) in the present study decreased
with advancement in growth in all the genotypes from 5 – 15 DAA to
25 – 35 DAA and the higher rates of NAR were recorded by
tetraploids.
• Analysis of ear growth and development of the genotypes in
study revealed that the mean absolute growth rate of ear had
decreased from 5 DAA to 35 DAA. When compared among the
genotypes, the tetraploids had higher AGR of ear at the early stages
i.e., at 5 DAA. And at 15 DAA, the hexaploids especially, new plant
types recorded higher AGR of ear.
• The data on yield and yield components show that the
tetraploids had higher ear number per plant but lesser number of
80N
atur
e P
rece
ding
s : h
dl:1
0101
/npr
e.20
10.4
821.
1 : P
oste
d 25
Aug
201
0

seeds per ear and lower seed weight per ear. The most important
yield component 1000-grain yield was also possessed by hexaploids.
• The hexaploids (new plant types) possessed maximum grain
growth rate at 5 – 15 DAA. DL-1266-2 recorded highest grain growth
rate 0.093 g/g/day.
• The results showed that the endogenous hormonal contents in
grains during grain development had changed in sequence. At 7 DAA,
gibberellic acid (GA) content was at maximum and at 15 DAA (rapid
growth phase), indole-acetic acid (IAA) reached maximum and at 25
DAA (dough stage), ABA was at the maximum. At the 35 DAA, ABA
reached all time high and GA the least, IAA being intermediate.
Among the genotypes, hexaploids recorded higher concentrations of
endogenous hormones.
• The maximum values for stomatal conductance were found in
the hexaploids especially the new plant types at 15 DAA. A positive
and highly significant correlation between stomatal conductance and
yield and a positive and significant correlation between stomatal
conductance and AGR of seed and ear was found.
• The photosynthetic rate values show that the hexaploids
possessed higher rate than tetraploids. At 7 and 15 DAA, in general,
photosynthetic rate was more when compared to 25 DAA and 35 DAA.
• The total chlorophyll content in flag leaves of hexaploids was
higher than tetraploids. The mean total chlorophyll had increased
slightly at 20 DAA when compared to 10 DAA and it decreased at 30
DAA.
81N
atur
e P
rece
ding
s : h
dl:1
0101
/npr
e.20
10.4
821.
1 : P
oste
d 25
Aug
201
0

• Among the genotypes, hexaploids showed higher sugar content
than tetraploids at all the stages of comparison. The data in the
present investigation showed that the genotypes possessed higher
sugar content at 14 DAA and then decreased afterwards.
• The starch content of seeds in all the genotypes increased from
15 DAA (where sugar content was found to be decreasing) till harvest.
• The new plant types with a high photosynthetic rate, high
chlorophyll content and delayed leaf senescence (higher LAD) had
high rate of grain filling.
In conclusion the present study showed that,
• The new plant types bred for the higher ear length for maximisation
of yield/plant characteristically possessed few tillers/plant and
spikes/plant. Modern hexaploids in the process of evolution and
selection had reduced the infertile tillers and possessed longer ear
heads having more grains/spike.
• In the present investigation, it seems that the higher plant height and
stem weight offered minimum competition for the assimilate
accumulation in the developing grains which ultimately resulted in
higher grain yield in new plant types. The hexaploids in general
accumulated higher biomass and the allocation of assimilates in the
grains were also more, thus resulting in higher grain yield.
• The higher LAD might have given rise to a higher photosynthetic
rate/capacity of the canopy during grain filling which made the new
plant types with higher LAD yielded higher.
82N
atur
e P
rece
ding
s : h
dl:1
0101
/npr
e.20
10.4
821.
1 : P
oste
d 25
Aug
201
0
• Hexaploids though declined, still maintained higher LAI over
tetraploids. This could be one of the possible reasons for yield
differences between hexaploids and tetraploids. The decrease in LAI
after 25 DAA coincided with the end of rapid grain filling state
• This decline in LAR at later stages could be due to decrease in leaf
area due to senescence and translocation of all assimilates to the
growing sink.
• It is known that there is inverse relationship between SLA and SLW
and decrease in SLA at 15 and 25 DAA could be due to higher specific
leaf weight (SLW).
• A slight increase in CGR values at 35 DAA – harvest, could be
attributed to the increase in ear dry weight.
• The increase in GA content at the early embryony stage where a rapid
enlargement of embryo takes place implies that GA had signaled the
translocation of metabolites to the active sink such as the developing
grain.
• The increase in auxin concentration might have stimulated cell
division and this could have created an attraction for the translocation
of photosynthates.
• The higher ABA concentration in the new plant types might have
enhanced the import of assimilates. and it resulted in the higher grain
filling and ultimately, higher grain yield.
• The maximum values for stomatal conductance were found in the
hexaploids especially the new plant types at 15 DAA. At this stage,
83N
atur
e P
rece
ding
s : h
dl:1
0101
/npr
e.20
10.4
821.
1 : P
oste
d 25
Aug
201
0
the sudden increase in the values of stomatal conductance in the
genotypes might be due to the higher demand of ear during grain
filling for the photosynthesis – CO2 exchange.
• The mean total chlorophyll had increased slightly at 20 DAA when
compared to 10 DAA and it decreased at 30 DAA. This shows that at
the rapid grain growth stage, chlorophyll content was more where it
was highly in demand for photosynthesis.
84N
atur
e P
rece
ding
s : h
dl:1
0101
/npr
e.20
10.4
821.
1 : P
oste
d 25
Aug
201
0

BIBLIOGRAPHY
Ahmadi, A., Baker, D.A. (1999). Effects of abscisic acid (ABA) on grain
filling processes in wheat. Plant Growth Regulation, 28(3):
187-197.
Anonymous. (2002). The Hindu Survey of Indian Agriculture, Kasturi
and Sons, Ltd. Publishers, Chennai, India.
Anonymous. (2004). The Hindu Survey of Indian Agriculture, Kasturi
and Sons, Ltd. Publishers, Chennai, India.
Apel, P. and Lehmann, C.O. (1970). Studies on the relations between
the size of the flag leaf and the yield of the ear in wheat and
barley. Kulturpflanze, 18: 99-105.
Apel, P. and Tschape, M. (1973). Ear respiration during the grain filling
stage in wheat (Triticum aestivum L.). Biochemie und
Physiologie der Pflanzen, 164(3): 266-275.
Apel, P., M. Tschape, I. Schalldach and Aurich, O. (1973). Die
Bedeutung der Karyopson fur die Photosynthese and
Trockensubstanzpro duktion bei weizen. Photosynthetica., 7:
132-139.
Asana, R.D. and Bagga, A.K. (1996). Studies in physiological analysis
of yield. Comparison of development of upper and basal
grains of spikelets of two wheat varieties. Indian Journal of
Plant Physiology, 7: 86-101
Nat
ure
Pre
cedi
ngs
: hdl
:101
01/n
pre.
2010
.482
1.1
: Pos
ted
25 A
ug 2
010

Ashraf, M.Y. and Khan, A.H. (1990). Effect of drought on wheat
varieties during vegetative stage. Scintia International,
2:325-327.
Ashraf, M.Y., khan, A.H and Naqvi, S.S.M. (1995). Relationship of
chlorophyll content and leaf area with grain yield in wheat
genotypes. Indian journal of Plant Phsyiology, 38(2): 162-
163.
Ashraf, M.Y., Khan, A.H. and Azmi, A.R. (1992). Cell membrane
stability and its elation with some physiological process in
wheat. Acta Agronomica Hungarica, 41:183-191.
Asthir, B., Kaur, A. and Basra, A.S. (1998). Do phytohormones
influence the uptake and metabolism of sucrose in spikelets
of wheat? Phyton Horn. 38(2): 293-299.
Atsmon, D., Bush, M.G. and Evans, L.T. (1986). Effects of
environmental conditions on expression of the ‘Gigas’
characters in wheat. Australian Journal of Plant Physiology,
13: 356-376.
Aufhammer, W. and Bangerth, F. (1982). Growth regulator effects on
ear and grain development in wheat. In: McLaren, J.S. (ed.),
“Chemical Manipulation of Crop Growth and Development”,
pp. 359-373.
Austin, R.B. and Edrich, J. (1975). Effect of ear removal on
photosynthesis, carbohydrate accumulation and on the
Nat
ure
Pre
cedi
ngs
: hdl
:101
01/n
pre.
2010
.482
1.1
: Pos
ted
25 A
ug 2
010

distribution of assimilated 14C in wheat. Annals of Botany,
39: 141-152.
Austin, R.B., Bingham, J., Blackwell, R.D., Evans, L.T., Ford, M..,
Morgan, C.L. and Taylor, M. (1980). Genetic improvements in
winter wheat yields since 1900 and associated physiological
changes. Journal of Agricultural Science, 94: 675-698.
Austin, R.B., Ford, M.A., Miller, T.E. and Parry, M.A.J. (1987). Progress
in Photorespiration. Marinius Nrijhoff Publishers, Dordrecht,
Netherlands. 4: 361-368.
Bai., X.F., Cai, Y.P. and Nie, F. (1989). Relationship between abscisic
acid and grain filling of rice and wheat. Plant Physiology
Communications, 3:40-41.
Bamakhramah, H.S., Halloran, G.M. and Wilson, J.H. (1984).
Components of yield in diploid, tetraploid and hexaploid
wheats (Triticum spp.) Annals of Botany., 54(1): 51-60.
Bangerth, F., Aufhammer, W. and Baum, O. (1985). IAA level and dry
matter accumulation at different positions within a wheat
ear. Physiologia Plantarum, 63(1): 121-125.
Banziger, M., Feil, B. and Stamp, P. (1994). Competition between
nitrogen accumulation and grain growth for carbohydrates
during grain filling of wheat. Crop Science, 34: 440-446.
Bhardwaj, S.N. and Verma, V. (1985). Hormonal regulation of
assimilate translocation during grain growth in wheat. Indian
Journal of Experimental Botany, 23(12): 719-721.
Nat
ure
Pre
cedi
ngs
: hdl
:101
01/n
pre.
2010
.482
1.1
: Pos
ted
25 A
ug 2
010
Bhardwaj, S.N. and Verma, V. (1987). Regulation of grain size within a
developing ear of bread-wheat. Indian Journal of Agricultural
sciences, 57(10): 710-715
Bhatt, G.M. (1976). Variation of harvest index in several wheat
crosses. Euphytica, 25: 41-50.
Bingham, J. (1969). The physiological determination of grain yield in
cereals. Agricultural Production, 44: 30-32.
Birecka, H and Dakic-Wlodkowska, L. (1963). Photosynthesis,
translocation and accumulation of assimilates in cereals
during grain development. III Spring wheat-photosynthesis
and daily accumulation of photosynthates in the grain. Acta.
Soc. Bot. Pol., 32: 631-650.
Biryukov, S. and Komarova, V. (1986). Attraction of exogenous
sucrose by the ears in different genotypes of winter wheat.
In: Sechnyak-L (ed.) “Voprosy-selektsii-i-genetiki-zernovykh-
kul'tur”, 1983, rec'd, 169-180.
Blackman, V.H., (1919). The compound interest law and plant growth.
Annals of Botany, 33: 353-360.
Blum, A., Sinmena, B., Mayer, J., Golan, G. and Sholier, L. (1994).
Stem reserve mobilization supports wheat-grain filling under
heat stress. Australian Journal of Plant Physiology, 21: 771-
781.
Borkovec, V., Prochazka, S. and Ibrahim, M.E.D., (1990). Transport of
14C-sucrose and 14C-bezyl adenine in winter wheat (Triticum
Nat
ure
Pre
cedi
ngs
: hdl
:101
01/n
pre.
2010
.482
1.1
: Pos
ted
25 A
ug 2
010

aestivum L.) in the pre-anthesis period. Journal of Agronomy
and Crop Science, 165(4): 217-223.
Brocklehurst, P.A. (1977). Factors controlling grain weight in wheat.
Nature, 266: 348-349.
Cai, Q.S. (1991). Study of the growth curve and developmental stages
of wheat seed. Jiangsu Agricultural Sciences, 2: 14-16.
Caley, C.Y., Duffus, C.M. and Jeffcoat, B. (1990). Photosynthesis in the
pericarp of developing wheat grains. Journal of Experimental
Botany, 41(224): 303-307.
Chanda S.V., Narmada, K. and Singh, Y.D. (1999). Dry matter
accumulation and associated changes in biochemical
parameters during wheat grain development. Journal of
Agronomy and Crop Science, 182(3): 153-159.
Chang (1982). Study of grain filling in wheat. Acta Agronomica Sinica,
8: 87-93.
Chowdhury, S.I. and Wardlaw, I.F., (1978). The effect of temperature
on kernel development in cereals. Australian Journal of
Agricultural Research, 29(2): 205-223.
Colowick, S.P. and Kaplan, N.D. (1957). Methods in enzymology 3: 30-
40 Academic Press, New York.
Crossbie, T.M. and Mock, J.J. (1981). Changes in physiological traits
associated with grain yield improvement in three maize
breeding programmes. Crop Science, 65: 612-615.
Nat
ure
Pre
cedi
ngs
: hdl
:101
01/n
pre.
2010
.482
1.1
: Pos
ted
25 A
ug 2
010
Cruz Aguado, J.A., Rodes, R., Perez, I.P., and Dorado, M. (2000).
Morphological characteristics and yield components
associated with accumulation and loss of dry mass in the
internodes of wheat. Field Crops Research, 66(2): 129-139.
D’egidio, M.G., Checchini, C., Pagani, M.A., Lucisano, M. (1996).
Technica Molltroria, 47(7): 541-655.
Darroch, B. A. and Baker, R. J. (1990). Grain filling in three spring
wheat genotypes: statistical analysis. Crop Science, 30: 525-
529.
Davies, P.J. (1987). The plant hormones: Their nature, occurrence and
functions. In: Davies, P.J. (ed.) “Plant Hormones and their
Role in Plant Growth and Development”. Martinus Nijhoff
Publishers, Dordretch, the Netherlands, pp 1-11
Daynard, T. B., and Kannenberg, L.W. (1976). Relationships between
length of the actual and effective grain filling periods and
grain yield of corn. Canadian Journal of Plant Science, 56:
237-242.
Dewdney, S.J. and Mc Wha, J.A. (1979). Abscisic acid and the
movement of photosynthetic assimilates towards developing
wheat (Triticum aestivum L.) grains. Zeitschrift fur Acker und
Pflanzenphysiol, 92: 183-186.
Dietrich, J.T., Kaminek, M., Blevins, D.G., Reinbott, T.M. and Morris,
R.O. (1995). Changes in cytokinins and cytokinin oxidase
activity in developing maize kernels and the effects of
Nat
ure
Pre
cedi
ngs
: hdl
:101
01/n
pre.
2010
.482
1.1
: Pos
ted
25 A
ug 2
010

exogenous cytokinin on kernel development. Plant
Physiology and Biochemistry (Paris), 33(3): 327-336.
Dobben, V. (1962). Influence of temperature and light conditions on
dry matter distribution, development rate and yield in arable
crops. Netherlands Journal of Agricultural Sciences, 10: 377-
389.
Donald, C.M. (1968). The breeding of crop ideotypes. Euphytica,
17:385-403.
Dong, S.T. (1991). Studies on the relationship between canopy
apparent photosynthesis and grain yield in high-yielding
winter wheat. Acta Agronomica Sinica, 17(6): 461-469.
Duan L.S., He, Z.P. and Han, B.W. (2000). Features of assimilate
export from the flag leaf and partitioning during wheat grain
development. Journal of China Agricultural University, 5(1):
69-74.
Duan, J., Tian, C.E., Liang, C.Y., Huang, Y.W. and Liu, H.X. (1999).
Dynamic changes of endogenous plant hormones in rice
grains in different parts of panicle at grain-filling stage. Acta
Botanica Sinica, 41(1): 75-79.
Dubois, M., Giles, K.A., Humilton, J.K., Rebers, P.A. and Simth, F.
(1951). A colorimetric method for determination of sugars.
Nature (London), 168: 167.
Nat
ure
Pre
cedi
ngs
: hdl
:101
01/n
pre.
2010
.482
1.1
: Pos
ted
25 A
ug 2
010
Duguid, S.D. and Brule-Babel, A.L. (1994). Rate and duration of grain
filling in five spring wheat (Triticum aestivum L.) genotypes.
Canadian Journal of Plant Science, 74: 681-686.
Duncan, R.R., Blockholt, A.J. and Miller, F.R. (1981). Descriptive
comparison of senescent and non-senescent sorghum
genotypes. Agronomy Journal, 73: 849-853.
El Gawad, A.A.A., Abo Shetaia, A.M. and Edris A.S. (1985). Potential
productivity of wheat in Egypt II. Growth analysis studies of
certain wheat cultivars. Annals of Agricultural Science, 30(2):
835-848.
Estill, K., Delaney, R.H., Smith, W.K. and Ditterlin, R.L. (1991). Water
relations and productivity of alfalfa leaf chlorophyll variants.
Crop Science, 31: 1229-1233.
Evans, L.T. (1978). The influence of irradiance before and after
anthesis on grain yield and its components in micro crop
of wheat grown in constant day length and temperature
regime. Field Crops Research, 1: 5-19.
Evans, L.T. and Dunstone, R.L. (1970). Some physiological aspects of
evolution in wheat. Austrailian Journal of Biological Scienices,
23: 725-741.
Evans, L.T. and Rawson, H.M. (1970). Photosynthesis, translocation
and accumulation of assimilates in cereals during grain
development in wheat. Australian Journal of Biological Sciences,
23: 245-254.
Nat
ure
Pre
cedi
ngs
: hdl
:101
01/n
pre.
2010
.482
1.1
: Pos
ted
25 A
ug 2
010

Evans, L.T., Bingham, J and Roskams, M.A. (1972). The pattern of
grain set within covos of wheat. Australian Journal of
Bological Scienices, 25: 1-8.
Evans, L.T., Wardlaw, I.F. and Fisher, R.A. (1975). Wheat. In Crop
Physiology (Ed. L.T. Evans), Cambridge University Press,
London, pp. 101-150.
Farrar, J.F. 91993). Sink Strength: What is it and how do we measure
it? A forum. Plant cell Environment, 16: 1013-1046.
Fischer, R. A. and Kertesz, F. (1976). Harvest index in spaced
populations and grain yield in micro plots as indicators of
yielding ability in spring wheat. Crop Science, 16: 55-59.
Fischer, R.A., Bidinger, F. Syme, J.R. and Wall, P.C. (1981). Leaf
photosynthesis, leaf permeability, crop growth, and yield of
short spring wheat genotypes under irrigation. Crop Science,
21(3): 367-373.
Foti, S., Guarnaccia, P., Cosentino, S. and Sattin, M. (1994).
Contribution of awns to ear gas exchanges and grain filling in
durum wheat (Triticum durum Desf) grown in mediterranean
environment. In: Borin-M (ed.) Proceedings of the third
congress of the European Society for Agronomy, Padova
University, Abano-Padova, Italy, 18-22 September 1994, 124-
125.
Nat
ure
Pre
cedi
ngs
: hdl
:101
01/n
pre.
2010
.482
1.1
: Pos
ted
25 A
ug 2
010

Frederick, J.R. (1997). Winter wheat leaf photosynthesis, stomatal
conductance, and leaf nitrogen concentration during
reproductive development. Crop Science, 37(6): 1819-1826.
Frederick, J.R. and Camberato, J.J. (1995). Water and nitrogen effects
on winter wheat in the southeastern Costal Plain: II.
Physiological responses. Agronomy Journal 87: 527-533.
Gales, K. (1983). Yield variation of wheat and barley in Britain in
relation to crop growth and soil conditions - a review. Journal
of the Science of Food and Agriculture, 34(10): 1085-1104.
Gales, K. and Ayling, S.M. (1982). Causes of variation in the yield of
wheat in lotcombe laboratory. Annual report. 1981.
Agricultural research council, pp 20.
Gebeyehou, G., Knott, D.R. and Baker, R.J. (1982). Relationships
among durations of vegetative and grain filling phases, yield
components, and grain yield in durum wheat cultivars. Crop
Science, 22(2): 287-290.
Gent, M.P.N. and Kiyomoto, R.K. (1992). Canopy photosynthesis and
respiration in winter wheat adapted and unadapted to
Connecticut. Crop Science, 32(2): 425-431.
Goldbach H. (1975). The abscisic acid content of ripening grains of
various barley cultivars in relation to temperature and N-
nutrition. Published by Universitat Hohenheim, Stuttgart
80pp.
Nat
ure
Pre
cedi
ngs
: hdl
:101
01/n
pre.
2010
.482
1.1
: Pos
ted
25 A
ug 2
010

Guo, W.S., Feng, C.N., Yan, L.L., Peng, Y.X., Zhu, X.K., Zong, A.G.
(1995). Analysis of the source-sink relationship after anthesis
in wheat. Acta Agronomica Sinica, 21(3): 334-340.
Guo, W.S., Zhou, Z.X., Luo, S.S., yan, L.L., Peng, Y.X. (1994).
Dynamics of photosynthate translocation in wheat flag leaf
after anthesis. Acta Agricultural Nucleate Scinica, 21(3): 340-
344.
Guzy, M.R., Ehdaie, B., Waines, J.G. (1989). Yield and its components
in diploid, tetraploid and hexaploid wheats in diverse
environments. Annals of Botany, 64(6): 635-642.
Hansen, H and Grossmann, K. (2000). Auxin-induced ethylene triggers
abscisic acid biosynthesis and growth inhibition. Plant
Physiology, 124: 1437-1448.
Hanway, J.J. and Russell, W.A. (1969). Dry matter accumulation in
corn (Zea mays L.) plants. Agronomy Journal, 61: 947-951.
Herzog, H and Geisler G. (1982). Influence of ear size, leaf area and
cytokinin applications on the flag leaf development in wheat.
Zeitschrift fur Acker und Pflanzenbau, 151(2): 128-136.
Herzog, H. (1980). Source and sink relations during the grain-filling
period in six winter wheat cv. Zeitschrift fur Acker und
Pflanzenbau, 149(6): 472-487.
Herzog, H. (1982). Grain development and temporary dry matter
storage in vegetative organs of wheat genotypes. Zeitschrift
fur Acker und Pflanzenbau, 151(5): 388-398.
Nat
ure
Pre
cedi
ngs
: hdl
:101
01/n
pre.
2010
.482
1.1
: Pos
ted
25 A
ug 2
010

Hess, J.R., Carman, J.G. and Banowetz, G.M. (2002). Hormones in
wheat kernels during embryony. Journal of Plant Physiology,
159: 379-386.
Hiscox, J.D. and Israelstam, G.F. (1971). Amethod for extraction of
chlorophyll from leaf tissue without maceration. Canadian
Journal of Botany, 578: 1332-1334.
Ho, L.C. (1988). Metabolism and compartmentation of imported
sugars in sink organs in relation to sink strength. Annual
Review of Plant Physiology and Plant Molecular Biology, 39:
355-378.
Humphries, E.C. and Bond, W. (1969). Experiments with CCC on
wheat: effects of spacing, nitrogen, and irrigation. Annals of
Applied Biology 64:375-384.
Jenner C.F. and Rathjen, A.J. (1978). Physiological basis of genetic
differences in the growth of the grains of six varieties of
wheat. Australian Journal of Plant Physiology, 5: 249-262.
Jenner, C.F. (1974). Factors in the grain regulations: the accumulation
of starch. Royal Society of New Zealand Bulletin. 49: 153-
156.
Jenner, C.F. (1979). Grain-filling in wheat plants shaded for brief
periods after anthesis. Australian Journal of Plant Physiology,
6(5-6): 629-641.
Jenner, C.F. (1991). Effect of exposure of wheat ears to high
temperature on dry matter accumulation and carbohydrate
Nat
ure
Pre
cedi
ngs
: hdl
:101
01/n
pre.
2010
.482
1.1
: Pos
ted
25 A
ug 2
010

metabolism in grain of two cultivars. 1. Immediate response.
Australian Journal of Plant Physiology, 18: 165-177.
Jenner, C.F., Ugalde, T.D., Aspinall, D. (1990). The physiology of starch
and protein deposition in the endosperm of wheat. Technical
Report Department of Agriculture, South Australia. No. 160,
26 pp.
Jiang, D., Yu, Z.W., Li, Y.G., Yu, S.L. (2001). Changes in soluble sugar
contents in the leaf, stem and grain of winter wheat and
their relationship with grain starch accumulation. Journal of
Triticeae Crops, 21(3): 38-41.
Karssesn, C.M. (1982). The role of endogenous hormones during seed
development and the onset of primary dormancy. In: P.F.
Wareing, (ed.), Plant growth Substances, Academic Press,
London, pp 623-632.
Kaur, S. and Singh, G. (1987). Carbohydrate metabolism in relation to
grain development in wheat. Annals of Biology Ludhiana,
3(2): 46-51.
Kende, H. and Zeevaart J.A.D. (1997). The five “classical” plant
hormones. Plant Cell, 9: 1197-1210.
King, R.W. (1979). Abscisic acid synthesis and metabolism in wheat
ears. Australian Journal of Plant Physiology, 6(1): 99-108.
King, R.W., Wardlaw, I.P. and Evans, L.T. (1967). Effect of assimilate
utilization on photosynthetic rate in wheat. Planta, 77: 261-
276.
Nat
ure
Pre
cedi
ngs
: hdl
:101
01/n
pre.
2010
.482
1.1
: Pos
ted
25 A
ug 2
010
Kojima, K. (1995). Simultaneous measurement of ABA, IAA and GA’s
in citrus – Role of BA in relation to sink ability. Journal of
Agricultural Research Quarterly, 29: 179-185.
Komor, E., Liegl, Schobert, C. (1993). Loading and translocation of
various cytokinins in phloem and xylem of the seedlings of
Rachinus communis L. Planta, 191: 252-255.
Kondaiah, D.M. (1991). Regualtion of sink growth in wheat (Trititcum
aestivum). M.Sc., Thesis. Post-Graduate School, IARI, New
Delhi-12.
Konings, H. (1989). Physiological and morphological differences
between plants with high NAR of high LAR as related to
environmental conditions. In “Causes and Consequnces of
variation in Growth Rate and Productivity of higher Plants”.
Eds. H.Lambers, M.L. Cambridge, H. Konings and T.L. Pons.
pp 101-123.
Koshkin, E.L. and Tararina, V.V. (1990). Differences in source-sink
ratios in wheat and their relationship to grain yield and
content of abscisic acid. Plant Physiology and Biochemistry
(London), 28(5): 609-616.
Kosina, R. 1981, Analysis of representation of ear structure characters
in tetra- and hexaploid forms of spring wheat and in their
hybrids. Genetica Polonica., 22(1): 63-78.
Krishnamoorthy, H.N. (1981). Plant growth substances, including
applications in agriculture, New Delhi, Tata McGraw Hill.
Nat
ure
Pre
cedi
ngs
: hdl
:101
01/n
pre.
2010
.482
1.1
: Pos
ted
25 A
ug 2
010
Kumar, A., Yadav S.K., Dhiman S.D. (1987). Growth analysis of wheat
under irrigated and unirrigated conditions. Indian Journal of
Ecology, 14(2): 224-229.
Kumar, R and Singh, R. (1981). Free sugars and their relationship with
grain size and starch content in developing wheat grains.
Journal of the Science of Food and Agriculture, 32(3): 229-
234.
Kumar, R. (1980). Studies on the enzymes of carbohydrate
metabolism in developing grains of wheat (Triticum
aestivum L.). Thesis Abstracts, 6(1): 17-18.
Kumari, S. and Ghildiyal, M.C. (1997). Availability and utilization of
assimilates in relation to grain growth within the ear of
wheat. Journal of Agronomy and Crop Science, 178(4): 145-
149.
Larsson, M. and Heneen, W.K. (1992). Studies on seed quality of
triticale alpha amylase and starch. Agro Food Industry Hi
Tech, 3(1): 26-28.
Lee, B., Martin, P. and Bangerth, F. (1989). The effect of sucrose on
the levels of abscisic acid, indole-acetic acid and
zeatin/zeatin riboside in wheat ears growing in liquid culture.
Physiologia Plantarum, 77: 73-80.
Liu, X.B. and Li, W.X. (1996). Preliminary studies on the accumulation
of grain starch and protein during grain filling in wheat. Acta
Agronomica Sinica, 22(6): 736-740.
Nat
ure
Pre
cedi
ngs
: hdl
:101
01/n
pre.
2010
.482
1.1
: Pos
ted
25 A
ug 2
010

Liu, Z.C. (1980). A study of the photosynthetic characteristics of
different plant types in rice. Scientia Agricultura Sinica, 3: 3-
10.
Ludlow, M.M. and Muchow, R.C. (1990). A critical evaluation of traits
for improving crop yields in water limited environments.
Advances in Agronomy, 43: 107-153.
Lupton, F.G.H. (1968). The analysis of grain yield in wheat in terms of
photosynthetic ability and efficiency of translocation. Annals
of Applied Botany, 61: 109-119.
Lur, H.S. and Setter, T.L. (1993). Role of auxin in maize endosperm
development. Plant Physiology. 103: 273-280.
Martin, C. and Smith, A.M. (1995). Starch biosynthesis. Plant Cell, 7:
971-985.
Mengel, K., Judel, G.K. (1981). Effect of light intensity on the activity
of starch synthesizing enzymes and starch synthesis in
developing wheat grains. Physiologia Plantarum, 51(1): 13-
18.
Mi, G., Li, T., Zhang, F. and Zhang, J. (2002). Carbohydrate storage
and utilization during grain filling as regulated by nitrogen
application in two wheat cultivars. Journal of Plant Nutrition,
25(2):213-229.
Michael, G., Auinger, P. and Wilberg, E. (1970). Eingie aspekte Zur
hormonellen regulation der korngrosse beigetrude.
Zeitschrift fur Acker und Pflanzenernalr Bodenk, 125: 24-35.
Nat
ure
Pre
cedi
ngs
: hdl
:101
01/n
pre.
2010
.482
1.1
: Pos
ted
25 A
ug 2
010

Millet, E. and Pinthus, M.J. (1984). The association between grain
volume and grain weight in wheat. Journal of Cereal Science,
2(1): 31-35.
Miralles, D.I., Dominguesz, C.F., Slafer, G.A. (1996). Relationship
between grain growth and post-anthesis leaf area duration in
dwarf, semi-dwarf and tall isogenc lines of wheat. Journal of
Agronomy and Crop Science, 177: 115-122.
Monula, M.A., Bangerth, F. and Story, V. (1980). Gibberellins like
substances and indole type auxins in developing grains of
normal and high-lysine genotypes of barley. Plant
Physiology, 48: 568.
Morris, C.F., Anderberg, R.J. Goldmark, P.J. walker-Simons M.K. (1991).
Molecular cloning and expression of abscisic acid-responsive
genes in embryos of dormant wheat seeds. Plant
Physiology,95: 814-821.
Muller, J. (1986). Ecophysiological characterization of CO2 exchange
in leaves of winter wheat (Triticum aestivum L.) II. Analysis
of irradiance and CO2 response curves by a model.
Photosynthetica, 20(4): 466-475.
Nakamura, Y. and Yuki, K. (1992). Changes in enzyme activities
associated with carbohydrate metabolism during
development of rice endosperm. Plant Sciences, 82: 15-20.
Nat
ure
Pre
cedi
ngs
: hdl
:101
01/n
pre.
2010
.482
1.1
: Pos
ted
25 A
ug 2
010
Nakamura, Y. and Yuki, K., Park, S.Y., (1989). Carbohydrate
metabolism in the developing endosperm of rice grains.
Plant Cell Physiology, 30: 833-839.
Neales, T.F. and Incoll, L.D. (1968). The control of leaf photosynthesis
rate by level of assimilate concentration in the leaf. A review
of the hypothesis. Botanical Review, 34: 107-125.
Ober E.S. (1991) Water deficit during maize endosperm development:
abscisic acid, cell division, and storage product synthesis. In:
Dissertation Abstracts International B, Sciences and
Engineering, 51: 9.
Okita, T.W. (1992). Is there any alternative pathway for starch
synthesis? Plant Phsyiology 100: 560-564.
Pande, P.C., Nagarajan, S. and Gambhir, P.N. (1995). Physiological
constraints in improvement of grain size and grain filling in
wheat. Indian Journal of Plant Physiology, 38(2): 121-125.
Panse. V.G. and Sukhtme, P.V. (1967). Statistical methods for
agricultural worker. ICAR Publication, New Delhi-12.
Patrick, J. W. (1983). Photosynthate undloading from seed coasts of
Phaseolus vulgaris L. General characteristics and facilitated
transfer. Zeitschrift fur Acker und Pflanzenphysiol, 111: 9-18.
Patrick, J.W. and Wardlaw, I.F. (1984). Vascular control of
photosynthetic transfer flag leaf to the ear of wheat. Australian
Jounal of Plant Physiology, 11: 235-241.
Nat
ure
Pre
cedi
ngs
: hdl
:101
01/n
pre.
2010
.482
1.1
: Pos
ted
25 A
ug 2
010

Pearman, I., Thomas, S.M. and Thorne, G.N. (1979). Effect of nitrogen
fertilizer on photosynthesis of several varieties of winter
wheat. Annals of Botany, 43: 613-621.
Peat, J.R. (1985). The role of source-sink interactions in cereals in
controlling yield. Monograph, British Plant Growth Regulator
Group, 12: 227-242.
Pinthus, M.J. and Sar-Shalom, Y. (1978). Annals of Botany, 42: 469-
471.
Poorter, H. (1989). Interspecific variation in relative growth rate: on
ecological causes and physiological consequences. In.
Causes and Consequences of Variation in Growth Rate and
Productivity of higher Plants. Eds. H. Lambers, M.L.
Cambridge, H. Konings and T.L. Pons. SPB Academic
Publishing. The Hague. pp 45-68.
Power, J.F., Mills, W.O. and Grunes, D.L. (1967). Effect of soil
temperature, phosphorus on growth analysis of barley.
Agronomy Journal, 59: 231-234.
Pramod Kumar, Dube, S.B and Chauhan, V.S. (1998). Relationship
among yield and some physiological traits in wheat. Indian
Journal of Plant Physiology, 3(3): 229-230.
Preiss, J. Ball, K., Smith-White, B., Lglesias, A, Kakefuda, G. and Li., L.
(1991). Starch biosynthesis and its regulation. Biochemical
Society Trans. 19: 539-547.
Nat
ure
Pre
cedi
ngs
: hdl
:101
01/n
pre.
2010
.482
1.1
: Pos
ted
25 A
ug 2
010

Qin, Z. and Tang, X. (1984). Dynamics of some large biomolecules
during the formation of rice endosperm. China Science 12:
1103-1110.
Radely, M. (1976). The development of wheat grain in relation to
endosperm growth substances. Journal of Experimental
Botany, 27: 1009-1021.
Radford, P.K. (1967). Growth analysis formulae. The uses and abuses.
Crop Science, 7: 171-175.
Radley, M. (1976). The development of wheat grain in relation to
endogenous growth substances. Journal of Experimental
Botany, 27: 1009-1021.
Rahman, M.A., Karim, A.J.M.S., Hoque, M.M. and Egashira, K. (2000).
Effects of irrigation and nitrogen fertilization on
photosynthesis, leaf area index and dry matter production of
wheat on a clay terrace soil of Bangladesh. Journal of the
Faculty of Agriculture, Kyushu University. 45(1): 289-300.
Ralph, W. (1984). The conservative wheat plant. Rural Research,
124: 9-12.
Rawson H.M., Gifford, R.M. Bremmer, P.M. (1976). Carbon dioxide
exchange in relation to sink demand in wheat. Planta 132:
19-21
Rawson, H.M. (1971). Tillering patten in wheat with special reference
to the shoot at the coleoptile node. Australian Journal of
Biological Sciences. 24: 829-841.
Nat
ure
Pre
cedi
ngs
: hdl
:101
01/n
pre.
2010
.482
1.1
: Pos
ted
25 A
ug 2
010

Rawson, H.M. and Evans, L.T. (1971). The contribution of different of
stem reserves to grain development in the range of wheat
cultivars of different height. Australian Journal of Agricultural
Research, 22: 851-863.
Rawson, H.M. and Ruwali, K.N. (1972). Ear branching as a means of
increasing grain uniformity in wheat. Australian Journal of
Agricultural Research, 23(4): 551-559.
Rawson, H.M., Gifford, R.M. and Bremmer, P.M. (1976). Carbon
dioxide exchange in relation of sink demand in wheat.
Planta, 132: 19-23.
Reynold, M.P., Balota, M. Delgado, M.I.B., Amani, L., Fisher, R.A.
91994). Physiological and morphological traits associated
with spring wheat under late irrigated conditions. Australian
Journal of Plant Physiology, 21: 717-730.
Reynolds, M.P., Balota, M., Delgado, M.I.B., Amani, I. and Fischer, R.A.
(1994). Physiological and morphological traits associated
with spring wheat yield under hot, irrigated conditions.
Australian Journal of Plant Physiology, 21(6): 717-730.
Rosenow, D.T., Quisenberry, J.E., Wendt, C.W. and Clark, L.E. (1983).
Drought tolerant sorghum and cotton germplasm. In: Plant
Production and Management under Drought Conditions
(Stone, J.F. and Willis, W.O., eds). Elsevier, Amsterdam,
Netherlands, pp. 207-222.
Nat
ure
Pre
cedi
ngs
: hdl
:101
01/n
pre.
2010
.482
1.1
: Pos
ted
25 A
ug 2
010

Saha, C.S., Ahmed, Z.U., Mia, M.M. and Bhuiya, A.D. (1980)
Relationship between grain yield and photosynthetic area of
different structures above the flag leaf node in wheat.
SABRAO Journal, 12(1): 25-29.
Saharan, M.R., Dhiman, S.D. and Singh, R. (1985). Growth
characteristics of field grown wheat genotypes differing in
grain yield. International Journal of Tropical Agriculture, 3(1):
9-21.
Salunkhe, D.K., Chavan, J.K. and Kadam, S.S. (1985). Wheat. In “Post
harvest Biotechnology of Cereals”. CRC Press, Inc., Boca
Raton, Florida. pp 43-63.
Sayed, H.I. and Gadallah, A.M. (1983). Variation in dry matter and
grain filling characteristics in wheat cultivars. Field Crops
Research, 7(1): 61-71.
Schnyder, H., Gillenberg, C. and Hinz, J. (1993). Fructan contents and
dry matter deposition in different tissues of the wheat grain
during development. Plant Cell and Environment, 16(2): 179-
187.
Schussler, J.R. Brenner, M.L. Brun, W.A. (1984). Abscisic acid and its
relationship to seed filling in soyabeans. Plant Physiology,76:
301-306.
Sekhon N.K. and Singh G. (1994). Effect of growth regulators and date
of sowing on grain development in wheat. Indian Journal of
Plant Physiology, 37(1): 1-4.
Nat
ure
Pre
cedi
ngs
: hdl
:101
01/n
pre.
2010
.482
1.1
: Pos
ted
25 A
ug 2
010

Seth, A.K. and Waering, P.E. (1967). Hormone-directed transport of
metabolites and its possible rote in plant senescence. Journal
of Experimental Botany, 18: 65-67
Sharma, R.C. (1994). Early generation selection for grain-filing period
in wheat. Crop science, 34: 945-948.
Sharma-Natu Poonam and Ghildiayal, M.C. (1993). Diurnal changes in
photosynthesis in relation to ribulose-1,5-bisphosphate
carboxylase activity and saccharides in wheat leaves.
Photosynthetica. 29: 551-556.
Shuting, D. (1994). Canopy apparent photosynthesis, respiration and
yield in wheat. Journal of Agricultural Science, Cambridge,
122: 7-12.
Siddique, K.H.M., Belford, R.K. Perry, M.W. and Tennane, D. (1989).
Growth, development and light interception of old and
modern wheat cultivars in a Mediterranean-type
environment. Australian Journal of Agricultural Research, 40:
473-487.
Simane, B., Peacock, J.M. and Struil, P.C. (1993). Differences in
developmental plasticity and growth rate among drought-
resistant and susceptible cultivars of duram wheat (Triticum
turgidum L. var. durum). Plant and soil, 57: 155-166.
Simmons, S.R. and Crookston, R.K. (1979). Rate and duration of ratio
in growth kernels formed at specific spiklets of spring wheat.
Crop Science, 19: 690-693.
Nat
ure
Pre
cedi
ngs
: hdl
:101
01/n
pre.
2010
.482
1.1
: Pos
ted
25 A
ug 2
010

Singh G., Kaur S., Sharma R. (1989). Endogenous levels of
phytohormones in relation to grain development in wheat
(Triticum aestivum L). Annals of Plant Physiology, 3(2): 137-
145.
Singh, G. and Gerung, S.B. (1982). Hormonal role in the problem of
sterility in Orizya Sativa. Plant Physiology Biochemistry 9:
22-23.
Singh, V.P., Dahiya, B.N., Chowdhury, R.K. (1977). Genetic studies of
grain filling period in wheat. In: Gupta, A.K. (ed.), Genetics
and Wheat Improvement. II. Genetics of Economic Traits. 42-
43.
Singhal, N.C., Srivastava, K.N. and Mehta, S.L. (1989). Pattern of dry
matter and protein accumulation in developing wheat seeds
and their relationship. Indian Journal of Genetics and Plant
Breeding, 49(1): 95-102.
Sinha, N.C. and Patil, B.D. (1986). Screening of barley varieties for
drought resistance. Plant Breeding, 97:13-19.
Sivakumar, T. (2002). Relationship of endogous cytokinins and absicic
acid with grain development in wheat and triticale, Ph.D.
Thesis. Post-Graduate School, IARI, New Delhi-12.
Sivakumar, T. and Virendra Nath (2000). Effect of BA on
photosyntheis pigment content in the flag leaf and ear of
wheat and Triticale. Indian Journal of Plant Physiology, 5(4):
354-357.
Nat
ure
Pre
cedi
ngs
: hdl
:101
01/n
pre.
2010
.482
1.1
: Pos
ted
25 A
ug 2
010

Sivakumar, T. Virendra Nath, Srivastava, G.C. (2001). Journal of
Agromony and Crop Science, 186: 43-46.
Slafer, G. A. and Rawson, H.M. (1994). Sensitivity of wheat phasic
development to major environmental factors: A re-
examiantion of some assumpations made by physiologis and
midelers. Australian Journal of Plant Physiology, 21: 393-426.
Slafer, G.A., Andrade, F.H. (1993). Physiological attributes related to
the generation of grain yield I. bread wheat cultivars
released at different crops. Field Crop Research, 31:351-367.
Sofield, I., Evans, L.T., Crook, M.G. and Wardlaw, I.F. (1977). Factors
influencing the rate and duration of grin filling in wheat.
Australian Journal of Plant Physiology, 4: 785-797.
Spiertz, J.H. J. and Van de Haar, H. (1978). Differences in grain
growth, crop photosynthesis and distribution of assimilates
between a semi-dwarf and a standard of winter wheat.
Netherlands Journal of Agricultural Sciences, 26: 233-249.
Spiertz, J.J., Tent Hag, B.A. and Kupers, L.J.P. (1971). Relation between
green area duration and grain yield in some varieties of wheat.
Netherlands Journal of Agricultural Sciences, 19: 211-222.
Spitters, C.J.T. and Kramer, T. (1986). Differences between spring
wheat cultivars in early growth. Euphytica, 35(1): 273-292.
Stamp, P.H. and Geisler, G. (1976). Grain development in relation to
grain position in two spring wheat cultivars. Zeitschrift fur
Acker und Pflanzenbau, 142(4): 264-274.
Nat
ure
Pre
cedi
ngs
: hdl
:101
01/n
pre.
2010
.482
1.1
: Pos
ted
25 A
ug 2
010
Stoy, V. (1969). Interrelationship among photosynthesis respiration
and movement of carbon in developing crops. In
Physiological aspects of crop yield. Ed. Eastin, J.D. et al.,
American Society of Agronomy and Crop Science Society.
America, Madison, Wisconisi, (USA), pp. 185-202.
Subrahmanyam, D and Dutta, M. (2000). Relationship between leaf
photosynthetic characteristics and yield in buckwheat. Indian
Journal of Plant Physiology., 5(4): 328-333.
Sundberg, B. (1990). Influence of extraction solvent (buffer,
methanol, acetone) and time on the quantification of indole-
3-acetic acid in plants. Plant Physiology, 78: 293-297.
Syme, J.R. (1972). Single plant characters as a measure of filed plot
performance of wheat cultivars. Australian Journal of
Agricultural Research, 26: 753-760.
Takagi M., Yokota T., Murofushi N., Saka H. and Takahashi N. (1989).
Quantitative changes of free-base, riboside, ribotide and
glucoside cytokinins in developing rice grains. Plant Growth
Regulation, 8(4): 349-364.
Takahashi, T., Tsuchihashi, N. and Nakaseko, K. (1993). Grain filling
mechanisms in spring wheat. I. Grain filling phases according
to the development of plant organs. Japanese Journal of Crop
Science, 62(4): 560-564.
Takahashi, T., Tsuchihashi, N., Nakaseko, K. (1994). Grain filling
mechanisms in spring wheat: II. Growth, accumulation and
Nat
ure
Pre
cedi
ngs
: hdl
:101
01/n
pre.
2010
.482
1.1
: Pos
ted
25 A
ug 2
010
translocation in the daytime and at night during the four
grain filling phases. Japanese Journal of Crop Science, 63(1):
75-80.
Thorne, G. N, Welbank, P.J. and Blackwood, G.C. (1969). Growth and
yield of six short varieties of spring wheat derived from Norin
10 and two Europena varieties. Annals of Applied Biology
63: 241-251.
Thorne, G.N. (1971). Physiological factors limiting the yield of arable
crops. In “Potential crop production, A case study”. Ed.
Wareing, P.F. and Cooper, J.P., Heinemann Educational Books
Limited, London.
Turner, N.C. and Nicolas, M.E. (1987). Drought resistance of wheat for
light-textured soils in a Mediterranean climate. In “Drought
tolerance in Winter Cereals”. Eds. J.P. Srivastava, E.
Porceddu, E. Acevedo and S. Varma. John Wiely & Sons,
Chichester. Pp 203-216.
Tuttobene, R., Lombardo, G.M. and Vagliasindi, C. (1996). Validity of
the main indexes of growth analysis used to describe durum
wheat (Triticum durum Desf.) growth in the Mediterranean.
Rivista di Agronomia, 30(3): 241-247.
Van den Boogard, R. Goubitz, S., Veneklaas, E.J. and Lambers, H.
(1996). Carbon and nitrogen economy of four Trititcum
aestivum cultivars differing in relative growth rate and water
use efficiency. Plant, Cell and Environment, 19; 998-1004.
Nat
ure
Pre
cedi
ngs
: hdl
:101
01/n
pre.
2010
.482
1.1
: Pos
ted
25 A
ug 2
010

Van Sanford, D.A. (1985). Variation in kernel growth characters
among soft red winter wheats. Crop Science, 25: 626-630.
Voltos, J., Santiveri, P., royo, C., romagosa, I., Scaife, A. (1962). Rate
and duration of grain filling in triticale. “Proceedings of
Second Congress of the European Society for Agronomy”.
Warwick University, UK, 33-38.
Vos-NM-de (1979). Cultivar differences in plant and crop
photosynthesis. In: Spiertz, J.H.J. and Kramer. T (ed.) Crop
Physiology and Cereal Breeding. Proceedings of a Eucarpia
workshop, Photosynthesis and respiration held at
Wageningen, the Netherlands, 14-16 November 1978. 71-74
pp.
Wang, Z.L., He, M.R., Yin, Y.P. and Cao, H.M. (1997). Assimilation and
partitioning of the photosynthates in late sown winter wheat
at grain filling and their response to plant population density.
Acta Agronomica Sinica, 23(3): 257-262.
Wardlaw, I.F and Moncur, L. (1976). Source, sink and hormonal control
of translocation in wheat. Planta. 128(2): 93-100.
Wardlaw, I.F. (1968). The control and pattern of movement of
carbohydrated in plants. Botanical Review, 34: 79-105.
Wardlaw, I.F. (1990). The control of carbon partitioning in plants. New
Phytologist, 116: 341-381.
Nat
ure
Pre
cedi
ngs
: hdl
:101
01/n
pre.
2010
.482
1.1
: Pos
ted
25 A
ug 2
010
Warrier, A., Bhardwaj, S.N., Pande, P.C. (1987). Effect of BA on grain
growth in aestivum wheat. Plant Cell Phsyiology. 28: 735-
739.
Watson, D.J. (1952). The physiological basis of variation in yield,
Advances in Agronomy, 4: 101-145.
Watson, D.J. (1971). Size, structure and activity of the productive
system of crops. In “Potential crop production, A case study”
Ed. Wareing. P.F., and Cooper, J.P., Heinemann Educational
Books Limited, London, pp. 76-88.
Watson, R.A. and Duffus, C.M. (1988). CO2 fixation by detached
cereal caryopsis. Plant Phsyiology, 87: 504-509.
Welbank, P.J., French, S.A. and Witts, K.J. (1966). Dependence of
yields of wheat varieties on their leaf area duration. Annals
of Botany, 30: 291-299.
Whan, B. R., Carlton, G.P. and Anderson, W.K. (1991). Potential for
increasing rate of grain growth in spring wheat. I.
Identification of genetic improvement. Australian Journal of
Plant Physiology, 47: 17-31.
Wheeler, A.M. (1972). Changes in growth substances during growth of
wheat grains. Annals of Applied Biology. 72: 327-334.
Wheeler, A.W., (1976). Some treatments affecting growth substances
in developing wheat ears. Annals of Applied Biology, 83(3):
455-462.
Nat
ure
Pre
cedi
ngs
: hdl
:101
01/n
pre.
2010
.482
1.1
: Pos
ted
25 A
ug 2
010

Whitfield, D.M. (1990). Canopy conductance, carbon assimilation and
water use in wheat. Agricultural and Forest-Meteorology.
53(1-2): 1-18.
Willman, M.R. Below, E.F., Lambert, R.J., Howey, A.E. and Mies, D.W.
(1987). Plant traits related to productivity of maize. I. genetic
variability, environmental varation and correlation with grain
yield and stalk loading. Crop Science, 27: 1116-1121.
Wood, R.M. Patrick, J.W. Offler, C.E. (1994). The cellular pathway and
short distance transfer of photosynthates and potassium in
the elongation stem of Phaseolus vulagris L. stem anatomy,
solute transport and pool sizes. Annals of Botany, 73: 151-
160.
Wright, G.S., Smith, R.C.G. and Morgan, J. M. (1983). Differences
between two grain sorghum genotypes in adaptation to
drought stress. III. Physiological responses. Australian
Journal of Agricultural Research, 34:1
Xu, R.S., Tao, L.X., Yu, M.Y. and Wang, X. (1997). Manipulation of
grain-filling characteristics of intersubspecific hybrid rice and
its effect on the yield. Chinese Journal of Rice Science, 11(2):
124-128.
Yang, J.C., Peng, S.B., Zhu, Q.S. and Gu, S.L. (2000). Grain filling
pattern and cytokinin content in the grains and roots of rice
plants. Plant Growth Regulation, 30(2): 261-270.
Nat
ure
Pre
cedi
ngs
: hdl
:101
01/n
pre.
2010
.482
1.1
: Pos
ted
25 A
ug 2
010

Yang, J.C., Zhang, J.H., Wang, Z.Q., Zhu, Q.S. and Liu, L.J. (2001).
Water deficit-induced senescence and its relationship to the
remobilization of pre-stored carbon in wheat during grain
filling. Agronomy Journal, 93(1): 196-206.
Yordanov, J and Belikov, P. (1962). Changes in the intensity of
photosynthesis in the ontogenesis of spring wheat lutescens
62-lzv. Institute of Biology Metodii Poov (Bulg. Acad. Nauk),
12: 513.
Yordanov, J. and Beikov, P. (1962). Changes in the intensity of
photosynthesis in the ontogenesis of spring wheat lutescens 62-
Izv. Insti. Biol. Metodii Popov (Bulg. Acad. Nauk). 12: 513.
You, N.S., Lei, J.C., Huang L.X., Zheng X.H. and Zhu X.T. (1997).
Comparing analysis of endogenous IAA, GA1+3+4+7 in rice
male-sterile line with alloplasm-homokaryon. Journal of
Fujian Academy of Agricultural Sciences, 12(1): 7-11.
Zamski, E. and Grunberger, Y. (1995). Short- and long-eared high-
yielding hexaploid wheat cultivars: which has unexpressed
potential for higher yield? Annals of Botany. 75(5): 501-506.
Zee, S.Y. and O’Brien, T.P. (1970). Studies on the ontogeny of the
pigment strand in the caryopsis of wheat. Australian Journal
of Biological Sciences, 23: 1153-1171.
Zhu, Q., Cao, X. and Luo, Y. (1988). Growth analysis on the process of
grain filling in rice. Acta Agronomica Sinicia, 14(3): 182-193.
Nat
ure
Pre
cedi
ngs
: hdl
:101
01/n
pre.
2010
.482
1.1
: Pos
ted
25 A
ug 2
010

POST GRADUATE SCHOOLINDIAN AGRICULTURAL RESEARCH INSTITUTE
NEW DELHI-110 012
PROFORMA FOR SUBMITTING ABSTRACT
Title of thesis : “Studies on endogenous hormonal
changes during grain development
in wheat genotypes”
Full name of the
Student
: Gutam Sridhar
Name & Address of the Chairman
: Dr. Virendra Nath, Principal ScientistDivision of Plant Physiology,IARI, New Delhi-110012
Degree awarded : Ph. D.
Major Subject : Plant Physiology
Year of award of
Degree
: 2004
Total number of pages in thesis
: 83
Total number of words in thesis abstract
: 363
Signature of the student
:
Signature, name and address of the forwarding authority
:
Dr. P.S. Deshmukh, ProfessorDivision of Plant PhysiologyIARI, New Delhi-110 012
Nat
ure
Pre
cedi
ngs
: hdl
:101
01/n
pre.
2010
.482
1.1
: Pos
ted
25 A
ug 2
010

Name of the student : Gutam Sridhar
Roll No. : 8592
Degree for which thesis is submitted
: Ph.D.
Division : Division of Plant Physiology
Date of joining the
P.G.School
: 8-9-1999
Date of submission of
thesis
: 31-12-2003
Major field : Plant Physiology
Minor fields : Agronomy and Environmental Sciences
Advisory Committee
Name of the Chairman : Dr. Virendra Nath
Members : Dr. G.C. SrivastavaDr. Santosh KumariDr. S.D. SinghDr. Ranbir Singh
Title of the thesis : “Studies on endogenous hormonal
changes during grain development
in wheat genotypes”Abstract
Pot culture experiment was conducted in the Rabi seasons of
2001 and 2002 in order to study the genotypic differences in grain
growth rates and endogenous hormonal contents in the developing
grains. The hexaploid new plant types and extant variety and other
tetraploids are taken up for the study. The data on yield and yield
components show that the tetraploids had higher ear number per
plant but lesser number of seeds per ear and lower seed weight per
Nat
ure
Pre
cedi
ngs
: hdl
:101
01/n
pre.
2010
.482
1.1
: Pos
ted
25 A
ug 2
010

ear. The most important yield component 1000-grain yield was also
possessed by hexaploids. The mean plant height was found to be
higher in hexaploids over tetraploids in general, and among them DL-
1266-1 and DL-1266-2 (new plant types) recorded higher plant
height. Similarly, the ear length was also higher in these new plant
types. But, the tiller number/plant and ear number/plant were
significantly higher in tetraploids. The new plant types (hexaploids)
possessed maximum grain growth rate at 5–15 DAA. DL-1266-2
recorded highest grain growth rate 0.093 g/g/day.
The photosynthetic rate values show that the hexaploids
possessed higher rate than tetraploids. At 7 and 15 DAA, in general,
photosynthetic rate was more when compared to 25 DAA and 35 DAA.
The results showed that the endogenous hormonal contents in grains
during grain development had changed in sequence. At 7 DAA,
gibberellic acid (GA3) content was at maximum and at 15 DAA (rapid
growth phase), indole-acetic acid (IAA) reached maximum and at 25
DAA (dough stage), ABA was at the maximum. At the 35 DAA, ABA
reached all time high and GA3 the least, IAA being intermediate.
Among the genotypes, hexaploids recorded higher concentrations of
endogenous hormones. The total chlorophyll content in flag leaves of
hexaploids was higher than tetraploids. The mean total chlorophyll
had increased slightly at 20 DAA when compared to 10 DAA and it
decreased at 30 DAA.
It appears that the high yielding hexaploids (DL-1266-1 & Dl-
1266-2) by the virtue of possessing more 1000-grain weight and leaf
Nat
ure
Pre
cedi
ngs
: hdl
:101
01/n
pre.
2010
.482
1.1
: Pos
ted
25 A
ug 2
010

area along with endogenous hormones might be responsible for
higher yield as compared to tetraploids. It appears that better
photosynthetic rate and better mobilization of photosynthates during
grain filling stage contributes for higher yield in hexaploids.
Nat
ure
Pre
cedi
ngs
: hdl
:101
01/n
pre.
2010
.482
1.1
: Pos
ted
25 A
ug 2
010