Studies on Bracing Member End Connections for Cold Formed ...
16
Missouri University of Science and Technology Missouri University of Science and Technology Scholars' Mine Scholars' Mine International Specialty Conference on Cold- Formed Steel Structures (2012) - 21st International Specialty Conference on Cold-Formed Steel Structures Aug 24th, 12:00 AM - Aug 25th, 12:00 AM Studies on Bracing Member End Connections for Cold Formed Studies on Bracing Member End Connections for Cold Formed Steel Sections Steel Sections R. P. Rokade N. Prasad Rao R. Balagopal S. J. Mohan Follow this and additional works at: https://scholarsmine.mst.edu/isccss Part of the Structural Engineering Commons Recommended Citation Recommended Citation Rokade, R. P.; Rao, N. Prasad; Balagopal, R.; and Mohan, S. J., "Studies on Bracing Member End Connections for Cold Formed Steel Sections" (2012). International Specialty Conference on Cold-Formed Steel Structures. 5. https://scholarsmine.mst.edu/isccss/21iccfss/21iccfss-session9/5 This Article - Conference proceedings is brought to you for free and open access by Scholars' Mine. It has been accepted for inclusion in International Specialty Conference on Cold-Formed Steel Structures by an authorized administrator of Scholars' Mine. This work is protected by U. S. Copyright Law. Unauthorized use including reproduction for redistribution requires the permission of the copyright holder. For more information, please contact [email protected].
Transcript of Studies on Bracing Member End Connections for Cold Formed ...

Missouri University of Science and Technology Missouri University of Science and Technology
Scholars' Mine Scholars' Mine
International Specialty Conference on Cold-Formed Steel Structures
(2012) - 21st International Specialty Conference on Cold-Formed Steel Structures
Aug 24th, 12:00 AM - Aug 25th, 12:00 AM
Studies on Bracing Member End Connections for Cold Formed Studies on Bracing Member End Connections for Cold Formed
Steel Sections Steel Sections
R. P. Rokade
N. Prasad Rao
R. Balagopal
S. J. Mohan
Follow this and additional works at: https://scholarsmine.mst.edu/isccss
Part of the Structural Engineering Commons
Recommended Citation Recommended Citation Rokade, R. P.; Rao, N. Prasad; Balagopal, R.; and Mohan, S. J., "Studies on Bracing Member End Connections for Cold Formed Steel Sections" (2012). International Specialty Conference on Cold-Formed Steel Structures. 5. https://scholarsmine.mst.edu/isccss/21iccfss/21iccfss-session9/5
This Article - Conference proceedings is brought to you for free and open access by Scholars' Mine. It has been accepted for inclusion in International Specialty Conference on Cold-Formed Steel Structures by an authorized administrator of Scholars' Mine. This work is protected by U. S. Copyright Law. Unauthorized use including reproduction for redistribution requires the permission of the copyright holder. For more information, please contact [email protected].

Studies on Bracing Member End Connections for Cold
Formed Steel Sections
R.P. Rokade1, N. Prasad Rao2, R. Balagopal3 and S.J. Mohan4
Abstract
This paper is concentrated mainly on the behaviour of bracing end connections
for cold formed steel lipped angle and lipped channel sections. For bracing
members, only one flange is possible to connect with tower leg member or
supporting member, which causes uneven distribution of stresses in the end
section popularly known as shear lag effect. Tension tests have been carried out to simulate the bracing end connections. Special test rig has been assembled and
end fittings fabricated such that the load will be applied as concentric load at the
pulling end and on the other end load is transferred through the connected flange
only. All the specimens have been instrumented with dial gauges, to study the
deformations and one specimen is instrumented with strain gauges to study the
strain variation. The failure load for tested joints has been calculated by using
various International Standards and compared with the test results.
Keywords: Cold-formed steel, Bracing member, Shear lag, Net section failure
Introduction
The transmission line (TL) towers are the vital elements in the TL system as
they contribute 30-40% towards the total project cost. Mainly TL towers are of
latticed type and conventionally made from hot rolled (HR) angle sections. As
the demand for power is increasing in many folds, due to development in
industrial, services sector, etc., the numbers of power projects are coming up.
The economics of the whole power project as well as TL system is a big
challenge for the engineers. Hence, it is encouraging to use different
configurations, different materials and different support systems for the TL
support structures.
1 Senior Scientist, 2 Principal Scientist, 3 Scientist, 4 Chief Scientist
CSIR – Structural Engineering Research Centre, CSIR Campus, Chennai, India
Twenty-First International Specialty Conference on Cold-Formed Steel Structures St. Louis, Missouri, USA, October 24 & 25, 2012
613

Cold-formed (CF) steel sections can be an alternative for the conventionally
used HR angles with wide variety of sections and other number of advantages,
mainly increased buckling capacity due to stiffening lips, fabrication ease for
making higher strength to weight ratio, etc. Even it is possible to design a hybrid
tower with CF and HR sections. These towers need to be checked thoroughly
with the help of element level as well as system level tests. Element level tests includes member tests, joint tests etc.
An analytical study carried out by Rokade and et. al.[1] shows that there is
increase in buckling capacity for CF bracing members depending upon the shape
and slenderness ratio. However, it is indicated that experimental investigations
are required to establish the joint behaviour. In TL towers the bracing members
are connected to leg members with only one flange. This type of arrangement
introduces an eccentricity in the connection which causes reduction in capacity
due to shear lag as well as local buckling at the connecting part.
Munse and Chesson[2] of University of Illinois were the erstwhile researchers
who have developed an empirical model accounting for the shear lag effect to
calculate the net section efficiency. The empirical equation developed was
based on the test results of 218 tension specimens. The equation has included a factor for the ductility of material, reduction due to punching of holes and effect
of bolt hole spacing on the connection and connection eccentricity. Later in
1993, Easterling and Giroux[3] have reviewed the AISC specification provisions
in context with shear lag effect for welded tension members. Around 27 welded
tension members were loaded to failure and the experimental results have been
compared along with the finite element results for stress patterns in the elastic
region. Based on these studies, series of revisions have been recommended in
AISC provisions.
Kulak and Wu[4] have conducted 24 tests on single and double angle specimens
to study the shear lag effect on bolted angle tension members. The experiments
were supplemented with the numerical studies of various parameters. Based on the studies they proposed two equations to account for the effect of end
connections. Barth and et. al. [5] have performed finite element analysis in order
to study the effects of connection eccentricity and connection length on the
ultimate capacity of bolted tension members. They simulated the experiments of
Kulak and Wu [4] to verify the validity of the finite element modelling procedure
adopted in their studies and found that the failure loads are in close agreement
with the experimental failure load.
Holcomb and et.al.[6] initiated the experiments on the CF angle tension members
at University of Missouri Rolla. They have tested 27 number of equal and
unequal angle specimens for various parameters e.g. connection eccentricity,
connection length and angle thickness. Chi Liang Pan[7] investigated the effect
of shear lag on the CF steel channel sections, by testing fifty four specimens with different cross sectional dimensions. The comparisons were made between
614
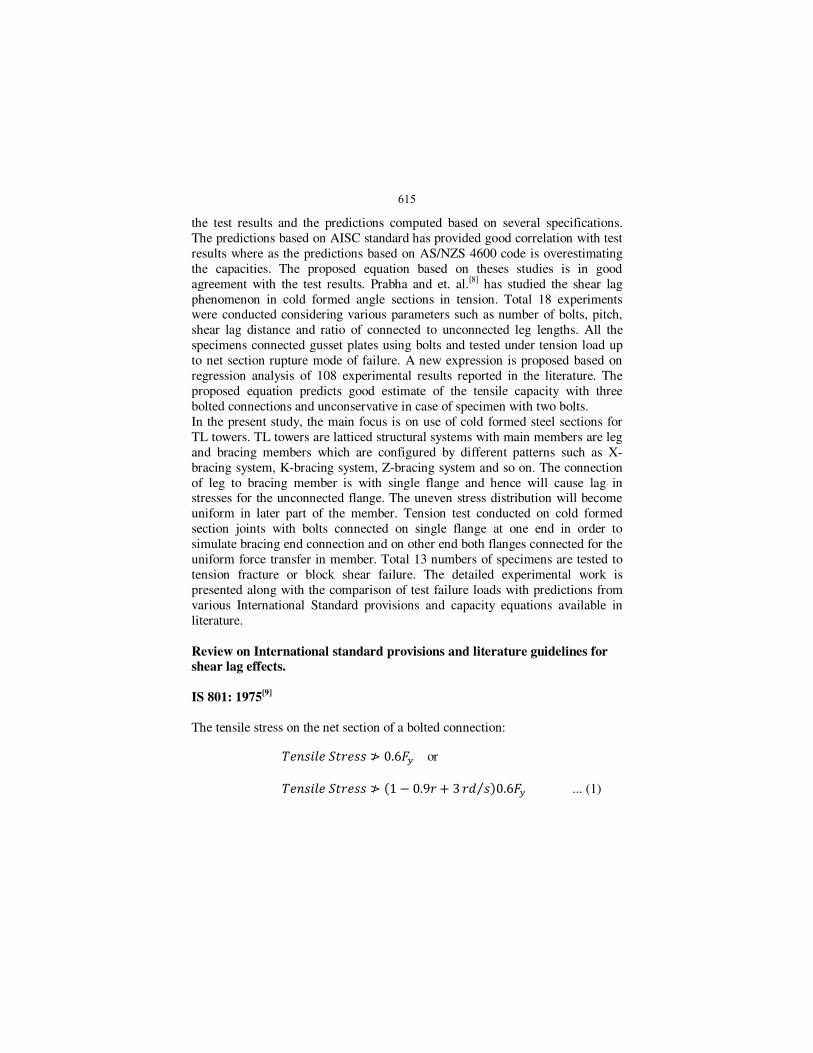
the test results and the predictions computed based on several specifications.
The predictions based on AISC standard has provided good correlation with test
results where as the predictions based on AS/NZS 4600 code is overestimating
the capacities. The proposed equation based on theses studies is in good
agreement with the test results. Prabha and et. al.[8] has studied the shear lag
phenomenon in cold formed angle sections in tension. Total 18 experiments were conducted considering various parameters such as number of bolts, pitch,
shear lag distance and ratio of connected to unconnected leg lengths. All the
specimens connected gusset plates using bolts and tested under tension load up
to net section rupture mode of failure. A new expression is proposed based on
regression analysis of 108 experimental results reported in the literature. The
proposed equation predicts good estimate of the tensile capacity with three
bolted connections and unconservative in case of specimen with two bolts.
In the present study, the main focus is on use of cold formed steel sections for
TL towers. TL towers are latticed structural systems with main members are leg
and bracing members which are configured by different patterns such as X-
bracing system, K-bracing system, Z-bracing system and so on. The connection
of leg to bracing member is with single flange and hence will cause lag in stresses for the unconnected flange. The uneven stress distribution will become
uniform in later part of the member. Tension test conducted on cold formed
section joints with bolts connected on single flange at one end in order to
simulate bracing end connection and on other end both flanges connected for the
uniform force transfer in member. Total 13 numbers of specimens are tested to
tension fracture or block shear failure. The detailed experimental work is
presented along with the comparison of test failure loads with predictions from
various International Standard provisions and capacity equations available in
literature.
Review on International standard provisions and literature guidelines for shear lag effects.
IS 801: 1975[9]
The tensile stress on the net section of a bolted connection:
≯ 0.6 or
≯ 1 0.9 3 ⁄ 0.6 ... (1)
615
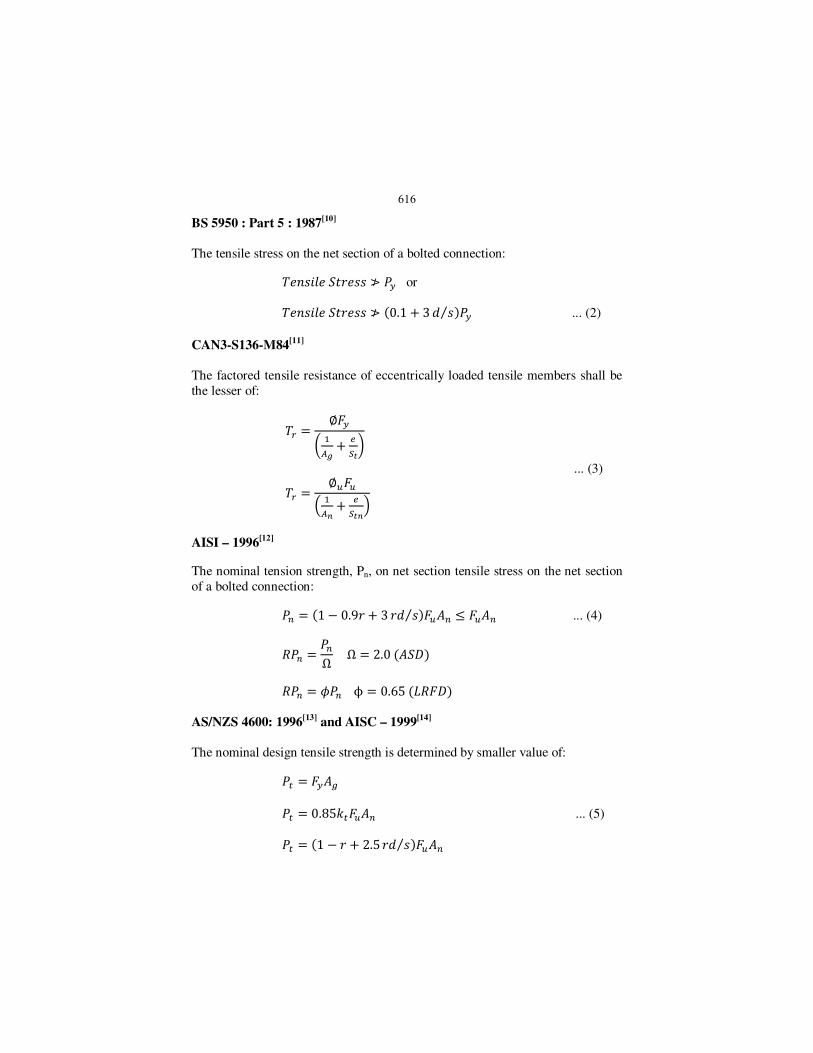
BS 5950 : Part 5 : 1987[10]
The tensile stress on the net section of a bolted connection:
≯ or
≯ 0.1 3 ⁄ ... (2)
CAN3-S136-M84[11]
The factored tensile resistance of eccentrically loaded tensile members shall be
the lesser of:
∅
!
"#$%
... (3)
∅&&' (
"#$()
AISI – 1996[12]
The nominal tension strength, Pn, on net section tensile stress on the net section
of a bolted connection:
* 1 0.9 3 ⁄ &+* , &+* ... (4)
-* *Ω Ω 2.0+0
-* 1*ϕ 0.654-0
AS/NZS 4600: 1996[13]
and AISC – 1999[14]
The nominal design tensile strength is determined by smaller value of:
5 +6
5 0.8585&+* ... (5)
5 1 2.5 ⁄ &+*
616
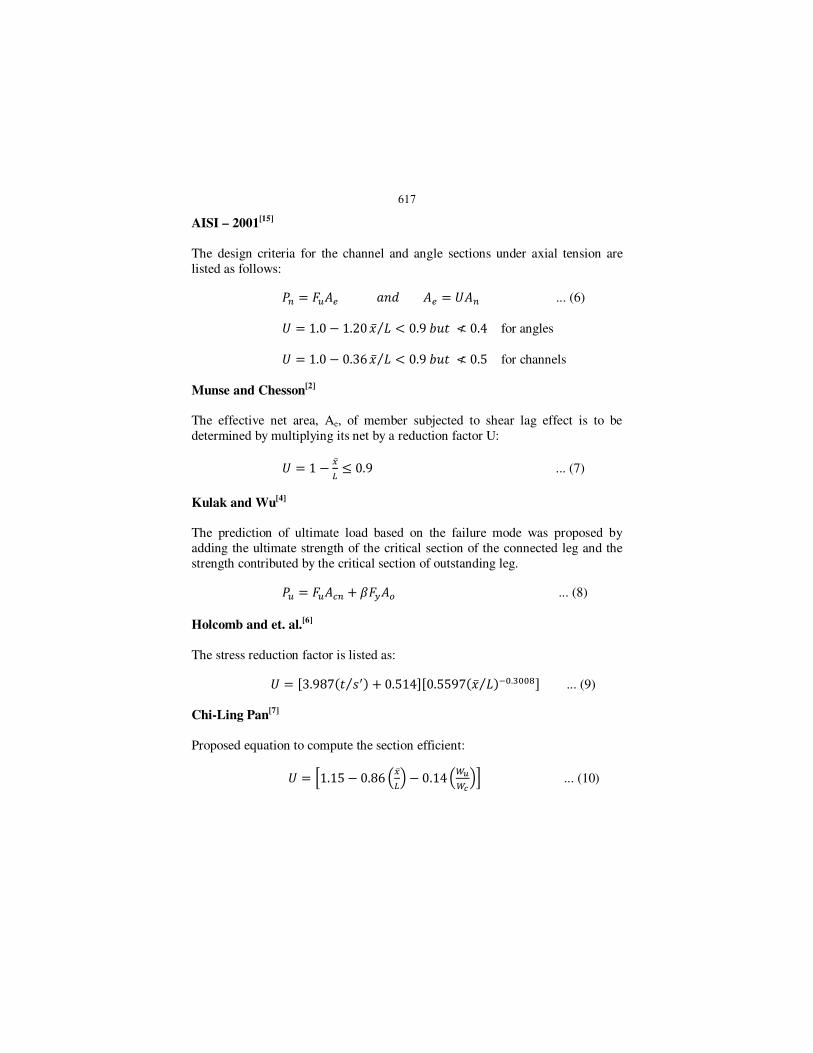
AISI – 2001[15]
The design criteria for the channel and angle sections under axial tension are
listed as follows:
* &+" 9+" :+* ... (6)
: 1.0 1.20 ; 4⁄ = 0.9>? ≮ 0.4 for angles
: 1.0 0.36 ; 4⁄ = 0.9>? ≮ 0.5 for channels
Munse and Chesson[2]
The effective net area, Ae, of member subjected to shear lag effect is to be
determined by multiplying its net by a reduction factor U:
: 1 BC , 0.9 ... (7)
Kulak and Wu[4]
The prediction of ultimate load based on the failure mode was proposed by
adding the ultimate strength of the critical section of the connected leg and the
strength contributed by the critical section of outstanding leg.
& &+D* E+F ... (8)
Holcomb and et. al.[6]
The stress reduction factor is listed as:
: G3.987 I⁄ 0.514JG0.5597; 4⁄ KL.MLLNJ ... (9)
Chi-Ling Pan[7]
Proposed equation to compute the section efficient:
: O1.15 0.86 'BC) 0.14'PQPR)S ... (10)
617
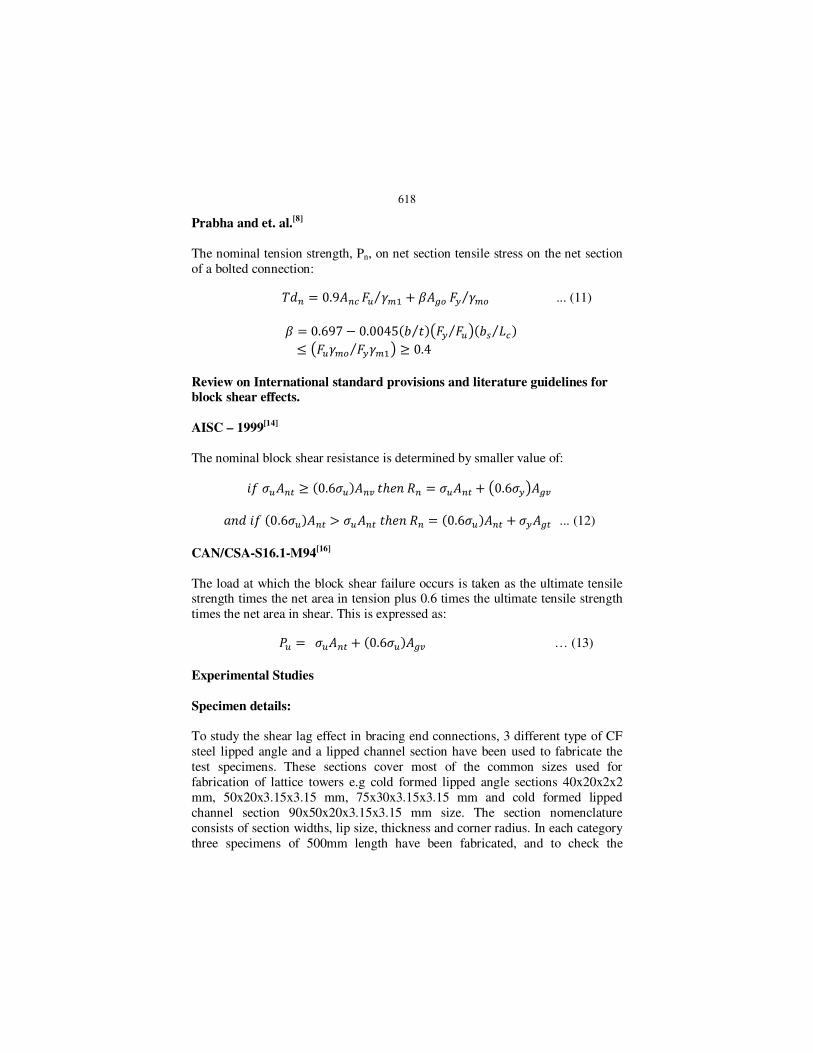
Prabha and et. al.[8]
The nominal tension strength, Pn, on net section tensile stress on the net section
of a bolted connection:
* 0.9+*D & TU⁄ E+6F TUF⁄ ... (11)
E 0.697 0.0045> ⁄ V &⁄ W>X 4D⁄ , V&TUF TU⁄ W Y 0.4
Review on International standard provisions and literature guidelines for block shear effects.
AISC – 1999[14]
The nominal block shear resistance is determined by smaller value of:
Z[&+*5 Y 0.6[&+*\]-* [&+*5 V0.6[W+6\
9Z0.6[&+*5 ^ [&+*5 ]-* 0.6[&+*5 [+65... (12)
CAN/CSA-S16.1-M94[16]
The load at which the block shear failure occurs is taken as the ultimate tensile strength times the net area in tension plus 0.6 times the ultimate tensile strength
times the net area in shear. This is expressed as:
& [&+*5 0.6[&+6\ … (13)
Experimental Studies
Specimen details:
To study the shear lag effect in bracing end connections, 3 different type of CF
steel lipped angle and a lipped channel section have been used to fabricate the
test specimens. These sections cover most of the common sizes used for
fabrication of lattice towers e.g cold formed lipped angle sections 40x20x2x2
mm, 50x20x3.15x3.15 mm, 75x30x3.15x3.15 mm and cold formed lipped
channel section 90x50x20x3.15x3.15 mm size. The section nomenclature
consists of section widths, lip size, thickness and corner radius. In each category
three specimens of 500mm length have been fabricated, and to check the
618

specimen length effect, one specimen of 1000mm length has been fabricated for
lipped angle section 40x20x2x2 mm size. All the specimens provided with bolts
on one flange at one end to simulate the leg and bracing single flange connection
where as on other end both the flanges connected to apply a uniform loading on
the test specimen. Depending on the flange widths 5.6 grade 12 mm diameter
bolts were provided for angles with 40 and 50 mm size and 8.8 grade 16 mm diameter bolts were provided for angles with 75 mm size and for channel
section. The specimens fabricated with 2.5d pitch and end distances and
minimum two numbers of bolts were provided in the direction of load. A total
13 number of specimens tested to the tension rupture failure. Prior to the testing,
material properties studied by means of tension coupon tests as per ASTM
standards. The Stress-strain behaviour of tension coupons are shown in Fig. 1. It
is observed that the average yield and ultimate stresses are 349 and 462 MPa
whereas the modulus of elasticity is 2.035x10⁵ MPa and average elongation is
21.6%.
Fig. 1 Stress-Strain behavior of coupons cut from the steel used in studies
Test Set-up
Fig. 2 shows the test assembly and photographic view of special test rig. The test
rig is assembled from prefabricated heavy steel beams along with end plates of
adequate thickness have been provided at both the ends. On one end high
strength anchor rod with lock nut and special assembly is provided to simulate
single flange and gusset connection and on other end special assembly to
0
50
100
150
200
250
300
350
400
450
500
0 0.05 0.1 0.15
Str
ess
(N/m
m²)
Strain(µ)
Specimen1
Specimen2
Specimen3
619

connect both the flanges provided along with the anchor rod and a hydraulic
stressing jack. A 100 kN cell is provided to measure the load application during
the test and specimens are instrumented with dial and strain gauges to monitor
the displacement and strain variations. The load is applied concentrically at one
end with the help of hydraulic jack in the increments of 5kN up to 50% of the
tension capacity of the section and repeated in 2 to 3 cycles; finally the section is loaded till failure.
Fig. 2 Test Assembly, Test Set-up and Loading Arrangement
As the test set up was aligned in horizontal direction, during testing, the
specimen and end fixtures are maintained in horizontal plane. On application of
test load, the bolts for bracing end or single flange connection are first bent/
tilted then ovalization of bolt hole is observed. During testing the connected
flange is bent towards the unconnected flange, an overall rotation of joint at
bracing end is observed. This is similar to the behaviour of bracing connections
with leg members in latticed panels or towers. All the sections are initially failed
in net section rupture as shown in Fig. 3a and 3c photographs, further
application of small increments of sustained load, higher rotations or tilting of
bolts are observed. This has caused rupture of specimen in loading direction on bolt line and looking like a block shear failure. But this type of failure cannot be
620

termed as block shear, as it is caused by rotation of joint and not by brittle
failure by sudden rupture of section in shear path. This phenomenon is very well
observed in Fig. 3b and 3d, the first specimen has shown failure by tilting of
bolts only, the second specimen a net section rupture is observed and the third
specimen shows failure which looks like block shear failure but it is due to
sustained loading and higher rotation/ tilting of bolts. During testing deformations are measured at the centre of specimen using digital dial gauge, for
each load step and curves are plotted for all specimens as indicated in Fig. 4 to
7. To check the strain behaviour strain gauges are pasted for one type of
specimens and load Vs strain curves are plotted as indicated in Fig. 8.
a) CF Lipped Angle 40x20x2 b) CF Lipped Angle 50x20x3.15
c) CF Lipped Angle 75x30x3.15 d) CF Lipped Channel 90x50x20x3.15
Fig. 3 Tested Specimens for Bracing End Connections
Results and Discussions
The load versus deformation curves are plotted for all the specimens and are shown in Fig. 4 to 7. The test elongation of specimen is plotted on horizontal
axis and the vertical axis gives corresponding tension test load on joint. The
621

entire range of specimen exhibits ductile behaviour with tri-linear curves. The
joint slip is observed in the range of 12-15% of test load, then a sharp rise in
load is observed compared to the joint deformation, the same has continued up
to 75-80% of test load, then the curves exhibited mild slopes as the deformations
are quite high for small increments of test loads. The non-linear portions of the
curves are truncated in the Figs. 4 to 7. The highest test load of 96.7 kN is observed for CF lipped angle section 75x30x3.15x3.15 mm size and the
maximum elongation of 12.77 mm is observed for CF lipped angle section
40x20x2x2 mm size. For CF lipped channel section the test load observed as
90.0 kN with an elongation of 11.40 mm. The CF lipped channel section
deformation characteristics are observed similar to lipped angle sections. There
were no signs of deformations observed for connecting fixtures during and after
test.
The variation of strain for cold-formed lipped angle section 50x20x3.15x3.15
mm size is shown in Fig. 8, the position of strain gauges are also indicated in
Fig. 4 Joint Displacement Curve for CF Lipped Angle 40x20x2x2
Fig. 5 Joint Displacement Curve for CF Lipped Angle 50x20x3.15x3.15
0
10
20
30
40
0 2 4 6 8 10 12 14
Load
(k
N)
Displacment (mm)
Specimen 1Specimen 2Specimen 3
0
10
20
30
40
50
60
70
0 2 4 6 8 10
Load
(kN
)
Displacment (mm)
Specimen 1Specimen 2Specimen 3
622

Fig.6 Joint Displacement Curve for CF Lipped Angle 75x30x3.15
Fig. 7 Joint Displacement Curve for CF Lipped Channel 90x50x20x3.15
Fig. 8 Strain Behaviour for CF Lipped Angle 50x20x3.15X3.15 Joint
0
20
40
60
80
100
0 2 4 6 8 10 12
Load
(kN
)
Displacment (mm)
Specimen 1Specimen 2Specimen 3
0102030405060708090
100
0 2 4 6 8 10 12
Load
(k
N)
Displacment (mm)
Specimen 1
Specimen 2
0
20
40
60
0 500 1000 1500 2000 2500
Load
(kN
)
Strain (µ)
Gauge 1Gauge 2Gauge 3Gauge 4
SG2 SG4 SG3
SG1
623

same figure. At bracing end the strain in unconnected leg is observed small as
compared to the connected leg which shows the shear lag effect. Reducing
strains observed at the failure stage, this is due to excessive rotation of joint
under sustained load of small increments.
The test ultimate loads of the specimens along with the predicted net section and
block shear capacities for various International Standards and Literatures (Equation 1 to 13) are given in Table – 1. The test result comparison with
predicted capacities shows that the test capacities are less than the capacities
calculated for various codes except for IS: 801 -1975 and AISI-1996 which is
very close to the test capacities for angle section. The prediction calculated
using equation proposed by Chi-Ling Pan[7] and Holcomb and et. al.[6] are
comparable with test results. In all the specimens it has been noticed that during
failure the bolts are tilting/ bending and thereafter a net section rupture is
observed. Some of the sections exhibited block shear like failure under the
sustained loading after the net section rupture.
Conclusions
The behaviour of bracing end connection simulated experimentally for 13
numbers of specimens fabricated from CF lipped angle and CF lipped channel
sections. The bolts for single flange connection at bracing ends observed tilting
as the test load increased. Further increase has caused ovalization of bolt hole
and yielding in the last bolt hole location and finally a net section rupture is
observed. If the load is applied continuously after net section rupture, it causes
failure similar to block shear which can be avoided by increasing the bolt pitch.
The strains are smaller in unconnected leg compared to the connected leg which clearly indicates the shear lag effect. The comparisons of test results with
predicted capacities as per International Standards and literatures shows the net
section capacity predictions as per IS: 801-1975 and AISI-1996 are almost equal
to the test results for angle sections and the prediction using Chi-Ling pan [7] and
Holcomb and et. al.[6] equations are comparable with the test results for angle
and channel sections. It is felt; further studies are required for shear lag effect by
considering various other parameters e.g. connection length, b/t ratio, fy/fu ratio,
number of bolts in line and multiple bolt lines etc.
Acknowledgement
The authors acknowledge the constant support and encouragement given by
Dr. Nagesh R. Iyer, Director and Dr. S. Arunachalam, Advisor (M), CSIR-
Structural Engineering Research Centre, Chennai and thank them for their
permission to publish this paper.
624
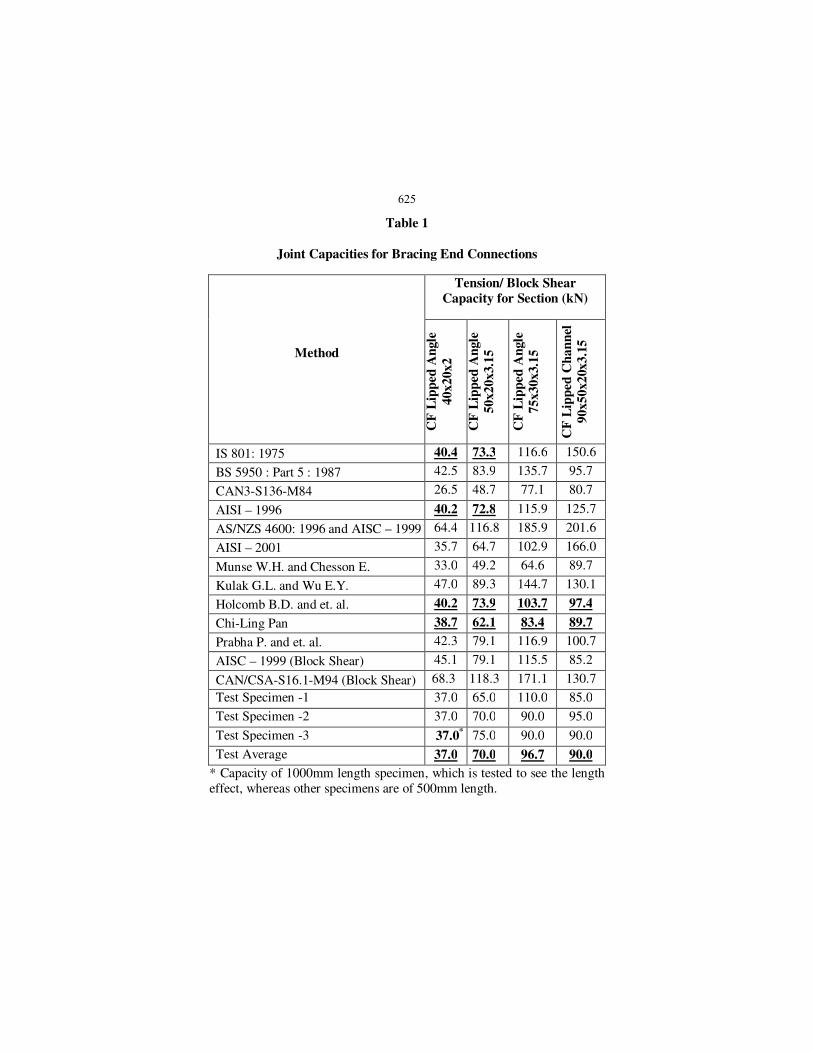
Table 1
Joint Capacities for Bracing End Connections
Method
Tension/ Block Shear
Capacity for Section (kN)
CF
Lip
ped
An
gle
40
x2
0x2
CF
Lip
ped
An
gle
50
x2
0x
3.1
5
CF
Lip
ped
An
gle
75
x3
0x
3.1
5
CF
Lip
ped
Ch
an
nel
90
x5
0x
20x3.1
5
IS 801: 1975 40.4 73.3 116.6 150.6
BS 5950 : Part 5 : 1987 42.5 83.9 135.7 95.7
CAN3-S136-M84 26.5 48.7 77.1 80.7
AISI – 1996 40.2 72.8 115.9 125.7
AS/NZS 4600: 1996 and AISC – 1999 64.4 116.8 185.9 201.6
AISI – 2001 35.7 64.7 102.9 166.0
Munse W.H. and Chesson E. 33.0 49.2 64.6 89.7
Kulak G.L. and Wu E.Y. 47.0 89.3 144.7 130.1
Holcomb B.D. and et. al. 40.2 73.9 103.7 97.4
Chi-Ling Pan 38.7 62.1 83.4 89.7
Prabha P. and et. al. 42.3 79.1 116.9 100.7
AISC – 1999 (Block Shear) 45.1 79.1 115.5 85.2
CAN/CSA-S16.1-M94 (Block Shear) 68.3 118.3 171.1 130.7
Test Specimen -1 37.0 65.0 110.0 85.0
Test Specimen -2 37.0 70.0 90.0 95.0
Test Specimen -3 37.0* 75.0 90.0 90.0
Test Average 37.0 70.0 96.7 90.0
* Capacity of 1000mm length specimen, which is tested to see the length
effect, whereas other specimens are of 500mm length.
625
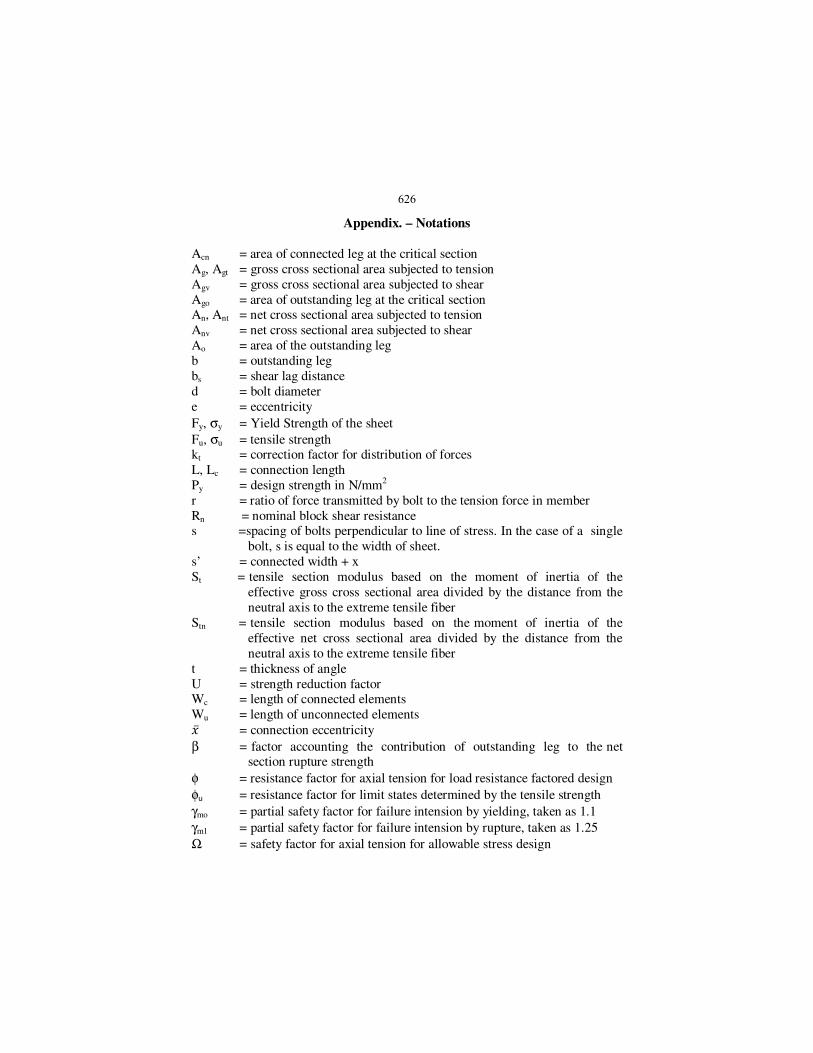
Appendix. – Notations
Acn = area of connected leg at the critical section
Ag, Agt = gross cross sectional area subjected to tension
Agv = gross cross sectional area subjected to shear
Ago = area of outstanding leg at the critical section An, Ant = net cross sectional area subjected to tension
Anv = net cross sectional area subjected to shear
Ao = area of the outstanding leg
b = outstanding leg
bs = shear lag distance
d = bolt diameter
e = eccentricity
Fy, σy = Yield Strength of the sheet
Fu, σu = tensile strength kt = correction factor for distribution of forces
L, Lc = connection length
Py = design strength in N/mm2
r = ratio of force transmitted by bolt to the tension force in member
Rn = nominal block shear resistance s =spacing of bolts perpendicular to line of stress. In the case of a single
bolt, s is equal to the width of sheet.
s’ = connected width + x
St = tensile section modulus based on the moment of inertia of the
effective gross cross sectional area divided by the distance from the
neutral axis to the extreme tensile fiber
Stn = tensile section modulus based on the moment of inertia of the
effective net cross sectional area divided by the distance from the
neutral axis to the extreme tensile fiber
t = thickness of angle
U = strength reduction factor Wc = length of connected elements
Wu = length of unconnected elements
; = connection eccentricity
β = factor accounting the contribution of outstanding leg to the net section rupture strength
φ = resistance factor for axial tension for load resistance factored design
φu = resistance factor for limit states determined by the tensile strength
γmo = partial safety factor for failure intension by yielding, taken as 1.1
γm1 = partial safety factor for failure intension by rupture, taken as 1.25
Ω = safety factor for axial tension for allowable stress design
626

Appendix. – References
1. Rokade R.P. and et. al., “Study on use of cold-formed sections in place of hot
rolled angles for bracing members in transmission line towers”, Proceedings
of Structural Engineering Convention – 2003, IIT Kharagpur, pp. 96-107
2. Munse W.H. and Jesson E., “Riveted and bolted joints: net section design”, Journal of the Structure Division, Proceedings of the ASCE 1963, 89(ST 1),
pp. 107-126
3. W. Samuel Easterling and Lisa Gonzalez Giroux, “Shear lag effects in steel
tension members”, Engineering Journal, American Institute of Steel
Construction, Third Quarter, 1993, pp. 77-89
4. Kulak G.L. and Wu E.Y., “Shear lag in bolted angle tension members”,
Journal of Structural Engineering, September 1997, pp. 1144-1152
5. K.E. Barth, J.G. Orbison, R. Nukla, “Behaviour of steel tension member
subjected to uniaxial loading”, Journal of Constructional Steel Research, Vol.
58, 2002, pp. 1103 -1120
6. Holcomb B.D. and et. al., “Tensile and bearing capacities of bolted
connections”, Second summary report, Civil engineering study 95-1, University of Missouri-Rolla, 1995
7. Chi-Ling Pan, “Prediction of the Strength of Bolted Cold-Formed Channel
Sections in Tension”, Thin-Walled Structures, Vol. 42, 2004, pp. 1177-1198
8. Prabha P. and et. al., “Prediction of Tensile Capacity of Cold-Formed Angles
Experiencing Shear Lag”, Thin-Walled Structures, Vol. 49, 2011, pp. 1348-
1358
9. IS: 801 – 1975, “Code of practice for use of cold-formed light gauge steel
structural members in general building construction”, Bureau of Indian
Standards, New Delhi
10. BS 5950: Part 5: 1987, “Structural use of steel work in building, Part 5. code
of practice of cold-formed sections”, British Standards Institution 11. CAN3-S136-M84, “Cold formed steel structural members”, National
Standards of Canada, Ontario
12. AISI-1996, “Cold-Formed Steel Design Manual”, 1996 Ed., American Iron
and Steel Institute (AISI) Specification, Washington DC, 1996
13. AS/NZS-4600:1996, “Cold formed steel structures”, Australian Standards,
Australia, 1996
14. AISC-1999, “Load and resistance factor design specification for structural
steel buildings”, American Institute of Steel Construction (AISC), Chicago,
IL, 1999
15. AISI-2001, “Cold-Formed Steel Design Manual”, 2001 Ed., American Iron
and Steel Institute (AISI) Specification, Washington DC, 2001
16. CAN/CSA-S16.1-M94, “Limit State Design of Steel Structures”, Canadian Standards Association, Ontario, 1994
627


![Analysis of Large Bracing Connections Designs for Heavy Construction[1]](https://static.fdocuments.us/doc/165x107/551581fe497959161e8b4c9f/analysis-of-large-bracing-connections-designs-for-heavy-construction1.jpg)