Studies of the Energy Resolution of the ANITA Experiment Amy Connolly University of California, Los...
19
Studies of the Energy Studies of the Energy Resolution of the ANITA Resolution of the ANITA Experiment Experiment Amy Connolly University of California, Los Angeles CALOR06 June 6 th , 2006
-
Upload
william-oliver -
Category
Documents
-
view
215 -
download
1
Transcript of Studies of the Energy Resolution of the ANITA Experiment Amy Connolly University of California, Los...
Studies of the Energy Resolution of Studies of the Energy Resolution of the ANITA Experimentthe ANITA Experiment
Amy Connolly
University of California, Los Angeles
CALOR06June 6th, 2006

MotivationMotivation• Greisen-Zatsepin-Kuzmin (GZK): Cosmic ray protons
>1019.5 eV will be slowed by CMB photons:
• Protons should lose their energy within ~50 Mpc• Nuclei, gamma rays travel even shorter distances• Since
– No known “local” sources
– Galactic magnetic fields not sufficient to contain (accelerate) them
• We should see a cutoff in cosmic ray protons at ~1019.5 eV• But we should see neutrinos from the GZK process
They are an important part of the UHECR puzzleNeutrinos are expected with or without a cutoff

Motivation (cont):Motivation (cont):Only useful messengers >100 TeV: Only useful messengers >100 TeV: ’s’s
• Photons lost above 30 TeV: pair production on IR & wave background
• Protons & Nuclei: scattered by B-fields or
GZK process at all energies
• But the sources extend to 1020-21 eV
Every new energy band yields major discoveries
scale size of Local Group
domain of neutrinodominance
IR,CMB,URB ! e+ + e-
Neutrinos travel cosmological distances and they point back!

Idea by Gurgen Askaryan (1962)Idea by Gurgen Askaryan (1962)
lead
UHE particle
Macroscopic size: RMoliere ≈ 10 cm, L ~ meters
Bremsstrahlung: e- → e-
Pair Production: → e+e-
→ EM Shower
• A 20% charge asymmetry develops: – Compton scattering: + e-(at rest) + e-
– Positron annihilation: e+ + e-(at rest) + • Excess moving with v > c/n in matter
→ Cherenkov Radiation dP d• If >> L → COHERENT EMISSION P ~ N2
• > L → RADIO/MICROWAVE EMISSION
~
This effect was confirmed experimentally at SLAC in 2002

Long Attenuation Lengths in Long Attenuation Lengths in Radio in Ice, Salt, SandRadio in Ice, Salt, Sand
South Pole Ice
1 km
Hockley Mine near Houston, TX
The GLUE experiment sought UHE neutrinos by observing the moon’s regolith.

ANITA ANITA (ANtarctic Impulsive Transient Antenna)(ANtarctic Impulsive Transient Antenna)
Each flight ~15 days –
or more
32 quad-ridged horn antennas, dual-polarization, with 10± cant
Downgoing - not seen by payloadUpcoming – absorbed in the earth
! ANITA sees “skimmers”.

The ANITA Collaboration
University of California at IrvineOhio State UniversityUniversity of Kansas
Washington University in St. LouisUniversity of MinnesotaUniversity of Delaware
University of California at Los AngelesPennsylvania State UniversityUniversity of Hawaii at Manoa
Jet Propulsion Laboratory
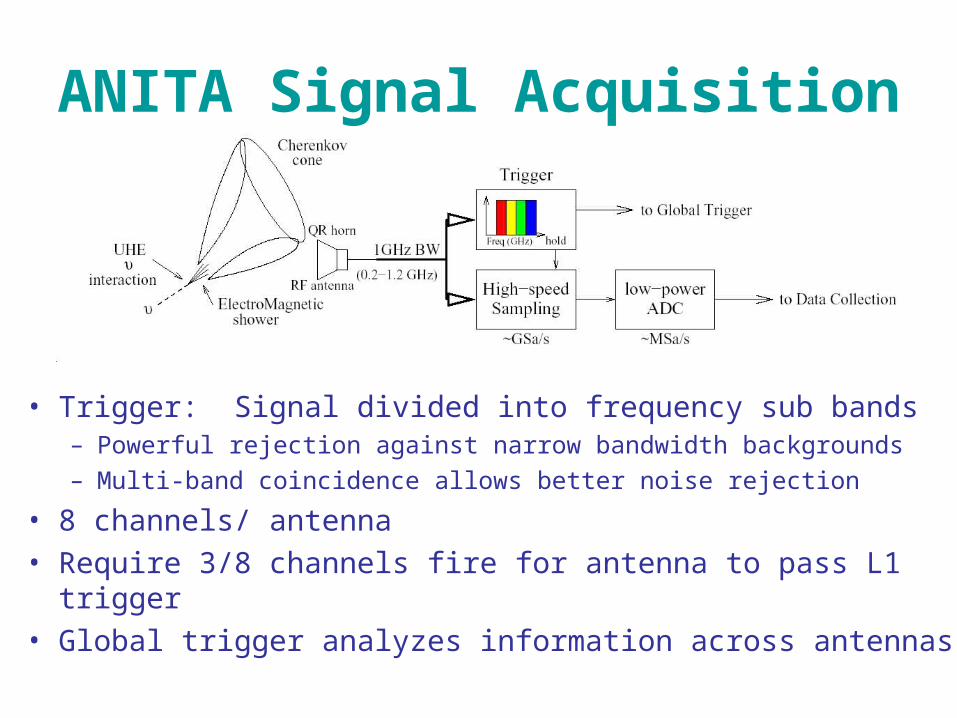
ANITA Signal Acquisition
• Trigger: Signal divided into frequency sub bands – Powerful rejection against narrow bandwidth backgrounds– Multi-band coincidence allows better noise rejection
• 8 channels/ antenna• Require 3/8 channels fire for antenna to pass L1 trigger• Global trigger analyzes information across antennas

• Still, if ANITA sees a handful of events, what can we say about the neutrino energies?
• Two complementary methods to quantify neutrino spectrum– Direct Method: Estimate energy of the shower for each event– Likelihood Method: Use likelihood method to determine if
events are consistent with E-1, E-2, E-3 spectra
• I will discuss the primary limitations of the Direct Method, then focus on the Likelihood method
Energy Measurements with ANITA ANITA designed as a discovery experiment
for ultra-high energy neutrinos, not a precision experiment
Typical models for spectra from the GZK process similar to E-2

Factors that Impact the Signal Strength
1
23 4 5
1 - Electric Field of Askaryan pulse at interaction2 – Angle with respect to Cherenkov angle viewed by balloon3 – Fresnel coefficients at ice-air interface4 – Distance from interaction to surface, to balloon5 – Voltage read by antennas for the incident electric field

ANITA SimulationANITA Simulation• Two major simulation efforts: Hawaii (Gorham) and
UCLA (Connolly)• Signal in frequency domain, but moving to
time domain• Secondary interactions included• Ray tracing through ice, firn (packed
snow near surface)• Attenuation lengths are depth and frequency dependent• Fresnel coefficients• Include surface slope and adding surface roughness• All 32 quad ridged horn antennas
arranged in 3 layers as they are on the payload
• Measured antenna response• Models 3-level trigger system• Weighting accounts for neutrino attenuation through
Earth
ice
[S. Barwick]
Complementary simulations being developed – essential!

Mean = 0.2RMS = 0.25
Mean = 0.4RMS = 0.3
All neutrinos Detected neutrinos (from simulation)
Primary Limitation on Direct Energy Measurement: Inelasticity
• Only possible to observe shower energy• Energy resolution E strongly limited by width of
inelasticity distribution: y=Ehad/E
Contribution to E due to inelasticity ¼ 100% E
Including other uncertainties, E ~ 2-3 E

Likelihood Method• Studying the feasibility of using likelihood
method to distinguish between spectra
• Consider observables that correlate with the neutrino (really shower) energy
• Construct likelihoods L(i) for each distribution E-
– For each event, maximize L(i) to find most likely i
– For an ANITA experiment with, say, 5 events observed, can we distinguish between E-1, E-2, E-3 etc.? Requires independently measured variables

Three Independent Quantities• Magnitude of measured
signal– Measured voltage
shower energy
–Signals from higher energy showers can survive a longer trip through air
–Can originate from zenith angles closer to horizontal
– ~ 0.5 ±
• Zenith angle of measured signal

Three Independent quantities (cont)• Frequency dependence of measured signal
– Higher frequencies ! narrower Cherenkov cone
–Signals from higher energy showers can be observed despite the dropoff at higher frequencies
C=57±
65±
75±

• For a given event, find most likely by maximizing:
where j represents each
independent variable
Likelihood
E-1 E-2
E-3
For a given input distribution:
-1 -2 -3Distribution of most likely ’s
=
E-1 input distribution clearly separated from E-2, E-3

Pseudoexperiments
• Examples of distributions measured from hypothetical ANITA experiments
– For 5 events expected
– Showing one pseudoexperiment for each hypothetical true input distribution
E-1
E-2
E-3

ANITA Calibration at Stanford Linear Accelerator
• ANITA is going to SLAC for 2 weeks of beam time in End Station A during June 2006
– Full-up system calibration with actual Askaryan impulses from Ice
– Uses one of SLAC’s largest experiment halls (End Station A) 250’x200’ w/ 50’ crane
– Build 1.6 x 1.6 x 5 m ice cube by stacking blocks, “zamboni” each surface before stacking, refrigerate
• Will provide amplitude, phase, polarization, temporal, and spectral calibration of the antenna array, including all structure
• Excellent opportunity to calibrate the simulation, including aspects of energy resolution
• Payload will be shipped to Antarctica from CA after the SLAC test

• ANITA designed as a discovery experiment, not a precision experiment:
• ANITA’s energy resolution by direct method ~ E = 2-3 E
• From likelihood method, E-1 likely discernable from E-2, E-3 – Could identify a diversion from a basic GZK neutrino
spectrum– Related variables which may be more powerful are
under investigation
Summary
Embedded detectors such as a proposed experiment in a salt formation (SalSA) will perform with improved energy resolution with the ability to reconstruct the cone.