Students’ Overreliance on Linearity in Economic Thinking ... · PDF fileStudents’...
32
Students’ Overreliance on Linearity in Economic Thinking: An Exploratory Study at the Tertiary Level Dirk De Bock Daam Van Reeth Janne Minne Wim Van Dooren HUB RESEARCH PAPERS 2013/01 ECONOMICS & MANAGEMENT FEBRUARI 2013
Transcript of Students’ Overreliance on Linearity in Economic Thinking ... · PDF fileStudents’...

Students’ Overreliance on Linearity in Economic
Thinking: An Exploratory Study at the Tertiary Level
Dirk De Bock Daam Van Reeth
Janne Minne Wim Van Dooren
HUB RESEARCH PAPERS 2013/01
ECONOMICS & MANAGEMENT
FEBRUARI 2013

Students’ Overreliance on Linearity in Economic Thinking:
An Exploratory Study at the Tertiary Level
Dirk De Bock, Daam Van Reeth, Janne Minne, and Wim Van Dooren
Dirk De Bock, corresponding author ([email protected]), is professor at the Faculty
of Economics and Business of the Hogeschool-Universiteit Brussel and at the Faculty of
Psychology and Educational Sciences of the University of Leuven. Daam Van Reeth
([email protected]) is associate professor at the Faculty of Economics and
Business of the Hogeschool-Universiteit Brussel. Janne Minne ([email protected]) is
junior consultant auditor at Vandelanotte Corporate Finance Services. Wim Van Dooren
([email protected]) is associate professor at the Faculty of Psychology and
Educational Sciences of the University of Leuven.
Address for correspondence:
Dirk De Bock, Faculty of Economics and Management, Hogeschool-Universiteit Brussel,
Stormstraat 2, B-1000 Brussels, Belgium, Phone +3216604250, fax +3216604554.
2
Abstract
In mathematics education, a vast amount of research has shown that students rely strongly on
linearity, even in situations that are not linear at all. Furthermore, in economic education
several researchers acknowledge this phenomenon but within this field it has never been
studied empirically in a systematic way. This paper is a first attempt to fill this gap in the
research literature. First, we provide an overview of instances of, and comments on, people’s
overreliance on linearity in the economic (education) literature. Secondly, we present an
empirical study with business economics students who were confronted with correct and
incorrect linear statements about micro- and macroeconomic situations. Our results show that
even tertiary level students over-rely on linearity when analyzing such statements. We also
find that this phenomenon is affected by the economic domain and by the way statements are
formulated.
JEL-codes: A20, A22
Key words: learning macroeconomics, learning microeconomics, non-linearity, overreliance
on linearity, undergraduate students
3
Linear functions are a powerful tool for grasping real-life situations, even if these situations
are only approximately linear. For that reason, one major goal of mathematics education at all
levels and for all students is to obtain both procedural and conceptual understanding of
linearity in its various forms and applications. However, the educational attention that is paid
to linearity on numerous occasions in students’ school careers, along with the intrinsic
simplicity and intuitive nature of the linear model, has a serious drawback. It may lead to a
persistent tendency in some students and adults to see and apply linearity everywhere, even in
situations that are not linear at all. A famous historical example can be found in Plato’s
dialogue Meno where Meno’s pupil-slave, when asked by Socrates to double the area of a
given square, spontaneously doubles the sides of that square.
Over the last two decades the tendency to over-rely on linearity has been
systematically studied with students when solving mathematical problems (for an overview of
this research, see Van Dooren, De Bock, Janssens, and Verschaffel 2008; Van Dooren and
Greer 2010). For example, Cramer, Post, and Currier 1993 confronted 33 pre-service
elementary school teachers with the following problem “Sue and Julie were running equally
fast around a track. Sue started first. When she had run 9 laps, Julie had run 3 laps. When
Julie completed 15 laps, how many laps had Sue run?” Thirty-two student teachers solved
this problem by setting up and solving a proportion: 9/3 = x/15; 3x =135; x = 45 instead of
using the additive structure in the problem (i.e., Sue always has run six rounds more than
Julie). Another example was documented by Van Dooren, De Bock, Depaepe, Janssens, and
Verschaffel 2003: many upper secondary school students respond proportionally (2 × 1/6 =
2/6) to a probabilistic problem such as “The probability of getting a six in one roll with a die
is 1/6. What is the probability of getting at least one six in two rolls?” – an erroneous
reasoning process that can be easily unmasked because, following this reasoning, the
probability of getting a six would become larger than 1 after more than six die rollsi.

4
Students’ overreliance on linear models has already been studied extensively in a variety of
mathematical domains (e.g., elementary arithmetic, algebra, (pre)calculus, probability, and
geometry) and at different educational levels, from primary school pupils (Van Dooren, De
Bock, Hessels, Janssens, and Verschaffel 2005) to university students (Esteley, Villarreal, and
Alagia 2010). Recently, it was shown that students in science education also sometimes use
linear reasoning as a default strategy, even after instructions on the relevant scientific contents
(De Bock, Van Dooren, and Verschaffel 2011).
The economic (education) literature too contains some illustrations of students’
overreliance on linearity, but this domain has not yet been empirically analysed in a
systematic way. The present article contributes to filling this gap in the literature. The article
consists of two main parts. In the first part, we provide the results of a systematic literature
search concerning people’s overreliance on linearity as discussed in the economic (education)
literature. In the second and central part, we present an empirical study of this phenomenon
carried out by business economics students who were confronted by correct and incorrect
linear statements about micro- and macroeconomic situations. However, to give the reader
some background to our methodological approach, we start with a brief overview of some
relevant results of research into students’ overreliance on linearity in mathematics, more
particularly in the field of geometry (for more details, we refer to De Bock, Van Dooren,
Janssens, and Verschaffel 2007).
The most extensively researched case in geometry relates to students’ overreliance on
linearity in problems about the effect of an enlargement or reduction of a plane figure or solid
on its area and/or volume. The previously mentioned historical example of the duplication of
a square in Plato’s Meno is an illustration of that case. While an enlargement or reduction of
any geometrical figure by a linear factor k, multiplies lengths by k, areas by k2, and volumes
by k3, pupils strongly tend to see the relations between length and area or between length and
5
volume as linear and thus apply the factor k to determine enlarged or reduced areas and
volumes. De Bock, Verschaffel, and Janssens 1998 and De Bock, Verschaffel, and Janssens
2002 provided 12 to 16-year old students with linear and non-linear problems about the
lengths, perimeters, areas, and volumes of different types of figures. An example of a non-
linear problem is: “Farmer Carl needs 8 hours to fertilize a square pasture with each side of
200 meters. Approximately how many hours would he need to fertilize a square pasture with
each side of 600 meters?” More than 90% of the 12-year olds and more than 80% of the 16-
year olds gave a proportional answer (here: “24 hours”) to this type of non-linear problem.
Even with considerable support (e.g., the request to make a drawing or the provision of a
ready-made drawing on plain or squared paper), very few students made the shift to correct
non-linear responses (in the given example: “72 hours”). The only experimental manipulation
that had significant impact was changing the problem formulation from a missing-value
format (in which three numbers are given, and the problem solver is asked to determine a
fourth unknown number) into a so-called comparison format (in which only one number, in
this case a linear scale factor, is given). The comparison version of the above-mentioned item
was: “Today, farmer Carl fertilized a square pasture. Tomorrow, he has to fertilize a square
pasture with each side being three times as big. Approximately how much more time would he
need to fertilize this pasture?”). This transformation led to an increase in the number of
correct responses from 23% for the missing-value problems to 41% for the comparison
problems.
A subsequent interview study (De Bock, Van Dooren, Janssens, and Verschaffel 2002)
pointed at three often interrelated underlying causes. The first is that students selected and used a
linear method in an intuitive way (in the sense of Fischbein 1987). Students opted immediately for
a linear answer, were strongly convinced about its correctness, but found it very difficult to justify
their choice. A second cause is particular deficiencies in students’ geometrical knowledge (e.g.,
6
the misconception that the notion of area only applies to regular figures, or that a similarly
enlarged figure is not necessarily enlarged to the same extent in all dimensions), which often
prohibited them from discovering the incorrectness of their linear errors. A third cause lies in
students’ inadequate beliefs and attitudes towards solving mathematical school-type problems
(e.g., the belief that the first solution is always the best), and their low level of self-monitoring
while problem-solving.
As mentioned before, this article focuses on students’ overreliance on linearity in
economic education. We report on an empirical study that aimed at gathering systematic data
concerning this phenomenon in the domains of micro- and macroeconomics. More
specifically, we investigated the competence of third year undergraduate students in business
economics to unmask incorrect linear statements about non-linear situations. The relevant
economic background of these situations was previously taught to these students in their
micro- and macroeconomic courses. Before reporting on that new study, however, we will
start with reviewing some examples of people’s overuse of linearity in the economic and
economic education literature, typically mentioned at the margin of studies whose primary
focus is elsewhere. These references were found by means of a thorough literature search, a
search that also convinced us that a systematic investigation of this phenomenon has not yet
been carried out. The examples we will refer to not only encompass the overreliance on a “k
times A, thus k times B” form of reasoning (or the overuse of a y = ax relationship), but also
the overreliance on linear functions in the more general sense (y = ax + b relationships). Some
of the examples we encountered inspired us to develop the empirical instrument for our own
study.
Overreliance on Linearity in Economics and Economic Education Literature

7
In this section, we provide an overview of cases from economic and economic education research
reports in which linear relations are inadequately postulated in order to grasp economic
situations.
Hirschhorn (1986, 75) argues that in a wide variety of circumstances economists
faced with a non-linear function or a function without a closed-form representation, resort to
linear approximations of the function under study. This can be acceptable if the function is
not “too non-linear” and if its region is not too large, constraints that are likely to apply in
many economic situations. But, although the choice of a linear model or “first order
approximation” might be adequate in several situations, it can also lead to an
oversimplification of a situation and to wrong conclusions. Hirschhorn’s alert holds for
economic educators too. A typical example is the fact that most basic economics textbooks
represent the supply and demand behaviour of producers or consumers (or, more generally, of
a market) by two intersecting straight lines. There might be good didactical reasons to choose
these linear representations, e.g. to avoid distracting students by complexities that are not
relevant in order for an economic principle to be learned at a certain moment. In reality,
however, producers and consumers will, strictly speaking, not behave linearly. Besides,
assuming a linear consumer demand would imply that, above a certain price level, the
demand would become 0 (and even negative above a yet higher price). For that reason alone
other curves, e.g. standard hyperbola branches, having no intersection points with the axes,
might be more suitable candidates for modelling consumers’ behaviour mathematically (see
also Ping 2008). Similar arguments can be given for the Phillips curve capturing the
relationship between inflation and unemployment: while several textbooks represent this
relationship by a decreasing straight line, it could be more properly modelled by a decreasing
concave up curve (Debelle and Vickery 1998).
8
Christandl and Fetchenhauer (2009) conducted a series of experiments to examine
the accuracy of estimations of long-term economic growth both by experts and laypeople, the
factors that influence the accuracy of their estimations, and the procedures they use to make
the estimations. For an annual growth rate of more than 1%, this long-term growth level was
clearly underestimated by both groups, but the underestimation was lower for experts than for
laypeople. The authors discuss several causes for the underestimation of the actual economic
growth, which essentially can be modelled by an exponential function. A detailed review
would lead us too far, but relevant in the context of this article is the fact that one third of the
participants underestimated long-term economic growth on the basis of a linear model by
simply multiplying the time in years by the annual growth rate and thus totally ignoring
exponential effects. The authors state (p. 391): “Linear functions are used as a default for
situations that require a non-linear approach as long as it is not clear which approach needs
to be applied to a particular situation.”
Linear reasoning in a context where exponential reasoning is more suitable was also
found by Christandl and Gärling (2011), who conducted a series of laboratory experiments
with undergraduates on consumers’ ability to accurately estimate future price increases or
decreases in an inflationary economic context. Consumers strongly tended to apply a linear
model to extrapolate future prices and that model was only abandoned when clear counter-
evidence was provided, definitely showing its inadequacy in this context.
Whereas Christandl and Fetchenhauer (2009) and Christandl and Gärling (2011)
focused on people’s underestimation of exponential relationships in macroeconomic contexts,
Stango and Zinman (2009) investigated this phenomenon in relation to household finance.
They apply the term “exponential growth bias” to characterize the pervasive tendency to
linearize exponential functions when assessing them intuitively, a bias that can explain two
facts in household finance: the tendency to underestimate an interest rate given other loan

9
terms, and the tendency to underestimate a future value given other investment terms. The
authors argue that this bias affects households’ financial decisions: more biased households
will borrow more, save less and favour shorter maturities. New empirical evidence was found
by constructing a household-level measure of payment/interest bias, and correlating it with a
wide range of household financial outcomes using nationally representative data in the US.
Jehle (2002) deals with the concept of constant returns to scale, an assumption that is
often made for production functions, without sufficiently emphasizing that it is usually a
simplification of economic reality. The author warns that relaxing this assumption can
severely alter the conclusions obtained in complex arguments. Even “small deviations” from
constant returns can lead to dramatically different results. This case is worth mentioning in
our overview because it exemplifies the variety of forms taken by the (overreliance on)
linearity in economics. Actually in this case the tendency to over-rely on linear assumptions is
extended from functions of one variable (often of the form “f(kx) = k f(x)”) to functions of two
or more variables (in this context called homogeneity of degree one, formally, for functions of
two variables, denoted as “f(kx, ky) = k f(x, y)”).
Hsee, Yu, Zhang, and Zhang (2003) investigate the impact of a medium – for
example, points or money – on people’s decisions when they are faced with options entailing
different outcomes. In a laboratory study with university students, the authors demonstrate
that the presence of a medium can alter people’s decisions because the medium creates an
illusion of advantage to an otherwise not so advantageous option. One of the presented
illusions is called the “illusion of linearity”ii, the effect that occurs because the medium masks
an otherwise concave down effort-outcome return relationship by a linear relationship. The
authors argue that their work has real economic implications for how points influence
consumer choice and how money influences human behaviour.

10
An Empirical Study at the Tertiary Level
Rationale
Inspired by the references we found in the literature, in particular by the indications that
economic education practices do not always sufficiently adjust to or counterbalance students’
spontaneous tendency to over-rely on linearity, we decided to conduct an empirical study of
this phenomenon. Because it is the first time a systematic study on students’ over-reliance on
linearity in economics and economic education has been carried out and we thus could not
rely on existing research data, we decided to develop an exploratory quantitative study aiming
at obtaining an initially global picture of the strength of this phenomenon in the domains of
micro- and macroeconomics. Our main research question was: “Does improper linear
reasoning play an important role in business economics students’ reasoning about micro- and
macroeconomic situations?” Because almost all research in mathematics and science
education concerning students’ overreliance on linearity defines the linearity concept in its
narrow sense (i.e. the overuse of a y = ax relationship, graphically represented by a straight
line through the origin), and because we aimed at making some comparisons between our
results and the ones found in this preceding work, we decided to include that limitation in our
study too. Based on the results of the previously mentioned research in mathematics and
science education, we hypothesized that the answer to our main research question would be
an affirmative one. We did not find any indications in the economic (education) literature
which would enable us to a priori formulate an expectation concerning the role of the
economic domain.
Because we know from the mathematics education literature that problem formulation
can influence students’ tendency to over-rely on linearity (De Bock et al. 2002), we decided
to add a variable with respect to problem formulation to our design. A straightforward
appearance of the application of a y = ax relationship is a “k times A, thus k times B”

11
reasoning. In economics however, instead of doubling, tripling … quantities often increase by
a certain percentage (in most cases much smaller than 100%). It is therefore likely that, in this
domain, improper linear reasoning will also appear in an “A + k%, thus B + k%” format. From
a mathematical point of view, this type of reasoning is clearly linear (or proportional)
reasoning too: the increase of A and B is proportional to (or linearly dependent on) the actual
values of A and B. Besides, an increase by k% is nothing other than a multiplication by 1 +
k/100. So we formulated an additional research question: “Does improper linear reasoning by
business economics students about micro- and macroeconomic statements depend on the
formulation of these statements in a “k times A, thus k times B” or an “A + k%, thus B + k%”
format?” Because the “k times A, thus k times B” format is a more straightforward and
prototypical form of linear reasoning, we hypothesized that this format would more firmly
encourage students to improperly follow a linear reasoning compared to the other format.
Design
A written test was taken by 92 third year bachelor students in business economics. The test
consisted of ten statements that the participants had to evaluate as being correct or incorrect.
The instructions mentioned that the correctness or incorrectness of the statements was
completely random and that it even could be that all statements were correct or incorrect.
Participants also had the option to briefly explain their answer. On the basis of these
explanations we would possibly acquire some insight into students’ underlying reasoning
process. However, we decided to make the explanation voluntary because research in
mathematics education has already shown that people are often unable to argue why they
follow a linear reasoning (cf. the interview study by De Bock et al. 2002). The theory underlying
each statement was addressed in courses that participants had followed during their university
training so far. Half of the statements were drawn from the subdomain of microeconomics,

12
the other half were drawn from the subdomain of macroeconomics. Within each of these
subdomains, there was one statement for which linear reasoning was appropriate and there
were four items for which such reasoning was not appropriate. We will name them the linear
and the non-linear items. Half of the non-linear items (in each subdomain) was formulated in
a “k times A, thus k times B” format, while the other half was formulated in an “A + k%, thus
B + k%” format. The microeconomic linear item was formulated in a “k times A, thus k times
B” format, while the macroeconomic linear item was formulated in an “A + k%, thus B + k%”
format. We also included a number of buffer items in the test – correct and incorrect
statements to be evaluated about various economic topics – to avoid the possibility that
participants would be able to guess the real research aim of the test and tune their answers
correspondingly. Of course, these buffer items are of no further research interest and we will
thus not analyse participants’ answers on these items. Experimental and buffer items were
presented in different random orders to the participants. An overview of the ten experimental
items is given in Table 1.
---------------------------------------------------------------
Insert Table 1 about here
---------------------------------------------------------------
The experimental items may require some additional comments. A general comment
refers to the fact that we added the adverb “approximately” in the last sentence of all non-
linear items. The reason is that we wanted to avoid it happening that a participant would value
these items as incorrect only because he or she feels the situation is not “100% linear”.
Indeed, as in all social sciences, relationships in economics are seldom “100% linear”, but in
line with our research aims, the rejection of a linear statement should be based on a more
fundamental economic insight.
We briefly comment on each of the eight non-linear items in Table 1, viz. items 1 to 4
13
and items 6 to 9. Item 1 refers to a context of decreasing returns to scale: inexperienced
students will not be able to work as fast as John and his wife. To serve 30 tables equally fast
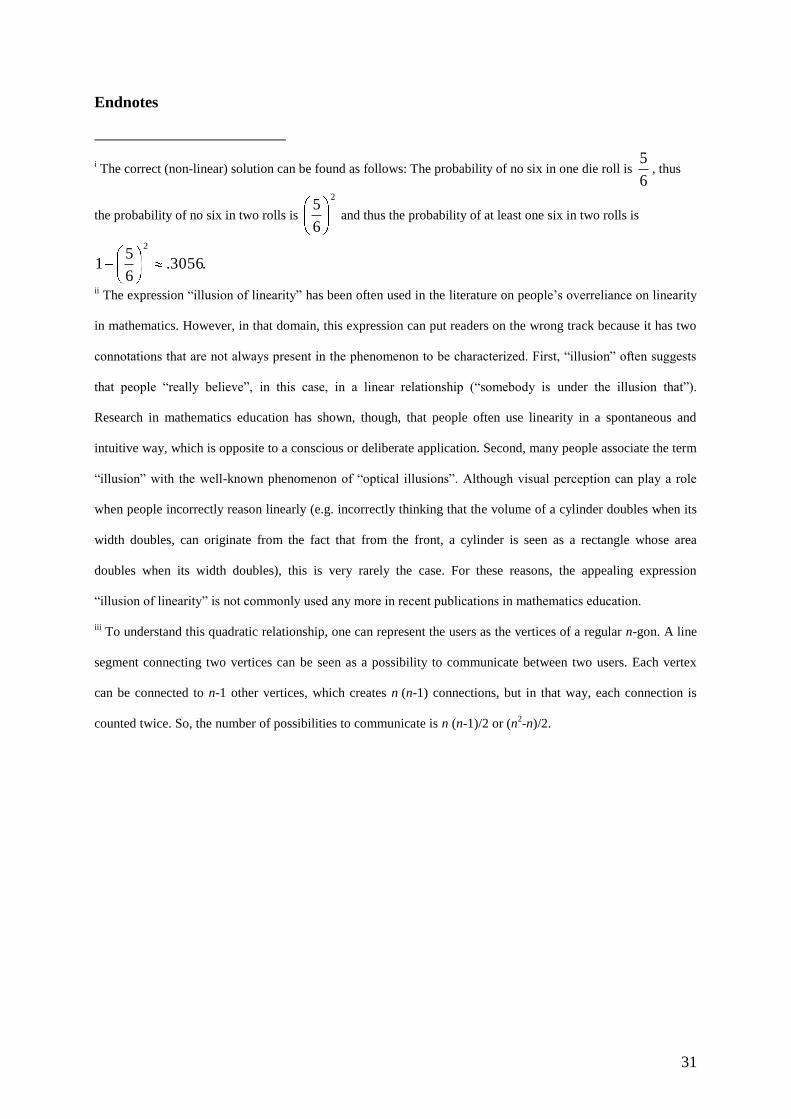
more than four students should be brought in. Item 2 exemplifies in the context of mobile
phone use that for certain products, not only the purchaser and the user benefit from the
purchase, but also all other users of that product. Economists call this an example of network
externalities. However, in that example the relationship between the number of mobile phone
users and the number of possibilities these users have to communicate with each other is not a
linear but a quadratic oneiii
. A case of the law of diminishing marginal returns is presented in
Item 3: farmers will meet the EU rule by leaving fallow their least fertile land and therefore
production will decrease by less than 10%. Item 4 refers to the fact that independently of
one’s wage a certain amount of money will be spent on basic needs such as food and clothes.
With a wage increase a person might spend a little bit more on basic needs, but most of the
extras will go on luxury goods or will be saved. The expenditure on food will thus normally
increase by less than 20%. Item 6 introduces a situation of cumulative growth that can be
modelled more appropriately by an exponential than by a linear function. Government
revenue depends on tax rates, but this relationship is not a linear one, as is suggested in Item
7. A hypothetical representation of how government revenue will change in response to
changes in the tax rate is the so-called Laffer curve which is often presented as a parabolic
shape. Doubling the tax rate from 20% to 40% will change but not double government
revenue because some people will, for instance, look for a job on the black market to avoid
this tax increase. In fact, tax revenue will even decrease above a certain tax rate. Item 8 is
based on the incorrect assumption that all employees have an equal chance of losing their job
in times of economic crisis. In reality, however, it is often the low-skilled and less well-paid
employees that no longer find a job and so salary costs for companies will decrease by less
than 15%. Item 9 is related to item 4: an increase by 5% of households’ income will normally
14
not lead to an increase in their expenditure of 5%. Because households will save more money
the increase in their expenditure will be less than 5%.
Analysis and Results
Participants’ answers were statistically analysed by means of two repeated measures logistic
regression analyses, each of which predicted the correctness of the answer. To estimate the
models, we used the generalized estimating of equations (GEE) approach within SPSS (Liang
and Zeger 1996). A repeated measures logistic regression makes it possible to analyze
repeated (and thus possibly correlated) categorical observations within a series of individuals,
and to appropriately correct for the inferences that can be drawn from such correlated
measures. Given the dichotomous nature of the dependent variable (i.e., each statement is
evaluated as being correct or incorrect), a logistic regression (modelling the probability that
an observation is made in terms of some explanatory variables) was appropriate. The first
logistic regression was carried out for all experimental items with Linearity (linear vs. non-
linear items) and Economic subdomain (micro- vs. macroeconomics) as explanatory
variables. The second logistic regression was carried out for all non-linear items with Item
format (“k times A, thus k times B” vs. “A + k%, thus B + k%” format) and Economic
subdomain as explanatory variables. It was not possible to also analyze participants’
qualitative explanations for their given answers in a systematic way, because only a minority
of them made use of this opportunity.
---------------------------------------------------------------
Insert Table 2 about here
---------------------------------------------------------------
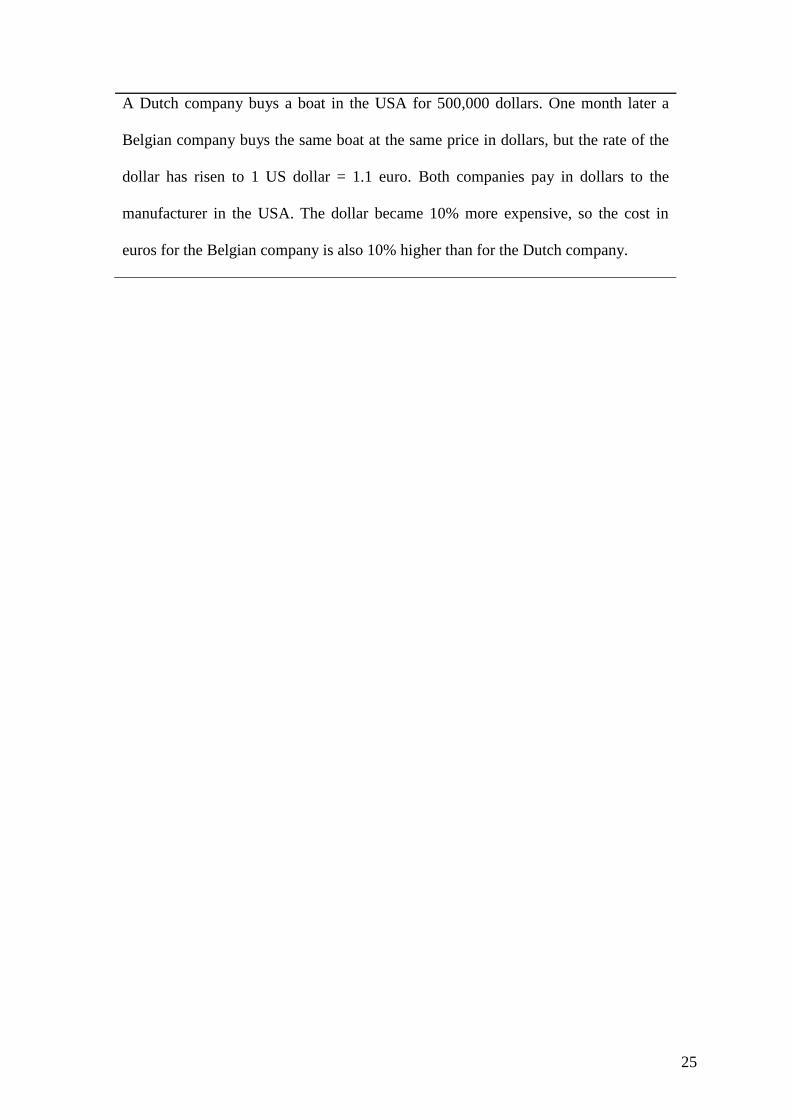
Table 2 lists the percentages of correct answers for the linear and the non-linear items
in the micro- and macroeconomic subdomain. The first logistic regression analysis revealed a

15
significant Linearity main effect, χ²(1) = 14.89, p = 0.000. Linear items got more correct
answers than non-linear items (respectively 85.3% and 71.2%). This result suggests, in line
with our hypothesis, that improper linear reasoning plays a significant role in business
economics students’ reasoning about micro- and macroeconomic situations. Participants were
more inclined to follow a linear reasoning for the linear items than they were inclined to reject
such reasoning for the non-linear items. The Economic subdomain variable too had a main
effect on the percentage of correct answers, χ²(1) = 4.55, p = 0.033. The number of correct
answers was significantly larger for the micro- than for the macroeconomic items
(respectively 77.8% and 70.2%). This result might be due to the more general and more
abstract nature of the subdomain of macroeconomics. Finally, there was no significant
interaction between Linearity and Economic subdomain, χ²(1) = 0.320, p = 0.572.
--------------------------------------------------------------
Insert Table 3 about here
---------------------------------------------------------------
Table 3 presents the percentages of correct answers for the non-linear “k times A, thus
k times B” and “A + k%, thus B + k%” items in the micro- and macroeconomic subdomain.
The second logistic regression analysis revealed a significant Item format main effect, χ²(1) =
25.03, p = 0.000. Participants performed better on non-linear items in an “A + k%, thus B +
k%” than on non-linear items in a “k times A, thus k times B” format (respectively 80.4% and
62.0% correct answers). This result confirms our hypothesis stating that the “k times A, thus k
times B” format more definitely encourages students to improperly follow a linear reasoning
than the other format. The second regression analysis did not reveal a main effect of the
Economic subdomain variable. Participants’ performance on the non-linear items did not
significantly differ for the two economic subdomains involved in the test. Finally, an
interaction between Item format and Economic subdomain was found, χ²(1) = 12.34, p =
16
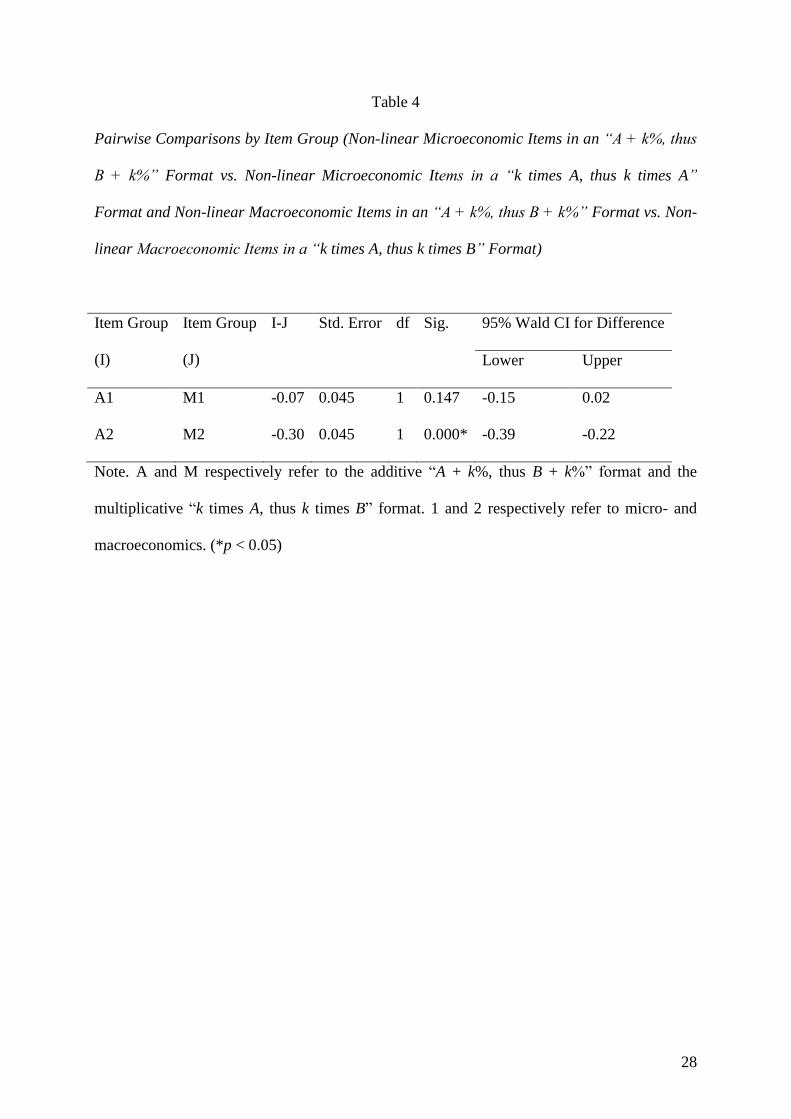
0.000. To interpret this interaction effect, pairwise comparisons by item group were carried
out (see Table 4). Only for the macroeconomic subdomain, non-linear items in an “A + k%,
thus B + k%” format were significantly more correct answers elicited than non-linear items in
a “k times A, thus k times B” format. Admittedly, as shown in Table 3, the trend in the
microeconomic subdomain pointed in the same direction, but there the difference was too
small to be significant. The observed main effect of Item format is thus almost completely due
to participants’ different answering behaviour for the two types of non-linear items in the
macroeconomics domain.
---------------------------------------------------------------
Insert Table 4 about here
---------------------------------------------------------------
As mentioned before, participants also had the opportunity to briefly explain their
answers. A closer look at these explanations revealed that (1) participants only rarely have
any motivation for following linear reasoning for a non-linear item, and (2) those who did
claim a motivation for such reasoning often just literally repeated the corresponding part of
the item statement. These observations are not very surprising, because it is always more
difficult for people to explain why they consider a form of reasoning – in this case the given
linear reasoning – to be correct than to argue, e.g. by means of a counterexample, why they
consider a form of reasoning to be incorrect. The heuristic and intuitive character of a linear
reasoning makes it even more difficult to argue why one follows such reasoning. Although
the limited number of explanations from participants does not allow one to draw any hard
conclusions, they provide several elements that point towards the overuse of linearity. Table 5
lists some typical participants’ explanations to illustrate their improper linear reasoning.
Future systematic qualitative research could enlighten us concerning the robustness and
generalisability of these findings.

17
---------------------------------------------------------------
Insert Table 5 about here
---------------------------------------------------------------
Conclusions and Discussion
In this paper we explored students’ overreliance on linearity in economics and economic
education. A preceding literature review made clear that this phenomenon is acknowledged
by several scholars in the field, but that it has never been investigated empirically in a
systematic way. We undertook a first attempt to fill this gap in the research literature by
setting up a study in which a group of third year business economics students was confronted
with correct and incorrect linear statements about micro- and macroeconomic situations.
Results showed a tendency on the part of these tertiary level students to evaluate incorrect
linear statements as being correct, which suggests that they still over-rely on linearity while
reasoning about economic situations. Moreover, a formulation effect was revealed: students
more easily agreed with an incorrect linear statement when such a statement was formulated
in a “k times A, thus k times B” format, which is most prototypical for linear reasoning in
general, than in an “A + k%, thus B + k%” format, the form in which linear reasoning often
occurs in economics.
Students’ overreliance on linearity was less overwhelming than in similar studies in
the more abstract domains of mathematics and science. It is tempting to conclude that
students are less inclined to overuse linearity in economics because they can better imagine
and understand basic relationships in this domain, but we think this conclusion is premature.
The reported study was conducted at the tertiary level with business economics students while
almost all studies on students’ overreliance on linearity in mathematics and science education
were conducted at lower educational levels. To convincingly show differences between
18
school subjects one should set up research into this phenomenon with comparable groups of
students in these subjects.
More research is also needed to further unravel the nature of students’ over-reliance
on linearity in economics. Why do students, who have already thoroughly studied the
relationships in question, still succumb to the charms of a linear quantification? Does the
intuitive or heuristic character of the linear model play a major role or is the reliance on linear
quantifications also induced by current educational practices? Or do tertiary level students in
economics still have substantial gaps in their economic (pre)knowledge? In all probability,
students’ overreliance on linearity is a combination effect of these and probably also other
factors. To further clarify the role of the different factors continuously evoking this
phenomenon, one could conduct semi-structured individual interviews with small groups of
students working on rich linear and non-linear economic problem situations, letting them
think aloud and, depending on what they say and the progress they make, gradually providing
them with help (e.g. in the form of counterevidence) in order to systematically analyze their
thinking process.
Further qualitative research could also shed light on the real nature of an “A + k%,
thus B + k%” reasoning. As argued before, from a mathematical point of view, such reasoning
is clearly linear or proportional. It remains unclear, however, whether such reasoning is also
experienced that way in people’s minds. Besides the phenomenon of improper linear
reasoning, students’ tendency towards improper additive or “A + k, thus B + k” reasoning is
well-documented in the mathematics education literature. For example, a student reasons that
if two oranges are added to a mixture of juice of seven oranges and five lemons, in order to
keep the same flavour, two lemons should be added to that mixture too (see, e.g., Hart 1981
or Karplus, Pulos and Stage 1983). Improper additive reasoning typically appears in younger
children before they fully master the proportional scheme. In this study, participants more
19
easily rejected an improper (linear) “A + k%, thus B + k%” than an improper “k times A, thus
k times B” form of reasoning, but it remains for further research to unravel whether these
students really rejected an improper linear reasoning or something they perceived as an
improper additive reasoning that is more easy to see through.

20
REFERENCES
Christandl, F., and D. Fetchenhauer. 2009. How laypeople and experts misperceive the effect
of economic growth. Journal of Economic Psychology 30: 381–92.
Christandl, F., and T. Gärling. 2011. The accuracy of consumers’ perception of future
inflationary price changes. Zeitschrift für Psychologie/Journal of Psychology 219(4):
209–16.
Cramer, K., T. Post, and S. Currier. 1993. Learning and teaching ratio and proportion:
Research implications. In Research ideas for the classroom: Middle grades
mathematics, ed. D. T. Owens, 159–78. New York: Macmillan.
Debelle, G., and J. Vickery. 1998. Is the Phillips curve a curve? Some evidence and
implications for Australia. The Economist Society of Australia 74(227): 384–98.
De Bock, D., W. Van Dooren, D. Janssens, and L. Verschaffel. 2002. Improper use of linear
reasoning: An in-depth study of the nature and the irresistibility of secondary school
students’ errors. Educational Studies in Mathematics 50: 311–34.
De Bock, D., W. Van Dooren, D. Janssens, and L. Verschaffel. 2007. The illusion of linearity:
From analysis to improvement. New York: Springer.
De Bock, D., W. Van Dooren, and L. Verschaffel. 2011. Students’ overuse of linearity: An
exploration in physics. Research in Science Education 41(3): 389–412.
De Bock, D., L. Verschaffel, and D. Janssens. 1998. The predominance of the linear model in
secondary school students’ solutions of word problems involving length and area of
similar plane figures. Educational Studies in Mathematics 35(1): 65–83.
De Bock, D., L. Verschaffel, and D. Janssens. 2002. The effects of different problem
presentations on the illusion of linearity in secondary school students. Mathematical
Thinking and Learning 4(1): 65–89.

21
Esteley, C. B., M. E. Villarreal, and H. R. Alagia. 2010. The overgeneralization of linear
models among university students’ mathematical productions: A long-term study.
Mathematical Thinking and Learning 12(1): 86–108.
Fischbein, E. 1987. Intuition in science and mathematics. Dordrecht: Reidel.
Hart, K. M. 1981. Children’s understanding of mathematics: 11–16. London: Murray.
Hirschhorn, E. 1986. A note on the use (and misuse) of log-linear approximations in
economics. The American Economist 30(1): 75–7.
Hsee, C. K., F. Yu, J. Zhang, and Y. Zhang. 2003. Medium maximization. Journal of
Consumer Research 30: 1–14.
Jehle, G. A. 2002. On the geometry of constant returns. Journal of Economic Education
33(1): 53–68.
Karplus, R., S. Pulos and E. K. Stage. 1983. Early adolescents’ proportional reasoning on
“rate” problems. Educational Studies in Mathematics 14: 219–33.
Liang, K.-Y., and S. L. Zeger. 1986. Longitudinal data analysis using generalized linear
models. Biometrika 73: 13–22.
Ping, C. 2008. Equilibrium illusion, economic complexity and evolutionary foundation in
economic analysis. Evolutionary an Institutional Economics Review 5(1): 81–127.
Stango, V., and J. Zinman. 2009. Exponential growth bias and household finance. The
Journal of Finance 64(6): 2807–50.
Van Dooren, W., D. De Bock, F. Depaepe, D. Janssens, and L. Verschaffel. 2003. The
illusion of linearity: Expanding the evidence towards probabilistic reasoning.
Educational Studies in Mathematics 53: 113–38.
Van Dooren, W., D. De Bock, A. Hessels, D. Janssens, and L. Verschaffel. 2005. Not
everything is proportional: Effects of age and problem type on propensities for
overgeneralization. Cognition and Instruction 23(1): 57–86.

22
Van Dooren, W., D. De Bock, D. Janssens, and L. Verschaffel. 2008. The linear imperative:
An inventory and conceptual analysis of students’ overuse linearity. Journal for
Research in Mathematics Education 39(3): 311–42.
Van Dooren, W., and B. Greer. (ed.) 2010. Special issue: Dominance of linearity in
mathematical thinking. Mathematical Thinking and Learning 12(1): 1–115.

23
Table 1
Experimental Items used in the Test
Microeconomics
Non-linear items/“k times A, thus k times B”
Item 1. John is a well-trained cook, a real natural talent. Together with his wife, who
also trained in hotel management and catering, he runs a successful restaurant at the
seaside. Together they can easily serve 10 tables at the same time. In summer, the
occupancy is much higher. On average 30 tables are then occupied. To solve that
problem they bring in four inexperienced students who gladly want to make
something on the side. With the help of these students they serve their customers
(approximately) as fast as outside of the summer period.
Item 2. Last year three classmates had a mobile phone. We define the utility of that
group as the number of possibilities these classmates have to communicate with each
other by mobile phone. This year the number of classmates owning a mobile phone
doubled. Accordingly the utility of the group that already had a mobile phone last
year (approximately) doubled too.
Non-linear items/“A + k%, thus B + k%” format
Item 3. Before 2008 farmers in the European Union were obliged to leave 10% of
their land fallow. The aim was to avoid overproduction. As a consequence of that
10% fallow rule agricultural production decreased by (approximately) 10%.
Item 4. Mary is excellent in her job and promptly gains promotion. This promotion is
accompanied by a net wage increase of 20%. Mary’s spending on food will also
increase by (approximately) 20%.
Linear item
Item 5. Peter wants to celebrate his 18th
birthday. He plans to have an unforgettable

24
evening party and he wants to take care of everything to the last detail. In order to
reduce his costs he asks guests for a contribution of 10 euros. He was expecting 20
guests, but twice as many come. The total contribution that he will receive from his
guests will therefore be twice as large as he had expected.
Macroeconomics
Non-linear items/“k times A, thus k times B”
Item 6. During a trade mission to China a Belgian diplomat expressed his optimism
about the Chinese economy that currently grows at a rate of 14% per year. If that
growth rate is repeated annually, in about 7 years the Chinese economy will be
(approximately) twice as large.
Item 7. In a certain country a flat tax rate of 20% is applied to all incomes. To bring
in more money the government thinks about an increase in the flat tax rate. Next year
income tax will be increased from 20% to 40%. This means that in the future the
government will (approximately) double its revenue from income tax.
Non-linear items/“A + k%, thus B + k%” format
Item 8. In the current economic crisis there are many redundancies and
unemployment is high. The number of people employed decreased by 15% over the
years. Accordingly salary costs for companies also decreased by (approximately)
15%.
Item 9. After an economic crisis a country enjoys a period of economic growth. The
first year after the crisis the economy is growing by 5% and consequently the total
income of the households increases by 5%. Because of that larger income the total
expenditure of the households also increases by (approximately) 5%.
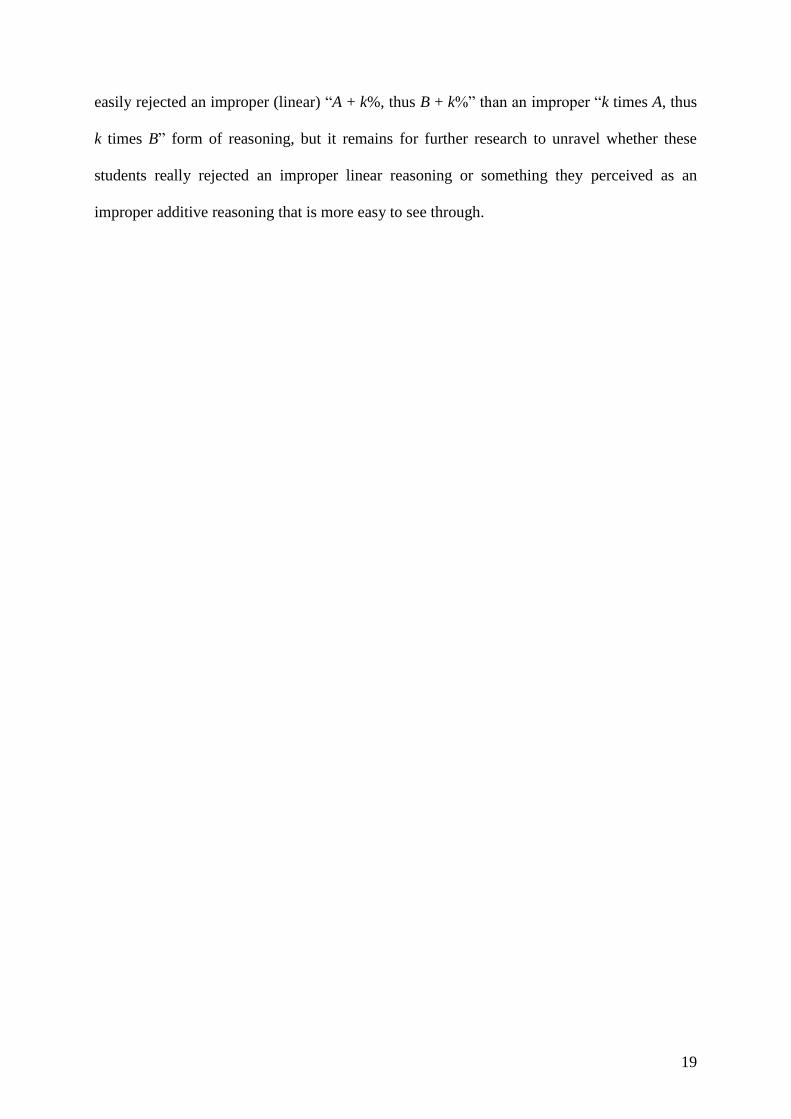
Linear item
Item 10. Today, the exchange rate of the euro and the dollar is 1 US dollar = 1 euro.
25
A Dutch company buys a boat in the USA for 500,000 dollars. One month later a
Belgian company buys the same boat at the same price in dollars, but the rate of the
dollar has risen to 1 US dollar = 1.1 euro. Both companies pay in dollars to the
manufacturer in the USA. The dollar became 10% more expensive, so the cost in
euros for the Belgian company is also 10% higher than for the Dutch company.
26
Table 2
Distribution of Correct Answers for the Linear and the Non-linear Items in the Micro- and
Microeconomic Subdomain
Linear Items Non-linear Items
Microeconomics 89.1% 75.0%
Macroeconomics 81.5% 67.4%

27
Table 3
Distribution of Correct Answers for the Non-linear “k times A, thus k times B” and “A + k%,
thus B + k%” Items in the Micro- and Macroeconomic Subdomain
k times A, thus k times B A + k%, thus B + k%
Microeconomics 71.7% 78.3%
Macroeconomics 52.2% 82.6%
28
Table 4
Pairwise Comparisons by Item Group (Non-linear Microeconomic Items in an “A + k%, thus
B + k%” Format vs. Non-linear Microeconomic Items in a “k times A, thus k times A”
Format and Non-linear Macroeconomic Items in an “A + k%, thus B + k%” Format vs. Non-
linear Macroeconomic Items in a “k times A, thus k times B” Format)
Item Group
(I)
Item Group
(J)
I-J Std. Error df Sig. 95% Wald CI for Difference
Lower Upper
A1 M1 -0.07 0.045 1 0.147 -0.15 0.02
A2 M2 -0.30 0.045 1 0.000* -0.39 -0.22
Note. A and M respectively refer to the additive “A + k%, thus B + k%” format and the
multiplicative “k times A, thus k times B” format. 1 and 2 respectively refer to micro- and
macroeconomics. (*p < 0.05)

29
Table 5
Illustrative Overview of Participants’ Typical Reasons for (Incorrectly) Following a Linear
Reasoning
Item 1.
“Yes, 5 per person”
Item 2.
“Formerly communicating with 3, now with 6”
Item 3.
“10 % less land = 10% less production = 10% less revenue”
“All farmers have 10% fallow → 10% less production”
Item 6.
“14% × 7 = 100%”
“Seven years later 200% → 14 × 7 = 98% → wrong”
Item 7.
“1000 revenue. Now 20% → 200, soon 40% → 400”
“Doubling tax rate = doubling tax”

30
Acknowledgment
The authors would like to thank Mark Corner for his generosity to give, as a native English
speaker, this manuscript a final language review.
31
Endnotes
i The correct (non-linear) solution can be found as follows: The probability of no six in one die roll is
6
5, thus
the probability of no six in two rolls is
2
6
5 and thus the probability of at least one six in two rolls is
.3056.6
51
2
ii The expression “illusion of linearity” has been often used in the literature on people’s overreliance on linearity
in mathematics. However, in that domain, this expression can put readers on the wrong track because it has two
connotations that are not always present in the phenomenon to be characterized. First, “illusion” often suggests
that people “really believe”, in this case, in a linear relationship (“somebody is under the illusion that”).
Research in mathematics education has shown, though, that people often use linearity in a spontaneous and
intuitive way, which is opposite to a conscious or deliberate application. Second, many people associate the term
“illusion” with the well-known phenomenon of “optical illusions”. Although visual perception can play a role
when people incorrectly reason linearly (e.g. incorrectly thinking that the volume of a cylinder doubles when its
width doubles, can originate from the fact that from the front, a cylinder is seen as a rectangle whose area
doubles when its width doubles), this is very rarely the case. For these reasons, the appealing expression
“illusion of linearity” is not commonly used any more in recent publications in mathematics education.
iii To understand this quadratic relationship, one can represent the users as the vertices of a regular n-gon. A line
segment connecting two vertices can be seen as a possibility to communicate between two users. Each vertex
can be connected to n-1 other vertices, which creates n (n-1) connections, but in that way, each connection is
counted twice. So, the number of possibilities to communicate is n (n-1)/2 or (n2-n)/2.