Student musicians' perception of loudness and how it ...
64
Washington University School of Medicine Digital Commons@Becker Independent Studies and Capstones Program in Audiology and Communication Sciences 2010 Student musicians' perception of loudness and how it correlates to the measured level Amanda Moore Follow this and additional works at: hp://digitalcommons.wustl.edu/pacs_capstones Part of the Medicine and Health Sciences Commons is esis is brought to you for free and open access by the Program in Audiology and Communication Sciences at Digital Commons@Becker. It has been accepted for inclusion in Independent Studies and Capstones by an authorized administrator of Digital Commons@Becker. For more information, please contact [email protected]. Recommended Citation Moore, Amanda, "Student musicians' perception of loudness and how it correlates to the measured level" (2010). Independent Studies and Capstones. Paper 604. Program in Audiology and Communication Sciences, Washington University School of Medicine. hp://digitalcommons.wustl.edu/pacs_capstones/604
Transcript of Student musicians' perception of loudness and how it ...

Washington University School of MedicineDigital Commons@Becker
Independent Studies and Capstones Program in Audiology and CommunicationSciences
2010
Student musicians' perception of loudness and howit correlates to the measured levelAmanda Moore
Follow this and additional works at: http://digitalcommons.wustl.edu/pacs_capstones
Part of the Medicine and Health Sciences Commons
This Thesis is brought to you for free and open access by the Program in Audiology and Communication Sciences at Digital Commons@Becker. It hasbeen accepted for inclusion in Independent Studies and Capstones by an authorized administrator of Digital Commons@Becker. For moreinformation, please contact [email protected].
Recommended CitationMoore, Amanda, "Student musicians' perception of loudness and how it correlates to the measured level" (2010). Independent Studiesand Capstones. Paper 604. Program in Audiology and Communication Sciences, Washington University School of Medicine.http://digitalcommons.wustl.edu/pacs_capstones/604

STUDENT MUSICIANS’ PERCEPTION OF LOUDNESS AND HOW IT CORRELATES
TO THE MEASURED LEVEL
By
Amanda Moore
A Capstone Project Submitted in partial fulfillment of the requirements for the degree of:
Doctorate of Audiology
Washington University School of Medicine Program in Audiology and Communication Sciences
May 20, 2011
Approved by: Amanda Ortmann, M.S.S.H., CCC-A, Capstone Project Advisor
William Clark, Ph.D., Secondary Reader
Abstract: The purpose of this project was to evaluate student musicians’ perception of loudness and see how it relates to the measured sound level when playing an instrument alone and when playing in an orchestra. Perhaps by examining this relationship, strategies can be developed to
educate musicians on the risk of excessive noise exposure and hearing protection options.

Moore
ii
Acknowledgements
I would like to thank the following contributors to this study, without whom this project would have not been possible: Amanda Ortmann, M.S.S.H., CCC-A of the Division of Adult Audiology, Washington University School of Medicine, Saint Louis, Missouri, for not only taking time to mentor this capstone project, but also for preparing the statistics for the intraclass correlation for the questionnaire. Her guidance, support, and encouragement throughout this project was greatly appreciated. William Clark, Ph.D. of the Program in Audiology and Communication Sciences, Washington University School of Medicine, Saint Louis, Missouri, for his invaluable contributions to this project including, but not limited to, his assistance with the dosimeter and sound level measurements as well as his expertise in the field of acoustics and noise exposure. Mr. Dan Presgrave, Washington University in St. Louis, Saint Louis, Missouri, for not only allowing recruitment of participants from the Washington University in St. Louis Symphony Orchestra, but for providing a schematic of the orchestra stage to use for this paper. All of the participating musicians from the Washington University in St. Louis Symphony Orchestra, Saint Louis, Missouri, who dedicated their time and effort into this study.

Moore
Table of Contents
Acknowledgements…………………….………………………………...………….…………..(ii) Table of Contents……………………………………………………..……………..…………..(1) List of Figures…………..……………………………….………...……….……………………(2) List of Tables…………………………………………………………………………………….(3) Chapter I – Introduction and Literature Review…………………..…………………………….(4) Chapter II – Methods………………………………………..………………………………….(11) Chapter III – Results……………………………………….…….…………………………….(20) Chapter IV – Discussion and Conclusion……………………...………………………………(38) References……………………………………………………………..………………...……..(50) Appendix A………….……………………………………………….…………………...……(52) Appendix B………………………………………………………………………………...…..(59) Appendix C……………………………………………………………………………...……..(60)
Appendix D……………………………………………………………………………….……(61)
1

Moore
Table of Figures
Figure 2.3 – Schematic drawing of the Washington University Symphony Orchestra stage and the location of participants. Figure 2.4 – Schematic representation of the Washington University Symphony Orchestra stage for general orchestra measurements. Figure 3.1 - Participants’ responses to Question 8 related to fluency of instruments.
Figure 3.2 - Participants’ responses to Questions 16 and 17 related to playing with other ensembles/bands/etc… Figure 3.3a – Participants’ responses to Question 24 regarding perception of “softest” instrument. Figure 3.3b – Participants’ responses to Question 25 regarding perception of “loudest” instrument. Figure 3.4 – Participants’ responses to Questions 26 through 29 related to occurrence of otologic symptoms associated with noise-induced hearing loss. Figure 3.5 – Participants’ loudness rating responses for individual instruments. Figure 3.6 – All musicians’ loudness ratings for all four orchestral sections.
Figure 3.7 – Participants’ loudness rating responses for the entire orchestra.
Figure 3.8 – Loudness rating of how loud participants listen to music on their iPod/MP3 player/ CD player/Walkman from Question 7. Figure 3.10 – Histogram of the measurements in each dBA Leq set.
Figure 4.1 – Musicians’ loudness ratings versus normative loudness contour values for speech.
2
Moore
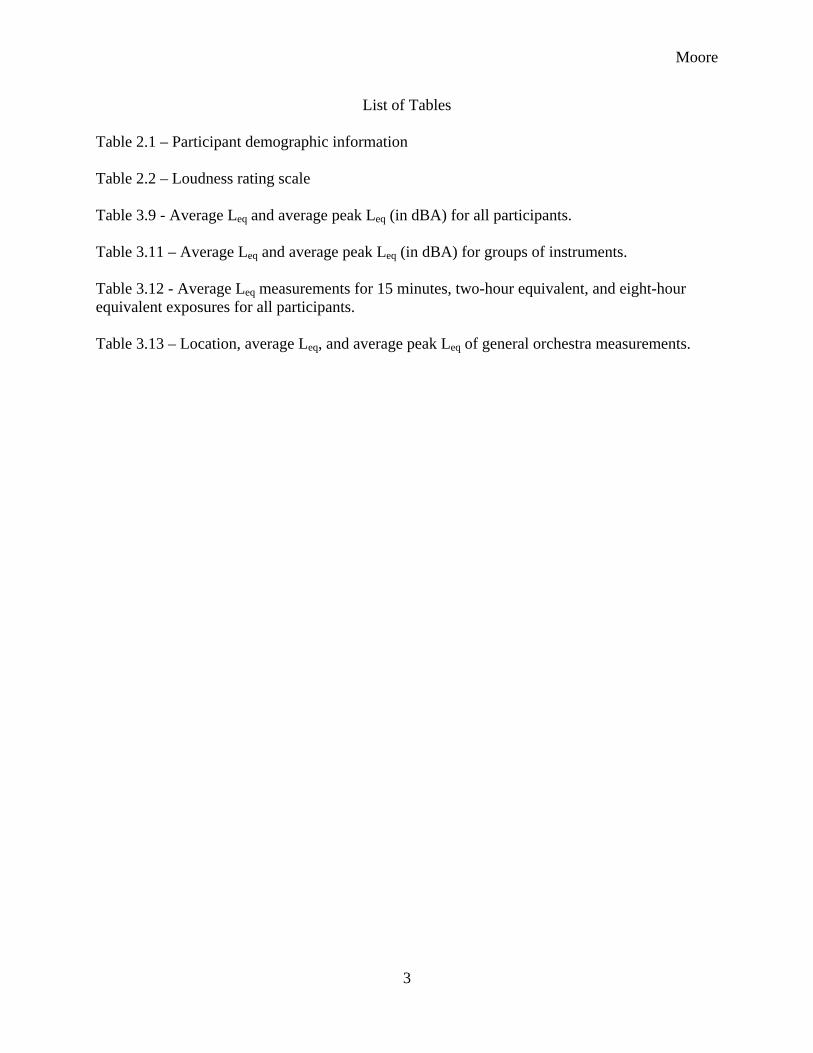
List of Tables
Table 2.1 – Participant demographic information
Table 2.2 – Loudness rating scale
Table 3.9 - Average Leq and average peak Leq (in dBA) for all participants. Table 3.11 – Average Leq and average peak Leq (in dBA) for groups of instruments.
Table 3.12 - Average Leq measurements for 15 minutes, two-hour equivalent, and eight-hour equivalent exposures for all participants. Table 3.13 – Location, average Leq, and average peak Leq of general orchestra measurements.
3

Moore
CHAPTER I
Introduction and Literature Review
When a listener is asked to describe any noise that could damage hearing, he/she would
likely describe the sound as being extremely loud, bothersome, and unwanted. Given this
description, music, specifically orchestral music, would not be considered by most as harmful
noise. But according to research, the sound level of the music emitting from orchestral
instruments can range between 77-96 dBA, with peaks between 107 dBC-146 dBC (O’Brien,
Wilson, & Bradley, 2008). These levels are in fact potentially dangerous to the hearing
sensitivity of musicians. The risk of noise-induced hearing loss among musicians has received a
lot of attention over the past two decades (Ostri, Eller, Dahlin, and Skylv, 1989; Royster, Royster
and Killion, 1991; Zhao, Manchaiah, French, and Price, 2009). Currently, there has been a focus
on hearing conservation programs for students in music education (National Association for
Music Education, 2006; Palmer, 2007). Young musicians represent a special population in that as
musicians they are potentially exposed to high levels of noise on a regular basis, and as young
adults they may have a heightened sense of invincibility in which they don’t believe that they are
exposed to any harm (Wickham, Anderson, and Greenburg, 2008).
Hearing loss and other hearing-related symptoms among professional musicians has been
documented in several different articles. Jansen, Helleman, Dreschler, and de Laat (2009)
showed that even though most musicians had hearing within normal limits, most had poorer
thresholds at 6000 Hz, which is indicative of noise-induced damage. In addition, most of the
musicians reported having other related symptoms such as tinnitus and hyperacusis. Royster,
Royster, and Killion (1991) worked with the Chicago Symphony Orchestra to conduct a study
4

Moore
that had a two-fold purpose. The first goal was to assess the risk of noise-induced hearing loss
among professional musicians by making several sound-level measurements of orchestral
performance. Their sound-level recordings showed that although most transient peaks were
below the Occupational Safety and Health Administration’s (OSHA) maximum permissible peak
limit of 140 dBSPL (United States Department of Labor – Occupational Safety and Health
Administration, 2009) the measured equivalent continuous sound level (Leq) were between 79
and 99 dBA, with an average of 89.9 dBA. The authors concluded that based on the musician’s
average 15 hour work week, excluding the hours of personal practice, the eight-hour time
weighted average noise exposure levels were 85.5 dBA. OSHA standards state that if individuals
are subjected to sounds exceeding 85 dBA (eight hour time weighted average), a hearing
conservation program must be in place for the employees (United States Department of Labor –
Occupational Safety and Health Administration, 2009). The authors concluded that given these
sound level measurements and the importance of accurate musical perception among musicians,
a hearing conservation program is needed for the professional musicians of the Chicago
Symphony.
In addition to measuring the risk of noise-induced hearing loss, Royster and colleagues
wanted to examine the incidence of hearing loss by measuring the hearing sensitivity of each
musician. Several musicians of the Chicago Symphony exhibited evidence of a cochlear noise-
induced injury by having a notched hearing loss between 2000 Hz and 6000 Hz. The authors
divided up these musicians into different instrumental sections to examine whether there was
preponderance for hearing loss among musicians of differing instruments. The results revealed
that when the audiometric thresholds were corrected for age-related hearing loss using the ISO
7029 presbycusis data, musicians in the brass, woodwinds, and percussion sections had on
5

Moore
average the most significant hearing loss, whereas cellists, pianists, and harpists had the least
amount of hearing loss. Although this article addressed the risk and incidence of noise-induced
hearing loss, it did not include data on the musician’s personal listening or musical practice
habits outside of the symphony or the personal use of hearing protection. It is unknown whether
musicians, once aware of the noise-induced injury risk, would perceive benefit from wearing
hearing protection.
In 2005, Laitinen and colleagues looked at factors affecting the use of hearing protectors
among classical musicians because even though sound levels exceeded Finland’s national action
level of 85 dBA, most musicians did not seek the use of hearing protective devices. Results from
a questionnaire showed that once musicians are affected by hearing loss or tinnitus, they sought
the use of hearing protection. For musicians lacking any perceived symptoms of noise-induced
hearing loss, there is a dramatic decline in the use of hearing protection. The questionnaire also
showed that although musicians expressed concern regarding hearing loss, the number of
musicians actually using protection is still small. When hearing protection is used, it is most
commonly only during orchestra rehearsals, but not during their performances or their individual
practices. The results from this study suggest that there is a need for hearing conservation
awareness and education among musicians. It could be hypothesized that the musicians do not
seek the use of hearing protection because a) they feel that the intensity from their
instruments/sections is loud enough to cause cochlear damage b) they are not aware of proper
hearing protection devices and methods or c) they feel that hearing protection plugs negatively
impact their playing ability and perception of sound.
While research regarding hearing loss and noise exposure levels have focused on
professional music groups, there is limited data on noise exposure levels for younger musicians.
6

Moore
Although many of the same musical instruments are used across the populations, factors such as
skill level and the amount of playing time differ considerably. Phillips and Mace (2008)
examined the average sound levels and percentage of daily dose of noise exposure in student
practice rooms to determine the need for hearing conservation for musicians. Measurements
were taken on 40 students with a dosimeter clipped to the musician’s shoulder. With an average
measurement time of 47 minutes, the authors found an average dBA of 87-95. Using the
National Institute for Occupational Safety and Health’s (NIOSH) standards for maximum
allowable noise exposure doses, they found that 48% of participating musicians exceeded the
allowable sound exposure when practicing in university practice rooms. NIOSH’s recommended
exposure limits centers around 85 dBA time weighted average for eight hours with a three dB
exchange rate.
Miller, Stewart, and Lehman (2007) looked specifically at the student musician
population to gain information about their musical practice and playing habits. Miller and
colleagues found through their sound measurements that although student musicians are not
subject to OSHA noise exposure regulations, they are still exposed to noise levels above 90 dBA,
which exceeds the level that would mandate the use of hearing protective devices and require
participation in a hearing conservation program.
In addition to their sound-level measurements, the authors distributed questionnaires to
the student musicians to learn about their knowledge of hearing conservation and their use of
hearing protective devices. Those results showed that although 74% of the participants had been
taught about the effects of noise on hearing and health, 78% of the total respondents did not wear
hearing protection. Of the 22% of participants that reported wearing hearing protection, none
wore protection 100% of the time. This low use of hearing protection among student musicians
7

Moore
have been found in other studies as well (Chesky, Pair, Yoshinura, and Landford, 2009). In
addition to low use of hearing protection Miller, Stewart, and Lehman (2007) found that 63% of
student musicians reported tinnitus in their everyday lives, which suggests potential early
damage to the auditory structures. Overall, the study indicated that university student musicians
appear to be at risk for noise-induced hearing loss and supported the need for on-going hearing
conservation programs to educate student musicians about the dangers of excessive exposure to
loud music as well as on-going education and encouragement on the use of hearing protective
devices.
In an interesting study that focused on the loudness perception and use of hearing
protection among college students, Chesky et al (2009) asked college-aged participants to rate
the loudness of simulated “nightclub” music with and without the use of ER-20 musician plugs.
The average intensity level of the simulated nightclub environment was 96 dBA Leq. They found
that 79% of the total participants thought that the music used in the study was too loud without
the use of hearing protective devices. The authors divided their group of college students into
those that were declared music majors and those that were not declared music majors. The data
showed that a larger majority of the music major group rated the music as too loud and would
consider wearing hearing protection when in those situations. Although the results were not
significant, there was a trend that the music majors may be able to approximate the intensity
level of the music more accurately than the non-music major group. These findings suggest that
those who have musical backgrounds might have an increased awareness or sensitivity compared
to those who do not. There was a follow up questionnaire to the group of music majors to see if
they are or would consider wearing the ER-20 earplugs while playing their own instrument.
Although 85% of the 132 music majors stated that they have worn their earplugs since receiving
8

Moore
them, less than half (42%) of the student musicians reported that they used the earplugs during
their musical practices. The group of student musicians did not view the use of ER-20 musician
earplugs during musical performance favorably. Perhaps this negative view of the use of hearing
protection during musical performance is related to physical effects such as the occlusion effect
from the earplug, or related to perceptual effects such as the musicians have a harder time
monitoring their own and other instruments. It is also possible that some student musicians do
not perceive the intensity levels to be loud enough to warrant the use of hearing protection. In
their study looking at the factors influencing use of hearing protection among professional
musicians, Laitinen and colleagues (2005) found that over half of the musicians rated group
rehearsals and performances “noisy.” Besides these two articles, little information is in the
literature regarding musicians’ perception of loudness.
Because of the limited research in the area of student musicians, this research is focused
on that specific population. The first aim of this project is to see if student musicians could
reliably rate the loudness of their own music prior to examining the relationship between
loudness and intensity. By verifying reliability, the researcher can feel confident that the
loudness ratings from participants are accurate and repeatable and can, therefore, conclude that
data is consistent.
Most musician-based research measures the intensity of orchestral music being played by
professional musicians in acoustically treated concert halls. A second aim of this study is to
collect a series of noise measures from student musicians playing in the classrooms or halls
provided by their high school or university. These measures will not only add to the literature
base pertaining to the intensity of various instruments played by a variety of musicians of
differing skill levels, but will also add to the literature base regarding student-level musicians.
9

Moore
The third aim of this project is to evaluate student musicians’ perception of loudness and
how it relates to the measured sound level of their own instrument and the entire orchestra. It
has been established that musicians represent a unique group when it comes to hearing
conservation. Because musicians enjoy their craft, they may not be aware of the potential harm
in the intensity level of their instruments. In addition, musicians may not be aware of appropriate
hearing protection plugs that will allow them to monitor their instrument at a safe volume level.
Perhaps in examining the relationship between the musician’s perception of loudness and actual
intensity, researchers can develop strategies in educating musicians on hearing protection
options.
10

Moore
CHAPTER II
Methods
Participants
Criteria for Participant Inclusion
In order for individuals to be eligible to participate in this study, they had to be over the
age of 18 and a musician in one of the participating orchestras. Participants were excluded if they
fell below the desired age, were not a member of one of the participating orchestras, or requested
to not be included in the study.
Participant Recruitment
Human Research Protection Office (HRPO) approved recruitment letters were
electronically mailed to musical instructors of universities in the St. Louis area. Three university
musical directors responded and agreed to participate. However, due to time constraints, data
was collected from Washington University in St. Louis Symphony Orchestra only. Once
permission was obtained from the Washington University Symphony Orchestra conductor, the
author visited the first group rehearsal of the symphony orchestra to discuss the capstone project
and recruit participants using the HRPO approved script. The participants were informed of the
goal of the study, participant inclusion criteria, the methodology of the project, and information
about the risks of participating. The individuals who agreed to participate in the study were
asked to fill out the project’s questionnaire as a form of consent to participate.
11

Moore
Participant Demographic Information
The Washington University in St. Louis Symphony Orchestra comprised of 102
musicians. Although all were encouraged to participate, only 23 musicians from the orchestra
agreed to participate in this project. Participants ranged from age 18 to 39 with one individual
who was 61 (16 males and 7 females). Though this participant was an outlier, he was still
included in the study because he met all of the inclusion criteria. It is important to note that this
musician verbally told the author that he suffers from presbycusis and constant bilateral tinnitus.
Table 2.1 displays the age, instrument, orchestral section, and orchestra chair position within the
section for each of the 23 participants.
Age of Participant Instrument Orchestral Section Section Chair 21 Bass String 2 19 Bassoon Woodwind 3 19 Cello String 7 20 Cello String 3 21 Cello String 6 22 Cello String 1 19 Clarinet Woodwind 2 26 Flute Woodwind 1 21 French Horn Brass 4 39 French Horn Brass 2 19 Oboe Woodwind 1 22 Trumpet Brass 1 22 Trumpet Brass 2 22 Trumpet Brass 3 32 Tympani Percussion 3 61 Viola String 5 21 Viola String 2 18 Violin String 16 20 Violin String 9 20 Violin String 10 24 Violin String 9 22 Violin String 1 18 Violin String 7 Table 2.1: Participant demographic information including participant’s age, instrument, orchestral section, and orchestra chair number.
12

Moore
Experimental Procedures
Questionnaire
The first experiment of this capstone project involves testing the reliability of a created
questionnaire. Each of the 23 musicians was required to complete a questionnaire containing
questions related to the student musician’s musical interests, how and when music is listened to,
the musicians’ current and past instrument selection, musical practice habits, loudness ratings of
their own and other instruments, their hearing protection use, and whether or not they have
experienced any otologic symptoms, such as temporary threshold shifts or tinnitus.
The questionnaire took five to ten minutes for the participant to complete and was completed
either in person or via electronic mail. Approximately two to six weeks later, the same
questionnaire was re-administered to participants in order to verify test-retest reliability of the
participants’ answers. Appendix A contains the complete questionnaire that was given to each
participant. The questionnaire was comprised of individual questions the author had for the
musicians as well specific questions from the Munich Music Questionnaire (MMQ)
(Brockmeier, 2002) and loudness rating scales that were used in both the Loudness Contour Test
(LCT) (Cox, Alexandar, Taylor, & Gray, 1997) and the Profile of Aided Loudness (PAL)
(Palmer, Mueller, and Moriarty, 1999).
The Munich Music Questionnaire was developed by S.J. Brockmeier to record the music
listening habits of individuals with post-lingual deafness after cochlear implantation. The
questionnaire in its entirety includes sections covering past and present musical activities. It also
gathers information on implant users’ enjoyment of various types of music, different musical
instruments, and the amount of participation in musical activities. Different styles of music, such
as pop and jazz, were included in questions so as to provide a whole range of structural
13

Moore
characteristics found in music, such as rhythm and melody. In addition, users were also asked
about specific instruments. The instruments chosen for the questionnaire covered a variety of
sound production and frequency ranges (Brockmeier, Grasmeder, Passow, Mawmann, Vischer,
Jappel, Baumgartner, Stark, Muller, Brill, Steffens, Strutz, Kiefer, Baumann, and Arnold, 2007).
Currently, this questionnaire is distributed by Med-El Medical Electronics. The questions that
were chosen from the MMQ provided information on musicians’ musical preferences and
background. These questions did require some rewording as the original questions were aimed at
cochlear implant users rather than normal-hearing users. The altered MMQ questions are
numbers one through six, eight, 13, and 14 in the current study’s questionnaire (See Appendix
A).
Because one of the aims of this study was to look at the musicians’ perception of
loudness in regards to their instrument and the entire orchestra, the questionnaire also asked the
musicians to rate their perception of the loudness of their instrument, their section, the sections
around them and the entire orchestra together. They were also asked to rate how loud they liked
to listen to music using personal devices, such as MP3 players or Walkmans. To establish this
perception, a loudness scale that was developed for the Loudness Contour Test (LCT) (Cox,
Alexandar, Taylor, & Gray, 1997) and used by the Profile of Aided Loudness (PAL) was used to
evaluate loudness perception (Palmer, Mueller, and Moriarty, 1999). Participants are asked to
rate their perceived loudness of a sound on a seven-point scale with one being very soft and
seven being uncomfortably loud. Table 2.2 contains the loudness rating scale from the LCT and
the PAL.
14

Moore
Loudness Scale Corresponding Description
1 Very soft
2 Soft
3 Comfortable, but slightly soft
4 Comfortable
5 Comfortable, but slightly loud
6 Loud, but OK
7 Uncomfortably loud
Table 2.2 - Loudness rating scale
While the LCT measures the loudness rating of participants right after they hear either a
tonal stimulus or five seconds of connected discourse from the Connected Speech Test (Cox,
Alexandar, Taylor, & Gray, 1997), the PAL is used for listeners to rate the loudness of specific
environmental sounds from their auditory memory. The PAL had a good test-retest reliability,
showing that participants were able to rate the loudness of specific sounds from auditory memory
consistently (Palmer, Mueller, and Moriarty, 1999). Additional questions regarding incidence of
tinnitus and temporary threshold shifts, use of hearing protection, and the musicians’ perception
of whether or not their music could cause hearing loss were also added to the questionnaire.
Sound Level Measurements
The second experiment of this project involved the sound level recordings from each of
the participants. The sound level measurements included dBA Leq, which is the equivalent sound
level that contains the same energy as the variable sound level of the music, and a measurement
of sound level peaks in peak dBSPL. These measurements were made over several individual
15

Moore
practice and group rehearsal sessions. Each measurement was approximately 15 minutes in
length. A Larson Davis 706 noise dosimeter (serial number 17003) was used to record all sound
levels for this project. Before each day of recording, the dosimeter was calibrated and pre-set to
turn on and off. The recording parameters for the dosimeter were set as:
Weighting: A Detector: Slow Unweighted Peak: On Threshold: 0 dB Gain: 0 Criterion: 90 dB Exchange Rate: 3 dB A-weighted decibels were used because it correlates to how the human ear processes
sound. It has also been proven to correspond well to the risk of injury to hearing from long
exposure to loud noises of different spectral compositions (Davis and Silverman, 1978). In
addition, a three dB exchange rate was used in order to meet NIOSH’s recommended standards
(NIOSH, 1998).
The recordings included measures of the musician playing his or her instrument alone,
and the musician playing his or her instrument in the entire orchestra. During these
measurements, the dosimeter microphone was placed on the right collar of the participant and the
levels were recorded for fifteen minutes as this length of time was sufficient enough to capture
the variety of levels in the musical piece. The collar was used for placement because the
researcher felt that the collar best represented the musician’s perception of their instrument. To
be consistent, the right side collar was chosen for the microphone placement. Although authors
Royster, Royster, and Killion, (1991) found a 6-8 dBA difference when they evaluated right- and
left-side microphone placement with violin players, the right side was still chosen for those
instruments that created an increased exposure on the left side due to ease of placement with
16
Moore
minimal distraction during the rehearsal recordings.
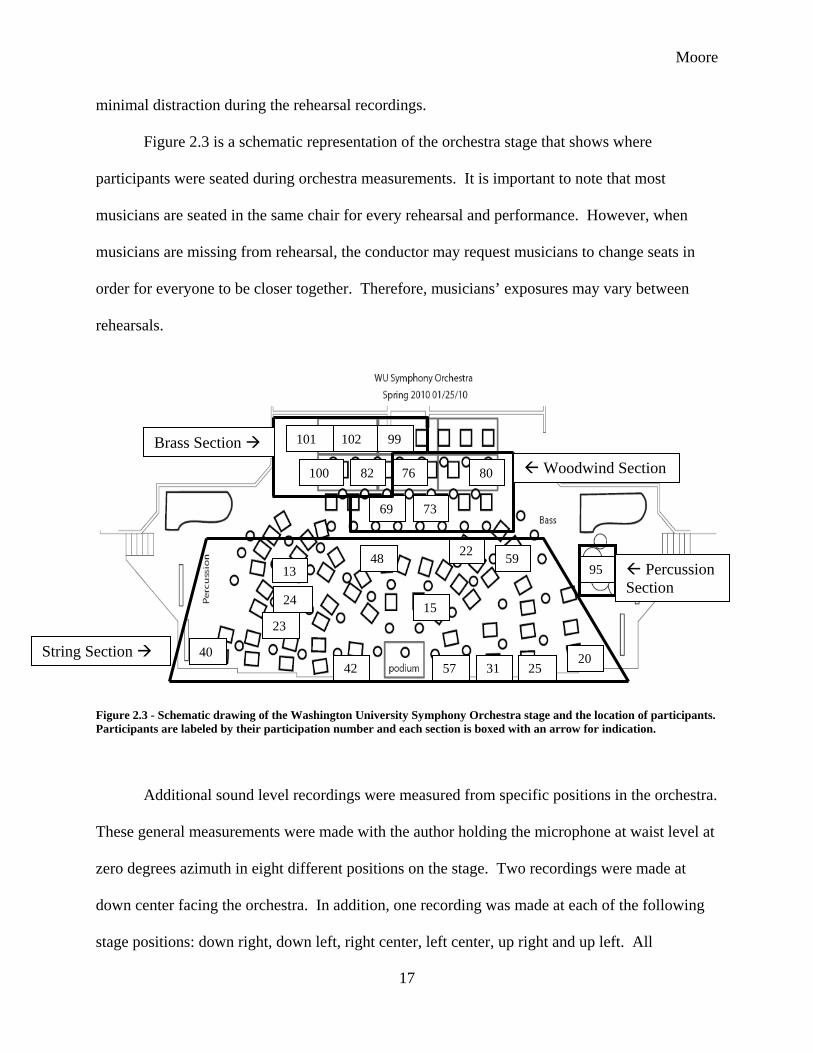
Figure 2.3 is a schematic representation of the orchestra stage that shows where
participants were seated during orchestra measurements. It is important to note that most
musicians are seated in the same chair for every rehearsal and performance. However, when
musicians are missing from rehearsal, the conductor may request musicians to change seats in
order for everyone to be closer together. Therefore, musicians’ exposures may vary between
rehearsals.
15
13
40
23
24
42
48
57 31 25
59 95
102
20
76
73 69
22
82 100 80
101 99
Woodwind Section Brass Section
Percussion Section
String Section
Figure 2.3 - Schematic drawing of the Washington University Symphony Orchestra stage and the location of participants. Participants are labeled by their participation number and each section is boxed with an arrow for indication.
Additional sound level recordings were measured from specific positions in the orchestra.
These general measurements were made with the author holding the microphone at waist level at
zero degrees azimuth in eight different positions on the stage. Two recordings were made at
down center facing the orchestra. In addition, one recording was made at each of the following
stage positions: down right, down left, right center, left center, up right and up left. All
17

Moore
measurements were made with the microphone facing towards the musicians. The recording
length of the orchestra measurements was also similar to the length of the participant recordings.
Figure 2.4 is a schematic drawing of the Washington University in St. Louis Symphony
Orchestra stage. The icons on the layout indicate where the general orchestra measurements
were made along with the direction of the recording microphone.
RC LC
DC
UL
DC
UR
DR DL
Figure 2.4 - Schematic of the orchestra stage. The icons mark the positions of the general measurements along with the direction of the recording microphone: down center (DC), down right (DR), down left (DL), right center (RC), left center (LC), up right (UR), and up left (UL).
Because the dosimeter was pre-set to turn on and off, all sound level measurements were
timed by the researcher using a Seiko quartz wristwatch that included seconds displayed on the
face. Once recording was finished for the day, data were downloaded in one-second increments
via Blaze software into an Excel spreadsheet and stored into a password-locked computer.
The Blaze software calculated the average or equivalent continuous A-weighted sound
18

Moore
level (Leq), for every recording (NIOSH, 1998).
dBA Leq 10 ∑ 10 / i = observations Li = SPL in dBA of each observation (1)
However, because the dosimeter was used over several hours, not all recordings were
relevant to this project. Therefore, each recording pertinent to this study had to be re-averaged to
get an average Leq of the desired participant recording. In order to do this, the author had to take
the Leq value (in decibels) for every second of the participant’s recording and switch it from
decibel form to linear form and re-average the data for the desired recording. That average was
then converted back into decibels for a new Leq value. This recalculation was done for all
participant and general recordings.
Location
Orchestra measurements were made during orchestra rehearsal at the E. Desmond Lee
Concert Hall at the 560 Trinity Avenue music building. Individual measurements were made in
sound-treated practice booths either at the 560 Trinity Avenue music building or Tietjens Music
Building on the Washington University in St. Louis Danforth Campus.
Music Recorded During Project
During the recordings, the Washington University in St. Louis Symphony Orchestra
performed three different musical pieces: Tchaikovsky’s Romeo and Juliet Suite,
Rachmaninoff’s Piano Concerto Number 2, and Tchaikovsky’s Number 4.
19

Moore
CHAPTER III
Results
Questionnaire Analysis
The questionnaire data was analyzed using Pearson correlation to see if there was a
strong correlation or good test-retest reliability between the first and second administration.
Pearson correlation was used because it is the most common correlation test and best reflects the
degree in which these variables are related. The questionnaires were also examined to measure
the relationship between the perceived loudness measure and the actual intensity of the
musicians’ playing practices. All 23 participants completed the same questionnaire at two time
points spaced two to six weeks apart. The results of each questionnaire were analyzed for test-
retest reliability using an intraclass correlation (ICC). An ICC is a test of difference and
correlation (Shrout and Fleiss, 1979). An ICC of 0.683 was obtained between the first and
second administration of the questionnaire. The following labels are used to classify reliability
ratings: 0.00 to 0.10-virtually none, 0.11 to 0.40-slight, 0.41-0.60-fair, 0.61-0.80-moderate, and
0.81-1.0-excellent (Shrout, 1998). When extracting only loudness ratings, ICC Pearson
correlation was .754 which is also consistent with moderate test-retest reliability. Question 18 of
the questionnaire regarding musicians’ perception of loudness regarding their individual
instrument had the highest test-retest reliability with .847 which is significant at the .01 level (2-
tailed). Question 20 regarding the loudness perception of the percussion section had the lowest
test-retest reliability with .487. However, that correlation is still significant at the .05 level (2-
tailed). Overall, the questionnaire used in this study exhibited moderate test-retest reliability. In
addition, no differences were found between the first and second administration of the
20

Moore
questionnaire. Therefore, the questionnaire was not only correlated but also similar between
administrations.
Questions one through six asked the musicians about their musical interests and
preferences. Results from these questions showed that musicians essentially enjoyed listening to
music and listen to it in a variety of places, such as on an MP3 player or on the radio in the car.
They also enjoyed listening to a variety of music. The subjects also did not have a preference for
solo instruments versus an entire orchestra. In addition, musicians listened to music for a variety
of reasons including for pleasure and emotional satisfaction. See Appendices B, C, and D for a
breakdown of responses for questions one through six.
Question eight of the questionnaire asked participants what instruments they were fluent
in playing. They were given 20 instrument options as well as an option to list additional
instruments under “other.” The participants were encouraged to check all applicable answers for
the question. Figure 3.1 shows the results for that question. Only seven participants noted that
they were not fluent in any other instrument besides the one they play for the orchestra. Nine
participants were fluent in two instruments while three participants were fluent in three
instruments. Four subjects noted fluency in at least four instruments, including the instrument
they play for the orchestra. The most common instrument musicians were fluent in playing apart
from the one played with the orchestra was the piano. Seven individuals listed additional
instruments under “other.” Those instruments include the viola, French horn, piccolo, English
horn, percussion, and the steel pan. Some participants were fluent in instruments that were
similar to the instrument they played for the orchestra. For example, the subject who played the
tympani in the orchestra was also fluent in the drums, piano, xylophone, cymbals, and steel pan.
In addition, the participant who played the flute was also fluent in the piccolo.
21

Moore
0123456789
10
1 instrument 2 instruments 3 instruments 4+ instruments
Q8: Please check all instruments that you are fluent in playing.
Num
ber o
f Respo
nses
Number of Instruments
Figure 3.1 – Participants’ responses to Question 8 regarding fluency of instruments.
The participants were also asked in which section(s) they have previously played in
question nine. For these questions, the brass, string, woodwind, and percussion sections were the
choice options and subjects were allowed to check all applicable answers. 13 subjects had
played in the string section while only seven subjects had previously played in the brass section.
On the other hand, only six subjects had played in the woodwind section and only six subjects
had previously played in the percussion section.
Questions 13 and 14 asked the musicians if they had received musical education outside
of school, including instrument and voice lessons, and the length of that education. Results
showed that 21 participants noted receiving training outside of school. Only 1 of those
musicians had less than three years of training while the other 20 subjects had more than three
years of training.
Question 15 was interested in whether or not the subjects played in other ensemble(s) or
22

Moore
band(s) outside of the participating orchestra. Of the 23 participants, only 15 of the musicians
reported playing with another ensemble in addition to playing in the Washington University
Symphony Orchestra.
If subjects answered that they did play with another ensemble, Questions 16 and 17 asked
what type of music was played and how often the subject plays or practices with the other
ensemble. Figure 3.2 shows the participants’ responses regarding those questions related to
other ensembles. For question 16 regarding type of music played, subjects were asked to check
all applicable answers. All 15 participants noted classical music as a music genre of the other
ensemble(s). Jazz/blues was the second most common with seven participants noting that variety
of music. Religious and pop music each had three participants playing that genre. Two
participants each noted playing rock and opera/operetta music in their other ensembles. Only
one participant noted playing music to dance to and only one subject reported playing
folk/country music.
Question 17 wanted information about the total hours per week the subject plays with the
other ensemble. Of the 15 participants, nine typically played between three and eight hours per
week with the other ensemble or band while only six subjects played less than three hours per
week. Only one subject noted playing more than eight hours per week with the other ensemble.
23

Moore
02468
10121416
Classical M
usic
Ope
ra/O
peretta
Religious M
usic
Folk/Cou
ntry M
usic
Pop
Rock
Jazz/Blues
Music to
dance to
Less th
an 3 hou
rs/w
eek
Betw
een 3‐8 ho
urs/week
More than
8 hou
rs/w
eek
Q16: What type of music do you play with your other ensembles? Q17: How many hours per week do you practice and/or play with the other ensembles?
Total N
umbe
r of R
espo
nses
Figure 3.2 - Participants’ responses to Questions 16 and 17 regarding playing with other ensembles/bands/etc…
Musicians were also asked to choose which of the twenty listed instruments they thought
were the “softest” and “loudest” for questions 24 and 25. See Appendix A for a complete list of
instruments. Figure 3.3a and 3.3b shows the participants’ responses for the softest and loudest
instrument. Results showed that only seven of the twenty instruments were chosen as the softest
instrument. 39% of the 23 participants thought the harp was the softest instrument followed by
the flute and clarinet each with 17%, the recorder and bass each with 9%, and the guitar and
violin each with 4%. On the other hand, only six of the twenty instruments were chosen as the
loudest instrument. 43% of the 23 participants thought the trumpet was the loudest instrument
followed by the cymbals with 22%, the drum kit with 17%, the trombone with 9%, and tympani
with 4%. One individual (4%) chose “other” as the loudest, specifying the English horn.
24

Moore
0
10
20
30
40
50
60
70
80
90
100
Harp Flute Clarinet Recorder Bass Guitar Violin
Percen
tage
of R
espo
nses
"Softest" Instrument
Figure 3.3a – Participants’ responses to Question 24 regarding their perception of the “softest” instrument
0
10
20
30
40
50
60
70
80
90
100
Trumpet Cymbals Drum Kit Trombone Tympani Other
Percen
tage
of R
espo
nses
"Loudest" Instrument
Figure 3.3b – Participants’ responses to Question 25 regarding their perception of the “loudest” instrument
Questions 26 through 29 of the questionnaire asked musicians about certain otologic
25

Moore
symptoms associated with noise exposure. Figure 3.4 shows the all of the responses to questions
26 through 29. Results showed that more than 90% of the musicians felt that they were “rarely”
or “never” bothered by the loudness of their instrument. Only 9% noted that they were bothered
“sometimes.” When asked if they ever experienced ringing in their ears or a temporary hearing
loss after a rehearsal or performance, 52% said “never,” 30% said “rarely,” and 13% said
“sometimes.” It is important to note that one participant (4%) said they “always” experience
ringing. However, that participant verbally told the researcher that he had constant tinnitus and
therefore, the ringing could not be attributed to playing alone. 96% of subjects answered “never”
when asked about the frequency of temporary hearing loss after playing. Only 4% noted that
they experience a temporary hearing loss after practicing or playing only one to two times per
week.
0102030405060708090100
Always
Sometim
es
Rarely
Never
Always
Sometim
es
Rarely
Never
Always
Sometim
es
Rarely
Never
Never
1‐2 tim
es/w
eek
3‐5 tim
es/w
eek
5 or m
ore tim
es/w
eek
Every tim
e I
practice/pe
rform
Q26: Have you ever been bothered by the
loudness of your instrument?
Q27: Have you ever had ringing in your ears
after practicing/performing?
Q28: Have you ever experienced a
temporary hearing loss after
practicing/performing?
Q29: How often do you experience a temporary hearing loss after a
practice/performance?
Figure 3.4 – Participants’ responses to Questions 26 through 29 regarding occurrence of otologic symptoms associated with noise exposure.
The researcher also wanted additional information on percentage and frequency of use of
26

Moore
hearing protective devices while practicing or performing. Questions 30 and 31 covered those
topics. 19 of the 23 musicians do not wear hearing protection while practicing or performing. In
addition, one musician “rarely” wears protection and two musicians “sometimes” wears hearing
protection. When asked to provide information on what type of hearing protection is used, the
three musicians that reported use of hearing protection noted that the foam or silicone hearing
protection plugs were the most common.
The last question on the questionnaire was whether or not the musicians thought their
music could cause hearing loss. The question was added to the questionnaire by the researcher
to gauge the musicians’ opinion on the intensity of their music and its ability to cause damage to
the body’s hearing structures. Results showed that thirteen participants said “yes” and thought
their music could cause hearing loss while the remaining ten musicians said “no.”
Sound Level Measurement Analysis
Complete sound measurements for instruments and the orchestra were obtained from all
15 musicians. The other eight musicians have partial sound measurements. The sound level
measurements were analyzed and tabulated so as to give the average dBA Leq sound levels and
peak levels of each instrument, as well as the entire orchestra. Table 3.9 shows the individual
and orchestra average Leq and peak level measurements by participant number and instrument for
all 23 participants. Instrument Leq levels ranged from 71.8 dBA to 101.1 dBA with an average
peak range of 102.3 dBSPL to 131.6 dBSPL. There was one average peak level measured at
158.3 dBSPL. This level was contributed to microphone artifact. On the other hand, average
orchestra Leq levels ranged from 71.7 dBA to 93.1 dBA with an average peak range of 102.8
dBSPL to 130.1 dBSPL. The bass provided the softest measurement for average instrument Leq
27

Moore
while the flute contributed the softest average orchestra Leq. The trumpet measurements were the
highest for both instrument and orchestra average Leq. The viola had the highest average peak
level for instrument recordings while the violin had the highest average peak level for orchestra
recordings. It is important to note that Participant 99, who had the highest instrument Leq
average, told the author after the recording that he was purposefully playing as loud as possible
instead of at the normal practice level that was requested by the researcher.
Participant Number
Instrument Average Instrument Leq
Average Instrument Peak Level
Average Orchestra Leq
Average Orchestra Peak Level
13 Violin 87.2 dBA 111.0 dBSPL 84.5dBA 130.1 dBSPL 15 Viola xxxxxxxxxxx xxxxxxxxxxxxxx 71.8dBA 111.7 dBSPL 20 Cello 83.8 dBA 107.5 dBSPL 78.1 dBA 102.8 dBSPL 22 Viola 91.0 dBA 131.6 dBSPL 85.7 dBA 110.7 dBSPL 23 Violin 84.8 dBA 129.5 dBSPL 87.4 dBA 128.2 dBSPL 24 Violin 86.5 dBA 118.3 dBSPL 90.4 dBA 108.9 dBSPL 25 Cello xxxxxxxxxxx xxxxxxxxxxxxxx 84.3 dBA 105.0 dBSPL 31 Cello 84.4 dBA 107.4 dBSPL xxxxxxxxxxx Xxxxxxxxxx 40 Violin 72.0 dBA 127.9 dBSPL 79.5 dBA 110.8 dBSPL 42 Violin 86.4 dBA 105.5 dBSPL 88.0 dBA 110.0 dBSPL 48 Violin 94.8 dBA 126.9 dBSPL 72.2 dBA 104.0 dBSPL 57 Cello 86.5 dBA 105.4 dBSPL 86.1 dBA 108.5 dBSPL 59 Bass 71.8 dBA 102.3 dBSPL* xxxxxxxxxxx Xxxxxxxxxx 69 Flute 80.9 dBA 121.4 dBSPL* 71.7 dBA 111.8 dBSPL 73 Oboe 86.3 dBA 108.9 dBSPL xxxxxxxxxxx Xxxxxxxxxx 76 Clarinet 92.1 dBA 106.0 dBSPL 78.2 dBA 112.9 dBSPL 80 Bassoon 87.3 dBA 104.7 dBSPL 83.1 dBA 108.6 dBSPL 82 French
Horn xxxxxxxxxxxxxxxxxxxxxx
xxxxxxxxxxxxxxxxxxxxxxxxxxxx
92.4 dBA 120.1 dBSPL
95 Tympani 95.0 dBA 120.0 dBSPL xxxxxxxxxxx Xxxxxxxxxx 99 Trumpet 101.1 dBA 158.3 dBSPL 89.7 dBA 110.6 dBSPL 100 French
Horn 96.0 dBA 114.6 dBSPL 91.7dBA 116.1 dBSPL
101 Trumpet xxxxxxxxx xxxxxxxxxxxxxx 93.1 dBA 111.5 dBSPL 102 Trumpet 91.9 dBA 109.6 dBSPL 89.8 dBA 114.5 dBSPL Table 3.9 - Average Leq (in dBA) and average peak (in dBSPL) levels for all participants. Xxxx = denotes missing data. * = data that had only one value and is, therefore, not averaged.
Figure 3.10 is a histogram that represents the number of total instrument and orchestra
28

Moore
measurements that fell into four dBA Leq categories. The measurements are broken up by
section and general orchestra measurements and include a total bar that combines everything in
that decibel category. All 23 participants’ measurements were included in the histogram. 11 of
the recordings fell in the 71-80 dB range which correlates to a “5,” or “comfortable, but slightly
loud.” 25 recordings fell in the 81-90 dB range which is associated with a “5” and “6” with “6”
being “loud, but ok.” The other 10 recordings fell in the 91-102 dB range which correlates to a
“6” on the LCT.
0
5
10
15
20
25
60‐70 dBA 71‐80 dBA 81‐90 dBA 91‐102 dBA
Freq
uency of M
easuremen
ts
dBA Category Ranges
Strings
Woodwinds
Brass
Percussion
Entire Orchestra
Total
Figure 3.10 - Histogram of the measurements in each dBA Leq set. All 23 participants’ measurements were categorized by section. Entire orchestra measurements were measurements made by the author and those values can be seen in Table 3.25.
Because there were several participants that played the same instrument, the measured
intensity of groups of instruments was taken. Table 3.11 shows those average Leq and average
peak levels. The average group Leq ranged from 85.0 dBA to 98.6 dBA for instrument
measurements and from 84.0 dBA to 92.0 dBA for orchestra measurements. Peak levels ranged
from 106.9 to 125.4 dBA for instrument peak levels and from 106.1 dBSPL to 124.6 dBSPL for
orchestra peak levels. The average peak level for trumpets was 155.4 dBSPL. However, that
figure may be affected by microphone artifact and therefore may not be valid.
29

Moore
Instrument Average Instrument Leq
Average Instrument Peak Levels
Average Orchestra Leq
Average Orchestra Peak Levels
Cello 85.0 dBA 106.9 dBSPL 84.0 dBA 106.1 dBSPL French Horn xxxxxxxxxxxx xxxxxxxxxxxxxxxxx 92.0 dBA 119.0 dBSPL Trumpet 98.6 dBA 155.4 dBSPL 91.1 dBA 112.5 dBSPL Viola xxxxxxxxxxxx xxxxxxxxxxxxxxxxx 82.8 dBA 111.2 dBSPL Violin 89.3 dBA 125.4 dBSPL 86.4 dBA 124.6 dBSPL
Table 3.11 - Average Leq (in dBA) and average peak (in dBSPL) levels for groups of instruments. Xxxx = denotes missing data.
Leq measurements were also calculated to determine the Leq value for two-hour and eight-
hour equivalent exposures. Table 3.12 represents those values for the instrument measurements.
Leq two- and eight-hour equivalents were not calculated for the orchestra measurements because
the values were similar to the Leq 15-minute instrument recordings. Two-hour exposures were
projected because the length of the Washington University Symphony Orchestra rehearsal is
approximately two hours and ten minutes. Though the musicians do not play the entire
rehearsal, rehearsal time combined with time in which subjects tune and/or practice their
instruments equates to two hours. Eight-hour exposures were projected because that can more
approximate exposure levels for an average work day. All Leq measurements for the two-hour
and eight-hour equivalents were calculated by using NIOSH’s three dB exchange rate criteria
(NIOSH, 1998). The average Leq equivalent for a two-hour exposure ranged between 62.8 dBA
to 92.1 dBA. On the other hand, the average Leq equivalent for an eight-hour exposure for
instruments ranged from 56.8 dBA to 86.1 dBA. When compared to NIOSH’s criteria of 85
dBA for an eight-hour exposure, 1 of the 19 participants exceeded NIOSH’s recommended level
of 91 dBA at the two-hour equivalent exposure. That same participant exceeded the
recommended level of 85 dBA at the eight-hour equivalent exposure (NIOSH, 1998).
30

Moore
Table 3.12 – The Leq values for 15-minute recordings and the projected Leq values for 2-hour and 8-hour exposures for instrument measurements (in dBA). Xxxx = denotes missing data.
Participant Number
Instrument Average Instrument Leq– 15 minutes
Average Instrument Leq- 2-hour equivalent
Average Instrument Leq – 8-hour equivalent
13 Violin 87.2 dBA 78.2 dBA 72.2dBA 15 Viola xxxxxxxxxxx xxxxxxxxxx 46.8dxxxxxxxx
20 Cello 83.8 dBA 74.8 dBA 68.8 dBA 22 Viola 91.0 dBA 82.0 dBA 76.0 dBA 23 Violin 84.8 dBA 75.8 dBA 69.8 dBA 24 Violin 86.5 dBA 77.5 dBA 71.5 dBA 25 Cello xxxxxxxxxxx xxxxxxxxxx 59.3 dBAxxxxx
31 Cello 84.4 dBA 75.4 dBA 69.4 dBA 40 Violin 72.0 dBA 63.0 dBA 57.0 dBA 42 Violin 86.4 dBA 77.4 dBA 71.4 dBA 48 Violin 94.8 dBA 85.8 dBA 79.8 dBA 57 Cello 86.5 dBA 77.5 dBA 71.5 dBA 59 Bass 71.8 dBA 62.8 dBA 56.8 dBA 69 Flute 80.9 dBA 71.9 dBA 65.9 dBA 73 Oboe 86.3 dBA 77.3 dBA 71.3 dBA 76 Clarinet 92.1 dBA 83.1 dBA 77.1 dBA 80 Bassoon 87.3 dBA 78.3 dBA 72.3 dBA 82 French Horn xxxxxxxxxxxxx xxxxxxxxxx 67.4 dBAxxxxx 95 Tympani 95.0 dBA 86.0 dBA 80.0 dBA 99 Trumpet 101.1 dBA 92.1 dBA 86.1 dBA 100 French Horn 96.0 dBA 87.0 dBA 81.0 dBA 101 Trumpet xxxxxxxxx xxxxxxxxx 68.1 dBAxxxxx 102 Trumpet 91.9 dBA 82.9 dBA 76.9 dBA
For all of the orchestra measurements, the recordings were left in its entirety so when the
conductor stopped rehearsal to make comments or restart certain parts of the piece, those breaks
were left in the recording. Analyses showed that if all breaks were removed from the recording,
31

Moore
the average Leq changed by 1 dB and was, therefore, not significant.
In addition to making sound level measurements via participants, the author also made
general orchestra measurements. Table 3.13 is a table of the general orchestra average Leq and
average peak levels. Refer to Figure 2.4 for a schematic representation of the general
measurement positions in the orchestra. The average dBA Leq for the general measurements
ranged from 79.2 dBA to 87.7 dBA with an average peak level between 104.2 dBSPL to 122.3
dBSPL. The lowest measurement was in the down right position behind the violins. The highest
measurement was right center in front of the brass section.
Dosimeter Placement Average Leq Level Average Peak Level 1A – Down Center (DC) – 1st Conductor
82.9 dBA 122.0 dBSPL
1B – Down Left (DL) – 1st Conductor
80.0 dBA 112.0 dBSPL
1C – Down Right (DR) – 1st Conductor
79.2 dBA 105.0 dBSPL
1D – Up Right (UR) – 1st Conductor
83.3 dBA 122.3 dBSPL
1E – Up Left (UL) – 1st Conductor
82.1 dBA 125.5 dBSPL
2A – Down Center (DC) – 2nd Conductor
81.5 dBA 104.2 dBSPL
2B – Left Center (LC) – 2nd Conductor
81.0 dBA 106.1 dBSPL
2C – Right Center (RC) – 2nd Conductor
87.7 dBA 107.8 dBSPL
Table 3.13 - Location, average Leq levels (in dBA), and average peak levels (in dBSPL) of general orchestra measurements.
Loudness Perception Rating
Though there were 23 musicians that filled out the questionnaire, only 15 of those 23 had
complete sound level measurement data. Therefore, only those 15 participants’ input will be
used for descriptive purposes.
The first question in the loudness rating section of the questionnaire asked subjects to rate
32

Moore
the loudness of their own instrument on the seven-point scale. Figure 3.5 is a graphical
representation of the participants’ categorizations of their instruments’ loudness. Individual
instruments were rated between “3” and “7” with no ratings in the “6” category. Though the “7”
category was chosen, most musicians rated their instrument between “3” and “5.”
01234567
1 ‐V
ery Soft
2 ‐Soft
3 ‐C
omfortable, but …
4 ‐C
omfortable
5 ‐C
omfortable, but …
6 ‐Lou
d, but OK
7 ‐U
ncom
fortable Lou
d1 ‐V
ery Soft
2 ‐Soft
3 ‐C
omfortable, but …
4 ‐C
omfortable
5 ‐C
omfortable, but …
6 ‐Lou
d, but OK
7 ‐U
ncom
fortable Lou
d1 ‐V
ery Soft
2 ‐Soft
3 ‐C
omfortable, but …
4 ‐C
omfortable
5 ‐C
omfortable, but …
6 ‐Lou
d, but OK
7 ‐U
ncom
fortable Lou
d1 ‐V
ery Soft
2 ‐Soft
3 ‐C
omfortable, but …
4 ‐C
omfortable
5 ‐C
omfortable, but …
6 ‐Lou
d, but OK
7 ‐U
ncom
fortable Lou
d
All Musicians Strings Brass Woodwinds
Freq
uency of Respo
nses
Loudness Ratings for All Musicians and their Respective Sections
Figure 3.5 – Participants’ loudness rating responses for individual instruments
The following four questions in the loudness rating section of the questionnaire asked
participants to rate the loudness of each orchestral section. Figure 3.6 shows the loudness ratings
for the brass, percussion, string, and woodwind sections. Overall, results showed the brass
section was rated between “5” and “7.” However, over half of the musicians rated the brass
section in the “6” category. On the other hand, the percussion section was rated between “4” and
“6.” Though responses ranged between the three categories, over 50% of subjects rated the
percussion section in the “6” category. Only one participant in this study played in the
percussion section and that individual’s loudness rating could not be included in the results due
33

Moore
to incomplete sound level measurement data. In addition, when asked about the string section,
participants rated between “3” and “6” though 86% of the participants stayed within the “3” and
“4” category. Finally, results for the woodwind section showed the woodwind section was rated
between “3” and “5,” with 60% of the subjects rating in the “3” category.
0123456789
10
Freq
uency of Respo
nses
Loudness Rating
Brass
Percussion
String
Woodwind
Figure 3.6 - All musicians' loudness ratings for all four sections
The last question related to loudness perception asked subject to rate the loudness of the
entire orchestra. Figure 3.7 shows all of the participants’ loudness ratings for the orchestra. The
entire orchestra was rated between “4” and “6,” with over 50% of participants rating the
orchestra in the “5” category.
34

Moore
0123456789
Freq
uency of Respo
nses
Loudness Ratings
Figure 3.7 – Participants’ loudness rating responses for the entire orchestra.
Question 7 also asked participants to use the same seven-point scale from the LCT to rate
how loud they preferred to listen to music on an iPod/MP3 player/CD player/Walkman. Because
this question did not related to loudness of instruments, all 23 participants were included in the
analysis. Figure 3.8 shows all 23 musicians’ ratings regarding the perceived intensity level of
their personal music device. Results showed that nine of the participants listened at a
“comfortable, but slightly loud level.” 8 participants listened at a “comfortable” level. The
remaining five participants responded between “very soft,” “soft,” or “comfortable, but slightly
soft” while one remaining participant responded “loud, but OK.”
35

Moore
0123456789
10Freq
uency of Respo
nses
Loudness Ratings
Figure 3.8 – Loudness ratings regarding musicians' perception of how loud they listen to music on their iPod/MP3 player/CD player/Walkman from Question 7
Relationship between Loudness Ratings and Measured Intensity
The second part of the questionnaire involved having the participants rate, using the
seven-point scale found in the Loudness Contour Test (LCT) (Cox, Alexandar, Taylor, and
Gray, 1997) and the Profile of Aided Loudness (PAL) (Palmer, Mueller, and Moriarty, 1999),
how loud they thought their instrument, each section, and the entire orchestra was on a scale of
one (very soft) to seven (uncomfortably loud). Cox and colleagues found the average loudness
ratings for connected discourse for a group of normal hearing listeners. These values were used
as a reference point for comparison of musicians’ loudness ratings of their instrument and the
orchestra (Cox, Alexandar, Taylor, and Gray, 1997). Table 3.14 shows those values in decibels
for each of the seven ratings.
36

Moore
Number Decibel (dB) Value Standard Deviation 1 – Very Soft 20.3 dB 4.6 2 – Soft 32.5 dB 6.0 3 – Comfortable, but slightly soft
41.9 dB 6.3
4 – Comfortable 58.6 dB 7.7 5 – Comfortable, but slightly loud
77.0 dB 10.3
6 – Loud, but OK 91.7 dB 10.9 7 – Uncomfortably Loud 101.9 dB 12.4 Table 3.14 – Loudness contour test results and standard deviations (in dB) for each of the loudness ratings for broadband speech noise.
37

Moore
CHAPTER IV
Discussion and Conclusion
Discussion
One of the main questions of this project was whether or not student musicians could
reliably rate loudness. Based on the Pearson correlation analyses of the specific loudness rating
questions, questions 18 through 23 had moderate test-retest reliability. Overall, the entire
questionnaire also exhibited moderate test-retest reliability. Therefore, the musicians were able
to reliably answer questions on the questionnaire and rate loudness.
The second aim of this study was to collect a series of noise measures from student
musicians playing in the classrooms, practice rooms, or halls provided by their high school or
university. As mentioned previously, all measurements were taken at either the E. Desmond Lee
Concert Hall at the 560 Trinity Avenue music building or sound-treated practice booths either at
the 560 Trinity Avenue music building or Tietjens Music Building on the Washington University
in St. Louis Danforth Campus. The range of instrument measurements was from 71.8 dBA to
101.1 dBA while the range of orchestra measurements was from 71.7 dBA to 93.1 dBA.
Compared to previous literature, there does not seem to be a significant difference between the
sound measurements made with professional musicians and this study’s sound measurements
with student-level musicians (Royster, Royster, & Killion, 1991, Phillips & Mace, 2007,
O’Brien, Wilson, & Bradley, 2008).
In addition, the average Leq for all of the measurements were softer than the researcher
originally anticipated. This could be due to the fact that not all instruments play at the same time
or at the same intensity. During individual measurements, the participants were asked to play
38

Moore
fifteen minutes straight at a typical practice level. However, during performances, not all
instruments play fifteen minutes straight. Also, certain pieces required instruments to be softer
or louder at different times. Overall, this could account for the variation between individual and
orchestra measurements.
Leq measurements for two-hour and eight-hour equivalent exposures were also calculated
to determine the subjects’ exposure during a traditional rehearsal period and during a projected
playing period of eight hours. Two-hour exposures ranged from 62.8 dBA to 92.1 dBA. Out of
the 19 participants who had instrument data, only one participant exceeded NIOSH’s
recommended two-hour exposure level of 91 dBA (NIOSH, 1998). Eight-hour exposures ranged
from 56.8 dBA to 86.1 dBA with the same participant exceeding the recommended NIOSH level
for eight-hour exposures of 85 dBA (NIOSH, 1998). However, these values are strictly
representing the projected amount of time the musician plays his or her instrument alone for the
Washington University Symphony Orchestra. These calculations do not take into account other
factors, such as time played with other ensembles and personal listening habits. Questionnaire
results showed that most musicians are fluent in more than one instrument. Therefore, they may
practice their other instruments. In addition, a majority of student musicians play with other
ensembles or bands between one to three hours per week. It was also found that musicians listen
to music in a variety of different manners, including on personal listening devices. When asked
to rate the loudness of their personal listening devices, most participants noted listening at a
“comfortable, but slightly loud” level. Therefore, the subjects’ two-hour and eight-hour
equivalent exposure values could be dramatically increased if these factors were also taken into
consideration.
The third aim of this project was to assess student musicians’ perception of loudness and
39

Moore
how it relates to the measured intensity. Figure 4.1 shows the participants’ loudness ratings for
their instrument and the orchestra along with and the normative loudness ratings for speech from
the LCT. For individual instruments, all 15 participants rated their instruments between “3” and
“7,” though no participants categorized them in the “6” category. This is related to 35.6 dB to
77.0 dB and 89.5 dB to 114.3 dB on the LCT (when applying the standard deviation). However,
the individual instrument measurements ranged from 71.8 dBA to 96.0 dBA which was
associated with “5” and “6” on the LCT. Overall, 11 of the 15 participants rated their instrument
as softer than what would be expected of a normal hearing listener rating a broadband signal
according to the LCT. Two musicians were able to rate the loudness of their instrument similar
to the LCT values for connected speech. The other two individuals rated their instrument louder
than the normative values. One of those two participants who rated their instrument louder
played the trumpet and stated after the sound level recording that he was purposely playing as
loud as he could as mentioned previously in the results section. His average Leq was 101.1 dBA,
which was the loudest recording overall. Therefore, his perceived loudness rating may be
skewed.
Orchestra ratings were between “4” and “6” on the LCT which corresponded to between
50.9 dB to 102.6 dB when applying standard deviations. However, the orchestra measurements
(including general orchestra measurements made by the author) were between 71.7 dBA to 93.1
dBA which falls in “5” and “6” of the LCT. Table 4.2 shows the musicians’ loudness ratings for
the orchestra, the average dBA Leq for their orchestra measurements, and the normative loudness
rating for speech signals from the LCT for the measurements. Ten of the 15 participants were
able to rate the loudness of the orchestra similar to normal hearing listeners rating the loudness
for connected speech. Four of the musicians rated the orchestra softer than the normative values
40

Moore
while only one subject rated the orchestra louder.
As mentioned previously, the loudness contour values used for this project are based on
normal hearing listeners listening to five seconds of connected speech from the Connected
Speech Test because there are currently no normative loudness contour values for orchestral
music. The instrument and orchestra ratings on the graph show that musicians considered louder
stimuli to be softer than the measured sound level. For example, the corresponding decibel value
for the loudness rating of "comfortable, but slightly soft” is around 40 dB. However, the 15
musicians that were included in the loudness ratings rated their instruments that had an average
Leq of 83 dB as "comfortable, but slightly soft." Therefore, even though their instruments are 23
dB louder than the level of connected discourse from the LCT, both groups rated the sound as
being "comfortable, but slightly soft." For the “comfortable” rating, there is roughly a 26 dB
difference in ratings between the listeners in the LCT listening to connected speech and this
project’s subjects’ music from their instrument alone. “For comfortable, but slightly loud”
ratings, there is a 12 dB difference between the LCT norms for speech and the ratings of the
musicians. However, for ratings “loud but ok” and “uncomfortably loud,” differences in ratings
begin to diminish to where there is only 2-7 dB in difference between the LCT values for
connected speech and the musicians’ loudness ratings.
41

Moore
102030405060708090
100110120
Very
Sof
t
Sof
t
Com
forta
ble,
but
slig
htly
so
ft Com
forta
ble
Com
forta
ble,
but
slig
htly
lo
ud Loud
, but
OK
Unc
omfo
rtabl
y Lo
ud
dB v
alue
Loudness Ratings
Musicians’ Loudness Ratings vs. Normative Values
Norms for Speech
Instrument Ratings
Orchestra Ratings
Figure 4.1 – Musicians’ loudness ratings versus normative loudness contour data for speech.
In general, a majority of musicians were able to reliably rate the loudness of their
instrument and/or the orchestra. These findings are in agreement with Chesky et al’s (2009)
findings that showed music majors may be able to approximate the intensity level of music more
accurately than non-music majors. For the musicians that did not rate the loudness similar to the
values for connected speech, most of them rated the instrument and orchestra softer than the
norms. There are several reasons as to why these musicians may have an altered loudness
perception. One theory is that the LCT is based on broadband speech signals and not music
42
Moore
(Cox, Alexandar, Taylor, & Gray, 1997). These speech signals are dramatically different in
composition than orchestral music and therefore, these values from the LCT may not accurately
represent the loudness ratings of music. In addition, there is the possibility that participants in
the loudness contour test study found the five seconds of connected speech from the Connect
Speech Test either annoying or bothersome and therefore rated the stimulus louder than its actual
intensity. Another theory has to do with the between-subject variability of the LCT. The
standard deviations for the LCT increased as each loudness rating increased, showing this
variability. This created difficulty when looking at the relationship between the musicians’
loudness perception and the measured intensity for categories “5” through “7” because the
standard deviations overlapped each other. A final theory behind the trend of altered loudness
perception is that musicians rate their instruments and orchestra softer because they enjoy their
craft. If a musician enjoys the music that is played, he or she may be less likely to rate it as
accurately as they would rate a genre of music that he or she does not like.
Additional information gained by the author apart from the aims of the study came from
the questionnaire data. 19 of the 23 musicians noted that they did not wear hearing protection
while practicing or performing. This finding supports Laitinen’s (2005) and Chesky et. al’s
(2009) studies that showed most musicians do not wear hearing protection during rehearsal and
performances. However, unlike previous research, the author did not ask the musicians to
discuss their reasoning for not wearing hearing protective devices. Therefore, no speculations
can be made as to why the majority of musicians do not utilize hearing protection.
Two questions from the questionnaire asked musicians to choose what they thought was
the loudest and softest instrument. The trumpet was chosen by the most participants as the
loudest instrument. This finding is in agreement with the sound level measurements made in this
43

Moore
project because the trumpet was found to be the loudest instrument of those recorded. However,
not all of the instruments were included in this project due to limitations of participation so it
cannot be concluded that it is in fact the loudest instrument in the orchestra. The instrument that
was picked by five of the 23 participants was the cymbal. However, due to recruitment issues,
sound level measurements for the cymbals are not available. In addition, other instruments in the
brass section, such as the trombone and tuba, are not included in this study due to participation
limitations. However, these instruments have demonstrated in previous literature that they could
have dBA Leq values comparable to the trumpet (O’Brien, Wilson, & Bradley, 2008).
Participants choosing the trumpet as the loudest instrument in the orchestra may be perceptually
accurate, but additional measurements are necessary to see if in fact this instrument has the
highest intensity.
The harp was chosen by the most participants as the softest instrument. After the harp,
the flute and clarinet were both the second most picked from the questionnaire choices with four
participants choosing each. However, a harpist was not included in the Washington University
Symphony Orchestra. O’Brien, Wilson, and Bradley (2008) found an average dB Leq of 84.3 for
the harp in their study. From this project, the flute was found to have an average Leq of 80.9
dBA while the clarinet had an average Leq of 92.1 dBA. Using the values above, the harp, flute,
and clarinet would not be considered the softest instruments for this project. The bass was
actually found to be the softest instrument with an average instrument Leq of 71.8 dBA.
However, the bass dBA Leq value is not in agreement with previous research and cannot be
concluded as the softest instrument without future investigation (O’Brien, Wilson, & Bradley,
2008).
One area of interest was whether or not participants rated a certain section louder than
44

Moore
others due to their proximity to that section. Analyses of the loudness scaling in conjunction
with placement in the orchestra were done and no trends were noted. Therefore, it cannot be
concluded that an altered perception of loudness can occur depending on the musician’s position
within the orchestra.
Project Limitations
Though there were some interesting trends found from this project, there were several
limitations to this study. One major limitation was the amount of time to complete this research
project. By the time this project was approved by the Human Research Protection Office, there
were only four months to recruit subjects, complete data collection, and complete data analyses
before final reports were due to Washington University School of Medicine’s Program in
Audiology and Communication Sciences. For future research in this area, a full academic year
would be more appropriate for completion. In addition to a limited timeline for this project,
there was also a restriction on the amount of time the research had with the orchestra. The
Washington University in St. Louis Symphony Orchestra only rehearsed once a week for
approximately two hours. Therefore, the amount of time to collect data from this orchestra was
reduced.
Though there were time constraints for this study, there were also limitations with
participation recruitment. Though several orchestras originally agreed to participate in this
study, the author was only able to use one orchestra due to time limitations. Therefore, the
number of participants was limited to the one symphony. This was problematic in the fact that
not all instruments agreed to participate and the researcher was not able to recruit those specific
instruments from another orchestra in order to get complete information. As a result of this,
45

Moore
those specific instruments had to be excluded from the study and could not be commented on
during the analyses.
Another variable of this project had to do with the conductors of the orchestra. Though
there is typically one conductor used for the symphony orchestra, two different conductors were
used during the academic year for reasons unknown to the researcher. This caused the
measurements during data collection to be slightly different because each conductor had his own
style for going through rehearsal. For example, one conductor took time to focus on different
sections of the orchestra whereas the other conductor did not. In addition, one of the conductors
frequently stopped and restarted rehearsals while the other conductor offered fewer breaks
through each musical piece.
There were also limitations regarding the questionnaires. Some of the questions were
pulled from the Munich Music Questionnaire. A few of those questions included instruments
that were not in the Washington University Symphony Orchestra, such as the harp and cymbal.
Therefore, when analyzing questionnaire data, the author was unable to make general statements
about some of the answers to the questionnaire because no information regarding those
instruments was obtained. This was proven difficult for the 24th and 25th questions of the
questionnaire where participants were asked to choose the “softest” and “loudest” instrument.
Both the harp and cymbals were in the top answers for those questions, but no sound level
measurements were made with those instruments because they were not a part of the symphony
orchestra. In addition, some participants were upset that their instrument was not included in
some of the questions. For example, the questionnaire choices did not include the viola or
French horn. However, there were five participants who either played or were fluent in playing
that instrument
46

Moore
Participant cooperation was also another limitation to the project. One goal of this
research project was to have the musicians fill out a questionnaire about their musical practices
and fill it out again approximately two weeks later to verify test-retest reliability. However, it
was difficult to get the participants to fill out the questionnaires in that time frame. Some
musicians did not come to every rehearsal while some musicians would not remember to bring
back the questionnaire to the next rehearsal. Therefore, the second round of questionnaires was
filled out between two and six weeks after the initial questionnaire was completed. As well as
questionnaire difficulties, because musicians did not come to every rehearsal, it took more time
to get all of the sound level measurements completed.
Areas of Future Research
There are several areas of future research regarding musicians’ loudness perception that
could be extremely beneficial to the audiology community. One particular project would be to
use the same study design, but recruit from multiple orchestras and ensembles. By having a
larger musician sample, statistical correlation analyses could be applied to the loudness scaling in
order to see if the differences are statistically significant.
Another project that could provide useful insight would be to look at the perception of
loudness in professional musicians. The purpose of this project was to look at student musicians
because there is little in the literature regarding this population. But professional musicians may
have more knowledge and expertise in not only music in general, but also loudness perception
and might, therefore, provide different outcomes. In addition, there is a plethora of literature
regarding professional musicians. However, none of those studies looked specifically out
musicians’ perception of loudness.
47

Moore
It would be interesting for a project to compare these results with results take from
ensembles that play different genres of music, such as jazz, pop, folk, and rock music since this
research study focused on classical musicians. Because different styles are played differently,
the loudness rating results may be varied between each type of music.
A final project that would prove most beneficial would be to obtain normative loudness
contour data for music. It is unclear whether or not the loudness ratings were different than
expected because of the musician’s enjoyment of the music or because the connected discourse
speech signal used for the normative data in the LCT was different in composition than the music
played by the orchestra. If normative values were obtained for music signals, those findings
could provide informational data and would be useful for future endeavors in loudness
perception testing.
Conclusion
It has been well-documented that musicians are exposed to levels that exceed both
NIOSH and OSHA standards in regards to occupational noise though they are not required to
abide by those standards (Jansson & Karlsson, 1983, Jansen et. al., 2009, Laitinen et. al., 2003,
Miller, Stewart, & Lehman, 2007, Royster, Royster, & Killion, 1991). Other research has also
shown that though musicians are at risk for noise-induced hearing loss, most do not wear hearing
protection while playing or performing (Chesky et. al., 2009, Laitinen, 2005, Miller, Stewart, &
Lehman, 2007). The purpose of this project was to analyze musicians’ perception of loudness in
an effort to learn more about musicians as a group in order to determine how to create a hearing
conservation program that is customized to those specific needs. Though some musicians were
able to reliably rate loudness for instruments, sections, and the entire orchestra, some musicians
48

Moore
were not. Though reasons for not using hearing protection have been documented in previous
literature (Chesky et.al., 2009) (Laitinen, 2005), this study suggests that musicians’ altered
perception of loudness could also be a contributing factor. If musicians in general do have an
altered loudness perception, this may be an area that should be focused on in a musician hearing
conservation program. By identifying real world objects and correlating their loudness to the
loudness of instruments, musicians might be able to understand the importance of using hearing
protection while playing their music and be more open to wearing hearing protection in order to
reduce their exposure.
49

Moore
References
Brockmeier, S.J. (2002). Munich Music Questionnaire. Brockmeier S.J., Grasmeder, M., Passow, S., Mawmann, D., Vischer, M., Jappel, A., Baumgartner, W., Stark, T., Muller, J., Brill, S., Steffens, T., Strutz, J., Kiefer, J., Baumann, U., and Arnold, W. (2007). Comparison of musical activities of cochlear implant users with different speech-coding strategies. Ear and Hearing, 28, 49-S-51S. Chesky, K., Pair, M., Yoshinura, E., and Landford, S. (2009). An evaluation of musician earplugs with college music students. International Journal of Audiology, 48, 661-670. Cox, Robyn M., Alexandar, Genevieve C., Taylor, Izel M., and Gray, Ginger A. (1997). The contour test of loudness perception. Ear and Hearing18(5), 388-400. Davis, Hallowell and Silverman, S. Richard (1978). Hearing and deafness (4th ed.). United States of America: Holt, Rinehart, and Winston. Jansson, E. and Karlsson, K. (1983). Sound levels recorded within the symphony orchestra and risk criteria for hearing loss. Scandinavian Audiology, 12, 215-221. Jansen, E.J.M., Helleman, H.W., Dreschler, W.A., and de Laat, J.A.P.M. (2009). Noise induced hearing loss and other hearing complaints among musicians of symphony orchestras. Int Arch Occup Environ Health, 82, 153-164. Laitinen H (2005). Factors affecting the use of hearing protectors among classical music players. Noise Health [serial online]. Available from: http://www.noiseandhealth.org/text.asp?2005/7/26/21/31643 Laitinen H., Toppila E., Olkinuora P., and Kuisma K. (2003) Sound exposure among the Finnish National Opera Personnel. Appl. Occup. Environ. Hyg. 18(3), 177-182. Miller, Vanessa L., Stewart, Michael, and Lehman, Mark (2007). Noise exposure levels for student musicians. Medical Problems of Performing Artists, 22, 160-165. National Association for Music Education (2006). MENC: Health in music education (positions statement). Retrieved December 17, 2009 from http://menc.org/about/view/health-in-music-education-position-statement. National Institute for Occupational Safety and Health (NIOSH) (1998). Criteria for a recommended standard: Occupational noise. Retrieved April 22, 2010 from http://www.cdc.gov/niosh/docs/98-126. National Institute on Deafness and Communication Disorders (2008). Noise-induced hearing loss. Retrieved December 17, 2009 from http://www.nidcd.nih.gov/health/hearing/noise.asp.
50
Moore
O’Brien, I., Wilson, W. and Bradley, A (2008). Nature of orchestral noise. Journal of the Acoustical Society of America, 124(2), 926-939. Ostri, B., Eller, N., Dahlin, E., and Skylv, G. (1989). Hearing impairment in orchestral musicians. Scandinavian Audiology 18, 243-249. Palmer, Catherine V., Mueller, H. Gustav, and Moriarty, Melanie (1999). Profile of aided loudness: A validation procedure. The Hearing Journal, 52(6), 34-42. Phillips, S.L. and Mace, S (2008). Sound level measurements in music practice rooms. Music Performance Research, 2(1), 36-47. Royster, J.D., Royster, L.H., and Killion, M.C. (1991). Sound exposures and hearing thresholds of symphony orchestra musicians. Journal of the Acoustical Society of America, 89(6), 2793-2803. Shrout, P. E. (1998). Measurement reliability and agreement in psychiatry. Statistical Methods in Medical Research, 7, 301-317. Shrout, P. E., & Fleiss, J. L. (1979). Intraclass correlations: Uses in assessing rater reliability. Psychological Bulletin, 86, 420-428. United States Department of Labor – Occupational Safety and Health Administration (2009). Occupational noise exposure – 1910.95. Retrieved on December 30, 2009 from http://www.osha.gov/pls/oshaweb/owadisp.show_document?p_table=standards&p_id=9735 Wickham, M.E., Anderson, N.L.R., and Greenburg, C.S. (2008). The adolescent perception of invincibility and its influence on teen acceptance of health promotion strategies. The Journal of Pediatric Nursing, 23(6), 460-468. Zhao, F., Manchaiah, V.K.C., French, D., and Price, S.M. (2009). Music exposure and hearing disorders: An overview. International Journal of Audiology,1-11.
51

Moore
Appendix A
Questionnaire
Date:___________________________ Age:___________________________ ID ___________________ PLEASE CHECK THE BEST ANSWER
1) How do you listen to music?
In the background
As my only focus of concentration/without distraction
Both
2) Why do you listen to music? Please check all applicable answers.
For pleasure Professional reasons
Emotional satisfaction
To relax
To improve my mood
To stay awake To dance
3) Do you prefer to listen to solo instruments or an orchestra/ band?
Solo instruments Orchestra/Band No preference
4) Which instruments do you like listening to? Please check all applicable answers.
Flute Oboe Clarinet Tuba Trumpet
Violin Cello Bassoon Trombone Accordion
Harp Bass Guitar Saxophone Drum Kit
Recorder Piano Xylophone Tympani Cymbals
Other – please specify.
5) Where have you listened to or do you currently listen to music? Please check all applicable
answers.
On the radio at home On the radio in the car At social events
On television LP/CD/MC/MP3 At religious institutions
52

Moore
6) Which musical genre do you listen to? Please check all applicable answers.
Classical music
Opera/Operetta Religious Music
Folk/Country Music
Pop Rock Jazz/Blues Music to dance to
7) On a scale of 1 to 7, how loud do you like to listen to your music in your iPod/MP3 player/CD
player/Walkman? Please circle the best answer. 1 – Very Soft 2 – Soft 3 – Comfortable, but slightly soft 4 – Comfortable 5 – Comfortable, but slightly loud 6 – Loud, but OK 7 – Uncomfortably loud
8) Please check all instruments that you are fluent in playing.
Flute Oboe Clarinet Tuba Trumpet
Violin Cello Bassoon Trombone Accordion
Harp Bass Guitar Saxophone Drum Kit
Recorder Piano Xylophone Tympani Cymbals
Other – please specify.
9) In which section(s) have you played in the past? Please check all applicable answers.
Brass section Percussion section
String section Woodwind section
53

Moore
10) What instrument are you currently playing in this orchestra/band?
Flute Oboe Clarinet Tuba Trumpet
Violin Cello Bassoon Trombone Accordion
Harp Bass Guitar Saxophone Drum Kit
Recorder Piano Xylophone Tympani Cymbals
Other – please specify.
11) What section are you currently playing in this orchestra/band?
Brass section Percussion section
String section Woodwind section
12) Which chair do you play?
1st chair 2nd chair 3rd chair
4th chair Other – please specify
Not applicable
13) Did you receive any musical education outside of school (instrument and/or voice lessons)?
Yes No
14) For how long did you receive musical education outside school (instrument and/or voice
lessons)?
Less than 3 years More than 3 years Not applicable
15) Do you currently play with any other ensembles/bands/etc… other than this one?
Yes No
54

Moore
16) What type of music do you play with your other ensembles/bands/etc…? Please check all applicable answers.
Classical music
Opera/Operetta Religious Music
Folk/Country Music
Pop Rock Jazz/Blues Music to dance to
Not applicable
17) How many hours per week do you practice and/or play with the other ensembles/bands/etc..?
Less than 3 hours per week
Between 3 and 8 hours per week
More than 8 hours per week
Not applicable
55

Moore
56
The following questions are in regards to your perception of how loud things are. Please circle the number that best corresponds with your answer. Only circle ONE number.
18) On a scale of 1 to 7 with 1 being very soft and 7 being uncomfortably loud, how loud do you think your instrument is when you practice/play solo? 1 – Very Soft 2 – Soft 3 – Comfortable, but slightly soft 4 – Comfortable 5 – Comfortable, but slightly loud 6 – Loud, but OK 7 – Uncomfortably loud
19) On a scale of 1 to 7 with 1 being very soft and 7 being uncomfortably loud, how loud do you think the brass section is by itself? 1 – Very Soft 2 – Soft 3 – Comfortable, but slightly soft 4 – Comfortable 5 – Comfortable, but slightly loud 6 – Loud, but OK 7 – Uncomfortably loud
20) On a scale of 1 to 7 with 1 being very soft and 7 being uncomfortably loud, how loud do you think the percussion section is by itself? 1 – Very Soft 2 – Soft 3 – Comfortable, but slightly soft 4 – Comfortable 5 – Comfortable, but slightly loud 6 – Loud, but OK 7 – Uncomfortably loud
21) On a scale of 1 to 7 with 1 being very soft and 7 being uncomfortably loud, how loud do you think the string section is by itself? 1 – Very Soft 2 – Soft 3 – Comfortable, but slightly soft 4 – Comfortable 5 – Comfortable, but slightly loud 6 – Loud, but OK 7 – Uncomfortably loud
22) On a scale of 1 to 7 with 1 being very soft and 7 being uncomfortably loud, how loud do you think the woodwind section is by itself? 1 – Very Soft 2 – Soft 3 – Comfortable, but slightly soft 4 – Comfortable 5 – Comfortable, but slightly loud 6 – Loud, but OK 7 – Uncomfortably loud
23) On a scale of 1 to 7 with 1 being very soft and 7 being uncomfortably loud, how loud do you think your entire orchestra/band is? 1 – Very Soft 2 – Soft 3 – Comfortable, but slightly soft 4 – Comfortable 5 – Comfortable, but slightly loud 6 – Loud, but OK 7 – Uncomfortably loud

Moore
24) Which instrument do you think is the softest? Please check ONE (1) answer.
Flute Oboe Clarinet Tuba Trumpet
Violin Cello Bassoon Trombone Accordion
Harp Bass Guitar Saxophone Drum Kit
Recorder Piano Xylophone Tympani Cymbals
Other – please specify.
25) Which instrument do you think is the loudest? Please check ONE (1) answer
Flute Oboe Clarinet Tuba Trumpet
Violin Cello Bassoon Trombone Accordion
Harp Bass Guitar Saxophone Drum Kit
Recorder Piano Xylophone Tympani Cymbals
Other – please specify.
26) Have you ever been bothered by the loudness of your instrument?
Always Sometimes Rarely Never
27) Have you ever had ringing in your ears after a practice and/or performance?
Always Sometimes Rarely Never
28) Have you ever experience a temporary hearing loss after a practice and/or performance?
Always Sometimes Rarely Never
29) How often do you experience a temporary hearing loss after a practice and/or performance?
Never 1‐2 times per week
3‐5 times per week
More than 5 times per week
Every time I practice and/or perform
57
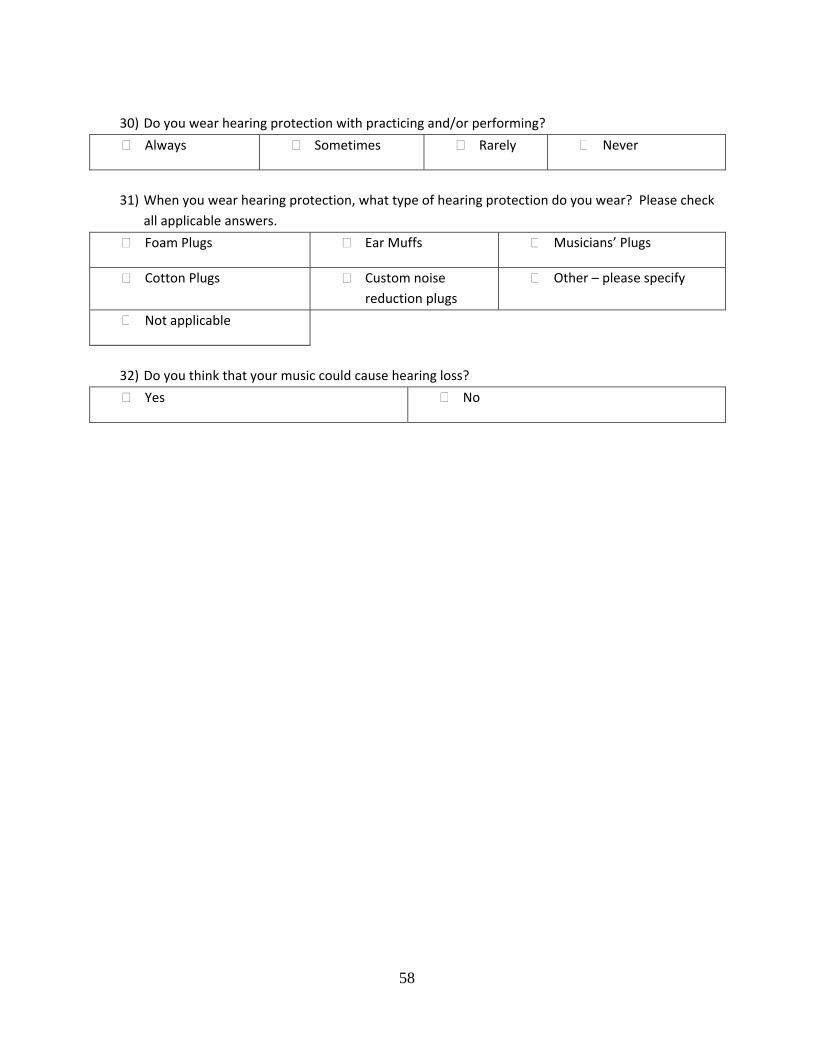
58
30) Do you wear hearing protection with practicing and/or performing?
Always Sometimes Rarely Never
31) When you wear hearing protection, what type of hearing protection do you wear? Please check
all applicable answers.
Foam Plugs Ear Muffs Musicians’ Plugs
Cotton Plugs Custom noise reduction plugs
Other – please specify
Not applicable
32) Do you think that your music could cause hearing loss?
Yes No

59
Appendix B
0102030405060708090
100
In th
e backgrou
nd
As my on
ly fo
cus
Both
Solo instrumen
ts
Orche
stra
No preferen
ce
Q1: How do you listen to music? Q3: Do you prefer to listen to solo instruments or an orchestra?
Percetan
ge of R
espo
nses
Figure B.1 – Participants’ responses to Questions 1 and 3 related to musical interests.
0102030405060708090
100
For p
leasure
Profession
al
reason
s
Emotional
satisfaction
To re
lax
To im
prove my
moo
d
To stay aw
ake
To dance
Q2: Why do you listen to music?
Percen
tage
of R
espo
nses
Figure B.2 – Participants’ responses to Question 2 regarding why they listen to music

60
Appendix C
0102030405060708090100
Flute
Obo
eClarinet
Tuba
Trum
pet
Violin
Cello
Bassoo
nTrom
bone
Accordion
Harp
Bass
Guitar
Saxoph
one
Drum Kit
Recorder
Piano
Xyloph
one
Tympani
Cymbals
Other
Q4: Which instruments do you like listening to?
Percen
tage
of R
espo
nses
Figure C.1 –Participants’ responses to Question 4 related to which instrument they like listening to.
0102030405060708090100
On the radio at hom
e
On the radio in th
e car
At social events
On television
LP/CD/M
C/MP3
At religious institu
tions
Q5: Where have you listened to or do you currently listen to music?
Percen
tage
of R
espo
nses
Figure C.2 – Participants’ responses to Question 5 regarding where they currently listen to music.

61
Appendix D
0102030405060708090
100
Classical m
usic
Ope
ra/O
peretta
Religious M
usic
Folk/Cou
ntry M
usic
Pop
Rock
Jazz/Blues
Music to
dance to
Q6: Which musical genre do you listen to?
Percen
tage
of R
espo
nses
Figure D.1 – Participants’ responses to Question 6 regarding what musical genre is listened to