Student Learning Assessment in Asia Pacific Education...
31
1 @estherho 2013 1 Student Learning Assessment in Asia Pacific Education Systems Esther Ho Director, HKPISA Centre, Chinese University of Hong Kong 27-28 March 2013 UNESCO Bangkok Network fro Educational Quality Monitoring
Transcript of Student Learning Assessment in Asia Pacific Education...
1 @estherho 2013 1
Student Learning Assessment in Asia Pacific
Education Systems
Esther Ho Director, HKPISA Centre,
Chinese University of Hong Kong
27-28 March 2013 UNESCO Bangkok
Network fro Educational Quality Monitoring
2 @estherho 2013 2
Presentation Outline 1. Overview of assessment Practices in Asia
Pacific Region 2. National Assessment 3. Public Examination 4. School Based Assessment 5. International Assessments 6. Monitoring Education Quality with various assessments
This image cannot currently be displayed.
3
Overview of Assessment Practices in Asia Pacific Region
Reflect on trends and issues of monitoring learning outcomes at multi-levels in countries of the Asia-Pacific region.
Based on experiences of various forms of assessments of the participating countries/regions, I attempt to clarify the existing and emerging challenges and how represented countries have or plan to address.
Hope that countries can learn from each other when they review and improve their assessment and monitoring policies and practices.
@estherho 2013 3
4
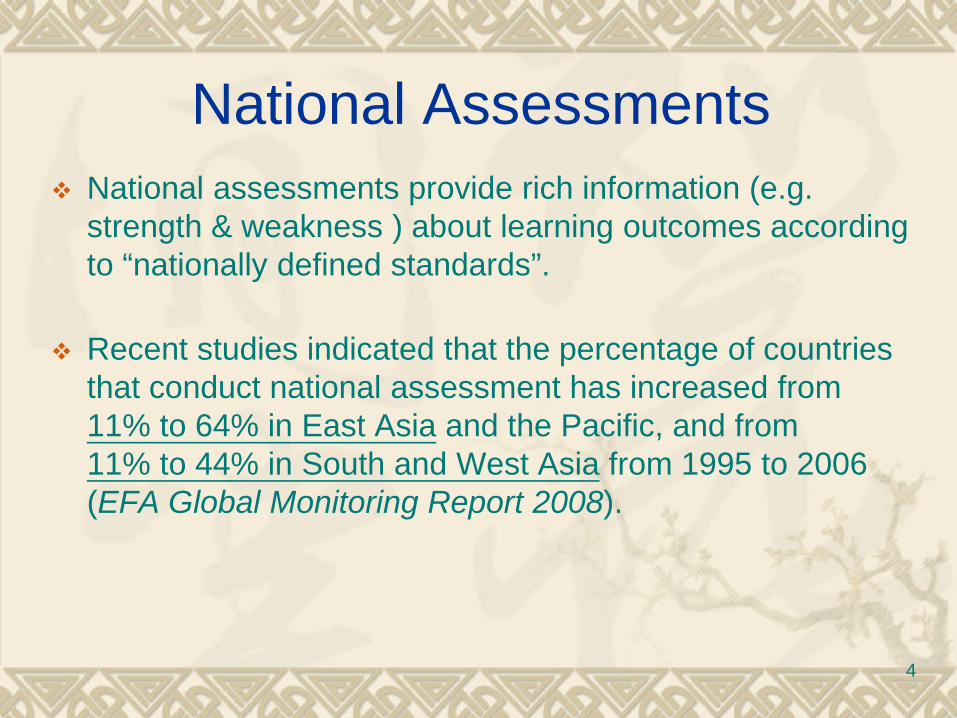
National Assessments National assessments provide rich information (e.g.
strength & weakness ) about learning outcomes according to “nationally defined standards”.
Recent studies indicated that the percentage of countries that conduct national assessment has increased from 11% to 64% in East Asia and the Pacific, and from 11% to 44% in South and West Asia from 1995 to 2006 (EFA Global Monitoring Report 2008).
5
National Assessments
@estherho 2013 5
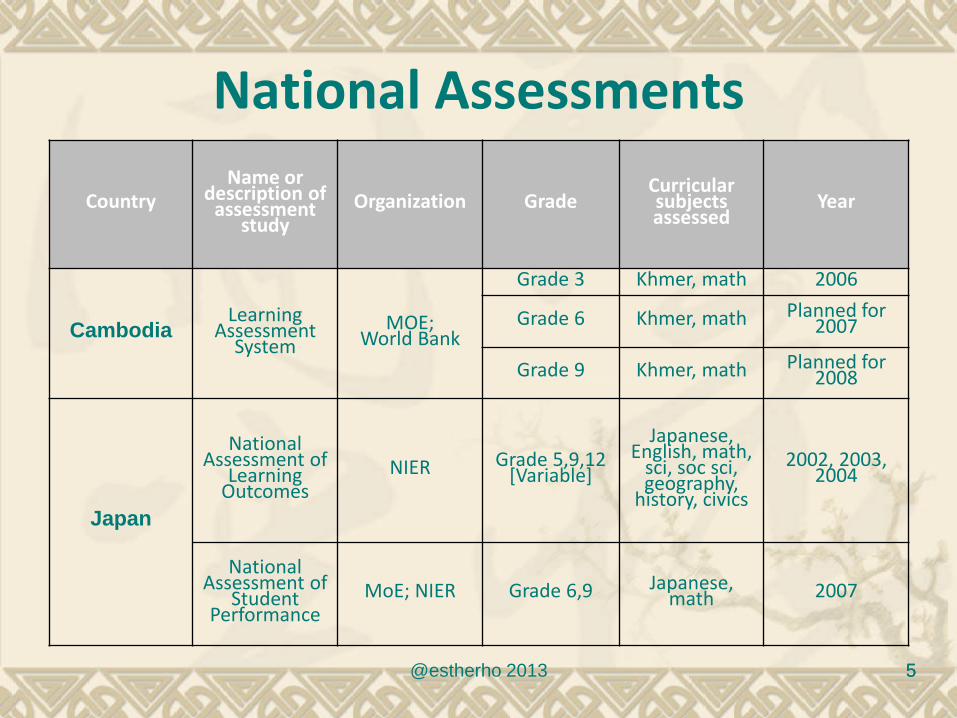
Country Name or
description of assessment
study Organization Grade
Curricular subjects assessed
Year
Cambodia Learning
Assessment System
MOE; World Bank
Grade 3 Khmer, math 2006
Grade 6 Khmer, math Planned for 2007
Grade 9 Khmer, math Planned for 2008
Japan
National Assessment of
Learning Outcomes
NIER Grade 5,9,12 [Variable]
Japanese, English, math,
sci, soc sci, geography,
history, civics
2002, 2003, 2004
National Assessment of
Student Performance
MoE; NIER Grade 6,9 Japanese, math 2007
6 @estherho 2010 6
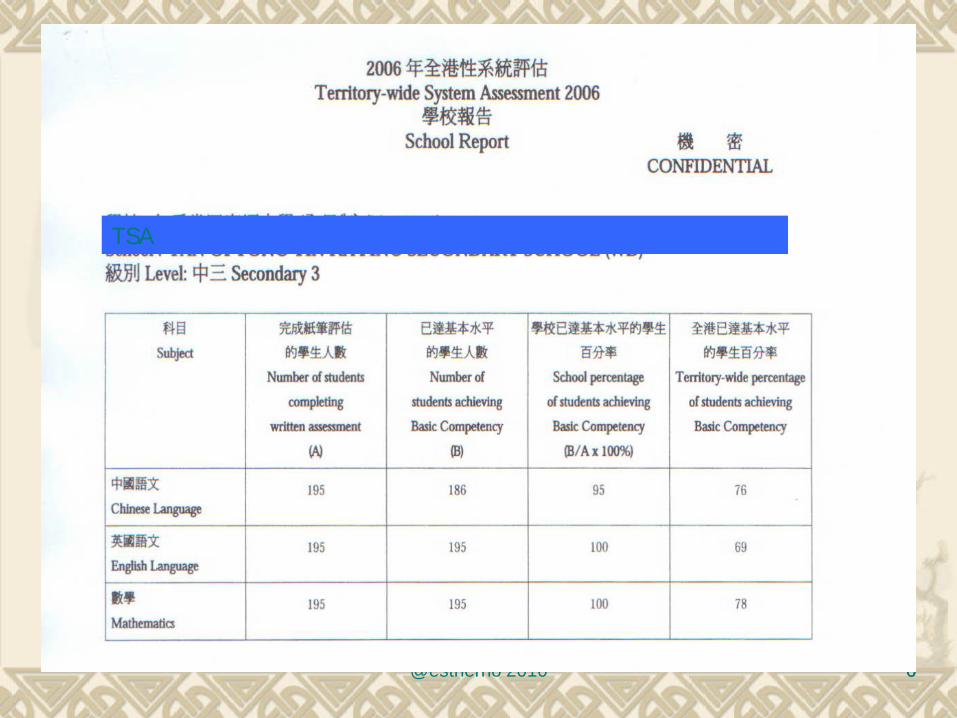
TSA
7 @estherho 2010 7
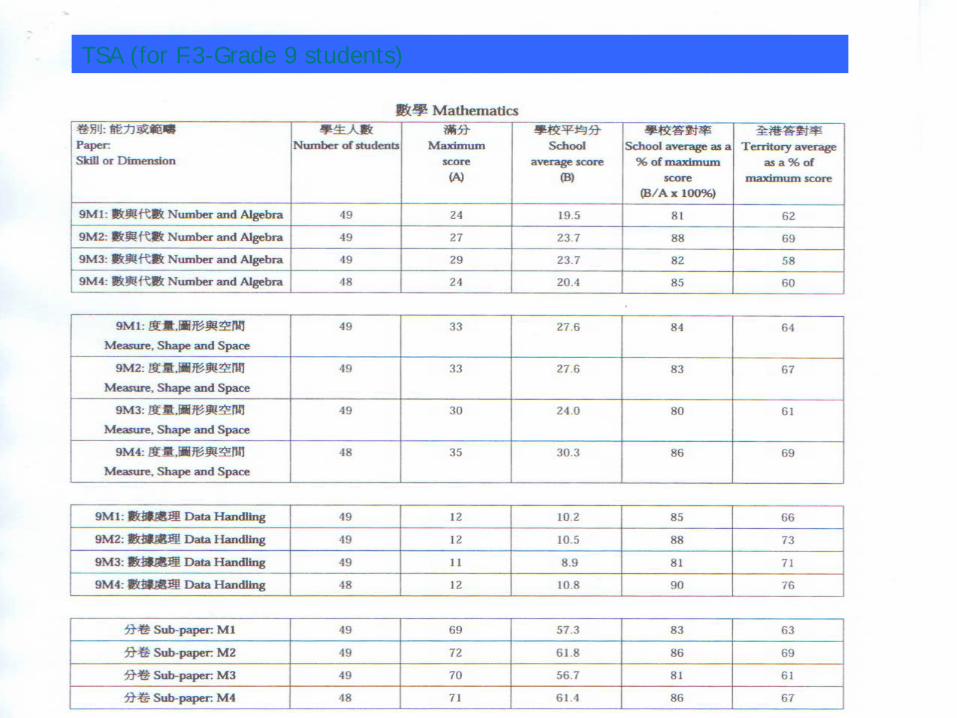
TSA (for F.3-Grade 9 students)
Public Examination National/public examinations (NE) ; they are often
conducted at major transition points, such as from primary to secondary, from lower to upper secondary and from secondary to higher education or to the labour market.
National Examination are high-stake serves for certification and selection, playing a crucial role in selectin and certification and directing students’ learning and future career.
National Examination serve three main purposes: selection, certification, and accountability.
@estherho 2013 8

9 @estherho 2013 9
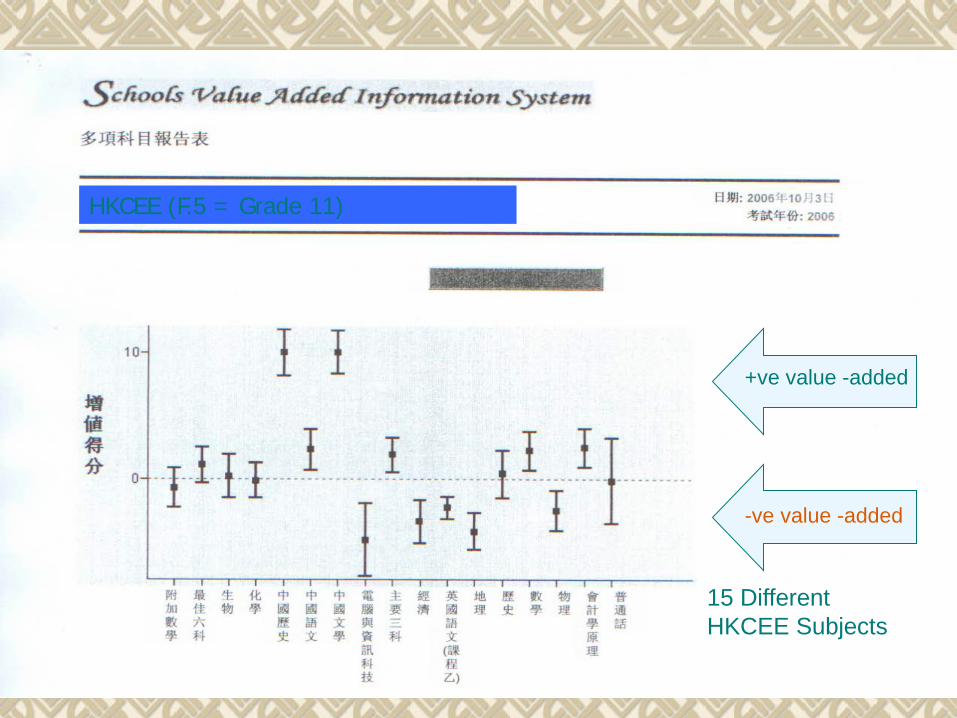
HK Public Examination
HKCEE (F.5) & AL (F.7) -Value added information in all subjects -started from 2000. -very high stake for students and teachers Value added – control variables – STUDENT LEVEL FACTORS: Gender, Academic ability… SCHOOL LEVEL FACTORS: Average academic ability, All Girls, All Boys
10 @estherho 2010 10
HKCEE (F.5 = Grade 11)
15 Different HKCEE Subjects
+ve value -added
-ve value -added
11 @estherho 2013 11
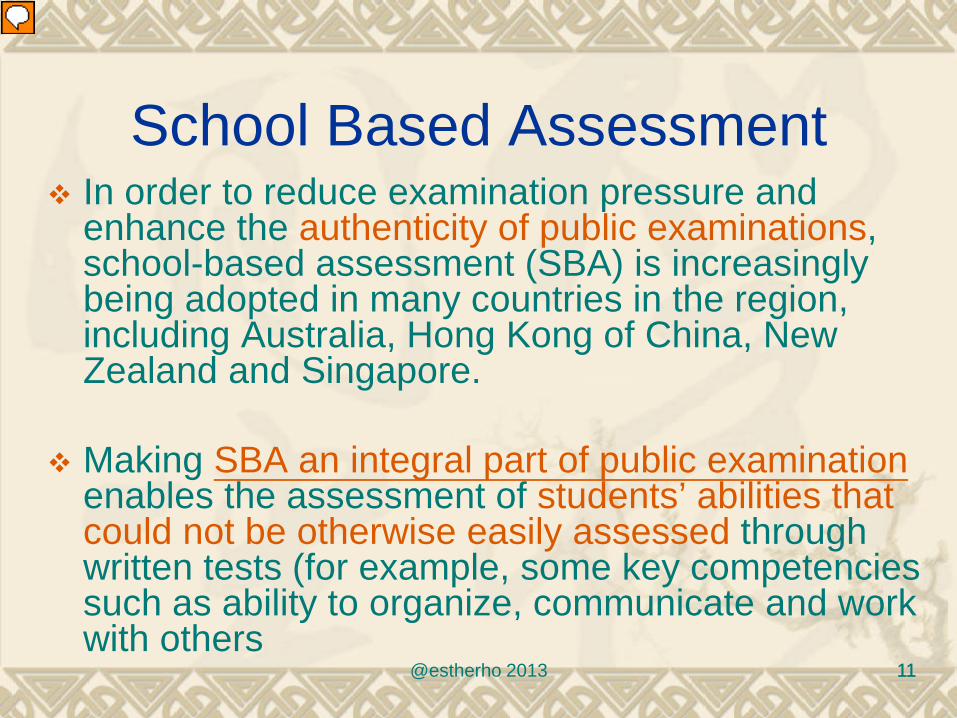
School Based Assessment
In order to reduce examination pressure and enhance the authenticity of public examinations, school-based assessment (SBA) is increasingly being adopted in many countries in the region, including Australia, Hong Kong of China, New Zealand and Singapore.
Making SBA an integral part of public examination enables the assessment of students’ abilities that could not be otherwise easily assessed through written tests (for example, some key competencies such as ability to organize, communicate and work with others
Presenter
Presentation Notes
However, if SBA becomes an integral part of high-stake public examinations, they have to be administered by schools under strict directions regarding the substance of the assessment tasks, the condition of implementation and its scoring specification. The moderation process is usually employed to adjust the scores of SBA before it can be combined with the public examination score (Hill, 2010).
12
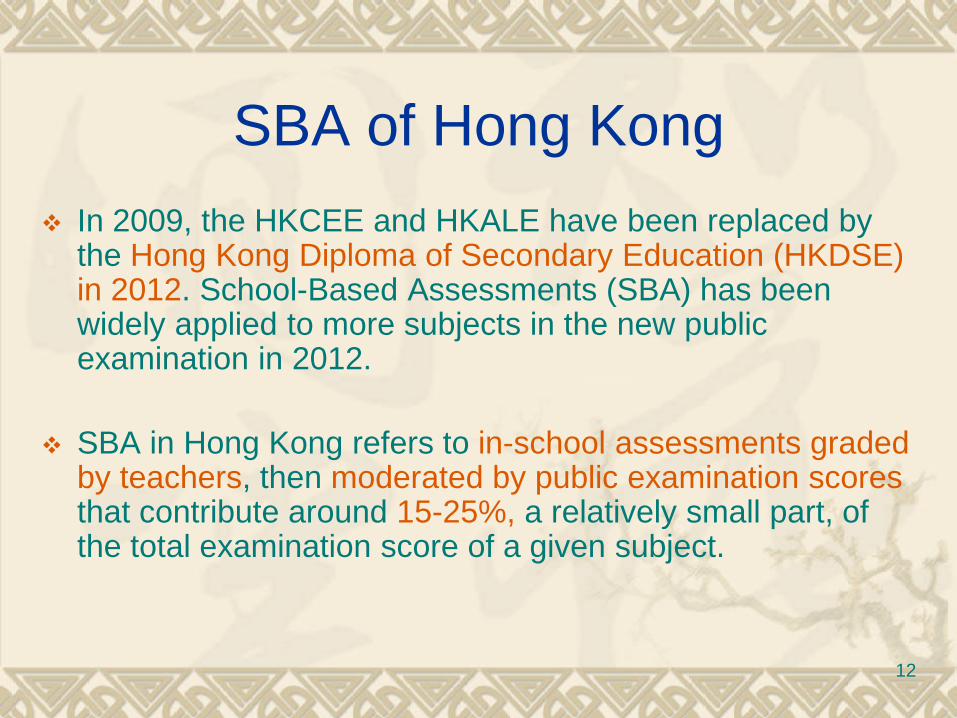
SBA of Hong Kong In 2009, the HKCEE and HKALE have been replaced by
the Hong Kong Diploma of Secondary Education (HKDSE) in 2012. School-Based Assessments (SBA) has been widely applied to more subjects in the new public examination in 2012.
SBA in Hong Kong refers to in-school assessments graded by teachers, then moderated by public examination scores that contribute around 15-25%, a relatively small part, of the total examination score of a given subject.
13 @estherho 2013 13
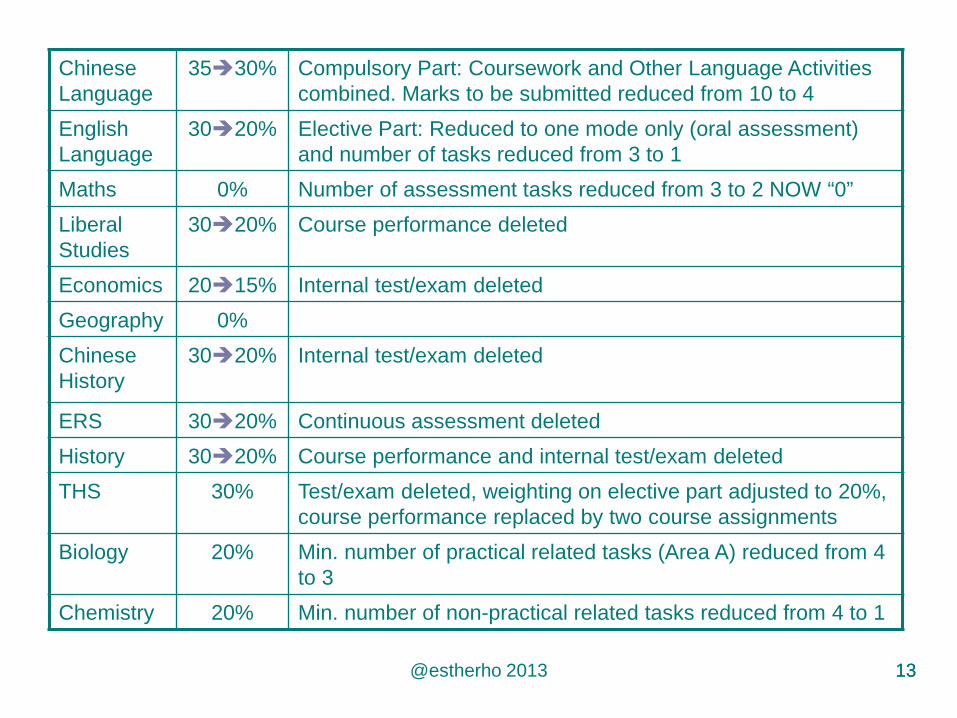
Chinese Language
3530% Compulsory Part: Coursework and Other Language Activities combined. Marks to be submitted reduced from 10 to 4
English Language
3020% Elective Part: Reduced to one mode only (oral assessment) and number of tasks reduced from 3 to 1
Maths 0% Number of assessment tasks reduced from 3 to 2 NOW “0” Liberal Studies
3020% Course performance deleted
Economics 2015% Internal test/exam deleted Geography 0% Chinese History
3020%
Internal test/exam deleted
ERS 3020% Continuous assessment deleted History 3020% Course performance and internal test/exam deleted THS 30% Test/exam deleted, weighting on elective part adjusted to 20%,
course performance replaced by two course assignments Biology 20% Min. number of practical related tasks (Area A) reduced from 4
to 3 Chemistry 20% Min. number of non-practical related tasks reduced from 4 to 1
14
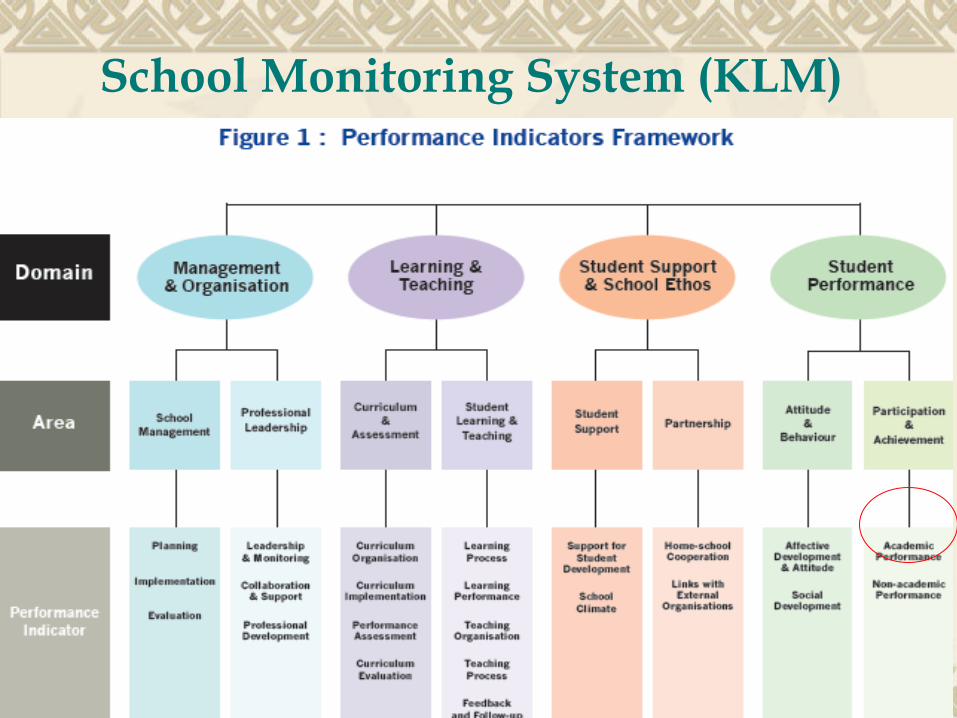
School Monitoring System (KLM)
15 @estherho 2013 15
International Assessments
Lesson we learned from PISA, TIMSS & PIRLS
Presenter
Presentation Notes
Two notable organisations that administer international assessments are the International Association for the Evaluation of Educational Achievement (IEA) and Organisation for Economic and Co-operation Development (OECD).

©estherho 16
What competencies do students need as
Life Long Learners ? (OECD, 2003)
)
Act Autonomously & take responsibility
Interact in heterogeneous
groups
Use tools interactively (language, math, science,
technology, problem solving)
Cognitive
Non-Cognitive
Non-Cognitive
17 @estherho 2012 17
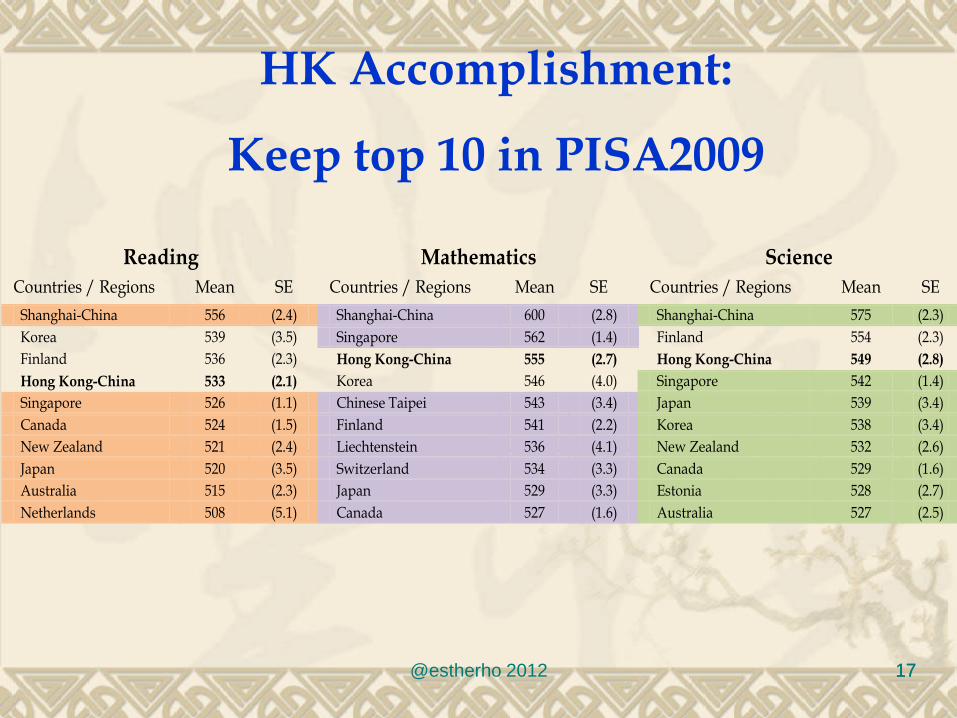
HK Accomplishment:
Keep top 10 in PISA2009
Reading Mathematics Science Countries / Regions Mean SE Countries / Regions Mean SE Countries / Regions Mean SE Shanghai-China 556 (2.4) Shanghai-China 600 (2.8) Shanghai-China 575 (2.3) Korea 539 (3.5) Singapore 562 (1.4) Finland 554 (2.3) Finland 536 (2.3) Hong Kong-China 555 (2.7) Hong Kong-China 549 (2.8) Hong Kong-China 533 (2.1) Korea 546 (4.0) Singapore 542 (1.4) Singapore 526 (1.1) Chinese Taipei 543 (3.4) Japan 539 (3.4) Canada 524 (1.5) Finland 541 (2.2) Korea 538 (3.4) New Zealand 521 (2.4) Liechtenstein 536 (4.1) New Zealand 532 (2.6) Japan 520 (3.5) Switzerland 534 (3.3) Canada 529 (1.6) Australia 515 (2.3) Japan 529 (3.3) Estonia 528 (2.7) Netherlands 508 (5.1) Canada 527 (1.6) Australia 527 (2.5)
18 18
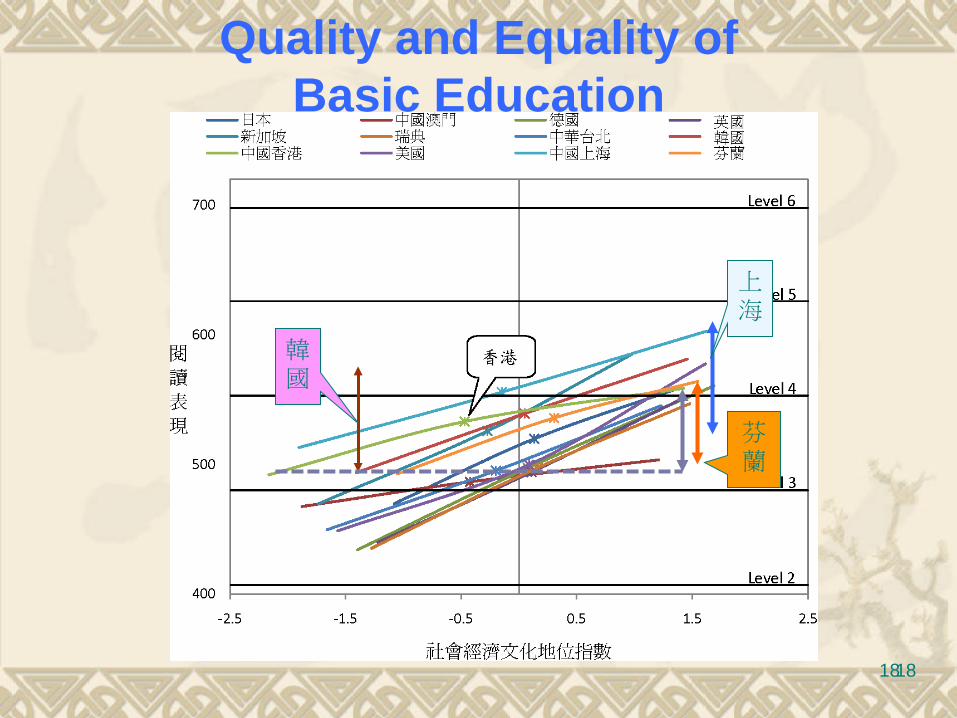
Quality and Equality of Basic Education
芬蘭
上海
韓國
19
Lessons learned from International assessment
First, International assessment, it helps countries to re-
defines student learning outcomes beyond the traditional academic achievement (Non-cognitive outcomes).
Second, IA concerns of both quality and equality. For instance, the concept of social gradient put emphasis on how student achievement distribute among students with different socio-economic background, which helps to construct common language to discuss about the quality and equality in defining ideal schooling system across and within nations/regions.
@estherho 2010 19
20
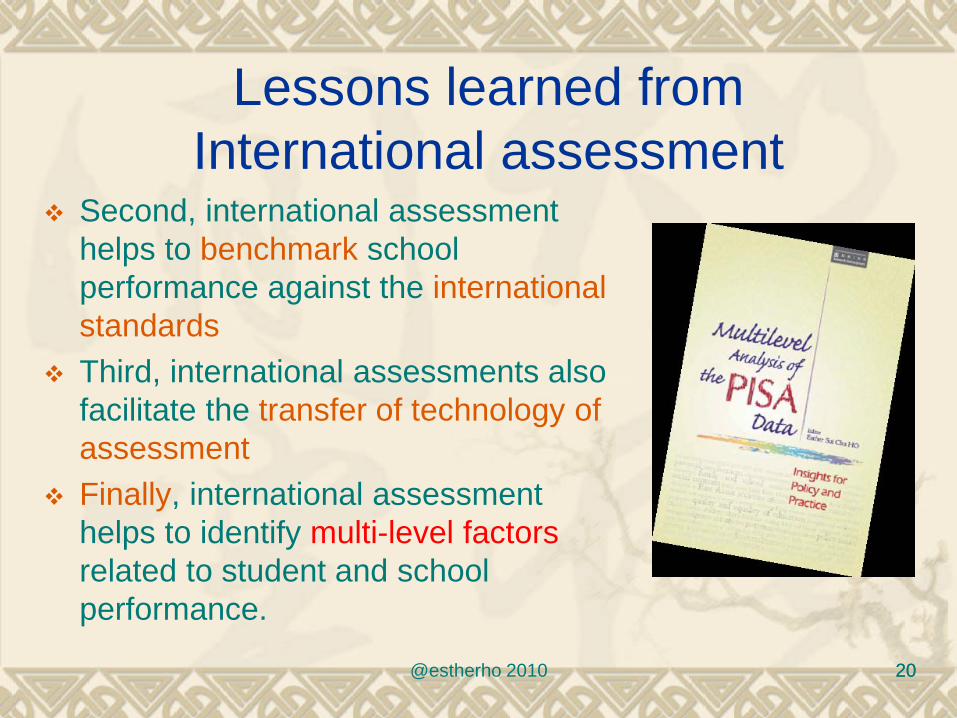
Lessons learned from
International assessment Second, international assessment
helps to benchmark school performance against the international standards
Third, international assessments also facilitate the transfer of technology of assessment
Finally, international assessment helps to identify multi-level factors related to student and school performance.
@estherho 2010 20
21 @estherho 2010 21
Presenter
Presentation Notes
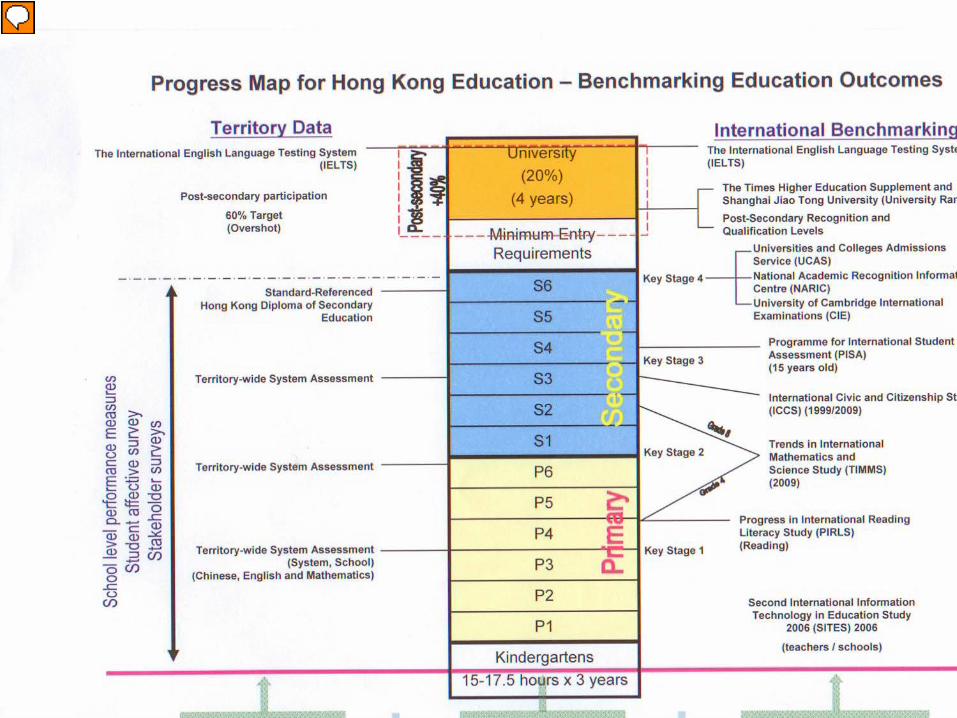
Many countries adopted a multi-level model to monitor students’ learning outcomes and school performance (e.g. Hong Kong, Japan, Korea, New Zealand, Singapore). Take Hong Kong as an example (See figure 1). At the international level, Hong Kong has international benchmarking through participation in PIRLS for P4;TIMMS for P4 and S2, ICCS for S3; PISA for 15-Year-Old students; and so on. At the national level, Hong Kong has the national assessment of TSA for all students at P3, P6 and S3; and national/public examination HKDSE will be implemented in 2012 for S6, the final year of the New Senior Secondary System. At the school level, Hong Kong has conducted student affective survey and stakeholder surveys for parents, teachers and school administrators. Hong Kong has also constructed as the value added measures of school performance for each examination subjects which compare how students with similar academic intake perform annually since 2000. At the classroom level, SBA has always an integral part of teaching and learning. Yet in 2012 SBA will be introduced to the examination subjects to cover a wider range of curricular outcomes that might not be able to assess by public examination
22 22
(a) SES
Achievem
ent
(b) SES
Achievem
ent
(a) SES
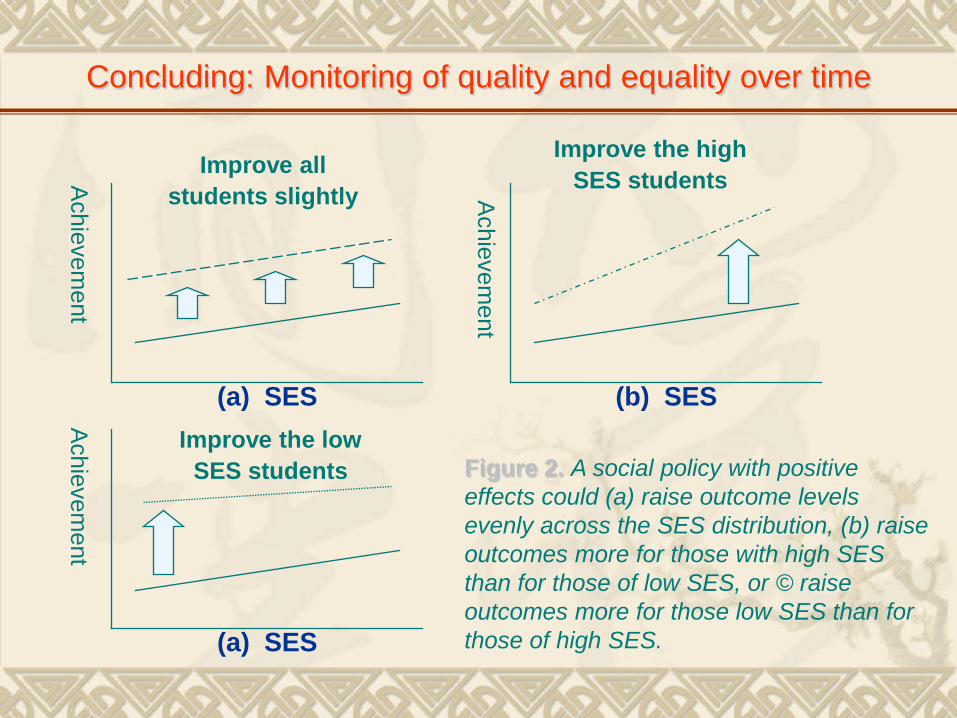
Figure 2. A social policy with positive effects could (a) raise outcome levels evenly across the SES distribution, (b) raise outcomes more for those with high SES than for those of low SES, or © raise outcomes more for those low SES than for those of high SES.
Concluding: Monitoring of quality and equality over time
Improve the high
SES students
Achievem
ent
Improve all students slightly
Improve the low SES students
23
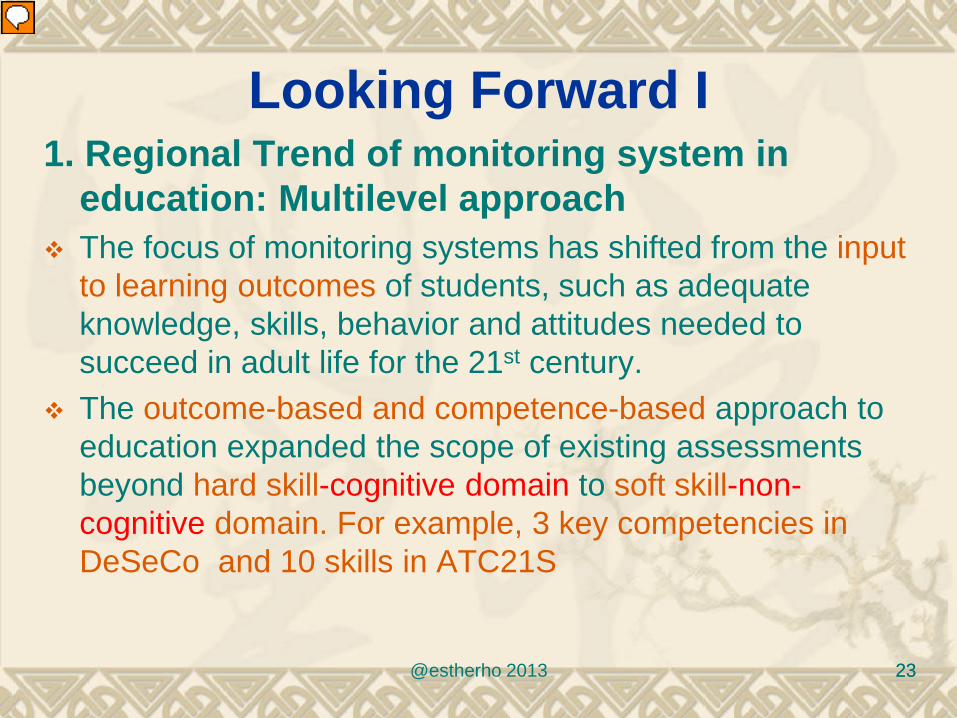
Looking Forward I 1. Regional Trend of monitoring system in
education: Multilevel approach The focus of monitoring systems has shifted from the input
to learning outcomes of students, such as adequate knowledge, skills, behavior and attitudes needed to succeed in adult life for the 21st century.
The outcome-based and competence-based approach to education expanded the scope of existing assessments beyond hard skill-cognitive domain to soft skill-non-cognitive domain. For example, 3 key competencies in DeSeCo and 10 skills in ATC21S
@estherho 2013 23
Presenter
Presentation Notes
ACTC 21S: communication, critical thinking and problem solving in real-life, collaboration within heterogeneous group, creativity and innovation; information literarcy and technology literacy (ATC21S, 2010; OECD/DeSeCo,, 2003; Forumin, 2007).
24
Looking Forward II
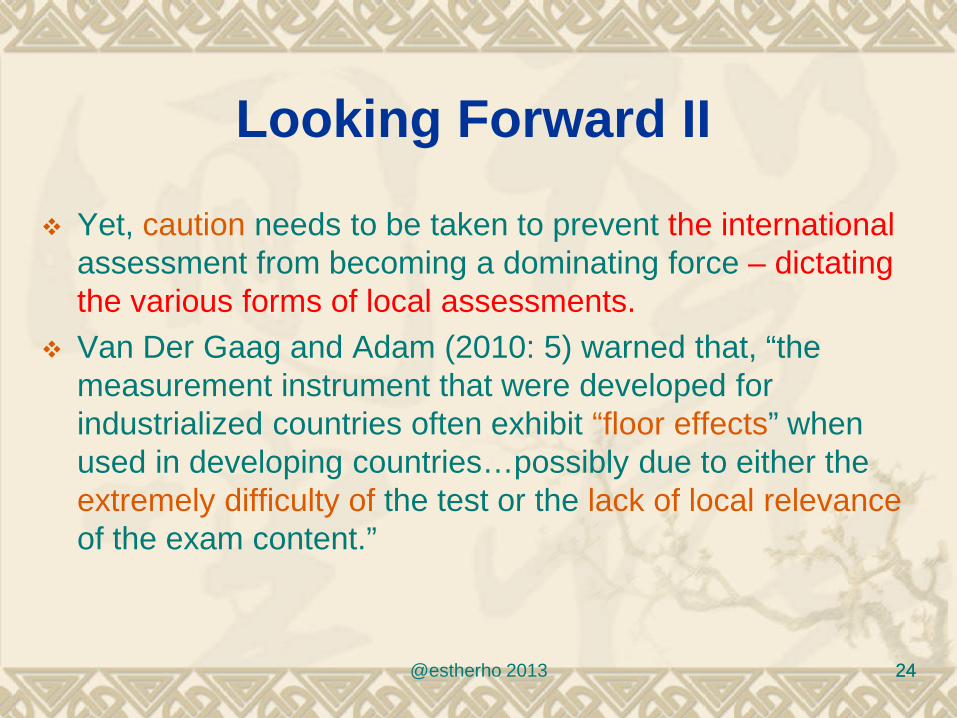
Yet, caution needs to be taken to prevent the international assessment from becoming a dominating force – dictating the various forms of local assessments.
Van Der Gaag and Adam (2010: 5) warned that, “the measurement instrument that were developed for industrialized countries often exhibit “floor effects” when used in developing countries…possibly due to either the extremely difficulty of the test or the lack of local relevance of the exam content.”
@estherho 2013 24
25
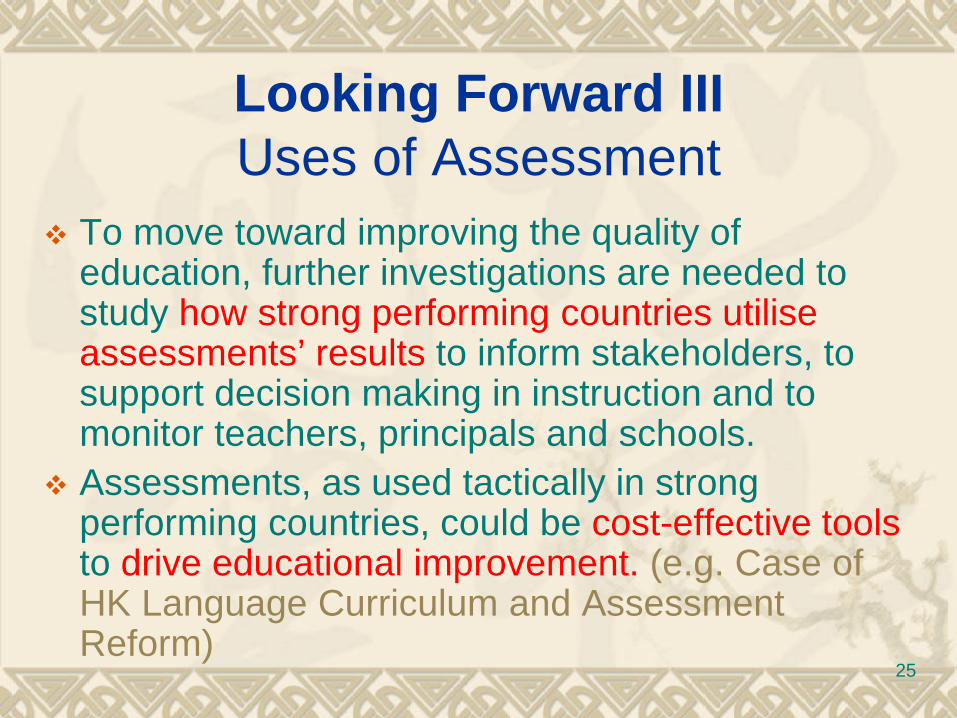
Looking Forward III Uses of Assessment
To move toward improving the quality of education, further investigations are needed to study how strong performing countries utilise assessments’ results to inform stakeholders, to support decision making in instruction and to monitor teachers, principals and schools.
Assessments, as used tactically in strong performing countries, could be cost-effective tools to drive educational improvement. (e.g. Case of HK Language Curriculum and Assessment Reform)
26
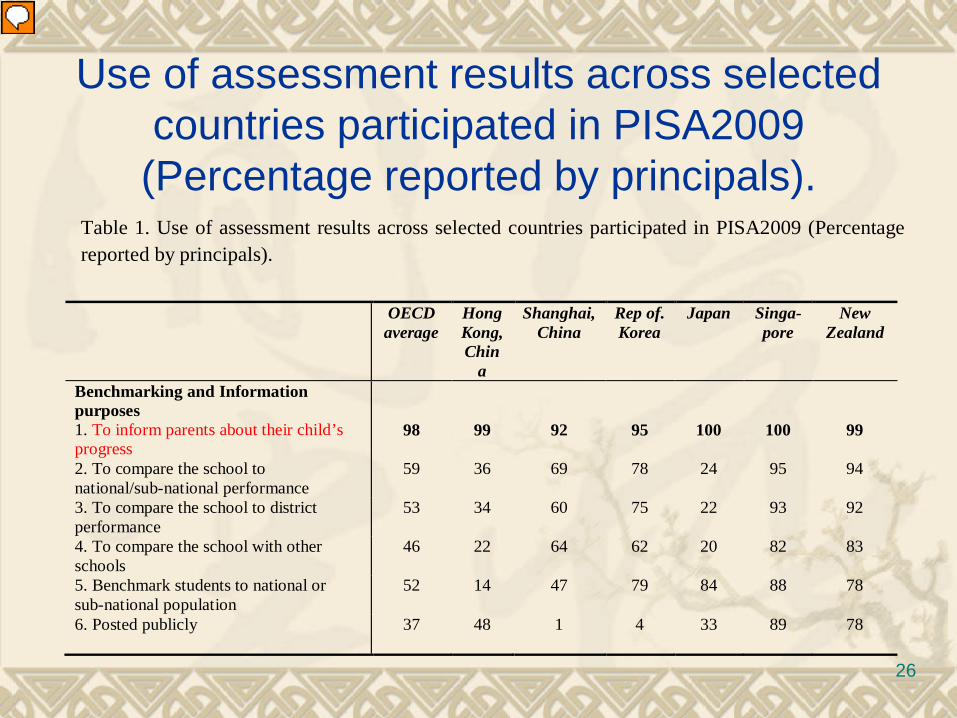
Use of assessment results across selected countries participated in PISA2009 (Percentage reported by principals).
Table 1. Use of assessment results across selected countries participated in PISA2009 (Percentage reported by principals).
OECD average
Hong Kong, Chin
a
Shanghai, China
Rep of. Korea
Japan Singa-pore
New Zealand
Benchmarking and Information purposes
1. To inform parents about their child’s progress
98 99 92 95 100 100 99
2. To compare the school to national/sub-national performance
59 36 69 78 24 95 94
3. To compare the school to district performance
53 34 60 75 22 93 92
4. To compare the school with other schools
46 22 64 62 20 82 83
5. Benchmark students to national or sub-national population
52 14 47 79 84 88 78
6. Posted publicly
37 48 1 4 33 89 78
Presenter
Presentation Notes
OECD (2011) report on “Strong Performers and Successful Reformers in Education”, it is common for schools to use assessment results for: benchmarking and informing stakeholders; to make decision for school improvement and to monitor teachers’, principals’ and schools’ performances.

27 @estherho 2013 27
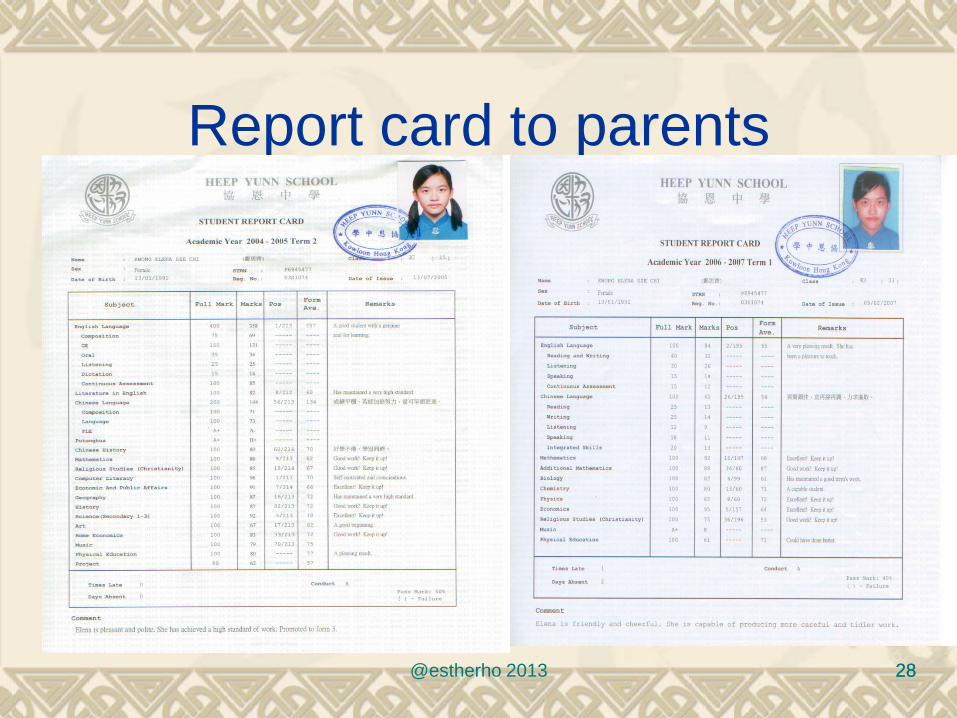
Report card for parents
28 @estherho 2013 28
Report card to parents
29
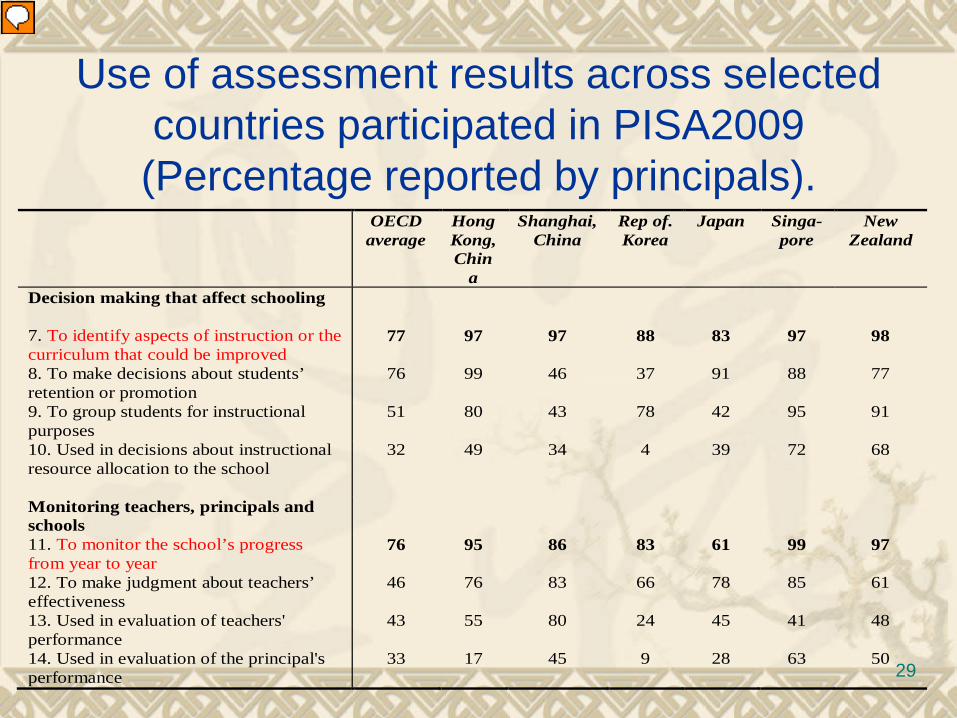
Use of assessment results across selected countries participated in PISA2009 (Percentage reported by principals).
OECD average
Hong Kong, Chin
a
Shanghai, China
Rep of. Korea
Japan Singa-pore
New Zealand
Decision making that affect schooling
7. To identify aspects of instruction or the curriculum that could be improved
77 97 97 88 83 97 98
8. To make decisions about students’ retention or promotion
76 99 46 37 91 88 77
9. To group students for instructional purposes
51 80 43 78 42 95 91
10. Used in decisions about instructional resource allocation to the school
32 49 34 4 39 72 68
Monitoring teachers, principals and schools
11. To monitor the school’s progress from year to year
76 95 86 83 61 99 97
12. To make judgment about teachers’ effectiveness
46 76 83 66 78 85 61
13. Used in evaluation of teachers' performance
43 55 80 24 45 41 48
14. Used in evaluation of the principal's performance
33 17 45 9 28 63 50
Presenter
Presentation Notes
Further investigation using PISA2009 indicates that for benchmarking and informing, nearly all schools reported that they used assessment results to “inform parents about student progress”, that is 98 per cent for the OECD average and similar percentages across the strong performing countries listed in Table 1. It follows “to identify aspects of instruction and curriculum improvement”, that is 77 per cent for the OECD average, but outstanding countries tend to use more (83-98 per cent) to inform improvement. It is obvious that strong performing countries are more likely than the OECD average to use evidence of assessment to make decision for school improvement.
30 @estherho 2013 30
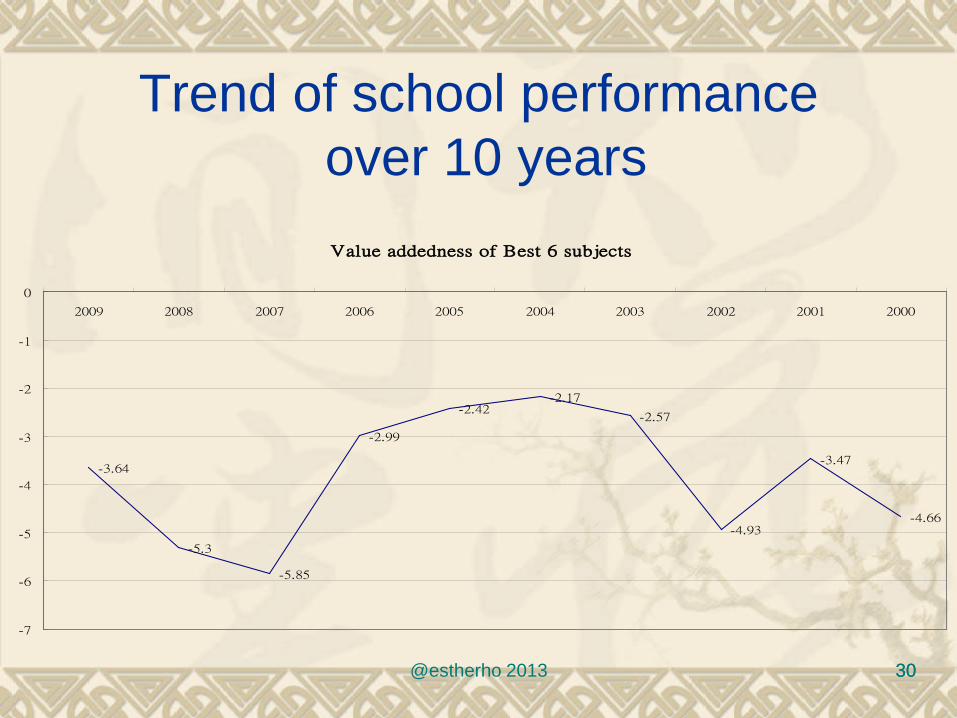
Trend of school performance over 10 years
Value addedness of Best 6 subjects
-3.64
-5.3
-5.85
-2.99
-2.42-2.17
-2.57
-4.93
-3.47
-4.66
-7
-6
-5
-4
-3
-2
-1
0
2009 2008 2007 2006 2005 2004 2003 2002 2001 2000
31 @estherho 2013 31
Further information [email protected] Tel: (852) 26097216 Fax: (852) 26035336
Visit the websites:
OECD-PISA :www.pisa.oecd.org HK-PISA: www.fed.cuhk.edu.hk/~hkpisa
HKPISA Centre Thank You !