STUDENT HOUSING MASTER PLAN UPDATE NEW MEXICO …
92
STUDENT HOUSING MASTER PLAN UPDATE NEW MEXICO STATE UNIVERSITY DECEMBER 2015 R E PORT INSPIRE. EMPOWER. ADVANCE.
Transcript of STUDENT HOUSING MASTER PLAN UPDATE NEW MEXICO …

S T U D E N T H O U S I N G M A S T E R P L A N U P DAT E
NEW MEXICO STATE UNIVERSITY
D EC E M B E R 2 0 1 5 R E P O R T
INSPIRE. EMPOWER. ADVANCE.

This Page Left Intentionally Blank

PREFACE
D E C E M B E R 2 0 1 5 i . 1
In the fall of 2015, New Mexico State University (“NMSU” or the “University) contracted Brailsford &
Dunlavey, Inc. (“B&D”) to provide an update to the 2009 Student Housing Master Plan (the “Master Plan”).
The purpose of this Master Plan is to identify current and future housing needs of New Mexico State
University including qualitative and quantitative analysis of the housing market and financial impact of any
improvements to housing.
The report, prepared by B&D’s project team comprised of Jeff Turner, Senior Vice President, Matthew
Bohannon, Regional Vice President, and Monty Jarecke, Project Analyst, sets forth B&D’s findings and
recommendations as part of the Master Plan. The findings contained herein represent the professional
opinions of B&D personnel based on assumptions and conditions detailed in this report. B&D has conducted
research using both primary and secondary information sources, which are deemed to be reliable but whose
accuracy B&D cannot guarantee.
Brailsford & Dunlavey would like to thank the following individuals and University staff for their guidance
during the development of this Plan:
Amy Baccei, Residential Life
Angela Throneberry, Senior Vice President Administration and Finance
Bernadette Montoya, Student Affairs / Enrollment Management
Bob Paz, Faculty / Associate Department Head
D’Anne Stuart, Administration / Auxiliary Services
Dacia Sedillo, Enrollment Management
Dan Howard, Executive Vice President and Provost
Dustin Chavez, ASNMSU
Elizabeth Franzoy, College of Engineering
Ermelinda Quintela, Auxiliary Services
Garrey Carruthers, President
Glen Haubold, Facilities & Services
Greg Fant, Academic Affairs
Jayna Whitehead, Barnes and Noble
Josh Hittle, Residence Hall Association
Judith Bosland, Assistant Vice President for Institutional Analysis
Laura Madson, Faculty
Mark Walker, Faculty
Mary Ballyk, Faculty
Melody Munson-McGee, Executive Vice President and Provost Office
Michael Jasek, Dean of Students
Norma Grijalva, Information & Communication Technologies
Scott Eschenbrenner, Aggie Development
Shelly Duran, Sodexo

NEW MEXICO STATE UNIVERSITY STUDENT HOUSING MASTER PLAN UPDATE
B R A I L S F O R D & D U N L A V E Y I N S P I R E . E M P O W E R . A D V A N C E . i . 2
Stephen Lopez, Police
Terry Cook, Student Engagement
Tom Smith, Faculty

TABLE OF CONTENTS
D E C E M B E R 2 0 1 5 i . 3
1 Executive Summary
2 Strategic Vision
3 Focus Group Report
4 Off-Campus Housing Market Analysis
5 Competitive Context Analysis
6 Survey Analysis
7 Demand Analysis
EXHIBITS
A Off-Campus Housing Market Data
B Competitive Context Data
C Survey Results
D Housing Demand Model

NEW MEXICO STATE UNIVERSITY STUDENT HOUSING MASTER PLAN UPDATE
B R A I L S F O R D & D U N L A V E Y I N S P I R E . E M P O W E R . A D V A N C E . i . 4

SECTION 1

This Page Left Intentionally Blank

EXECUTIVE SUMMARY
D E C E M B E R 2 0 1 5 1 . 1
EXECUTIVE SUMMARY
In the fall of 2015, New Mexico State University (“NMSU” or the “University”) contracted Brailsford &
Dunlavey, Inc. (“B&D”) to complete an update to the 2009 Student Housing Master Plan (“Master Plan”).
New Mexico State University is interested in assessing current demand for on-campus housing and
establishing a vision for future improvements to the housing system. Input from campus administrators,
community, off-campus market factors, and the student body were of critical importance to the University.
This Master Plan was completed to provide NMSU with qualitative and quantitative research to determine
how best to address future housing improvements.
CURRENT SITUATION
New Mexico State University currently enrolls approximately 15,500 students and houses nearly 2,500
students in single and family housing. NMSU has seen a decrease in enrollment since fall 2009 which
has corresponded to a decrease in housing occupancy that is currently at 79% (excluding residence halls
currently offline).
FIGURE 1.1: Historic fall enrollment and housing occupancy rates (Monagle Hall offline as of Fall 2013)
New Mexico State University is seeking to improve its position within the higher education market through
enhancing academic programs, entry requirements, and graduation rates. Student housing plays a
critical role in supporting this University directive through recruitment of students and retention through
the creation of communities supporting academic success. However, NMSU’s existing housing facilities
do not support this mission. With the exception of the two newer facilities, Piñon and Chamisa, significant
deferred maintenance is present across the housing portfolio. While NMSU has a large percentage of
junior-suite style housing for first-year students, the facilities lack community and academic spaces
typically found in other comparable housing. Significant improvements in housing facilities and
programming are required to complement the University’s other initiatives.
18,497 18,552
18,024
17,651
16,765
15,82915,490
94% 92%86%
79%83% 82%
79%
0%
10%
20%
30%
40%
50%
60%
70%
80%
90%
100%
14,000
14,500
15,000
15,500
16,000
16,500
17,000
17,500
18,000
18,500
19,000
Fall 2009 Fall 2010 Fall 2011 Fall 2012 Fall 2013 Fall 2014 Fall 2015
Fall Enrollment & Housing Occupancy
Headcount Housing Occupancy
NEW MEXICO STATE UNIVERSITY STUDENT HOUSING MASTER PLAN UPDATE
B R A I L S F O R D & D U N L A V E Y I N S P I R E . E M P O W E R . A D V A N C E . 1 . 2
WORK PLAN
B&D’s approach required an active working relationship with New Mexico State University students and
staff to develop an understanding of the institution’s mission, relevant stakeholders, customer groups, and
strategic project objectives which best serve that mission. The work plan included:
A strategic visioning session to identify how housing improvements would improve NMSU’s
educational outcomes, campus community, enrollment management, and financial performance;
A series of focus groups to qualitatively assess impressions of student housing;
An off-campus market analysis to understand the local housing market;
A competitive context analysis of similar institutions to evaluate their housing offerings;
A student survey to quantify preferences and priorities for housing and support spaces; and,
A demand analysis to quantify bed demand for the NMSU housing program.
FINDINGS AND RECOMMENDATIONS
Establishing a clear vision for student housing is critical to assessing student demand and future facility
improvements. Given the fact that housing at NMSU will play an integral role in the academic success of
students and the development of campus community, the primary focus of NMSU housing should be on
the first- and second-year populations. These cohorts require the greatest level of support transitioning to
a university environment and have proven to be the most positively impacted by living on campus. While
other student populations including Greeks and families are important to the University, they do not
represent the core housing market. It is also important that the University integrate academics and
housing to create an extension of the learning environment requiring support and participation from
faculty and administrators.
Institutions in the competitive context built an average of 590 beds each; Texas Tech alone built over
2,000 beds, through Public-Private Partnership (“P3”) deals since the prior Master Plan was completed,
compared to NMSU’s internally financed 282 beds1. In 2009, peer housing rates were averaging 23%
higher than NMSU, but currently peers are 30% higher signifying larger rate increases to support housing
improvements. The greatest variances in rates include traditional doubles (39%), traditional singles
(28%), semi-suite doubles (27%), and studio apartments (37%). Nationally, many universities have
focused housing improvements on the first- and second-year experience as a method of increasing
academic success and graduation rates, increasing housing rental rates to support new construction,
renovations, or other improvements. These improvements have come through both internal financing and
P3s.
1 Figures do not include beds removed from inventory through demolition or closure.

EXECUTIVE SUMMARY
D E C E M B E R 2 0 1 5 1 . 3
B&D’s outreach efforts included over 50 focus group and stakeholder participants and over 2,100 survey
responses. Focus group participants all indicated a need for student housing at NMSU even if they
wouldn’t live on campus. The availability of housing is an important or very important factor to 62% of
students surveyed. Key decision factors for students living on campus include the safety and security of
residence halls, proximity to NMSU resources, and convenience. Students currently felt that on-campus
housing was a cost effective living option, with greatest desirability for the newer, more expensive
communities, demonstrating that quality and value of the housing experience are still important and must
be viewed as a value proposition to students. Piñon and Chamisa both have the highest satisfaction
levels among students and a corresponding higher rental rate – students connect value to those facilities
and the experience they receive. Key areas of focus when the University improves housing include
affordable housing costs (99%), improving physical conditions of the halls (95%), providing attractive
amenities (93%), improving existing amenities (93%), and providing housing that is attractive to new
students (91%).
FIGURE 1.2: Satisfaction level by residence community
Students looking to move off campus do so to find more cost effective options (76%), access to a kitchen
(60%), more privacy (56%), and more living space (56%): these are typical responses for students
matriculating beyond student housing into the off-campus environment. With an average rental payment
of $409 plus utilities, competing for the private multi-family apartment housing market is a difficult
proposition for the University. The value proposition tilts more towards independence as students
matriculate and the low cost of renting in Las Cruces provides limited opportunities to create new
apartment facilities on campus.
Interest in campus housing was shown for all unit types tested and across all class levels. When filtering
demand by class level, current residence, and rent thresholds, B&D projected a demand of 2,878 beds of
housing at NMSU given the fall 2015 enrollment. This demand is slightly less than the current design
occupancy of housing (211 excess beds).
11%
4%
6%
5%
4%
0%
2%
0%
24%
26%
23%
16%
15%
10%
6%
1%
57%
57%
66%
66%
71%
67%
58%
60%
8%
13%
5%
12%
10%
23%
35%
38%
Cervantes Apartments
Cole Village
Vista del Monte Apartments
Tom Fort & Sutherland
Garcia Hall
Rhodes Garrett Hamiel Hall
Chamisa Village
Pinon Hall
Very unsatisfactory Unsatisfactory Satisfactory Very satisfactory

NEW MEXICO STATE UNIVERSITY STUDENT HOUSING MASTER PLAN UPDATE
B R A I L S F O R D & D U N L A V E Y I N S P I R E . E M P O W E R . A D V A N C E . 1 . 4
FIGURE 1.3: Demand for fall 2015
With a focus on improving academic success and retention, first-year students should not be placed in
apartments or single occupancy units. Adding this assumption into our demand projections indicates that
the number of apartments on campus can adequately address demand. Key areas of discrepancy occur
within traditional, semi-suite, and full-suite units and should be the primary focus of New Mexico State
University. Demand for specialty housing including family and Greek is much less than the current
supply. Greek housing is limited in total demand (100 beds) and presents challenges to the creation of a
sustainable on-campus Greek community. Additionally, only 22% of Greek affiliated survey respondents
indicated a desire to live in Greek specific housing. The majority of these students preferred to live in a
variety of unit types in general student housing.
FIGURE 1.4: Demand by housing unit type
It is important to note that increases in the first-time freshman cohorts will increase the demand for
traditional, semi-suite, and full-suite units. If the housing capture rate for all freshmen increases from
43% to 60%, an additional 383 beds of demand would be present.
Enrollment Classification EnrollmentCapture
Rate
Maximum Potential Demand
Freshman 2,264 43% 965Sophomore 2,279 21% 469Junior 2,696 15% 409Senior / Other 5,287 17% 889Graduate / Other 2,964 5% 146
TOTAL 15,490 19% 2,878EXISTING BED COUNT 3,089NET DEMAND (SURPLUS/(DEFICIT)) 211
138
1,314
0
779
254
572 619
339 306
782
100
407
0
200
400
600
800
1,000
1,200
1,400
Traditional Semi-Suites Full-Suites Apartments Greek Family
Existing Demand

EXECUTIVE SUMMARY
D E C E M B E R 2 0 1 5 1 . 5
NEXT STEPS
As New Mexico State University continues with improvements to its housing program, the following next
steps should be considered:
The University should develop new or improved housing communities for first- and second-year
students to support their recruitment and retention.
Housing should connect to the Vision 2020 strategic plan and academic programs. Housing
cannot effectively support the University if developing projects and programming in isolation.
A detailed residential life plan should be implemented to determine the level of staffing,
programming, and support necessary to achieve the desired goals of increased academic
success and graduation rates.
The University should identify all funding options available to improve student housing including
internal financing and P3s.

NEW MEXICO STATE UNIVERSITY STUDENT HOUSING MASTER PLAN UPDATE
B R A I L S F O R D & D U N L A V E Y I N S P I R E . E M P O W E R . A D V A N C E . 1 . 6

SECTION 2

This Page Left Intentionally Blank

STRATEGIC ASSET VALUE ANALYSIS
D E C E M B E R 2 0 1 5 2 . 1
STRATEGIC ASSET VALUE ANALYSIS
OBJECTIVES
Nationwide, colleges and universities recognize the important role that student housing plays in meeting
institutional goals and enhancing campus life. On many campuses, student housing and related facilities
are used as strategic assets. In order to help achieve enrollment goals and address other priorities
related to student recruitment and retention, the university can use housing facilities to develop a
comprehensive campus community that raises and maintains student satisfaction.
B&D acknowledges the administration’s objective to enrich residential facilities that will serve as strategic
assets and enhance enrollment management goals by improving recruitment, retention, and satisfaction
among students. Although many factors impact the University’s ability to meet institutional goals, the
following report provides evidence that carefully planned housing and other “quality of life” facilities are
important components of the overall strategy. As a result, B&D identified NMSU’s strategic goals with the
Residential Student Success Initiative Working Group and reviewed the University’s and Residential Life’s
unique missions, and the existing housing capacity to contribute to the realization of these objectives.
METHODOLOGY
B&D uses a “Destination Value” approach to facility development to respond to the constant challenge of
assuring that campus life improvements respond to the University’s strategic objectives. More
specifically, B&D proceeded with the understanding that:
“All of the project objectives must be expressed in specific terms that demonstrate their
relevance to furthering the school’s mission, reinforcing campus values, responding to
institutional commitments and responsibilities, and improving the school’s competitive
position in the market.”
B&D’s approach required a working relationship with the University and NMSU administrators to develop
a detailed understanding of the institution’s mission, relevant stakeholders, customer groups, and
strategic project objectives which best serve that mission.

NEW MEXICO STATE UNIVERSITY STUDENT HOUSING MASTER PLAN UPDATE
B R A I L S F O R D & D U N L A V E Y I N S P I R E . E M P O W E R . A D V A N C E . 2 . 2
SUMMARY OF FINDINGS
Housing at NMSU will play an integral role in the academic success of students and campus community.
Key areas where housing will support the University’s vision include the recruitment of students, retention
of students, and integration of academics and campus services into housing.
Housing will focus on the key groups most positively impacted by its facilities primarily including
first and second year students.
– While other groups, such as students with families and Greeks remain important to the
University, they will be accommodated as much as can be provided.
NMSU needs to improve how housing and the University are marketed to students and their
parents. Rather than market the facilities offered by Pinon and Chamisa, the residential
experience should be marketed so as to establish key expectations for student development and
academic success. This common experience should be similar across all of the first-year
residence halls to where any variance in facilities is mitigated by the sense of community and
engagement present.
The selling points of NMSU to students including its safety, campus beauty, and collegiality
should be reflected in student housing as well.
A “wow factor” is required within the design and experience to be an attractive draw to potential
students. This wow factor does not require high cost construction but can be done through
sensible design decisions and opportunities to showcase the residential community.
Housing will integrate within the University academic experience to tie faculty and living-learning
communities with the residential population. This connection is critical to improve the retention
and academic success of first-year students as they transition into the University environment. In
order for this integration to be successful, housing facilities must integrate programing and activity
space to support living-learning communities which include classrooms, small group seminar /
study rooms, resource / lab spaces, and / or faculty offices. New construction or renovations to
housing should focus on community clusters between 40 and 50 students to mirror community
assistant and living-learning community clusters.
NMSU must provide adequate support for attracting and retaining students in housing including
financial support, counselling services, and academic support.
In order to address the above components, NMSU Housing must review its rate structure,
financial aid, and room selection procedures to make sure that students with the most need are
placed in the housing option most supportive.
NMSU will develop a second-year experience for returning students that is different from the
current first-year focus to aid in retaining students in housing. These programs typically have a
greater focus on academic support as well as internship / career development.

SECTION 3

This Page Left Intentionally Blank

SECTION 4

This Page Left Intentionally Blank

OFF-CAMPUS HOUSING MARKET ANALYSIS
D E C E M B E R 2 0 1 5 4 . 1
OFF-CAMPUS HOUSING MARKET ANALYSIS
OBJECTIVE
Brailsford & Dunlavey conducted an analysis of the housing rates available to students in the off-campus
market to understand any new changes that may have occurred since 2014. The results of the analysis
are helpful in understanding any issues that could impact demand for potential student housing projects
at New Mexico State University in the future.
METHODOLOGY
B&D’s off-campus market analysis identified specific characteristics of the competitive rental housing
market surrounding the institution, including current rental rates. Further, this research analyzed
demographic changes near the University that may impact the housing market. Information was collected
via Sites USA, the United States Census Bureau, interviews with leasing agents, and Internet research.
The results of this analysis were also compared to those from B&D’s 2014 housing market analysis. The
comparison identified any changes that occurred in the market since that time.

NEW MEXICO STATE UNIVERSITY STUDENT HOUSING MASTER PLAN UPDATE
B R A I L S F O R D & D U N L A V E Y I N S P I R E . E M P O W E R . A D V A N C E . 4 . 2
SUMMARY OF FINDINGS
AREA CHARACTERISTICS
Demographic Overview
As of 2010, there were just under 12,000 people within a one-mile radius of the University’s campus,
expanding out to over 93,000 within a five-mile radius. Growth in these areas is expected to increase
annually at a rate of 0.3% to 0.8%. In 2015, average household sizes ranged from 2.1 to 2.3 people per
household in the three radii. Given the projected growth in households and population for the three radii,
only the one-mile radius will have difficulty accommodating the housing needs of its population.
FIGURE 4.1: Demographic overview
Housing Overview
In 2014, single-family homes make up the greatest portion of the city’s housing at 64% of total inventory.
Since 2000, the housing stock of Las Cruces has grown by 11,118 units, an annual increase of 9% per
year. The greatest amount of growth has occurred in single-family homes, while multi-family housing
remains at 28% of inventory and other housing has decreased. This growth in single-family homes is a
result of shifting land away from mobile-homes to the single-family home market.
FIGURE 4.2: Housing composition overview
2010 Population 11,856 53,850 93,302 2010 Households 4,659 22,302 37,647
2015 Population 11,989 54,477 96,260 2015 Households 4,830 23,076 39,640
Growth Rate from 2000 0.3% 0.3% 0.8% Growth Rate from 2000 0.9% 0.9% 1.3%
2020 Population 12,046 54,969 97,429 2020 Households 5,106 24,490 42,207
Growth Rate from 2015 0.1% 0.2% 0.2% Growth Rate from 2015 1.1% 1.2% 1.3%
Population Accomodated 89% 102% 100% Average Household Size 2.1 2.3 2.3
Source: SitesUSA
3 Miles 5 MilesPopulation Overview 1 Mile 3 Miles 5 Miles Household Overview 1 Mile
Single-family 18,770 59% 24,368 61% 27,182 64%
Multi-family 8,834 28% 11,128 28% 11,738 27%
Other 4,048 13% 4,365 11% 3,850 9%
Total 31,652 100% 39,861 100% 42,770 100%
Source: Census
Housing TypeNumber of
UnitsPercent of Total Units
Number of Units
Percent of Total Units
Number of Units
Percent of Total Units
2000 2010 2014

OFF-CAMPUS HOUSING MARKET ANALYSIS
D E C E M B E R 2 0 1 5 4 . 3
RATE ANALYSIS
B&D analyzed the off-campus rental rates at multiple properties within three-miles of campus. Thirty (30)
multi-family apartment complexes were reviewed. Market data for this analysis was collected during
October 2015.
Current Rate Analysis
The average rental rates for an entire one, two-, and three-bedroom apartment were $587, $699, and
$868, respectively. Compared with market research performed by B&D in 2014, one-bedroom prices rose
5%, two-bedroom units rose 6%, and three-bedroom units increased by 11%, respectively.
FIGURE 4.3: Rental rate by unit type in 2015
$587
$699
$868
$587
$349 $289 $293
$175 $145
1BR 2BR 3BR
Unit Single Occupany Double Occupancy

NEW MEXICO STATE UNIVERSITY STUDENT HOUSING MASTER PLAN UPDATE
B R A I L S F O R D & D U N L A V E Y I N S P I R E . E M P O W E R . A D V A N C E . 4 . 4

SECTION 5

This Page Left Intentionally Blank

COMPETITIVE CONTEXT ANALYSIS
D E C E M B E R 2 0 1 5 5 . 1
COMPETITIVE CONTEXT ANALYSIS
OBJECTIVE
Brailsford & Dunlavey conducted an analysis of competitor institutions for New Mexico State University.
This analysis was conducted to profile aspects of student housing for each of the surveyed institutions. It
was B&D’s intent to evaluate NMSU’s competitive position against other institutions and identify
opportunities for improvements or additions to its existing residential facilities. This information will help the
University improve its student recruitment and retention strategies.
METHODOLOGY
With the support of NMSU’s Office of Administration and Finance, seven schools were selected on the
basis of their competitiveness to recruit students from the same applicant pool as NMSU which were
included in the prior Housing Master Plan. The following is a list of the seven institutions that were assessed
for this analysis:
Arizona State University
Northern Arizona University
Texas Tech University
University of Arizona
University of New Mexico
University of Texas at El Paso
Utah State University
Data are based on fall 2014 figures and were collected primarily through the institutions’ websites and
conversations with university housing officials / administrators. Secondary sources included common data
sets completed by University staff.

NEW MEXICO STATE UNIVERSITY STUDENT HOUSING MASTER PLAN UPDATE
B R A I L S F O R D & D U N L A V E Y I N S P I R E . E M P O W E R . A D V A N C E . 5 . 2
SUMMARY OF FINDINGS
COST OF ATTENDANCE
The peer universities chosen were located in various urban and rural locations within the western region of
the country. Tuition rates from all peer universities vary slightly due to the state and university system they
operate within:
In-state tuition for all seven peer universities had an average cost of $7,403 and a median of $6,597,
both of which were higher than NMSU’s rate of $6,092.
In the case of out-of-state tuition rates, NMSU was less than its peers. The average total out-of-
state tuition rate among peer universities was $21,484, slightly higher than the rate of $19,650 at
NMSU. The median of the peer universities was $19,464.
The room and board rate at NMSU was roughly $1,600 less than the average of its peers. The peer
average was $8,608, while the annual estimate for NMSU was $7,010.
The total costs were evaluated from the perspective of tuition and the room and board rate of each
university. The average total at NMSU was roughly $13,102, which was lower than the peer average of
$16,310 and the median of $15,002. Further, the out-of-state total fee for students attending NMSU was
$26,660. This amount was less than the peer average of $30,763 and peer median of $28,044.
FIGURE 5.1: Peer cost of attendance
1 Tuition & Fees per year, based on undergraduate status, and 15 credit hours per semester
2 Room & Board per year, based on double occupancy traditional unit and 14 meals per week
3 UTEP does not offer traditional units or meal plans
In-State Out-of-State
New Mexico State University Public $6,092 $19,650 $7,010
Arizona State University at Tempe Public $9,484 $23,830 $10,010
Northern Arizona University Public $9,120 $21,640 $9,020
Texas Tech University Public $6,597 $18,297 $8,405
University of Arizona Public $10,390 $31,617 $9,840
University of New Mexico Public $5,007 $19,464 $8,580
University of Texas at El Paso3 Public $5,606 $17,456 $9,299
Utah State University Public $5,617 $18,087 $5,790
AVERAGE (excluding NMSU) $7,403 $21,484 $8,608
University AffiliationTuition ₁ Room &
Board 2

COMPETITIVE CONTEXT ANALYSIS
D E C E M B E R 2 0 1 5 5 . 3
DEMOGRAPHICS
The spectrum of student demographics at peer universities varied widely when analyzed from the
perspective of total, undergraduate, graduate, and out-of-state enrollment. However, the difference among
freshman retention rates was much closer than other demographic categories considered.
FIGURE 5.2: Peer demographic data
1Enrollment data based on 2014/2015 academic year
2Based on freshman fall 2013 cohort
NMSU’s total enrollment of 15,829 was found to be less than half the average of its peers (33,442).
This was similar in the case of NMSU’s undergraduate enrollment (47% of peer average) and
graduate enrollment (49% of peer average).
The percent of out-of-state students among peer universities varied from 28% (Northern Arizona
University and University of Arizona) to 3% (Utah State University). The amount of out-of-state
students at NMSU makes up 25% of its total enrollment, while the peer average is only 18%.
Freshman retention rates taken from the fall 2013 cohort were similar among peer universities
ranging from 86% (Arizona State University) to 68% (University of Texas at El Paso). The freshman
retention rate at NMSU of 74% was only slightly less than the peer average of 78%.
HOUSING RATES
Housing rates at peer universities were higher than those at NMSU across all unit types. Below are peer
housing rates for the unit types that also exist at NMSU.
Total Undergraduate Graduate Percent Freshman
Enrollment1 Enrollment Enrollment Out-of-State Retention2
New Mexico State University 15,829 12,784 3,045 25% 74%
Arizona State University at Tempe 50,358 39,968 10,390 24% 86%
Northern Arizona University 27,715 23,845 3,870 28% 74%
Texas Tech University 35,158 28,632 6,526 6% 83%
University of Arizona 42,236 32,987 9,249 28% 82%
University of New Mexico 27,887 20,857 7,030 10% 79%
University of Texas at El Paso 23,079 19,817 3,262 3% 68%
Utah State University 27,662 24,271 3,391 25% 71%
AVERAGE (excluding NMSU) 33,442 27,197 6,245 18% 78%
University

NEW MEXICO STATE UNIVERSITY STUDENT HOUSING MASTER PLAN UPDATE
B R A I L S F O R D & D U N L A V E Y I N S P I R E . E M P O W E R . A D V A N C E . 5 . 4
FIGURE 5.3: Peer housing rates
On average, peer housing rates are 30% higher than NMSU.
In 2008, peer housing rates were 23% higher than NMSU, which indicates peer universities have
invested more in their housing portfolio providing a market and recruitment advantage.
P3 HOUSING
Peer universities have shown a willingness to partner with the private market to help meet their student
housing needs. Below is collation of public-private-partnership (“P3”) beds that have been developed at
peer universities since 2008.
FIGURE 5.4: Peer P3 Housing
Partnerships with the outside market have varied at peer universities. On average, NMSU’s peers
have developed 1,573 beds via the P3 mechanism since 2008.
Peer universities have an average of 2,971 P3 developed beds as part of their housing inventory.
University Single Double Triple2BR / 1BA
2BR / 1BA
(double)Studio
1BR / 1BA
2BR / 1BA
4BR / 2BA
2BR / 1BA
4BR / 2BA
New Mexico State University $2,460 $1,737 $1,297 $2,802 $1,923 $2,303 $3,318 $2,522 $2,344 $630 $856
University of New Mexico $2,795 $2,445 $2,895 $2,545
University of Texas at El Paso $2,666 $2,520 $2,441
Texas Tech University $2,819 $2,255 $1,755 $3,875 $3,500
University of Arizona $5,145 $3,430 $2,875 $2,506
Arizona State University at Tempe $3,375 $2,815 $4,110 $3,216 $3,645 $3,845 $3,420
Northern Arizona University $2,468 $1,968 $821
Utah State University $1,560 $1,045 $1,490 $477
Average (excluding NMSU) $3,139 $2,410 $2,393 $3,503 $2,439 $3,156 $3,860 $2,970 $2,971 $649 NA
Percent Difference -28% -39% -85% -25% -27% -37% -16% -18% -27% -3% NA
FAMILY /
GRADUATE 1TRADITIONAL UNITS SEMI-SUITES SINGLE APARTMENTS
New Mexico State University - -
Arizona State University at Tempe 3,089 8,521
Northern Arizona University 1,126 1,126
Texas Tech University 2,087 4,680
University of Arizona 764 1,127
University of New Mexico 1,892 1,892
University of Texas at El Paso - -
Utah State University 480 480
AVERAGE (excluding NMSU) 1,573 2,971
University P3 Beds - Post 2008 Total P3 Beds

SECTION 6

This Page Left Intentionally Blank

SURVEY ANALYSIS
D E C E M B E R 2 0 1 5 6 . 1
SURVEY ANALYSIS
Brailsford & Dunlavey conducted an electronic survey via the Internet to test the housing preferences of
current New Mexico State University students. Data collected by the student survey formed the basis for
B&D’s recommendations on the types and quantity of housing projected in the Demand Analysis section.
Survey questions were designed to assess current living conditions and preferences for future student
housing. Response options were structured to maximize information in the projection of desirable facility
characteristics and demand for specific unit types at identified rental rates. Demographic questions allow
B&D to organize the responses and analyze demand based on different student characteristics.
MARGIN OF ERROR
To ensure a reliable sample and credible data, B&D made every attempt to reduce non-response bias
and minimize the margin of error by developing a consistent survey design and methodology that
encouraged all participants to respond to the survey. Upon completion of the survey collection process,
results and projections were sorted by various demographic characteristics to refine the demand results.
Detailed survey results can be found in Exhibit C of this report.
Approximately 2,177 current New Mexico State students participated in the housing survey, yielding a
14% response rate. The margin of error for the survey sample was +/-2.0% based on a 95% confidence
interval.
B&D also compared the demographics of the survey respondents to the demographic distribution of New
Mexico State students to identify any variances between the two populations and ensure that the survey
results could be inferred among the entire University demographic.
Survey sample demographics were consistent with the overall demographics of NMSU with the exception
of an over-representation of on-campus and part-time students among the survey sample. Small amounts
of skewing in the survey sample is typical and acceptable due to the fact that no single group is grossly
over- or under-represented. In addition, B&D’s methodology for determining demand allows for the
isolation of demographic sub-groups in order to determine their response to any single question.

NEW MEXICO STATE UNIVERSITY STUDENT HOUSING MASTER PLAN UPDATE
B R A I L S F O R D & D U N L A V E Y I N S P I R E . E M P O W E R . A D V A N C E . 6 . 2
SUMMARY OF FINDINGS
Survey participants were asked how important the availability of student housing was in their decision to
attend NMSU. Nearly 62% of respondents indicated that the availability of housing was either very
important or important in their decision. Among students coming to the University from outside of the
country, roughly 72% found the availability of housing to be important. This response level may suggest
the importance housing plays in the recruitment and eventual retention of New Mexico State students.
FIGURE 6.1: How important was the availability of housing in your decision to attend NMSU?
Given the importance placed on the availability of housing, B&D’s analysis gave consideration to its
performance via student satisfaction. Overall, students either agreed or strongly agreed with a series of
statements related to housing’s ability to have a positive impact on a student’s personal, professional, and
academic growth. However, students did not agree that housing provided a cost effective living option or
enough leadership opportunities. When satisfaction was considered by each housing facility, more
recently developed housing was favored by students. This analysis suggests that newer housing facilities
can aid NMSU in the satisfaction of NMSU students’ residential needs.
32%Very important
31%Important
26%Unimportnat
11%Very unimportant
11%
4%
6%
5%
4%
0%
2%
0%
24%
26%
23%
16%
15%
10%
6%
1%
57%
57%
66%
66%
71%
67%
58%
60%
8%
13%
5%
12%
10%
23%
35%
38%
Cervantes Apartments
Cole Village
Vista del Monte Apartments
Tom Fort & Sutherland
Garcia Hall
Rhodes Garrett Hamiel Hall
Chamisa Village
Pinon Hall
Very unsatisfactory Unsatisfactory Satisfactory Very satisfactory

SURVEY ANALYSIS
D E C E M B E R 2 0 1 5 6 . 3
FIGURE 6.2: How satisfied are you with your current housing facility?
The preference among students for newer housing inventory led B&D to consider what other factors
influenced their housing decision. Students living in on-campus housing showed a preference toward
factors that support their academic pursuits via proximity to campus resources. Those in the off-campus
market were attracted to factors that promoted an independent lifestyle through greater privacy. This data
may suggest the need for any new on-campus housing to incorporate elements of the off-campus market
in order to remain competitive among students looking for greater independence and privacy.
FIGURE 6.3: How important were the following factors in your decision on where to live this year?
Considering the different factors that attract students to live on and off campus, the analysis examined
where students plan on living in the following academic year. Results revealed that twice as many
students plan to live off campus as opposed to on campus, despite high satisfaction levels with on-
campus housing. Respondents also indicated that 23% of students are still undecided as to where they
will live next year. The large percentage of students that have not committed to on-campus housing may
suggest that available inventory may not be accommodating their future needs.
FIGURE 6.4: Where do you plan on living next year?
The analysis considered the reasons students were choosing to move into the off-campus market. The
three most frequently cited reasons among on- and off-campus students was the need for a cost effective
On-Campus Students Percent Off-Campus Students Percent
1 Safety and security features 94% 1 Availability of a kitchen 93%
2 Availability of high-speed Internet 94% 2 Total cost of rent and utilities 93%
3 Availability of convenient laundry facilities 93% 3 Availability of convenient laundry facilities 91%
4 Total cost of rent and utilities 92% 4 Availability of a quiet place to study 90%
5 Availability of a quiet place to study 92% 5 Safety and security features 89%
6 Access to NMSU resources 90% 6 Availability of high-speed Internet 87%
7 Availability of my preferred housing unit type 90% 7 Additional living space outside my bedroom 86%
8 Reliable maintenance and custodial services 90% 8 Availability of my preferred housing unit type 85%
9 Live in building with physical features I desire 85% 9 Availability of a private (single) bedroom 84%
10 Proximity to classes 84% 10 Availability of a good building manager 83%
12%Will not be
attending NMSU
23%Undecided
22%On Campus
43%Off campus

NEW MEXICO STATE UNIVERSITY STUDENT HOUSING MASTER PLAN UPDATE
B R A I L S F O R D & D U N L A V E Y I N S P I R E . E M P O W E R . A D V A N C E . 6 . 4
option, more privacy, and more living space. This analysis indicates that students are moving into the off-
campus market to establish a more independent lifestyle at a lower price point. In addition, on-campus
students were also interested in facilities in better physical condition, specifically those living in Garcia
Hall. In order to remain competitive with off-campus properties, new housing inventory should attempt to
emulate features that allow for independence and better aesthetics.
FIGURE 6.5: If considering living off campus next year, why would you prefer to do so?
The intent of students to move off campus led B&D to investigate which years they would live or move
back on campus if their preferences were met. Those results were then compared to those years
students have lived in NMSU housing to determine if any unmet demand existed. Students indicated that
they would live on campus at higher levels in each of their years as a student if NMSU housing met their
preferences. These elevated levels of demand may suggest that a large market of students exist that
would live on campus if housing matched their preferences. If housing does not address the needs of
students, it is possible that occupancy levels will continue to decrease as NMSU’s inventory ages.
On-Campus Students Percent Off-Campus Students Percent
More cost effective 58% More cost effective 76%
More living space 56% Access to my own kitchen 60%
More privacy 48% More privacy 56%
To have a pet 46% More living space 56%
Access to my own kitchen 42% More convenient laundry facilities 49%
Better physical condition of the building 40% No meal plan requirement 47%
More convenient laundry facilities 40% Better living unit amenities 40%
Better living unit amenities 38% Better Internet access 37%
Better Internet access 33% Fewer rules and regulations 34%
Ability to live with or near friends 29% To have a pet 33%
Better maintenance and housekeeping 25% To live in a quieter environment 32%

SURVEY ANALYSIS
D E C E M B E R 2 0 1 5 6 . 5
FIGURE 6.6: Which years have you lived in NMSU’s student housing? If your housing preferences were met each year, which years would you live in NMSU’s student housing?
HOUSING PREFERENCES
The analysis examined the most important factors chosen by students to consider in a new housing
facility. The intent is to determine which factors to incorporate into any new housing facility that may
increase its attractiveness to future students. In addition to affordability, the factors that were the most
important focused on the issue of campus housing’s physical attractiveness and amenities. While 99% of
students indicated affordable housing as most important, improving the physical condition (95%),
providing and improving attractive amenities (93%), and offering attractive housing to prospective
students (91%) were also seen as important.
Further, those factors that are least important to students should be given less attention in order to focus
on what will make the new facility a success. Programs that students felt were not as critical to an
improved housing system were the creation of new residential communities (84%), better dining programs
(81%), and improved housekeeping services (81%). The lower emphasis on these programs may
highlight the importance of improving the physical aesthetics of any new housing facility.
37%
46%
25%
18%
9%
6%
18%
57%
48%
39%
34%
20%
Never Freshman year Sophomore year Junior year Senior year(s) Graduate year(s)
Have lived on campus Would live on campus

NEW MEXICO STATE UNIVERSITY STUDENT HOUSING MASTER PLAN UPDATE
B R A I L S F O R D & D U N L A V E Y I N S P I R E . E M P O W E R . A D V A N C E . 6 . 6
FIGURE 6.7: How important each of the following factors as NMSU considers improvements to on-campus housing?
The survey then asked students to rank the most important physical features as the University considers
building new housing. Those features that were indicated as being the most important were associated
with housing units that allowed for greater independence. The features that include an in-unit full kitchen
(56%), private bedroom (49%), washer and dryer in living unit (36%), and living room are common for
students seeking greater privacy. These findings indicate a need by University housing to consider ways
that make the living experience more private.
FIGURE 6.8: If NMSU built new housing, which five physical features would be the most important to you?
Given the importance of wireless Internet among focus group participants, survey respondents were
asked to rate their satisfaction with their connectivity. Those students living on campus had lower levels of
satisfaction (53%) than those students living off campus (79%). Half of on-campus students also indicated
that they connect at least four devices to their wireless Internet. Satisfaction levels were below 40% in
Chamisa Village, Vista Del Monte Apartments, Cervantes Apartments, and Cervantes Village. This
analysis suggests that the on-campus infrastructure needed to accommodate Internet use is not sufficient
FACTORS | MOST IMPORTANT FACTORS | LEAST IMPORTANT
1 Affordable Housing Costs (99%)
2 Improve Physical Condition (95%)
3 Provide Attractive Amenities (93%)
4 Improve Existing Amenities (93%)
5 Attractive to New Students (91%)
1 Increase Campus Population (72%)
2 Improve Existing Dining (81%)
3 Improve Housekeeping (81%)
4 More Residential Communities (84%)
5 Improve Housing Office (85%)
Most Important Physical Features Percent Least Important Physical Features Percent
1 In-unit full kitchen 56% 1 Classrooms/academic facilities in the building 1%
2 In-room wireless Internet access 53% 2 Convenient access to public transportation 3%
3 Private (single) bedroom 49% 3 Other (please specify) 3%
4 Private bathroom 39% 4 Convenient on-campus dining options 4%
5 Washer and dryer in the living unit 36% 5 Social lounge/TV room in the building 5%
6 Convenient location 32% 6 Computer lab in the housing facility/complex 8%
7 On-site parking 25% 7 Environmentally-friendly design and operation 9%
8 Living room 25% 8 Controlled/secured access to the building 9%
9 Fully furnished living unit 23% 9 Quiet study area in the building 12%
10 Full-sized beds 21% 10 Fitness or recreation area(s) in or near housing 12%

SURVEY ANALYSIS
D E C E M B E R 2 0 1 5 6 . 7
Apartment/condo rented, 39%
House owned by a family member
(not partner), 21%
House rented, 20%
House owned by me or my
spouse/partner , 11%
Other, 6%
Individual room rented in a house,
2%
Sorority/fraternity house, 1%
to meet the demands of today’s students. If these needs are not met, connectivity may become another
reason for students to move into the off-campus market.
FIGURE 6.9: How would you rate your access to the Internet?
OFF-CAMPUS MARKET
The survey presented a series of questions to better understand if the students living in the off-campus
market would make good candidates to move back on campus. Respondent data revealed that 54% of
students are living with housemates similar to ones they would be living with if they returned to campus
housing. In Figure 6.11, 61% of students are shown to be living in units that are similar to ones that would
be available to them on campus. These results may reveal that there exists a large market of students
living off campus who would make suitable candidates to return to University housing if it met their
preferences.
FIGURE 6.10: Whom are you currently living with off campus? (Left) FIGURE 6.11: What type of unit do you live in off campus? (Right)
17%
36%
29%
18%
34%
45%
15%
6%
Very satisfactory Satisfactory Somewhat unsatisfactory Very unsatisfactory
On Campus Off Campus
Housemate Percent
NMSU roommate(s) 33%
With spouse/partner and/or children 25%
With my parent(s) or other relative(s) 19%
I live alone 14%
NMSU and non-NMSU roommate(s) 5%
With other non-NMSU roommate(s) 3%
Other 2%

NEW MEXICO STATE UNIVERSITY STUDENT HOUSING MASTER PLAN UPDATE
B R A I L S F O R D & D U N L A V E Y I N S P I R E . E M P O W E R . A D V A N C E . 6 . 8
Feedback from participants revealed that students living in the off-campus market are paying an average
of $409 per month, excluding utilities. This figure should take into consideration that on average, students
are sharing the cost of rent with at least one other person. In addition, the average amount each student
contributed toward utilities was $120, bringing the total amount spent by each off-campus student to $529
per month. Students also reported contributing an average of $258 toward their security deposit.
Additionally, 58% of students identified having a lease that was twelve months or greater.
FIGURE 6.12: How much is your share of monthly rent?
3%
8%
22%
26%
17%
8%6%
3% 3% 2% 2%
Less than$100
$100 to$199
$200 to$299
$300 to$399
$400 to$499
$500 to$599
$600 to$699
$700 to$799
$800 to$899
$900 to$999
$1,000 ormore

SECTION 7

This Page Left Intentionally Blank

DEMAND ANALYSIS
D E C E M B E R 2 0 1 5 7 . 1
DEMAND ANALYSIS
OBJECTIVE
B&D developed a detailed model to project the specific level of demand for student housing at New
Mexico State University. The model derives demand from electronic survey responses, as well as current
and projected enrollment figures provided by the University.
METHODOLOGY
By utilizing a series of sample unit types (traditional, semi-suite, full-suite, and apartment) with occupancy
preferences (single room vs. double room) submitted by students in the electronic survey, B&D’s housing
demand model projected demand onto the University’s fall 2015 total student enrollment.
Survey respondents were provided with a narrative description of potential student housing options at the
University that included sample floor plans along with estimated rental rates for each. Following the
narrative, respondents were asked to indicate which unit type and occupancy option they would select if
available during the present academic year (2015-2016).
To project realistic demand, B&D developed specific target markets consisting of survey respondents who
would likely be interested in student housing on campus. A combination of survey data and B&D’s expert
judgment were used to develop the target market criteria. One project narrative was shown to all students
regardless of the length of their attendance at NMSU.
SUMMARY OF FINDINGS
PROJECT DESCRIPTION FOR ALL STUDENTS
The proposed unit types and estimated rental rates included in the survey for all students are listed below
in the description.
“The next questions refer to your living unit preferences. Several typical student housing designs are
shown, along with room rents that would likely be charged to live there. Traditional residence halls feature
shared bedrooms and bathrooms, and are generally the least expensive accommodation. Suites offer
more space and privacy, but cost more than traditional residences. Apartments offer kitchens and more
living space than suites, and are generally the most expensive option. The examples that follow are for
illustrative purposes only and are NOT drawn to scale. All rents are given in today's dollars inclusive of
utilities, basic telephone with voice mail, and high-speed Internet access.”

NEW MEXICO STATE UNIVERSITY STUDENT HOUSING MASTER PLAN UPDATE
B R A I L S F O R D & D U N L A V E Y I N S P I R E . E M P O W E R . A D V A N C E . 7 . 2
PROPOSED UNIT TYPES AND ESTIMATED RENTAL RATES – ALL STUDENTS
Traditional single occupancy (private) room
One furnished private (single) bedroom with a centrally located bathroom outside the room. No
common area or kitchen is provided. A dining plan is required for anyone living in this unit type.
Estimated Rent: $2,480/semester/person, $620/month/person
Traditional double occupancy (shared) room
One furnished double occupancy (shared) bedroom with a centrally located bathroom outside the
room. No common area or kitchen is provided. A dining plan is required for anyone living in this
unit type.
Estimated Rent: $2,250/semester/person, $563/month/person
Semi-suite with single occupancy (private) bedrooms
Two furnished single (private) bedrooms with a shared bathroom in the unit. No common area or
kitchen is provided. A dining plan is required for anyone living in this unit type.
Estimated Rent: $3,300/semester/person, $825/month/person
Greek Housing – Semi-suite with single occupancy (private)
Two furnished single (private) bedrooms with a shared bathroom in the unit. No common area or
kitchen is provided. A dining plan is required for anyone living in this unit type.
Estimated Rent: $3,300/semester/person, $825/month/person
Semi-suite with double occupancy (shared) bedrooms
Two furnished double occupancy (shared) bedrooms with a shared bathroom in the unit. No
common area or kitchen is provided. A dining plan is required for anyone living in this unit type.
Estimated Rent: $2,800/semester/person, $700/month/person
Full-suite with single occupancy (private) bedrooms
Two furnished single (private) bedrooms with a shared bathroom and living room in the unit. No
kitchen is provided. A dining plan is required for anyone living in this unit type.
Estimated Rent: $3,650/semester/person, $913/month/person
Full suite with double occupancy (shared) bedrooms
Two furnished double occupancy (shared) bedrooms with a shared bathroom and living room in
the unit. No kitchen is provided. A dining plan is required for anyone living in this unit type.
Estimated Rent: $3,250/semester/person, $813/month/person

DEMAND ANALYSIS
D E C E M B E R 2 0 1 5 7 . 3
Efficiency (studio) apartment for one student
An efficiency (studio) apartment with a bathroom, kitchen and living area in the unit. A dining plan
is optional for anyone living in this unit type.
Estimated Rent: $3,300/semester/person, $825/month/person
One-bedroom, one-bathroom apartment with a single occupancy (private) bedroom
One furnished single occupancy (private) bedroom with a full kitchen, bathroom, and living room
in the unit. A dining plan is optional for anyone living in this unit type.
Estimated Rent: $3,800/semester/person, $950/month/person
Two-bedroom, two-bathroom apartment with a single occupancy (private) bedrooms
Two furnished single occupancy (private) bedrooms with a full kitchen, bathroom, and living room
in the unit. A dining plan is optional for anyone living in this unit type.
Estimated Rent: $3,100/semester/person, $775/month/person
Four-bedroom, two-bathroom apartment with a single occupancy (private) bedrooms
Four furnished single occupancy (private) bedrooms with a full kitchen, bathroom, and living room
in the unit. A dining plan is optional for anyone living in this unit type.
Estimated Rent: $2,810/semester/person, $703/month/person
DEFINITION OF TARGET MARKET
To project realistic demand for student housing at New Mexico State University, B&D developed specific
target markets consisting of survey respondents who would likely be interested in leasing student housing
units.
The target market was defined to include respondents who met the following criteria: 1) are full-time or
part-time students; 2) indicated they were very interested / interested in living on campus; and (3) are
currently paying rent of $500 or more per month at an off-campus location OR currently live on campus.
Respondents not meeting the aforementioned criteria were removed from the demand analysis.
Specialty housing was filtered for those students interested in Greek housing or requiring student family
housing. The same filters as above applied to specialty housing as well.
TARGET MARKET FINDINGS
Interest in campus housing was shown for all unit types tested and across all class levels. When filtering
demand by class level, current residence, and rent thresholds, B&D projected a demand of 2,878 beds of
housing at NMSU given the fall 2015 enrollment. This demand is slightly less than the current design
occupancy of housing (211 excess beds).

NEW MEXICO STATE UNIVERSITY STUDENT HOUSING MASTER PLAN UPDATE
B R A I L S F O R D & D U N L A V E Y I N S P I R E . E M P O W E R . A D V A N C E . 7 . 4
FIGURE 7.1: Demand for fall 2015
With a focus on improving academic success and retention, first-year students should not be placed in
apartments or single occupancy units. Adding this assumption into our demand projections indicates that
the number of apartments on campus can adequately address demand. Key areas of discrepancy occur
within traditional, semi-suite, and full-suite units and should be the primary focus of New Mexico State
University. Demand for specialty housing including family and Greek is much less than the current
supply. Greek housing is limited in total demand (100 beds) and presents challenges towards the
creation of a sustainable on-campus Greek community. Additionally, only 22% of Greek affiliated survey
respondents indicated a desire to live in Greek specific housing. The majority of these students preferred
to live in a variety of unit types in general student housing.
FIGURE 7.2: Demand by housing unit type
It is important to note that increases in the first-time freshman cohorts will increase the demand for
traditional, semi-suite, and full-suite units. If the housing capture rate for all freshmen increases from
43% to 60%, an additional 383 beds of demand would exist.
Enrollment Classification EnrollmentCapture
Rate
Maximum Potential Demand
Freshman 2,264 43% 965Sophomore 2,279 21% 469Junior 2,696 15% 409Senior / Other 5,287 17% 889Graduate / Other 2,964 5% 146
TOTAL 15,490 19% 2,878EXISTING BED COUNT 3,089NET DEMAND (SURPLUS/(DEFICIT)) 211
138
1,314
0
779
254
572 619
339 306
782
100
407
0
200
400
600
800
1,000
1,200
1,400
Traditional Semi-Suites Full-Suites Apartments Greek Family
Existing Demand

EXHIBIT A

This Page Left Intentionally Blank
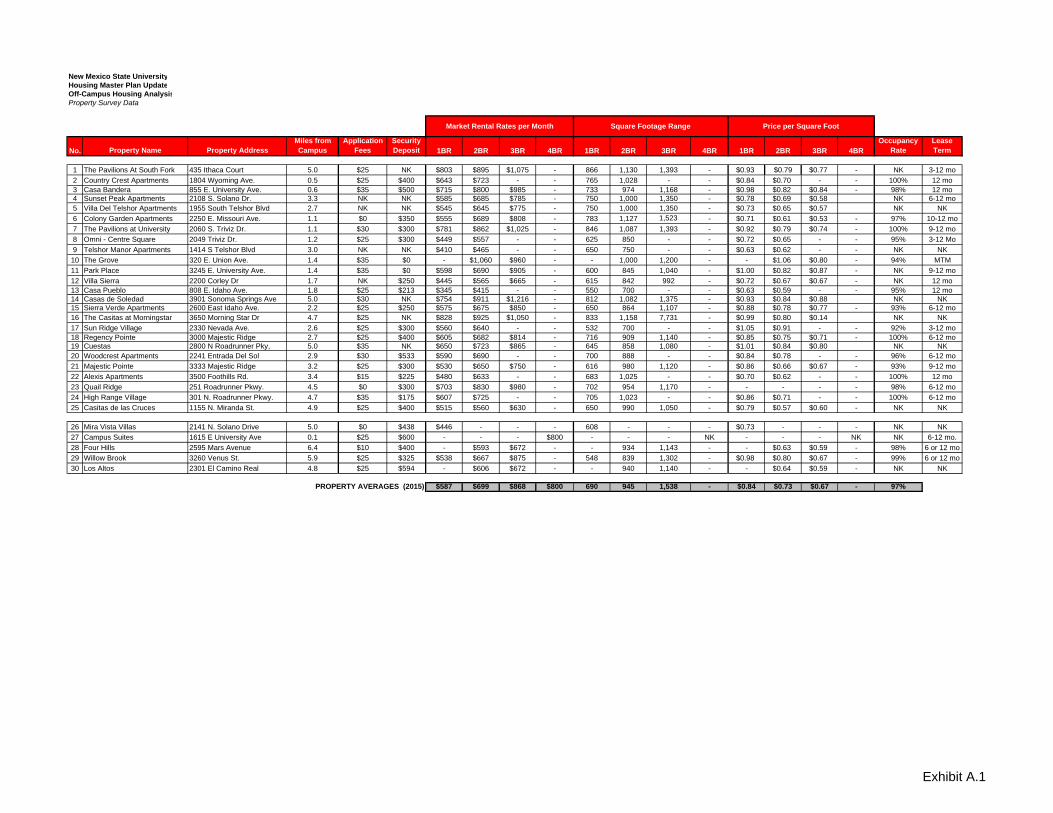
New Mexico State UniversityHousing Master Plan UpdateOff-Campus Housing AnalysisProperty Survey Data
No. Property Name Property AddressMiles from Campus
Application Fees
Security Deposit 1BR 2BR 3BR 4BR 4BR 1BR 2BR 3BR 4BR
Occupancy Rate
Lease Term
1 The Pavilions At South Fork 435 Ithaca Court 5.0 $25 NK $803 $895 $1,075 - 866 1,130 1,393 - $0.93 $0.79 $0.77 - NK 3-12 mo
2 Country Crest Apartments 1804 Wyoming Ave. 0.5 $25 $400 $643 $723 - - 765 1,028 - - $0.84 $0.70 - - 100% 12 mo3 Casa Bandera 855 E. University Ave. 0.6 $35 $500 $715 $800 $985 - 733 974 1,168 - $0.98 $0.82 $0.84 - 98% 12 mo4 Sunset Peak Apartments 2108 S. Solano Dr. 3.3 NK NK $585 $685 $785 - 750 1,000 1,350 - $0.78 $0.69 $0.58 NK 6-12 mo5 Villa Del Telshor Apartments 1955 South Telshor Blvd 2.7 NK NK $545 $645 $775 - 750 1,000 1,350 - $0.73 $0.65 $0.57 NK NK
6 Colony Garden Apartments 2250 E. Missouri Ave. 1.1 $0 $350 $555 $689 $808 - 783 1,127 1,523 - $0.71 $0.61 $0.53 - 97% 10-12 mo
7 The Pavilions at University 2060 S. Triviz Dr. 1.1 $30 $300 $781 $862 $1,025 - 846 1,087 1,393 - $0.92 $0.79 $0.74 - 100% 9-12 mo
8 Omni - Centre Square 2049 Triviz Dr. 1.2 $25 $300 $449 $557 - - 625 850 - - $0.72 $0.65 - - 95% 3-12 Mo
9 Telshor Manor Apartments 1414 S Telshor Blvd 3.0 NK NK $410 $465 - - 650 750 - - $0.63 $0.62 - - NK NK
10 The Grove 320 E. Union Ave. 1.4 $35 $0 - $1,060 $960 - - 1,000 1,200 - - $1.06 $0.80 - 94% MTM
11 Park Place 3245 E. University Ave. 1.4 $35 $0 $598 $690 $905 - 600 845 1,040 - $1.00 $0.82 $0.87 - NK 9-12 mo
12 Villa Sierra 2200 Corley Dr 1.7 NK $250 $445 $565 $665 - 615 842 992 - $0.72 $0.67 $0.67 - NK 12 mo13 Casa Pueblo 808 E. Idaho Ave. 1.8 $25 $213 $345 $415 - - 550 700 - - $0.63 $0.59 - - 95% 12 mo14 Casas de Soledad 3901 Sonoma Springs Ave 5.0 $30 NK $754 $911 $1,216 - 812 1,082 1,375 - $0.93 $0.84 $0.88 NK NK15 Sierra Verde Apartments 2600 East Idaho Ave. 2.2 $25 $250 $575 $675 $850 - 650 864 1,107 - $0.88 $0.78 $0.77 - 93% 6-12 mo16 The Casitas at Morningstar 3650 Morning Star Dr 4.7 $25 NK $828 $925 $1,050 - 833 1,158 7,731 - $0.99 $0.80 $0.14 NK NK
17 Sun Ridge Village 2330 Nevada Ave. 2.6 $25 $300 $560 $640 - - 532 700 - - $1.05 $0.91 - - 92% 3-12 mo18 Regency Pointe 3000 Majestic Ridge 2.7 $25 $400 $605 $682 $814 - 716 909 1,140 - $0.85 $0.75 $0.71 - 100% 6-12 mo19 Cuestas 2800 N Roadrunner Pky, 5.0 $35 NK $650 $723 $865 - 645 858 1,080 - $1.01 $0.84 $0.80 NK NK20 Woodcrest Apartments 2241 Entrada Del Sol 2.9 $30 $533 $590 $690 - - 700 888 - - $0.84 $0.78 - - 96% 6-12 mo
21 Majestic Pointe 3333 Majestic Ridge 3.2 $25 $300 $530 $650 $750 - 616 980 1,120 - $0.86 $0.66 $0.67 - 93% 9-12 mo
22 Alexis Apartments 3500 Foothills Rd. 3.4 $15 $225 $480 $633 - - 683 1,025 - - $0.70 $0.62 - - 100% 12 mo
23 Quail Ridge 251 Roadrunner Pkwy. 4.5 $0 $300 $703 $830 $980 - 702 954 1,170 - - - - - 98% 6-12 mo
24 High Range Village 301 N. Roadrunner Pkwy. 4.7 $35 $175 $607 $725 - - 705 1,023 - - $0.86 $0.71 - - 100% 6-12 mo
25 Casitas de las Cruces 1155 N. Miranda St. 4.9 $25 $400 $515 $560 $630 - 650 990 1,050 - $0.79 $0.57 $0.60 - NK NK
26 Mira Vista Villas 2141 N. Solano Drive 5.0 $0 $438 $446 - - - 608 - - - $0.73 - - - NK NK
27 Campus Suites 1615 E University Ave 0.1 $25 $600 - - - $800 - - - NK - - - NK NK 6-12 mo.
28 Four Hills 2595 Mars Avenue 6.4 $10 $400 - $593 $672 - - 934 1,143 - - $0.63 $0.59 - 98% 6 or 12 mo
29 Willow Brook 3260 Venus St. 5.9 $25 $325 $538 $667 $875 - 548 839 1,302 - $0.98 $0.80 $0.67 - 99% 6 or 12 mo
30 Los Altos 2301 El Camino Real 4.8 $25 $594 - $606 $672 - - 940 1,140 - - $0.64 $0.59 - NK NK
PROPERTY AVERAGES (2015) $587 $699 $868 $800 690 945 1,538 - $0.84 $0.73 $0.67 - 97%
Market Rental Rates per Month Square Footage Range Price per Square Foot
1BR 2BR 3BR
Exhibit A.1

New Mexico State UniversityHousing Master Plan UpdateOff-Campus Housing AnalysisPopulation and Household Overview
2010 Population 11,856 53,850 93,302 2010 Households 4,659 22,302 37,647
2015 Population 11,989 54,477 96,260 2015 Households 4,830 23,076 39,640 Growth Rate from 2000 0.3% 0.3% 0.8% Growth Rate from 2000 0.9% 0.9% 1.3%
2020 Population 12,046 54,969 97,429 2020 Households 5,106 24,490 42,207
Growth Rate from 2015 0.1% 0.2% 0.2% Growth Rate from 2015 1.1% 1.2% 1.3%
Population Accomodated 89% 102% 100% Average Household Size 2.1 2.3 2.3
Source: SitesUSA
3 MILES 5 MILESPopulation Overview 1 MILE 3 MILES 5 MILES Household Overview 1 MILE
Exhibit A.2

New Mexico State UniversityHousing Master Plan UpdateOff-Campus Housing AnalysisHousing Composition
Single-family 18,770 59% 24,368 61% 27,182 64%Multi-family 8,834 28% 11,128 28% 11,738 27%Other 4,048 13% 4,365 11% 3,850 9%
Total 31,652 100% 39,861 100% 42,770 100%Source: Census
Number of Units
Percent of Total Units
2000 2010 2014
Housing TypeNumber of
UnitsPercent of Total Units
Number of Units
Percent of Total Units
Exhibit A.3

This Page Left Intentionally Blank

EXHIBIT B

This Page Left Intentionally Blank

New Mexico State UniversityStudent Housing Master Plan UpdateCompetitive Context Analysis
In-State Out-of-State
New Mexico State University Public $6,092 $19,650 $7,010
Arizona State University at Tempe Public $9,484 $23,830 $10,010
Northern Arizona University Public $9,120 $21,640 $9,020
Texas Tech University Public $6,597 $18,297 $8,405
University of Arizona Public $10,390 $31,617 $9,840
University of New Mexico Public $5,007 $19,464 $8,580
University of Texas at El Paso3 Public $5,606 $17,456 $9,299
Utah State University Public $5,617 $18,087 $5,790AVERAGE (excluding NMSU) $7,403 $21,484 $8,608
18% 9% 19%NOTES: $6,597 $19,464 $9,020
1Tuition & Fees per year, based on undergraduate status, and 15 credit hours per semester.
2 Room & Board per year, based on double occupancy traditional unit and 14 meals per week.
3 UTEP does not offer traditional units or meal plans.
University statistics are approximate as presented by the universities' 2014-2015 Common Data Set,
University AffiliationTuition ₁ Room &
Board 2
Exhibit B.1

New Mexico State UniversityStudent Housing Master Plan UpdateCompetitive Context Analysis
Total Undergraduate Graduate Percent Freshman
Enrollment1 Enrollment Enrollment Out-of-State Retention2
New Mexico State University 15,829 12,784 3,045 25% 74%
Arizona State University at Tempe 50,358 39,968 10,390 24% 86%
Northern Arizona University 27,715 23,845 3,870 28% 74%
Texas Tech University 35,158 28,632 6,526 6% 83%University of Arizona 42,236 32,987 9,249 28% 82%University of New Mexico 27,887 20,857 7,030 10% 79%University of Texas at El Paso 23,079 19,817 3,262 3% 68%Utah State University 27,662 24,271 3,391 25% 71%
AVERAGE (excluding NMSU) 33,442 27,197 6,245 18% 78%1Based on freshman Fall 2013 cohort
Enrollment data based on 2014/2015 academic year
University
Exhibit B.2

New Mexico State UniversityStudent Housing Master Plan UpdateCompetitive Context Analysis
University Single Double Triple2BR / 1BA
2BR / 1BA
(double)Studio
1BR / 1BA
2BR / 1BA
4BR / 2BA
2BR / 1BA
4BR / 2BA
New Mexico State University $2,460 $1,737 $1,297 $2,802 $1,923 $2,303 $3,318 $2,522 $2,344 $630 $856
University of New Mexico $2,795 $2,445 $2,895 $2,545University of Texas at El Paso $2,666 $2,520 $2,441Texas Tech University $2,819 $2,255 $1,755 $3,875 $3,500University of Arizona $5,145 $3,430 $2,875 $2,506Arizona State University at Tempe $3,375 $2,815 $4,110 $3,216 $3,645 $3,845 $3,420Northern Arizona University $2,468 $1,968 $821Utah State University $1,560 $1,045 $1,490 $477
Average (excluding NMSU) $3,139 $2,410 $2,393 $3,503 $2,439 $3,156 $3,860 $2,970 $2,971 $649 NA
Percent Difference -28% -39% -85% -25% -27% -37% -16% -18% -27% -3% NA
NOTES
General Note = Rates cited are per person per semester for the 2014-15 year.
1 Monthly rates
NA - Not Applicable
FAMILY /
GRADUATE 1TRADITIONAL UNITS SEMI-SUITES SINGLE APARTMENTS
Exhibit B.3

New Mexico State UniversityStudent Housing Master Plan UpdateCompetitive Context Analysis
New Mexico State University - -
Arizona State University at Tempe 3,089 8,521Northern Arizona University 1,126 1,126Texas Tech University 2,087 4,680University of Arizona 764 1,127University of New Mexico 1,892 1,892University of Texas at El Paso - -Utah State University 480 480
AVERAGE (excluding NMSU) 1,573 2,971
University P3 Beds - Post 2008 Total P3 Beds
Exhibit B.4

EXHIBIT C

This Page Left Intentionally Blank

TABLE OF CONTENTS
D E C E M B E R 2 0 1 5 C . 1
Q1. What is your class standing? Count Percent
492 22.60% Freshman 315 14.47% Sophomore 404 18.56% Junior 539 24.76% Senior 388 17.82% Graduate/Professional 39 1.79% Other
2177 Respondents
Q2. What is your current enrollment status? Count Percent
1989 91.49% Full time 185 8.51% Part time
2174 Respondents
Q3. How did you enter NMSU? Count Percent
1319 74.10% First-time student 461 25.90% Transfer student
1780 Respondents
Q4. What is your age? Count Percent
956 44.18% Under 21 700 32.35% 21 - 25 508 23.48% 25 and over
2164 Respondents
Q5. What is your gender? Count Percent
779 36.06% Male 1372 63.52% Female
9 0.42% Other 2160 Respondents
Q6. What is your marital status? Count Percent
1722 79.61% Single 76 3.51% Single with kids
192 8.88% Partnered 173 8.00% Partnered with kids
2163 Respondents

NEW MEXICO STATE UNIVERSITY STUDENT HOUSING MASTER PLAN UPDATE
B R A I L S F O R D & D U N L A V E Y I N S P I R E . E M P O W E R . A D V A N C E . C . 2
Q7. What is your ethnic or racial background? Count Percent
253 11.69% Two or more races 73 3.37% American Indian or Alaskan Native 95 4.39% Asian (including Native Hawaiian/Pacific Islander) 58 2.68% Black or African American
812 37.52% Hispanic 9 0.42% Race and ethnicity unknown
776 35.86% White 88 4.07% International
2164 Respondents
Q8. What is your current residency status? Count Percent
1932 90.28% Domestic student (U.S. citizen or permanent resident) 208 9.72% International student
2140 Respondents
Q9. In what college/school are you currently enrolled or affiliated? Count Percent
264 12.30% Agriculture, Consumer, and Environmental Sciences 369 17.19% Engineering 667 31.07% Arts & Sciences 198 9.22% Health & Social Services 256 11.92% Education 243 11.32% Business 126 5.87% Graduate School 24 1.12% Other (please specify)
2147 Respondents
Q10. How far is your home/permanent residence from campus? (If an international student, please enter the name of your home country.) Count Percent
986 45.99% 45 miles or less 962 44.87% 46 miles or more 196 9.14% International student (please enter the name of your home country)
2144 Respondents
Q11. What are the primary sources of funding for your academic expenses (tuition, fees, books, etc.)? SELECT ALL THAT APPLY
Count Respondent
% Response
%
1004 46.83% 20.50% Family support 903 42.12% 18.44% Personal support 825 38.48% 16.85% Student loan(s)
1149 53.59% 23.46% Academic scholarship(s) 36 1.68% 0.74% Athletic scholarship(s)
684 31.90% 13.97% Grant(s) 155 7.23% 3.17% Employer reimbursement or tuition program 141 6.58% 2.88% Other (please specify)
2144 Respondents 4897 Responses

TABLE OF CONTENTS
D E C E M B E R 2 0 1 5 C . 3
Q12. What was your High School grade point average (GPA) upon entering NMSU? Count Percent
1009 57.53% 3.5 - 4.0 505 28.79% 3.0 - 3.49 186 10.60% 2.5 - 2.99 43 2.45% 2.0 - 2.49 11 0.63% Less than 2.0
1754 Respondents
Q13. Are you currently in a social fraternity or sorority? Count Percent
192 10.88% Yes 1572 89.12% No 1764 Respondents
Q14. In which Greek Chapter are you a member? Count Percent
1 0.52% Alpha Gamma Rho 5 2.62% Phi Delta Theta
12 6.28% Sigma Chi 13 6.81% Lambda Chi Alpha 8 4.19% Pi Kappa Alpha
10 5.24% Delta Sigma Phi 1 0.52% Alpha Tau Omega 2 1.05% Tau Kappa Epsilon 1 0.52% Sigma Alpha Epsilon 2 1.05% Pi Kappa Phi
15 7.85% Kappa Sigma 16 8.38% Chi Omega 8 4.19% Zeta Tau Alpha
15 7.85% Delta Zeta 12 6.28% Alpha Xi Delta 31 16.23% Delta Gamma 14 7.33% Pi Beta Phi 25 13.09% Other (please specify)
191 Respondents
Q15. How interested are you in joining a social fraternity or sorority? Count Percent
32 2.04% Very interested 198 12.63% Interested 635 40.50% Uninterested 703 44.83% Very uninterested
1568 Respondents
Q16. How important was the availability of on-campus housing in your decision to attend NMSU? Count Percent
668 31.95% Very important 636 30.42% Important 550 26.30% Unimportant 237 11.33% Very unimportant
2091 Respondents

NEW MEXICO STATE UNIVERSITY STUDENT HOUSING MASTER PLAN UPDATE
B R A I L S F O R D & D U N L A V E Y I N S P I R E . E M P O W E R . A D V A N C E . C . 4
Q17. What were your impressions of housing when you visited campus? Count Percent
166 7.99% Very satisfactory 1381 66.49% Satisfactory
410 19.74% Unsatisfactory 120 5.78% Very unsatisfactory
2077 Respondents
Q18. When you first decided to attend NMSU, how did you learn about your housing options? SELECT ALL THAT APPLY
Count Respondent
% Response
%
369 17.64% 8.22% I did not learn about housing options. 619 29.59% 13.78% Admissions materials or presentations 712 34.03% 15.85% New student orientation 696 33.27% 15.50% Friends/acquaintances 604 28.87% 13.45% Campus tour
1017 48.61% 22.65% NMSU website 24 1.15% 0.53% Other website(s) 59 2.82% 1.31% College guidebooks or other non-NMSU reference materials
113 5.40% 2.52% High school counselors 205 9.80% 4.56% NMSU faculty/staff 73 3.49% 1.63% Other (please specify)
2092 Respondents 4491 Responses
Q19. What other schools were you considering before you chose NMSU? Count Percent
1779 100.00% 1779 Respondents
Q20. Which years have you lived in NMSU's student housing? SELECT ALL THAT APPLY, INCLUDING PARTIAL YEARS.
Count Respondent
% Response
%
779 37.31% 26.70% None 957 45.83% 32.80% Freshman year 512 24.52% 17.55% Sophomore year 367 17.58% 12.58% Junior year 186 8.91% 6.37% Senior year (including fifth year and beyond) 117 5.60% 4.01% Graduate/professional year(s)
2088 Respondents 2918 Responses
Q21. Where are you currently living while attending NMSU? Count Percent
927 44.33% On campus 1164 55.67% Off campus 2091 Respondents

TABLE OF CONTENTS
D E C E M B E R 2 0 1 5 C . 5
Q22. If you have lived in NMSU student housing at anytime, please indicate your level of agreement with each of the following statements: - Living on campus helped acclimate me to life at NMSU. Count Percent
542 43.33% Strongly agree 551 44.04% Agree 121 9.67% Disagree 37 2.96% Strongly disagree
1251 Respondents
Q23. If you have lived in NMSU student housing at anytime, please indicate your level of agreement with each of the following statements: - Living on campus provided me with a sense of community. Count Percent
362 29.01% Strongly agree 567 45.43% Agree 237 18.99% Disagree 82 6.57% Strongly disagree
1248 Respondents
Q24. If you have lived in NMSU student housing at anytime, please indicate your level of agreement with each of the following statements: - Living on campus had a positive influence on my academic performance. Count Percent
372 29.59% Strongly agree 631 50.20% Agree 191 15.19% Disagree 63 5.01% Strongly disagree
1257 Respondents
Q25. If you have lived in NMSU student housing at anytime, please indicate your level of agreement with each of the following statements: - Living on campus provided me with a safe, secure environment. Count Percent
382 30.61% Strongly agree 666 53.37% Agree 151 12.10% Disagree 49 3.93% Strongly disagree
1248 Respondents
Q26. If you have lived in NMSU student housing at anytime, please indicate your level of agreement with each of the following statements: - Living on campus provided me with leadership opportunities. Count Percent
180 14.48% Strongly agree 435 35.00% Agree 494 39.74% Disagree 134 10.78% Strongly disagree
1243 Respondents
Q27. If you have lived in NMSU student housing at anytime, please indicate your level of agreement with each of the following statements: - Living on campus introduced me to new friends. Count Percent
515 41.43% Strongly agree 524 42.16% Agree 143 11.50% Disagree 61 4.91% Strongly disagree
1243 Respondents

NEW MEXICO STATE UNIVERSITY STUDENT HOUSING MASTER PLAN UPDATE
B R A I L S F O R D & D U N L A V E Y I N S P I R E . E M P O W E R . A D V A N C E . C . 6
Q28. If you have lived in NMSU student housing at anytime, please indicate your level of agreement with each of the following statements: - Living on campus provided me with a convenient living option. Count Percent
642 51.48% Strongly agree 517 41.46% Agree 66 5.29% Disagree 22 1.76% Strongly disagree
1247 Respondents
Q29. If you have lived in NMSU student housing at anytime, please indicate your level of agreement with each of the following statements: - Living on campus provided me with a cost effective living option. Count Percent
258 20.72% Strongly agree 459 36.87% Agree 327 26.27% Disagree 201 16.14% Strongly disagree
1245 Respondents
Q30. If you have lived in NMSU student housing at anytime, please indicate your level of agreement with each of the following statements: - Living on campus helped me learn about people different from me. Count Percent
333 26.70% Strongly agree 582 46.67% Agree 255 20.45% Disagree 77 6.17% Strongly disagree
1247 Respondents
Q31. If you have lived in NMSU student housing at anytime, please indicate your level of agreement with each of the following statements: - Living on campus enhanced my overall experience at NMSU. Count Percent
451 36.08% Strongly agree 579 46.32% Agree 162 12.96% Disagree 58 4.64% Strongly disagree
1250 Respondents
Q32. Compared to other college or university student housing with which you are familiar, how would you rate NMSU's student housing? Count Percent
155 7.58% Very satisfactory 805 39.35% Satisfactory 343 16.76% Unsatisfactory 114 5.57% Very unsatisfactory 629 30.74% Not familiar with any other college or university student housing
2046 Respondents

TABLE OF CONTENTS
D E C E M B E R 2 0 1 5 C . 7
Q33. If currently living on campus in NMSU student housing, in what building do you reside? Count Percent
87 10.27% Pinon Hall 228 26.92% Garcia Hall 92 10.86% Rhodes Garrett Hamiel Hall
186 21.96% Chamisa Village 66 7.79% Vista del Monte Apartments 37 4.37% Cervantes Apartments 97 11.45% Tom Fort & Sutherland 23 2.72% Cole Village 31 3.66% Cervantes Village
847 Respondents
Q34. If currently living off campus in non-NMSU student housing, where do you reside? Count Percent
972 100.00% 972 Respondents
Q35. How would you describe your current living conditions? Count Percent
165 18.84% Very satisfactory 551 62.90% Satisfactory 128 14.61% Unsatisfactory 32 3.65% Very unsatisfactory
876 Respondents
Q36. Please rate how important each of the following factors was in your decision on where to live this year: SELECT ONE RESPONSE FOR EACH FACTOR - Total cost of rent and utilities Count Percent
1388 71.33% Very important 418 21.48% Important 97 4.98% Unimportant 43 2.21% Very unimportant
1946 Respondents
Q37. Please rate how important each of the following factors was in your decision on where to live this year: SELECT ONE RESPONSE FOR EACH FACTOR - Availability of my preferred housing unit type (double room, private room, apartment, suite, etc.) Count Percent
1001 51.81% Very important 683 35.35% Important 175 9.06% Unimportant 73 3.78% Very unimportant
1932 Respondents
Q38. Please rate how important each of the following factors was in your decision on where to live this year: SELECT ONE RESPONSE FOR EACH FACTOR - Ability to choose my own roommate(s) Count Percent
985 51.17% Very important 487 25.30% Important 297 15.43% Unimportant 156 8.10% Very unimportant
1925 Respondents

NEW MEXICO STATE UNIVERSITY STUDENT HOUSING MASTER PLAN UPDATE
B R A I L S F O R D & D U N L A V E Y I N S P I R E . E M P O W E R . A D V A N C E . C . 8
Q39. Please rate how important each of the following factors was in your decision on where to live this year: SELECT ONE RESPONSE FOR EACH FACTOR - Ability to live in Greek housing Count Percent
123 6.39% Very important 109 5.66% Important 502 26.08% Unimportant
1191 61.87% Very unimportant 1925 Respondents
Q40. Please rate how important each of the following factors was in your decision on where to live this year: SELECT ONE RESPONSE FOR EACH FACTOR - Availability of accommodations for persons with disabilities Count Percent
243 12.63% Very important 328 17.05% Important 594 30.87% Unimportant 759 39.45% Very unimportant
1924 Respondents
Q41. Please rate how important each of the following factors was in your decision on where to live this year: SELECT ONE RESPONSE FOR EACH FACTOR - Parent's or family's wishes Count Percent
352 18.21% Very important 587 30.37% Important 476 24.62% Unimportant 518 26.80% Very unimportant
1933 Respondents
Q42. Please rate how important each of the following factors was in your decision on where to live this year: SELECT ONE RESPONSE FOR EACH FACTOR - Proximity to classes Count Percent
827 42.56% Very important 734 37.78% Important 229 11.79% Unimportant 153 7.87% Very unimportant
1943 Respondents
Q43. Please rate how important each of the following factors was in your decision on where to live this year: SELECT ONE RESPONSE FOR EACH FACTOR - Proximity to other students Count Percent
336 17.28% Very important 639 32.85% Important 593 30.49% Unimportant 377 19.38% Very unimportant
1945 Respondents
Q44. Please rate how important each of the following factors was in your decision on where to live this year: SELECT ONE RESPONSE FOR EACH FACTOR - Proximity to, or availability of, convenient parking or public transportation Count Percent
724 37.24% Very important 658 33.85% Important 370 19.03% Unimportant 192 9.88% Very unimportant
1944 Respondents

TABLE OF CONTENTS
D E C E M B E R 2 0 1 5 C . 9
Q45. Please rate how important each of the following factors was in your decision on where to live this year: SELECT ONE RESPONSE FOR EACH FACTOR - Proximity to my work Count Percent
543 28.11% Very important 605 31.31% Important 473 24.48% Unimportant 311 16.10% Very unimportant
1932 Respondents
Q46. Please rate how important each of the following factors was in your decision on where to live this year: SELECT ONE RESPONSE FOR EACH FACTOR - Proximity to, or availability of, child care Count Percent
170 8.91% Very important 187 9.80% Important 521 27.31% Unimportant
1030 53.98% Very unimportant 1908 Respondents
Q47. Please rate how important each of the following factors was in your decision on where to live this year: SELECT ONE RESPONSE FOR EACH FACTOR - Proximity to shopping, entertainment, or restaurants Count Percent
284 14.79% Very important 656 34.17% Important 556 28.96% Unimportant 424 22.08% Very unimportant
1920 Respondents
Q48. Please rate how important each of the following factors was in your decision on where to live this year: SELECT ONE RESPONSE FOR EACH FACTOR - Availability of high-speed Internet Count Percent
1235 64.29% Very important 498 25.92% Important 107 5.57% Unimportant 81 4.22% Very unimportant
1921 Respondents
Q49. Please rate how important each of the following factors was in your decision on where to live this year: SELECT ONE RESPONSE FOR EACH FACTOR - Reliability of maintenance and custodial services Count Percent
832 43.33% Very important 679 35.36% Important 241 12.55% Unimportant 168 8.75% Very unimportant
1920 Respondents
Q50. Please rate how important each of the following factors was in your decision on where to live this year: SELECT ONE RESPONSE FOR EACH FACTOR - Opportunity to live in a building that has the physical features I desire (furnished, modern, well maintained, attractive, etc.) Count Percent
758 39.11% Very important 756 39.01% Important 290 14.96% Unimportant 134 6.91% Very unimportant
1938 Respondents

NEW MEXICO STATE UNIVERSITY STUDENT HOUSING MASTER PLAN UPDATE
B R A I L S F O R D & D U N L A V E Y I N S P I R E . E M P O W E R . A D V A N C E . C . 10
Q51. Please rate how important each of the following factors was in your decision on where to live this year: SELECT ONE RESPONSE FOR EACH FACTOR - Flexible lease/rental terms Count Percent
807 41.79% Very important 716 37.08% Important 272 14.09% Unimportant 136 7.04% Very unimportant
1931 Respondents
Q52. Please rate how important each of the following factors was in your decision on where to live this year: SELECT ONE RESPONSE FOR EACH FACTOR - Availability of a good building manager or landlord Count Percent
790 42.54% Very important 719 38.72% Important 229 12.33% Unimportant 119 6.41% Very unimportant
1857 Respondents
Q53. Please rate how important each of the following factors was in your decision on where to live this year: SELECT ONE RESPONSE FOR EACH FACTOR - Availability of educational opportunities Count Percent
675 36.19% Very important 666 35.71% Important 339 18.18% Unimportant 185 9.92% Very unimportant
1865 Respondents
Q54. Please rate how important each of the following factors was in your decision on where to live this year: SELECT ONE RESPONSE FOR EACH FACTOR - Availability of leadership opportunities Count Percent
354 19.12% Very important 535 28.90% Important 639 34.52% Unimportant 323 17.45% Very unimportant
1851 Respondents
Q55. Please rate how important each of the following factors was in your decision on where to live this year: SELECT ONE RESPONSE FOR EACH FACTOR - Less restrictive rules and supervision Count Percent
584 31.43% Very important 701 37.73% Important 422 22.71% Unimportant 151 8.13% Very unimportant
1858 Respondents
Q56. Please rate how important each of the following factors was in your decision on where to live this year: SELECT ONE RESPONSE FOR EACH FACTOR - Ability to stay during breaks Count Percent
930 49.81% Very important 557 29.83% Important 259 13.87% Unimportant 121 6.48% Very unimportant
1867 Respondents

TABLE OF CONTENTS
D E C E M B E R 2 0 1 5 C . 11
Q57. Please rate how important each of the following factors was in your decision on where to live this year: SELECT ONE RESPONSE FOR EACH FACTOR - Availability of a quiet place to study Count Percent
1123 60.34% Very important 569 30.57% Important 116 6.23% Unimportant 53 2.85% Very unimportant
1861 Respondents
Q58. Please rate how important each of the following factors was in your decision on where to live this year: SELECT ONE RESPONSE FOR EACH FACTOR - Access to NMSU resources (computer labs, student services, administrative offices, etc.) Count Percent
805 43.37% Very important 614 33.08% Important 294 15.84% Unimportant 143 7.70% Very unimportant
1856 Respondents
Q59. Please rate how important each of the following factors was in your decision on where to live this year: SELECT ONE RESPONSE FOR EACH FACTOR - Opportunity to be involved in campus activities Count Percent
486 26.23% Very important 675 36.43% Important 443 23.91% Unimportant 249 13.44% Very unimportant
1853 Respondents
Q60. Please rate how important each of the following factors was in your decision on where to live this year: SELECT ONE RESPONSE FOR EACH FACTOR - Opportunity to be involved in NMSU residential communities (living/learning programs, theme communities, etc.) Count Percent
336 18.11% Very important 491 26.47% Important 625 33.69% Unimportant 403 21.73% Very unimportant
1855 Respondents
Q61. Please rate how important each of the following factors was in your decision on where to live this year: SELECT ONE RESPONSE FOR EACH FACTOR - Safety and security features Count Percent
1026 55.22% Very important 676 36.38% Important 96 5.17% Unimportant 60 3.23% Very unimportant
1858 Respondents

NEW MEXICO STATE UNIVERSITY STUDENT HOUSING MASTER PLAN UPDATE
B R A I L S F O R D & D U N L A V E Y I N S P I R E . E M P O W E R . A D V A N C E . C . 12
Q62. Please rate how important each of the following factors was in your decision on where to live this year: SELECT ONE RESPONSE FOR EACH FACTOR - Availability of a private (single) bedroom Count Percent
934 49.97% Very important 516 27.61% Important 311 16.64% Unimportant 108 5.78% Very unimportant
1869 Respondents
Q63. Please rate how important each of the following factors was in your decision on where to live this year: SELECT ONE RESPONSE FOR EACH FACTOR - Availability of a private bathroom Count Percent
851 45.98% Very important 601 32.47% Important 312 16.86% Unimportant 87 4.70% Very unimportant
1851 Respondents
Q64. Please rate how important each of the following factors was in your decision on where to live this year: SELECT ONE RESPONSE FOR EACH FACTOR - Availability of additional living space outside my bedroom but within my unit Count Percent
856 46.25% Very important 662 35.76% Important 254 13.72% Unimportant 79 4.27% Very unimportant
1851 Respondents
Q65. Please rate how important each of the following factors was in your decision on where to live this year: SELECT ONE RESPONSE FOR EACH FACTOR - Availability of a kitchen Count Percent
1143 61.68% Very important 507 27.36% Important 150 8.09% Unimportant 53 2.86% Very unimportant
1853 Respondents
Q66. Please rate how important each of the following factors was in your decision on where to live this year: SELECT ONE RESPONSE FOR EACH FACTOR - Availability of convenient laundry facilities Count Percent
1132 60.89% Very important 572 30.77% Important 104 5.59% Unimportant 51 2.74% Very unimportant
1859 Respondents
Q67. Please rate how important each of the following factors was in your decision on where to live this year: SELECT ONE RESPONSE FOR EACH FACTOR - Access to campus dining Count Percent
491 26.44% Very important 445 23.96% Important 484 26.06% Unimportant 437 23.53% Very unimportant
1857 Respondents

TABLE OF CONTENTS
D E C E M B E R 2 0 1 5 C . 13
Q68. Who made the decision regarding where you lived this year? Count Percent
1027 54.43% I did solely 44 2.33% My parent(s)/guardian(s) solely
500 26.50% My parent(s)/guardian(s) and I jointly 254 13.46% My spouse/partner and I jointly 62 3.29% Other (please specify)
1887 Respondents
Q69. Where do you plan to live next year? Count Percent
414 21.82% On campus 821 43.28% Off campus 433 22.83% Undecided on where to live 229 12.07% Not applicable; I will not be attending NMSU next year.
1897 Respondents
Q70. If your housing preferences were met each year, when would you live/have lived in NMSU's student housing? SELECT ALL THAT APPLY
Count Respondent
% Response
%
337 17.87% 8.27% Never 1080 57.26% 26.50% Freshman year
906 48.04% 22.23% Sophomore year 732 38.81% 17.96% Junior year 637 33.78% 15.63% Senior year(s) 383 20.31% 9.40% Graduate/professional year(s)
1886 Respondents 4075 Responses

NEW MEXICO STATE UNIVERSITY STUDENT HOUSING MASTER PLAN UPDATE
B R A I L S F O R D & D U N L A V E Y I N S P I R E . E M P O W E R . A D V A N C E . C . 14
Q71. If considering living OFF CAMPUS next year, why would you prefer to do so? SELECT ALL THAT APPLY
Count Respondent
% Response
%
81 10.24% 1.43% I may not be attending NMSU next year. 36 4.55% 0.64% I am ineligible to live in NMSU's student housing.
203 25.66% 3.59% To live in a quieter environment 63 7.96% 1.11% To satisfy my parent's/family's wishes
213 26.93% 3.77% Fewer rules and regulations 117 14.79% 2.07% More convenient location 105 13.27% 1.86% More convenient parking or public transportation 494 62.45% 8.74% More cost effective 138 17.45% 2.44% My preferred on-campus living accommodation may not be available 269 34.01% 4.76% Better Internet access 307 38.81% 5.43% Better living unit amenities 159 20.10% 2.81% Better security/safety 230 29.08% 4.07% Ability to live with or near friends 143 18.08% 2.53% Ability to live with or near family or partner 394 49.81% 6.97% More privacy 439 55.50% 7.77% More living space 233 29.46% 4.12% No meal plan requirement 371 46.90% 6.57% Access to my own kitchen 332 41.97% 5.88% More convenient laundry facilities 298 37.67% 5.27% Better physical condition of the building 158 19.97% 2.80% Better building management and staffing 191 24.15% 3.38% Better maintenance and housekeeping services 25 3.16% 0.44% Better accessibility for persons with disabilities
175 22.12% 3.10% To establish residency or credit history in my own name 99 12.52% 1.75% To live away from other students
338 42.73% 5.98% To have a pet 40 5.06% 0.71% Other (please specify)
791 Respondents 5651 Responses
Q72. Where do you currently live off campus? Count Percent
295 38.82% Apartment/condo rented 4 0.53% Apartment/condo owned by me or my spouse/partner 7 0.92% Apartment/condo owned by a family member other than a spouse/partner 6 0.79% Sorority/fraternity house
154 20.26% House rented 87 11.45% House owned by me or my spouse/partner
163 21.45% House owned by a family member other than a spouse/partner 12 1.58% Individual room rented in a house 32 4.21% Other (please specify)
760 Respondents

TABLE OF CONTENTS
D E C E M B E R 2 0 1 5 C . 15
Q73. With whom do you currently live? Count Percent
108 13.83% I live alone 256 32.78% With other NMSU roommate(s) 21 2.69% With other non-NMSU roommate(s) 39 4.99% With both NMSU and non-NMSU roommate(s)
145 18.57% With my parent(s) or other relative(s) 198 25.35% With my spouse/partner and/or children 14 1.79% Other (please specify)
781 Respondents
Q74. With how many other people do you share your cost of rent? Count Percent
201 25.94% I do not pay rent 167 21.55% No other people; I pay the rent myself 227 29.29% 1 other person 108 13.94% 2 other people 51 6.58% 3 other people 12 1.55% 4 other people 9 1.16% 5 or more other people
775 Respondents
Q75. What is your personal share of monthly rent/housing costs excluding utilities? Count Percent
13 2.56% Less than $100 38 7.48% $100 - $199
109 21.46% $200 - $299 129 25.39% $300 - $399 85 16.73% $400 - $499 38 7.48% $500 - $599 30 5.91% $600 - $699 14 2.76% $700 - $799 13 2.56% $800 - $899 12 2.36% $900 - $999 11 2.17% $1,000 or more 16 3.15% I don't know
508 Respondents
Q76. In addition to your rent, for which of the following utilities do you currently pay? SELECT ALL THAT APPLY
Count Respondent
% Response
%
185 23.90% 6.97% Not applicable; I do not pay for any utilities 248 32.04% 9.34% Cable/satellite television 302 39.02% 11.37% Heat 492 63.57% 18.53% Internet 517 66.80% 19.47% Electric 297 38.37% 11.19% Water 189 24.42% 7.12% Sewer 199 25.71% 7.50% Telephone 226 29.20% 8.51% Trash 774 Respondents
2655 Responses

NEW MEXICO STATE UNIVERSITY STUDENT HOUSING MASTER PLAN UPDATE
B R A I L S F O R D & D U N L A V E Y I N S P I R E . E M P O W E R . A D V A N C E . C . 16
Q77. How much is your individual monthly cost for all the utilities selected in the previous question? Count Percent
17 2.99% Less than $25 75 13.18% $25 - $49
151 26.54% $50 - $99 137 24.08% $100 - $149 73 12.83% $150 - $199
100 17.57% $200 or more 16 2.81% Don't know
569 Respondents
Q78. What was your personal share of the security deposit required for your current lease? Count Percent
64 14.51% No deposit required 22 4.99% Less than $100 80 18.14% $100 - $199 91 20.63% $200 - $299 77 17.46% $300 - $399 39 8.84% $400 - $499 21 4.76% $500 - $599 15 3.40% $600 - $699 4 0.91% $700 - $799 7 1.59% $800 - $899 8 1.81% $900 - $999 2 0.45% $1,000 or more
11 2.49% Don't know 441 Respondents
Q79. How long is your current lease? Count Percent
31 6.87% Not applicable; I have no lease 16 3.55% More than 12 months
261 57.87% 12 months 37 8.20% Academic year (approximately 9 months) 35 7.76% Academic term (e.g., semester) 50 11.09% Monthly 21 4.66% Other (please specify)
451 Respondents
Q80. Please rate how important each of the following factors should be to NMSU as it considers improvements to on-campus housing: SELECT ONE RESPONSE FOR EACH FACTOR - Provide modern and attractive living environments to students Count Percent
886 49.92% Very important 761 42.87% Important 102 5.75% Unimportant 26 1.46% Very unimportant
1775 Respondents

TABLE OF CONTENTS
D E C E M B E R 2 0 1 5 C . 17
Q81. Please rate how important each of the following factors should be to NMSU as it considers improvements to on-campus housing: SELECT ONE RESPONSE FOR EACH FACTOR - Create more academically-focused residential communities Count Percent
690 38.83% Very important 802 45.13% Important 240 13.51% Unimportant 45 2.53% Very unimportant
1777 Respondents
Q82. Please rate how important each of the following factors should be to NMSU as it considers improvements to on-campus housing: SELECT ONE RESPONSE FOR EACH FACTOR - Help retain students at NMSU Count Percent
772 43.69% Very important 766 43.35% Important 191 10.81% Unimportant 38 2.15% Very unimportant
1767 Respondents
Q83. Please rate how important each of the following factors should be to NMSU as it considers improvements to on-campus housing: SELECT ONE RESPONSE FOR EACH FACTOR - Increase the student residential population on campus Count Percent
540 30.51% Very important 733 41.41% Important 425 24.01% Unimportant 72 4.07% Very unimportant
1770 Respondents
Q84. Please rate how important each of the following factors should be to NMSU as it considers improvements to on-campus housing: SELECT ONE RESPONSE FOR EACH FACTOR - Make NMSU more attractive to prospective students Count Percent
879 49.52% Very important 730 41.13% Important 129 7.27% Unimportant 37 2.08% Very unimportant
1775 Respondents
Q85. Please rate how important each of the following factors should be to NMSU as it considers improvements to on-campus housing: SELECT ONE RESPONSE FOR EACH FACTOR - Keep housing costs affordable Count Percent
1511 85.08% Very important 243 13.68% Important 13 0.73% Unimportant 9 0.51% Very unimportant
1776 Respondents

NEW MEXICO STATE UNIVERSITY STUDENT HOUSING MASTER PLAN UPDATE
B R A I L S F O R D & D U N L A V E Y I N S P I R E . E M P O W E R . A D V A N C E . C . 18
Q86. Please rate how important each of the following factors should be to NMSU as it considers improvements to on-campus housing: SELECT ONE RESPONSE FOR EACH FACTOR - Improve the physical condition of existing campus housing, such as bathroom modernization, new carpeting, new lighting, and painting Count Percent
1206 67.87% Very important 488 27.46% Important 64 3.60% Unimportant 19 1.07% Very unimportant
1777 Respondents
Q87. Please rate how important each of the following factors should be to NMSU as it considers improvements to on-campus housing: SELECT ONE RESPONSE FOR EACH FACTOR - Improve amenities in existing campus housing, such as room furnishings, lounges, recreation areas, and computing resources Count Percent
1044 58.95% Very important 599 33.82% Important 107 6.04% Unimportant 21 1.19% Very unimportant
1771 Respondents
Q88. Please rate how important each of the following factors should be to NMSU as it considers improvements to on-campus housing: SELECT ONE RESPONSE FOR EACH FACTOR - Improve student perception of NMSU's housing office Count Percent
803 45.29% Very important 698 39.37% Important 224 12.63% Unimportant 48 2.71% Very unimportant
1773 Respondents
Q89. Please rate how important each of the following factors should be to NMSU as it considers improvements to on-campus housing: SELECT ONE RESPONSE FOR EACH FACTOR - Improve maintenance services Count Percent
843 47.73% Very important 739 41.85% Important 164 9.29% Unimportant 20 1.13% Very unimportant
1766 Respondents
Q90. Please rate how important each of the following factors should be to NMSU as it considers improvements to on-campus housing: SELECT ONE RESPONSE FOR EACH FACTOR - Improve housekeeping services Count Percent
716 40.80% Very important 711 40.51% Important 285 16.24% Unimportant 43 2.45% Very unimportant
1755 Respondents

TABLE OF CONTENTS
D E C E M B E R 2 0 1 5 C . 19
Q91. Please rate how important each of the following factors should be to NMSU as it considers improvements to on-campus housing: SELECT ONE RESPONSE FOR EACH FACTOR - Improve existing residential dining programs Count Percent
747 42.49% Very important 678 38.57% Important 269 15.30% Unimportant 64 3.64% Very unimportant
1758 Respondents
Q92. Please rate how important each of the following factors should be to NMSU as it considers improvements to on-campus housing: SELECT ONE RESPONSE FOR EACH FACTOR - Change existing housing policies and procedures so they are more student friendly Count Percent
809 45.71% Very important 718 40.56% Important 206 11.64% Unimportant 37 2.09% Very unimportant
1770 Respondents
Q93. If NMSU built new housing, which five physical features would be the most important to you? SELECT UP TO FIVE
Count Respondent
% Response
%
582 32.41% 6.64% Convenient location 886 49.33% 10.11% Private (single) bedroom 700 38.98% 7.99% Private bathroom
1005 55.96% 11.47% In-unit full kitchen (sink with garbage disposal, full-sized refrigerator, microwave, stove/oven, and dishwasher)
217 12.08% 2.48% In-unit kitchenette (sink with dishwasher, small refrigerator, and microwave) 440 24.50% 5.02% Living room 310 17.26% 3.54% Storage space 411 22.88% 4.69% Fully furnished living unit 214 11.92% 2.44% Fitness or recreation area(s) in or near the housing facility 143 7.96% 1.63% Computer lab in the housing facility/complex[ 359 19.99% 4.10% Individual temperature controls in living units 383 21.33% 4.37% Full-sized beds 444 24.72% 5.07% On-site parking 48 2.67% 0.55% Convenient access to public transportation 73 4.06% 0.83% Convenient on-campus dining options
209 11.64% 2.38% Quiet study area in the building 19 1.06% 0.22% Classrooms/academic facilities in the building
650 36.19% 7.42% Washer and dryer in the living unit 257 14.31% 2.93% Convenient laundry facilities in the building 162 9.02% 1.85% Controlled/secured access to the building 83 4.62% 0.95% Social lounge/TV room in the building
955 53.17% 10.90% In-room wireless Internet access 154 8.57% 1.76% Environmentally-friendly design and operation 60 3.34% 0.68% Other (please specify)
1796 Respondents 8764 Responses

NEW MEXICO STATE UNIVERSITY STUDENT HOUSING MASTER PLAN UPDATE
B R A I L S F O R D & D U N L A V E Y I N S P I R E . E M P O W E R . A D V A N C E . C . 20
Q94. If NMSU built new housing, which five personal preferences would be the most important to you? SELECT UP TO FIVE
Count Respondent
% Response
%
386 21.60% 4.66% 24-hour on-site management 925 51.76% 11.18% Flexible occupancy terms (9, 10, or 12 months, stay over break periods, etc.) 837 46.84% 10.11% Flexible payment terms (e.g., pay rent monthly) 133 7.44% 1.61% Convenient child care 526 29.43% 6.35% Availability of maintenance and custodial services
124 6.94% 1.50% Availability of NMSU residential communities (Greek housing, living/learning programs, international house, etc.)
283 15.84% 3.42% Availability of lifestyle or theme communities (smoke free, alcohol free, community service focused, gender specific, etc.)
401 22.44% 4.84% Fewer rules and regulations 720 40.29% 8.70% Little or no meal plan requirement 719 40.24% 8.69% Ability to choose my own NMSU roommates 387 21.66% 4.68% Ability to live with non- NMSU friends or family 209 11.70% 2.53% Ability to live near NMSU students who are in my academic program 154 8.62% 1.86% Proximity to public transportation 327 18.30% 3.95% Proximity to campus activities 171 9.57% 2.07% Proximity to retail areas (shopping, entertainment, restaurants, etc.) 827 46.28% 9.99% Ability to retain the same living unit from year to year 364 20.37% 4.40% Ability to bring my own furniture 732 40.96% 8.84% Ability to have pets 52 2.91% 0.63% Other (please specify)
1787 Respondents 8277 Responses
Q95. How would you rate your access to the Internet in your housing unit? Count Percent
476 26.61% Very satisfactory 725 40.53% Satisfactory 380 21.24% Somewhat unsatisfactory 208 11.63% Very unsatisfactory
1789 Respondents
Q96. Which of the following wireless devices would you want to connect to University wireless? SELECT ALL THAT APPLY
Count Respondent
% Response
%
1735 96.39% 26.22% Computer 877 48.72% 13.26% Television 370 20.56% 5.59% Blu-ray / DVD Player 718 39.89% 10.85% Game Console
1595 88.61% 24.11% Phone 1182 65.67% 17.87% Tablet
108 6.00% 1.63% Watch 31 1.72% 0.47% Other (please specify)
1800 Respondents 6616 Responses

TABLE OF CONTENTS
D E C E M B E R 2 0 1 5 C . 21
Q97. If all of the unit types described above were available on NMSU's campus at the rents outlined, what would have been your living preference for this academic year (2015-2016)? Count Percent
206 11.91% Unit A: Single occupancy (private) bedroom in a traditional residence hall for approximately $2,480 per person per semester ($620 per person per month)
190 10.98% Unit B: Double occupancy (shared) bedroom in a traditional residence hall for approximately $2,250 per person per semester ($563 per person per month)
57 3.29% Unit C: Single occupancy (private) bedroom in a semisuite for approximately $3,300 per person per semester ($825 per person per month)
45 2.60% Unit D: Greek Housing - Single occupancy (private) bedroom in a semisuite for approximately $3,300 per person per semester ($825 per person per month)
66 3.82% Unit E: Double occupancy (shared) bedroom in a semisuite for approximately $2,800 per person per semester ($700 per person per month)
62 3.58% Unit F: Single occupancy (private) bedroom in a full suite for approximately $3,650 per person per semester ($913 per person per month)
53 3.06% Unit G: Double occupancy (shared) bedroom in a full suite for approximately $3,250 per person per semester ($813 per person per month)
333 19.25% Unit H: Single occupancy in an efficiency (studio) apartment for approximately $3,000 per person per semester ($750 per person per month)
147 8.50% Unit I: Single occupancy (private) bedroom in a one-bedroom, one-bathroom apartment for approximately $3,800 per person per semester ($950 per person per month)
256 14.80% Unit J: Single occupancy (private) bedroom in a two-bedroom, one-bathroom apartment for approximately $3,100per person per semester ($775 per person per month)
315 18.21% Unit K: Single occupancy (private) bedroom in a four-bedroom, two-bathroom apartment for approximately $2,810 per person per semester ($703 per person per month)
1730 Respondents
Q98. If your preferred unit type described above were unavailable, what would your second choice have been for this academic year? Count Percent
252 14.69% Unit A: Single occupancy (private) bedroom in a traditional residence hall for approximately $2,480 per person per semester ($620 per person per month)
158 9.21% Unit B: Double occupancy (shared) bedroom in a traditional residence hall for approximately $2,250 per person per semester ($563 per person per month)
102 5.94% Unit C: Single occupancy (private) bedroom in a semisuite for approximately $3,300per person per semester ($825 per person per month)
42 2.45% Unit D: Greek Housing - Single occupancy (private) bedroom in a semisuite for approximately $3,300 per person per semester ($825 per person per month)
95 5.54% Unit E: Double occupancy (shared) bedroom in a semisuite for approximately $2,800 per person per semester ($700 per person per month)
77 4.49% Unit F: Single occupancy (private) bedroom in a full suite for approximately $3,650 per person per semester ($913 per person per month)
67 3.90% Unit G: Double occupancy (shared) bedroom in a full suite for approximately $3,250 per person per semester ($813 per person per month)
223 13.00% Unit H: Single occupancy in an efficiency (studio) apartment for approximately $3,000 per person per semester ($750 per person per month)
184 10.72% Unit I: Single occupancy (private) bedroom in a one-bedroom, one-bathroom apartment for approximately $3,800 per person per semester ($950 per person per month)
294 17.13% Unit J: Single occupancy (private) bedroom in a two-bedroom, one-bathroom apartment for approximately $3,100per person per semester ($775 per person per month)
222 12.94% Unit K: Single occupancy (private) bedroom in a four-bedroom, two-bathroom apartment for approximately $2,810 per person per semester ($703 per person per month)
1716 Respondents

NEW MEXICO STATE UNIVERSITY STUDENT HOUSING MASTER PLAN UPDATE
B R A I L S F O R D & D U N L A V E Y I N S P I R E . E M P O W E R . A D V A N C E . C . 22
Q99. If higher-end apartments were available with expanded amenities (pool, entertainment center, BBQ grills, hardwood floors, full-sized kitchen, etc.), would you be interested in renting one at a 20-25% premium? Count Percent
928 53.77% Yes 798 46.23% No
1726 Respondents
Q100. Please feel free to provide any additional comments or suggestions regarding this survey. All comments will be shared with NMSU's administration but none will be personally attributable to any individual student. Count Percent
635 100.00% 635 Respondents

EXHIBIT D

This Page Left Intentionally Blank

New Mexico State UniversityHousing Master Plan UpdateDemand Forecast Scenario - Enrollment Growth
2015 - 2016
Enrollment ClassificationEnrolled
PopulationCurrent
Capture RateCurrent
Occupancy
Freshman 2,264 43% 984Sophomore 2,279 22% 497Junior 2,696 13% 341Senior / Other 5,287 10% 505Graduate / Other 2,964 5% 160TOTAL 15,490 16% 2,487
2015 - 2016
Enrollment Classification Enrollment Capture Rate
Maximum Potential Demand Traditional Traditional Semi-Suite
Greek Housing Semi-Suite Full-Suite Full-Suite Studio Apt
One-Bedroom Apt
Two-Bedroom Apt
Four-Bedroom Apt
Family Housing
Single Double Single Single Double Single Double Single Single Single Single Unit
Freshman 2,264 43% 965 171 264 137 44 143 95 110 0 0 0 0 0Sophomore 2,279 21% 469 33 50 6 18 18 12 12 68 26 83 109 35Junior 2,696 15% 409 10 16 4 6 2 23 17 89 68 32 65 76Senior / Other 5,287 17% 889 47 8 8 31 17 33 4 138 115 142 96 249Graduate / Other 2,964 5% 146 15 5 2 2 2 0 0 29 15 22 8 47TOTAL 15,490 19% 2,878 276 343 157 100 181 164 143 324 224 279 279 407EXISTING BED COUNT 3,089 0 138 0 254 1,314 0 0 32 9 634 136 572NET DEMAND (SURPLUS/(DEFICIT)) 211 (276) (205) (157) 154 1,133 (164) (143) (292) (215) 355 (143) 165
2016 - 2017
Enrollment Classification Enrollment Capture Rate
Maximum Potential Demand Traditional Traditional Semi-Suite
Greek Housing Semi-Suite Full-Suite Full-Suite Studio Apt
One-Bedroom Apt
Two-Bedroom Apt
Four-Bedroom Apt
Family Housing
Single Double Single Single Double Single Double Single Single Single Single Unit
Freshman 2,377 43% 1,013 180 277 144 46 150 100 115 0 0 0 0 0Sophomore 2,393 21% 493 34 53 6 19 19 12 12 71 28 87 115 37Junior 2,831 15% 429 10 17 4 6 2 25 18 94 71 34 69 80Senior / Other 5,551 17% 934 50 9 9 32 17 35 4 145 121 149 101 262Graduate / Other 3,038 5% 149 15 5 2 2 2 0 0 29 15 22 8 48TOTAL 16,190 19% 3,018 289 360 165 105 190 172 150 339 235 292 293 427EXISTING BED COUNT 3,089 0 138 0 254 1,314 0 0 32 9 634 136 572NET DEMAND (SURPLUS/(DEFICIT)) 71 (289) (222) (165) 149 1,124 (172) (150) (307) (226) 342 (157) 145
Exhibit D.1

New Mexico State UniversityHousing Master Plan UpdateDemand Forecast Scenario - Enrollment Growth
2017 - 2018
Enrollment Classification Enrollment Capture Rate
Maximum Potential Demand Traditional Traditional Semi-Suite
Greek Housing Semi-Suite Full-Suite Full-Suite Studio Apt
One-Bedroom Apt
Two-Bedroom Apt
Four-Bedroom Apt
Family Housing
Single Double Single Single Double Single Double Single Single Single Single Unit
Freshman 2,496 43% 1,064 189 291 151 49 158 105 121 0 0 0 0 0Sophomore 2,513 21% 517 36 55 7 20 20 13 13 75 29 91 121 39Junior 2,972 15% 451 11 18 4 7 2 26 18 98 75 35 72 84Senior / Other 5,829 17% 981 52 9 9 34 18 37 5 152 127 157 106 275Graduate / Other 3,114 5% 153 16 5 2 2 2 0 0 30 16 23 8 49TOTAL 16,924 19% 3,165 304 378 174 111 200 181 157 355 246 306 307 447EXISTING BED COUNT 3,089 0 138 0 254 1,314 0 0 32 9 634 136 572NET DEMAND (SURPLUS/(DEFICIT)) (76) (304) (240) (174) 143 1,114 (181) (157) (323) (237) 328 (171) 125
2018 - 2019
Enrollment Classification Enrollment Capture Rate
Maximum Potential Demand Traditional Traditional Semi-Suite
Greek Housing Semi-Suite Full-Suite Full-Suite Studio Apt
One-Bedroom Apt
Two-Bedroom Apt
Four-Bedroom Apt
Family Housing
Single Double Single Single Double Single Double Single Single Single Single Unit
Freshman 2,621 43% 1,117 198 306 159 51 166 110 127 0 0 0 0 0Sophomore 2,638 21% 543 38 58 7 21 21 14 14 78 31 96 127 41Junior 3,121 15% 473 12 18 5 7 2 27 19 103 79 37 76 88Senior / Other 6,120 17% 1,030 55 10 10 36 19 39 5 160 133 165 111 289Graduate / Other 3,192 5% 157 16 5 2 2 2 0 0 31 16 23 9 50TOTAL 17,692 19% 3,320 318 397 182 116 210 190 165 372 258 321 322 468EXISTING BED COUNT 3,089 0 138 0 254 1,314 0 0 32 9 634 136 572NET DEMAND (SURPLUS/(DEFICIT)) (231) (318) (259) (182) 138 1,104 (190) (165) (340) (249) 313 (186) 104
2019 - 2020
Enrollment Classification Enrollment Capture Rate
Maximum Potential Demand Traditional Traditional Semi-Suite
Greek Housing Semi-Suite Full-Suite Full-Suite Studio Apt
One-Bedroom Apt
Two-Bedroom Apt
Four-Bedroom Apt
Family Housing
Single Double Single Single Double Single Double Single Single Single Single Unit
Freshman 2,752 43% 1,173 208 321 167 53 174 116 134 0 0 0 0 0Sophomore 2,770 21% 570 40 61 7 22 22 14 14 82 32 101 133 43Junior 3,277 15% 497 12 19 5 7 2 28 20 109 83 39 79 93Senior / Other 6,426 17% 1,081 58 10 10 37 20 40 5 168 140 173 117 303Graduate / Other 3,272 5% 161 16 5 2 2 2 0 0 32 16 24 9 52TOTAL 18,497 19% 3,482 334 417 191 122 220 199 173 390 271 337 338 490EXISTING BED COUNT 3,089 0 138 0 254 1,314 0 0 32 9 634 136 572NET DEMAND (SURPLUS/(DEFICIT)) (393) (334) (279) (191) 132 1,094 (199) (173) (358) (262) 297 (202) 82
Exhibit D.2

New Mexico State UniversityHousing Master Plan UpdateDemand Forecast Scenario - Enrollment Growth
2020 - 2021
Enrollment Classification Enrollment Capture Rate
Maximum Potential Demand Traditional Traditional Semi-Suite
Greek Housing Semi-Suite Full-Suite Full-Suite Studio Apt
One-Bedroom Apt
Two-Bedroom Apt
Four-Bedroom Apt
Family Housing
Single Double Single Single Double Single Double Single Single Single Single Unit
Freshman 2,890 43% 1,231 219 337 175 56 182 122 140 0 0 0 0 0Sophomore 2,909 21% 599 42 64 8 23 23 15 15 86 34 106 140 45Junior 3,441 15% 522 13 20 5 8 3 30 21 114 87 41 83 97Senior / Other 6,748 17% 1,135 60 11 11 39 21 42 5 176 146 182 123 318Graduate / Other 3,353 5% 165 17 6 2 2 2 0 0 33 17 25 9 53TOTAL 19,340 19% 3,652 350 437 201 128 231 209 182 409 284 353 355 513EXISTING BED COUNT 3,089 0 138 0 254 1,314 0 0 32 9 634 136 572NET DEMAND (SURPLUS/(DEFICIT)) (563) (350) (299) (201) 126 1,083 (209) (182) (377) (275) 281 (219) 59
2021 - 2022
Enrollment Classification Enrollment Capture Rate
Maximum Potential Demand Traditional Traditional Semi-Suite
Greek Housing Semi-Suite Full-Suite Full-Suite Studio Apt
One-Bedroom Apt
Two-Bedroom Apt
Four-Bedroom Apt
Family Housing
Single Double Single Single Double Single Double Single Single Single Single Unit
Freshman 3,034 43% 1,293 229 354 184 59 192 128 147 0 0 0 0 0Sophomore 3,054 21% 629 44 67 8 24 24 16 16 91 35 111 147 47Junior 3,613 15% 548 13 21 5 8 3 31 22 120 91 43 87 102Senior / Other 7,085 17% 1,192 64 11 11 41 22 45 6 185 154 191 129 334Graduate / Other 3,437 5% 169 17 6 2 2 2 0 0 33 17 25 9 54TOTAL 20,223 19% 3,830 367 459 211 134 243 219 191 429 298 370 372 538EXISTING BED COUNT 3,089 0 138 0 254 1,314 0 0 32 9 634 136 572NET DEMAND (SURPLUS/(DEFICIT)) (741) (367) (321) (211) 120 1,071 (219) (191) (397) (289) 264 (236) 34
2022 - 2023
Enrollment Classification Enrollment Capture Rate
Maximum Potential Demand Traditional Traditional Semi-Suite
Greek Housing Semi-Suite Full-Suite Full-Suite Studio Apt
One-Bedroom Apt
Two-Bedroom Apt
Four-Bedroom Apt
Family Housing
Single Double Single Single Double Single Double Single Single Single Single Unit
Freshman 3,186 43% 1,358 241 371 193 62 201 134 155 0 0 0 0 0Sophomore 3,207 21% 660 46 70 8 25 25 17 17 95 37 117 154 50Junior 3,794 15% 575 14 22 6 8 3 33 24 126 96 45 92 107Senior / Other 7,439 17% 1,252 67 12 12 43 23 47 6 194 162 200 135 351Graduate / Other 3,523 5% 173 18 6 2 2 2 0 0 34 18 26 9 55TOTAL 21,149 19% 4,018 385 482 221 141 255 230 201 449 312 388 391 563EXISTING BED COUNT 3,089 0 138 0 254 1,314 0 0 32 9 634 136 572NET DEMAND (SURPLUS/(DEFICIT)) (929) (385) (344) (221) 113 1,059 (230) (201) (417) (303) 246 (255) 9
Exhibit D.3

New Mexico State UniversityHousing Master Plan UpdateDemand Forecast Scenario - Enrollment Growth
2023 - 2024
Enrollment Classification Enrollment Capture Rate
Maximum Potential Demand Traditional Traditional Semi-Suite
Greek Housing Semi-Suite Full-Suite Full-Suite Studio Apt
One-Bedroom Apt
Two-Bedroom Apt
Four-Bedroom Apt
Family Housing
Single Double Single Single Double Single Double Single Single Single Single Unit
Freshman 3,345 43% 1,425 253 390 203 65 211 141 163 0 0 0 0 0Sophomore 3,367 21% 693 48 74 9 26 26 17 17 100 39 122 162 52Junior 3,983 15% 604 15 24 6 9 3 34 25 132 100 47 96 112Senior / Other 7,811 17% 1,314 70 12 12 45 25 49 6 204 170 210 142 368Graduate / Other 3,611 5% 178 18 6 2 2 2 0 0 35 18 27 10 57TOTAL 22,118 19% 4,214 404 506 232 148 267 242 211 471 327 406 410 590EXISTING BED COUNT 3,089 0 138 0 254 1,314 0 0 32 9 634 136 572NET DEMAND (SURPLUS/(DEFICIT)) (1,125) (404) (368) (232) 106 1,047 (242) (211) (439) (318) 228 (274) (18)
2024 - 2025
Enrollment Classification Enrollment Capture Rate
Maximum Potential Demand Traditional Traditional Semi-Suite
Greek Housing Semi-Suite Full-Suite Full-Suite Studio Apt
One-Bedroom Apt
Two-Bedroom Apt
Four-Bedroom Apt
Family Housing
Single Double Single Single Double Single Double Single Single Single Single Unit
Freshman 3,512 43% 1,497 266 410 213 68 222 148 171 0 0 0 0 0Sophomore 3,535 21% 728 50 78 9 28 28 18 18 105 41 129 170 55Junior 4,182 15% 634 15 25 6 9 3 36 26 139 105 50 101 118Senior / Other 8,202 17% 1,380 74 13 13 48 26 52 6 214 178 221 149 387Graduate / Other 3,702 5% 182 19 6 2 2 2 0 0 36 19 27 10 58TOTAL 23,134 19% 4,420 424 531 244 155 281 254 221 493 343 426 430 618EXISTING BED COUNT 3,089 0 138 0 254 1,314 0 0 32 9 634 136 572NET DEMAND (SURPLUS/(DEFICIT)) (1,331) (424) (393) (244) 99 1,033 (254) (221) (461) (334) 208 (294) (46)
2025 - 2026
Enrollment Classification Enrollment Capture Rate
Maximum Potential Demand Traditional Traditional Semi-Suite
Greek Housing Semi-Suite Full-Suite Full-Suite Studio Apt
One-Bedroom Apt
Two-Bedroom Apt
Four-Bedroom Apt
Family Housing
Single Double Single Single Double Single Double Single Single Single Single Unit
Freshman 3,688 43% 1,572 279 430 224 72 233 155 179 0 0 0 0 0Sophomore 3,712 21% 764 53 82 10 29 29 19 19 110 43 135 178 57Junior 4,391 15% 666 16 26 7 10 3 38 27 145 111 52 106 124Senior / Other 8,612 17% 1,449 77 14 14 50 27 54 7 225 187 232 157 406Graduate / Other 3,794 5% 187 19 6 3 3 3 0 0 37 19 28 10 60TOTAL 24,198 19% 4,637 444 557 256 163 295 267 232 517 360 447 451 647EXISTING BED COUNT 3,089 0 138 0 254 1,314 0 0 32 9 634 136 572NET DEMAND (SURPLUS/(DEFICIT)) (1,548) (444) (419) (256) 91 1,019 (267) (232) (485) (351) 187 (315) (75)
Exhibit D.4

This Page Left Intentionally Blank

I N S P I R E . E M P OW E R . A DVA N C E .
i n f o @ p r o g r a m m a n a g e r s . c o m
P R O G R A M M A N AG E R S . C O M