Student Equity Plan - Las Positas...
40
District: Chabot-Las Positas Community College College : Las Positas Student Equity Plan January 2005
Transcript of Student Equity Plan - Las Positas...

District: Chabot-Las Positas Community College College : Las Positas
Student Equity Plan
January 2005

District: Chabot-Las Positas Community College College : Las Positas
District: Chabot-Las Positas Community College College: Las Positas
Executive Summary
OVERVIEW The Las Positas College (LPC) plan has been prepared using data from both the Chancellor’s Office and LPC’s college data provided by the Office of Institutional Research. The plan outlines the college’s goals for equity based on the College’s Strategic Plan, Educational Master Plan, and Title III goals and activities.
The college was fortunate to apply for and successfully implement a Title III grant in partnership with Los Medanos College (Pittsburg) in 2000. We are in the final year of this successful grant. The project titled “ Strengthening Academic Programs for enrollment, retention, graduation, and transfer of high-risk transfer-bound students,” has allowed the college to focus on activities, which have increased the ability of at-risk students to be successful in the areas that are measured in Student Equity. The college is creating an Integrated Learning Center (ILC) with open Math and English labs, and expanding curriculum to bridge the gap for students making transitions into transfer level courses. This results in the increase of students who are granted a degree or certificate. Building on these successes, there is still much work to be done. Las Positas College is a rapidly growing college in a fast growing region. The Tri-Valley area of Eastern Alameda, Northern Santa Clara and Southern Contra Costa counties are booming in terms of industry, business and housing growth. Concomitantly, the number of people seeking educational opportunities is tremendous and the college has struggled to meet the demand of students seeking courses, programs of study and transfer options. Current challenges are limited growth funding from the state and inadequate facilities in spite of the tremendous growth demand. In terms of facilities, the district passed a local bond in March 2004 and we are currently building and planning new facilities. This will eventually ease the space issues; however, revenue will be needed to increase staff curricula and services for these new spaces. Additionally, the college is in the midst of major planning agendas this year (2004 –05): student learning outcomes, facilities planning, the educational master plan update, and strategic planning for the educational organization of the college. All of these activities contribute to the intentional activities that feed student equity through thoughtful and careful consideration of our current and future students. RESEARCH DATA AND TARGETED GROUPS Data for the equity report came from the following sources: California Community College Chancellor’s Office, CLPCCD Institutional Data set, and the LPC Fall 2003 Student Survey. Generally, we find that men, African-Americans, and Latino students to be most at-risk.

District: Chabot-Las Positas Community College College : Las Positas
Executive Summary (continued)
The community surrounding LPC is largely homogenous with about 73% of residents reporting their race as White. LPC is 63% white and more diverse than our surrounding community. Even though LPC’s student population is more diverse than our surrounding population, we continually strive to attract a more diverse student population. Course success rates show that women tend to have higher success rates than men. Additionally African American, Latino, and Native American students tend to be more at-risk than white students in course completion. DSPS students do very well in Basic Skills courses yet have lower success rates in transferable courses. We find the same trends in Basic Skill Progression, degrees, and transfer. Generally speaking, men, African Americans, and Latino students tend to have less course success, obtain fewer degrees and certificates, and be less likely to become transfer directed and prepared. According to the LPC Fall 2003 Student Survey, women report greater satisfaction with Las Positas College than their male counterparts. They also report being treated with more respect, and observe greater campus respect for differences than men. Asian students are less likely to report being treated with respect by other students, and feel that there is less general respect for differences in race, gender, sexual orientation, and religion. Asian student are also less likely to feel encouragement from instructors to participate/share different viewpoints. The same survey tested some self-reported gains in student learning outcomes. It was found that women are more likely than men to report gains on almost every outcome tested. This is consistent with other data sources that show women having greater success. Interestingly, white students are less likely to report gains on 20 of the 34 outcomes. This is not consistent with LPC’s other data sources that show minorities to be at greater risk. The survey also showed that Hispanic students report greater gains in 10 out of the 34 areas than non-Hispanics. Data on Access, Course Success, Basic Skills Progression, Degrees, and Transfer, Campus Climate, and Student Learning outcomes will be monitored to determine improvement and potential intervention strategies. GOALS AND ACTIVITIES The plan for Student Equity folds in the comprehensive services and courses that have been developed through Title III and other college planning agendas as well as new activities that are planned to meet the needs of those groups identified in the LPC research. The following goals and activities reflect the college’s guiding principles that value diversity and equity of our students, faculty and staff.

District: Chabot-Las Positas Community College College : Las Positas
Executive Summary (continued)
Access
1. Goal: Through strategic and continuous planning, maintain a student body demographic composition that is reflective of the surrounding communities.
Activity 1.1 Continue to support and expand outreach activities to at-risk students.
Activity 1.2 Engage in strategic and flexible enrollment management to maximize access to entry level and introductory courses.
Activity 1.3 Cultivate alternative sources of funding to ensure sufficient facilities, programs, and services for at-risk groups.
Course Completion
2. Goal: Improve course completion rate among males, African Americans, Hispanics, Filipinos and Native Americans.
Activity 2.1 Expand opportunities and outreach to encourage at-risk students to use the Math, Writing and Tutorials Centers.
Activity 2.2 Develop mentor programs to encourage college participation of at-risk students to create a sense of community.
Activity 2.3 Assist students to enter courses for which they are prepared. ESL and Basic Skills Completion
3. Goal: Increase the number of students who complete a degree-applicable course after completing the final ESL or Basic Skills Course.
Activity 3.1 Create an outreach plan for at-risk population in order to increase awareness of instructional support resources.
Activity 3.2 Provide adequate facilities to deliver integrated Basic Skills instruction that is linked to computerized assessment and existing support centers.
Activity 3.3 Revise and create curriculum to enhance persistence and success in ESL and basic skills courses.
Activity 3.4 Provide services and curricula to assist DSPS students to make more successful transitions from Basic Skills courses to transfer courses.
Degree and Certificate Completion
4. Goal: Increase the number of students in at-risk populations who complete certificates for those that have declared this as their goal.
Activity 4.1 Create tools to assess student’s readiness for transfer and certificate completion. Further, provide additional resources to identify those who are eligible for degrees and certificates.
Activity 4.2 The college will assess its General Education, A.A, A.S. and certificate requirements for potential barriers to student success.
District: Chabot-Las Positas Community College College : Las Positas
Executive Summary (continued)
Transfer
5. Goal: The College will increase the number of at risk-students that are transfer directed and prepared..
Activity 5.1 Increase the current number of articulation agreements and increase awareness of transfer and concurrent enrollment with university agreements among students.
Activity 5.2 Increase the number of students who complete a minimum number of 12 units and who have attempted a transfer level course in Math or English.
RESOURCES The resources budget for student equity activities emanates from a variety of sources. The budget page in the plan provides more specific information; however, the college is dedicated to finding new resources for additional activities. The contact person for further information is Mr. Jeff Baker, Dean of Student Services and Student Equity Coordinator (925) 373-5820, [email protected].

District: Chabot-Las Positas Community College College : Las Positas
District: Chabot-Las Positas Community College College: Las Positas College
Sources of Funding
Activity Lead Funding Source
1.1 Continue to support existing and expand outreach activities to at-risk students..
Workability III, DSPS, EOPS, VP Student Services, Dean of Student Services, Counselors, Associated Students of Las Positas College (ASLPC), and Campus Student Clubs, Outreach Committee
DSPS, EOPS, Co-Curricular Funds, Matriculation, General Fund, VTEA
1.2 Engage in strategic and flexible enrollment management to maximize access to entry level and introductory transfer level courses.
College Enrollment Management Committee, VP Academic Services, Academic Deans, Faculty
General Fund, VTEA
1.3 Cultivate alternative sources of funding to ensure sufficient facilities, programs and services for at-risk groups (e.g., Title III Grant, Workforce Investment Act Youth Program, One-Stop Career Center).
Dean of Student Services, Administrators, Faculty, and College Foundation
WIA, VTEA, Grants
2.1 Create opportunities and outreach to encourage at-risk student populations to use the Math, Writing and Tutorial Centers.
ILC Staff, Tutorial Program Coordinator, Academic Deans, Faculty
Title III, General Fund, Matriculation
2.2 Develop Mentor Programs to encourage college participation of at-risk students to create a sense of community.
Counselors, Associated Students of LPC (ASLPC), Faculty Senate
ASLPC, General Fund, Matriculation
2.3 Assist students to enter college courses for which they are prepared.
Student Learning Outcomes (SLO) Task Force, Dean of Student Services, Counselors, Assessment Staff, Faculty
Matriculation, General Fund, VTEA
3.1 Create outreach plan for at-risk populations to increase awareness of instructional support resources.
Academic Deans, Basic Skills Coordinators, ILC faculty, Student Services personnel
Title III, Matriculation, General Fund, BFAP
3.2 Provide adequate facilities to deliver integrated basic skills supplemental instruction. Create an integrated
ILC Faculty, Academic Dean, Tutorial Coordinator, VP Business Services, Counselors
Title III, Matriculation, EOPS, DSPS, General Fund

District: Chabot-Las Positas Community College College : Las Positas
learning center that is linked to computerized assessment and existing support centers.
3.3 Create curriculum to enhance persistence and success in ESL and Basic Skills Courses.
Basic Skills, Faculty, Academic Deans, High School Faculty
General Fund, VTEA, Grant funds

District: Chabot-Las Positas Community College College : Las Positas
CAMPUS-BASED RESEARCH
1. ACCESS. Compare the percentage of each population group that is enrolled to the percentage of each group in the adult population within the community served.
Access: CCCO data was used to determine Access. This data was compared to Census data for our surrounding communities of Dublin, Livermore, and Pleasanton. Table A shows that since 1992-3 the population at LPC has become increasingly diverse. The proportion of self-reported white students has decreased from 70% in 1992-3 to 63% in 2002-3. Additionally, LPC is more diverse than our surrounding community. LPC 63% compared to 73% white. Specifically LPC enrolls more Asian/Filipino students than live in our surrounding community. We have equal proportions and African-Americans, Native-Americans, and Hispanics. Caution should be used when comparing census numbers with LPC counts due to the different definitions and categories used. This applies specifically to the Native-American and Hispanic categories. The Census uses a more inclusive definition of American Indian, therefore those numbers may be larger than expected especially when compared to LPC’s numbers. Additionally, the Census does not list the Hispanic category with other races. Since Hispanic is an ethnicity, respondents may be Hispanic while being of any race. In the CCC system Hispanic is treated as a race, not as an ethnicity. This might make Census rates of Hispanics higher than our local counting method would.

District: Chabot-Las Positas Community College College : Las Positas
Table A: Las Positas College and Local Community Access Comparison of Demographics
U.S. Census 2000 Las Positas College Students** County Local
Communities*1992-93 1997-98 2002-03
Total Race-ethnicity African-Am. Asian-Am. Filipino Hispanic Native-Am. White Mixed Race Other non-White Unknown Gender Female Male Age <18 18-19 20-24 25-29 30-34 35-39 40-49 50+ DSPS Status*** DSPS Non DSPS
1,443,741 15% 20% included in Asian 19% (any race) <1% 41% 4% <1% n/a 51% 49% 25% 3% 7% 8% 9% 9% 16% 25% 19% 81%
166,972 3% 9% included in Asian 12% (any race) <1% 73% 3% <1% n/a 50% 50% 27% 2% 5% 6% 9% 11% 18% 22% 12% 88%
9251 2% 4% 3% 8% 2% 70% n/a 1% 1% 57% 43% 2% 16% 28% 15% 12% 8% 11% 8% 2% 98%
9961 3% 6% 2% 10% 1% 73% n/a 1% 4% 56% 44% 5% 18% 21% 11% 10% 9% 13% 13% 3% 97%
12924 3% 11% 3% 12% 1% 63% n/a 2% 4% 58% 42% 7% 19% 24% 10% 8% 7% 12% 12% 3% 97%
Notes * Local community comprises of Dublin, Livermore, and Pleasanton. ** Number of unduplicated students in one academic year. *** DSPS status includes only those age 5 and older.
District: Chabot-Las Positas Community College College : Las Positas
CAMPUS-BASED RESEARCH
2. COURSE COMPLETION. Ratio of the number of credit courses that students by population group actually complete by the end of the term compared to the number of courses in which students in that group are enrolled on the census day of the term.
CCCO data was used to examine course success rates. Gender: Women tend to outperform men in course success. This is especially true in Basic Skills courses (74% success Women vs. 61% Success Men in 2002-3). Men tend to do slightly better than women in vocational courses. Ethnicity: Generally speaking African-American and Hispanic students have lower success rates in every category of course type. Filipino students have lower course success in Basic Skills courses. Native-American students are also at risk in all course types except Vocational Courses. Native-American numbers should be viewed with caution given their small numbers. DSPS: DSPS students have lower course success in Transferable courses. They do very well in Basic skills courses. This points to a potential intervention for these students. DSPS students might benefit from assistance with transition from Basic Skills courses to Transferable courses. A closer examination of course success by Basic Skills courses did not yield any clear trends. In general, African-American and Hispanic students have lower success rates than other groups.

District: Chabot-Las Positas Community College College : Las Positas Table B: Las Positas College Course Success Total (attempted) Overall Success Gender Female Male Race-ethnicity African American Asian Filipino Hispanic Native American
White DSPS DSPS Non DSPS
Success Rates All Courses
Success Rates Transferable courses
Success rates Basic Skills
Success Rates Vocational Ed Courses
1992-1993
1997-1998
2002-2003
1992-1993
1997-1998
2002-2003
1992-1993
1997-1998
2002-2003
1992-1993
1997-1998
2002-2003
39,718 77% 78% 75% 70% 75% 74% 71% 74% 77% 72% 77%
35,083 73% 75% 71% 61% 76% 72% 67% 68% 75% 69% 74%
45,673 72% 73% 70% 61% 77% 70% 65% 65% 74% 70% 72%
34,967 77% 79% 76% 70% 78% 76% 72% 74% 79% 72% 78%
30,462 73% 75% 70% 59% 76% 70% 68% 68% 74% 67% 73%
35,935 73% 74% 72% 62% 77% 71% 67% 67% 74% 70% 73%
838 66% 69% 72% 74% 55% 62% 70% 81% 67% 82% 61%
2469 67% 71% 60% 58% 71% 85% 59% 58% 68% 73% 65%
3,135 69% 74% 61% 59% 77% 65% 62% 36% 73% 77% 67%
7,896 77% 76% 77% 71% 77% 72% 73% 80% 78% 72% 77%
6,874 75% 74% 75% 70% 77% 75% 69% 75% 76% 65% 75%
1,134 77% 75% 78% 57% 86% 71% 70% 81% 78% 86% 76%
Notes: Success indicates student who received grades of A,B,C, or credit.Source: Enrollment and success data submitted to the state chancellor’s office by CLPCCD’s ITS.


District: Chabot-Las Positas Community College College : Las Positas
CAMPUS-BASED RESEARCH
3. ESL and BASIC SKILLS COMPLETION. Ratio of the number of students by population group who complete a degree-applicable course after having completed the final ESL or basic skills course to the number of those students who complete such a final course.
Data for Basic Skills English and Math progression was derived from the CLPCCD Institutional Data Base. Students who enrolled in basic skills courses in Fall 2001 were followed until Summer 2003 to determine enrollment and completion of the next course in the sequence. English: Students who enrolled in Eng 100A or 104 in Fall 2001 were followed to see how many 1) enrolled in Eng 1A and 2) succeeded in Eng 1A. Overall 73% (243) of students succeeded in Eng 100A and 104. Of those 243 students, 75% enrolled in Eng 1A and 61% succeeded. Women have a much higher success rate in Eng 100A and 104 than men (80% female success vs. 66% Male success). Men do not enroll in Eng 1A at the same rate as women (71% men enrollment rate vs. 78% women enrollment rate). Also, males do not succeed in Eng 1A at the same rate as females (54% success arte for men vs. 66% success rate for women). African American, Asian, and Latino students have lower success rates in Eng 100A and 104. African Americans’ enrollment and success rates in Eng 1A are the same or higher than all students. Asian and Filipino students have enrollment and success rates that are higher than all students. Latino students have an enrollment rate that is lower than all students (66% Latino vs. 75% all students) and a success rate in Eng 1A that is lower than all students (48% vs. 61% all students). So, for all but Latino students, passing Basic Skills English leads to success in Eng 1A. Latino students do not enroll in Eng 1A or succeed in it at the same rate as other groups (see Table C1)

District: Chabot-Las Positas Community College College : Las Positas Table C1. English Basic Skills Progression All students successfully completing ENG 100A or 104 in Fall 2001 enrolling or succeeding in ENG 1A within 2 years (by Summer 2003) Gender Race-Ethnicity Fall 2001 ENG 100A or 104
Total Students Female Male
African American Asian Filipino Latino White
Success 243 73% 137 80% 104 66% 8 57% 16 67% 11 79% 29 69% 163 76%Non-Success 16 5% 6 4% 10 6% 0 0% 1 4% 0 0% 6 14% 8 4%Withdrawal 73 22% 28 16% 44 28% 6 43% 7 29% 3 21% 7 17% 43 20%
Total 332 100
% 171 100% 158 100% 14 100% 24 100% 14 100% 42 100% 214 100%
Fall 2001 Percentage of successful ENG 100A or 104 students enrolling or succeeding in ENG 1A Enrolled in ENG 1A 75% 78% 71% 75% 94% 91% 66% 75% Succeeded in ENG 1A 61% 66% 54% 63% 75% 82% 48% 62% Math: Students who enrolled in Math 55 in Fall 2001 were followed to see how many 1) enrolled in the next math course and 2) succeeded in the next math course. Overall 55% (210) of students in Fall 2001 succeeded in Math 55. Of those, 77% enrolled in the next course (Math 30’s or 40’s) and 61% succeeded. Math 55 does not have the gender gap that English does with men and women succeeding at similar rates. Additionally, men and women enroll in the next math course at similar rates. However, men are not as successful in that next math course as women (56% men successful vs. 64% women successful). African-American students, while enrolling at a lower rate, succeed at a higher rate than all students. Asian students enroll at a very high rate (91% Asians enroll vs. 77% all students enroll) but have a low success rate (55% Asian succeed vs. 61% all students succeed). So, most Asian students who pass Math 55 do enroll in the next Math course but only about half succeed. Filipino students enroll at lower rates and succeed at very low rates. Latino students both enroll and succeed at higher rates.

District: Chabot-Las Positas Community College College : Las Positas
Table C2: Math Basic Skills Progression
All students successfully completing Math 55/55B/55Y in Fall 2001 enrolling or succeeding in MATH 30's or 40's within 2 years (by Summer 2003) Total Gender Race-Ethnicity Fall 2001 MATH 55/55B/55Y Students Female Male African American Asian Filipino Latino White Success 210 55% 118 56% 89 54% 3 30% 11 69% 8 67% 23 47% 148 56% Non-Success 82 21% 48 23% 33 20% 7 70% 1 6% 1 8% 13 27% 54 21% Withdrawal 90 24% 45 21% 44 27% 0 0% 4 25% 3 25% 13 27% 60 23% Total 382 100% 211 100% 166 100% 10 100% 16 100% 12 100% 49 100% 262 100%
Percentage of Successful MATH 55/55B/55Y students enrolling or succeeding in MATH 30's or 40's
Enrolled in MATH 30's or 40's 77% 77% 75% 67% 91% 63% 87% 76% Succeeded in MATH 30's or 40's 61% 64% 56% 67% 55% 38% 65% 64%
Note: If a student repeats a course within the time period then the latest grade is taken for determining enrollment and success.

District: Chabot-Las Positas Community College College : Las Positas
CAMPUS-BASED RESEARCH
4. DEGREE and CERTIFICATE COMPLETION. Ratio of the number of students by population group who receive a degree or certificate to the number of students in that group with the same informed matriculation goal.
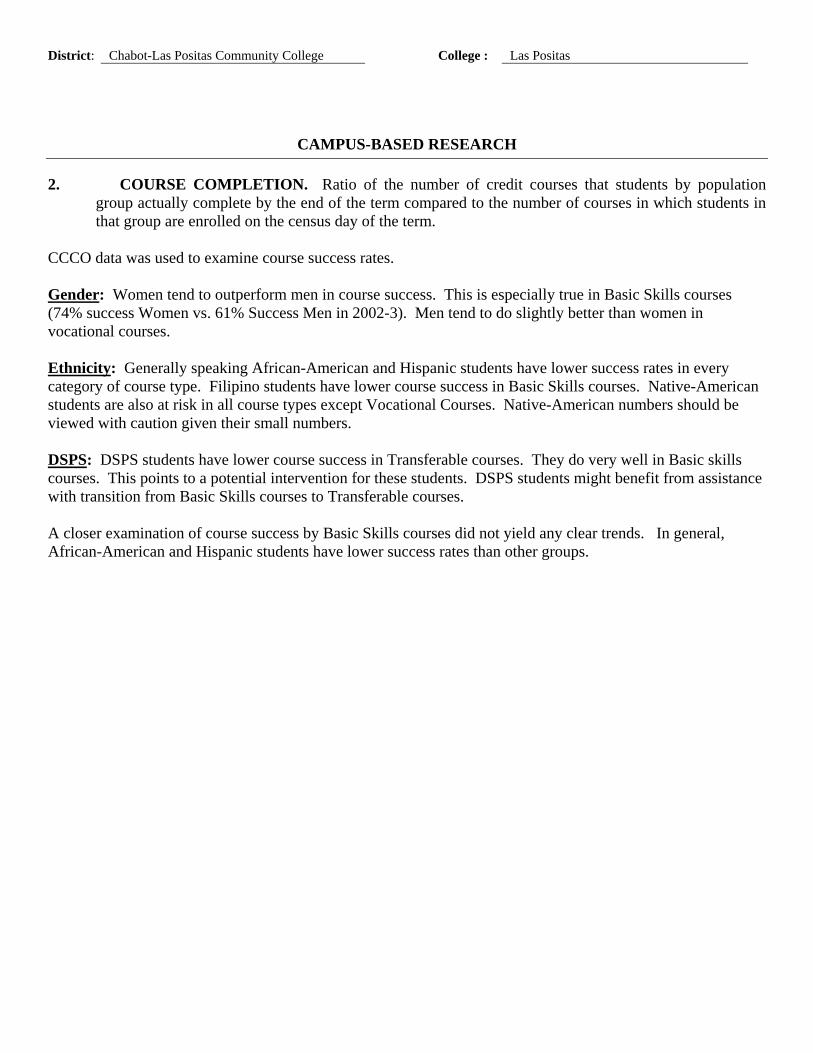
Data for Degree and Certificate Completion was derived from the CLPCCD Institutional Data Base. The Fall 1999 new student cohort was followed until Spring 2003 to determine the number who earned a degree or certificate. College level English and Math completion was also tracked. Certificates: 2% of women and 1% of men in the Fall 1999 new student cohort earned a degree in the allotted time (see Chart D1). There does not seem to be a much of a difference in rates based upon ethnicity (see Chart D2). Degrees: 11% of the Fall 1999 new student cohort earned degrees by Spring 2003 (see Chart D3). Women are more likely to earn a degree with 13% of women earning a degree compared to only 9% of men (see Chart D4). Filipino (25%), white (12%), and Asian students (11%) earned degrees at or higher than the overall rate. Only 5% of Latinos and 0% of African Americans earned a degree by Spring 2003 (see Chart D5). College Level English Completion: As of Spring 2003, 42% of the Fall 1999 new student cohort had enrolled in English 1A and 35% succeeded in Eng 1A (see Chart D6). More women (38%) than men (31%) succeeded in English 1A (see chart D7.) White students had the highest English 1A Success rate (38%) followed by Filipinos (32%), Asians (30%), Latinos (24%), and African Americans (21%) (see Chart D8). College Level Math Completion: As of Spring 2003, 19% of the Fall 1999 new student cohort had enrolled in college level math and 15% had succeeded. Almost equal proportions of women and men successfully completed college level math (See Chart D10). Filipinos and Asians had a 25% successful completion rate while 21% of White students successfully completed college level math. Only 12% of Latinos and 7% of African Americans successfully completed college level math (See Chart D11).

District: Chabot-Las Positas Community College College : Las Positas
Chart D1: Las Positas CollegePercentage of student cohort
who earned certificates, by genderCumulative by percentage and semesterFall 1999 new student cohort (n=1,124)
0% 0% 0% 1% 1% 1% 1% 2%0% 0% 0% 0% 0% 1% 1% 1%0%
10%
20%
30%
40%
50%
60%
70%
80%
90%
100%
f99 f99-sp00 f99-f00 f99-sp01 f99-f01 f99-sp02 f99-f02 f99-sp03
WomenMen

District: Chabot-Las Positas Community College College : Las Positas
Chart D 2: Las Positas CollegePercentage of student cohort
who earned certificates, by ethnicityCumulative by percentage and semesterFall 1999 new student cohort (n=1,124)
0% 0% 0% 0% 0% 0% 0% 0%0% 0% 0% 0% 0% 0% 0% 0%0% 0% 0% 0% 0% 0% 0% 0%0% 0% 0% 0% 1% 2% 2% 2%0% 0% 0% 0% 1% 1% 1% 1%0%10%
20%30%
40%50%60%
70%80%
90%100%
f99 f99-sp00
f99-f00 f99-sp01
f99-f01 f99-sp02
f99-f02 f99-sp03
African AmericanAsianFilipinoLatinoWhite

District: Chabot-Las Positas Community College College : Las Positas
Chart D3: Las Positas CollegePercentage of student cohort
who earned degreesCumulative by percentage and semesterFall 1999 new student cohort (n=1,124)
0% 0% 0% 3% 5% 8% 10% 11%
0%
10%
20%
30%
40%
50%
60%
70%
80%
90%
100%
f99 f99-sp00
f99-f00 f99-sp01
f99-f01 f99-sp02
f99-f02 f99-sp03
Earned degrees

District: Chabot-Las Positas Community College College : Las Positas
Chart D4: Las Positas CollegePercentage of student cohort
who earned degrees, by genderCumulative by percentage and semesterFall 1999 new student cohort (n=1,124)
0% 0% 1%5%
8% 10% 12% 13%
0% 0% 0% 1% 3% 6% 8% 9%
0%
10%
20%
30%
40%
50%
60%
70%
80%
90%
100%
f99 f99-sp00 f99-f00 f99-sp01 f99-f01 f99-sp02 f99-f02 f99-sp03
WomenMen

District: Chabot-Las Positas Community College College : Las Positas
Chart D5: Las Positas CollegePercentage of student cohort
who earned degrees, by ethnicityCumulative by percentage and semester
Fall 1999 new student cohort (n=1,124)
0% 0% 0% 0% 0% 0% 0% 0%0% 0% 0% 2% 4%7% 9% 11%
0% 0% 0%4% 4%
14%18%
25%
0% 0% 0% 1% 3% 4% 5% 5%0% 0% 0%
3%6%
9% 10% 12%
0%
10%
20%
30%
40%
50%
60%
70%
80%
90%
100%
f99 f99-sp00
f99-f00 f99-sp01
f99-f01 f99-sp02
f99-f02 f99-sp03
African AmericanAsianFilipinoLatinoWhite

District: Chabot-Las Positas Community College College : Las Positas
Chart D6: Las Positas CollegePercentage of student cohort
who took or succeeded in English 1ACumulative by percentage and semesterFall 1999 new student cohort (n=1,124)
17%
28%
0%
38%
0% 0% 0%
42%
13%21%
27% 29% 32% 33% 34% 34%
0%
10%
20%
30%
40%
50%
60%
70%
80%
90%
100%
f99 f99-sp00
f99-f00
f99-sp01
f99-f01
f99-sp02
f99-f02
f99-sp03
Took English 1ASucceeded in Eng 1A

District: Chabot-Las Positas Community College College : Las Positas
Chart D7: Las Positas CollegePercentage of student cohort
who succeeded in English 1A, by genderCumulative by percentage and semesterFall 1999 new student cohort (n=1,124)
15%22%
31% 33% 36% 37% 37% 38%
11%
19%23% 25% 28% 29% 30% 31%
0%
10%
20%
30%
40%
50%
60%
70%
80%
90%
100%
f99 f99-sp00 f99-f00 f99-sp01 f99-f01 f99-sp02 f99-f02 f99-sp03
WomenMen

District: Chabot-Las Positas Community College College : Las Positas
Chart D8: Las Positas CollegePercentage of student cohort
who succeeded in English 1A, by ethnicityCumulative by percentage and semester
Fall 1999 new student cohort (n=1,124)
7% 7%
21% 21% 21% 21% 21% 21%
7%
16%
27% 27% 27% 27% 29% 30%
11%14%
18%21%
29%32% 32% 32%
6%
13%17% 19%
22% 23% 23% 24%
15%
23%
29%32%
35% 36% 37% 38%
0%
10%
20%
30%
40%
50%
60%
70%
80%
90%
100%
f99 f99-sp00
f99-f00 f99-sp01
f99-f01 f99-sp02
f99-f02 f99-sp03
African AmericanAsianFilipinoLatinoWhite
District: Chabot-Las Positas Community College College : Las Positas
Chart D9: Las Positas CollegePercentage of student cohort
who took or succeeded in College-level MathCumulative by percentage and semesterFall 1999 new student cohort (n=1,124)
7% 9% 13% 15% 17% 18% 18% 19%
4% 6% 9% 10% 12% 13% 14% 15%
0%
10%
20%
30%
40%
50%
60%
70%
80%
90%
100%
f99 f99-sp00
f99-f00
f99-sp01
f99-f01
f99-sp02
f99-f02
f99-sp03
Took College MathSucceeded in College Math

District: Chabot-Las Positas Community College College : Las Positas
Chart D10: Las Positas CollegePercentage of student cohort
who succeeded in College-level Math, by genderCumulative by percentage and semesterFall 1999 new student cohort (n=1,124)
3%7%
12%16% 18% 19% 20% 21%
5% 8%11% 14% 15% 17% 18% 20%
0%
10%
20%
30%
40%
50%
60%
70%
80%
90%
100%
f99 f99-sp00 f99-f00 f99-sp01 f99-f01 f99-sp02 f99-f02 f99-sp03
WomenMen
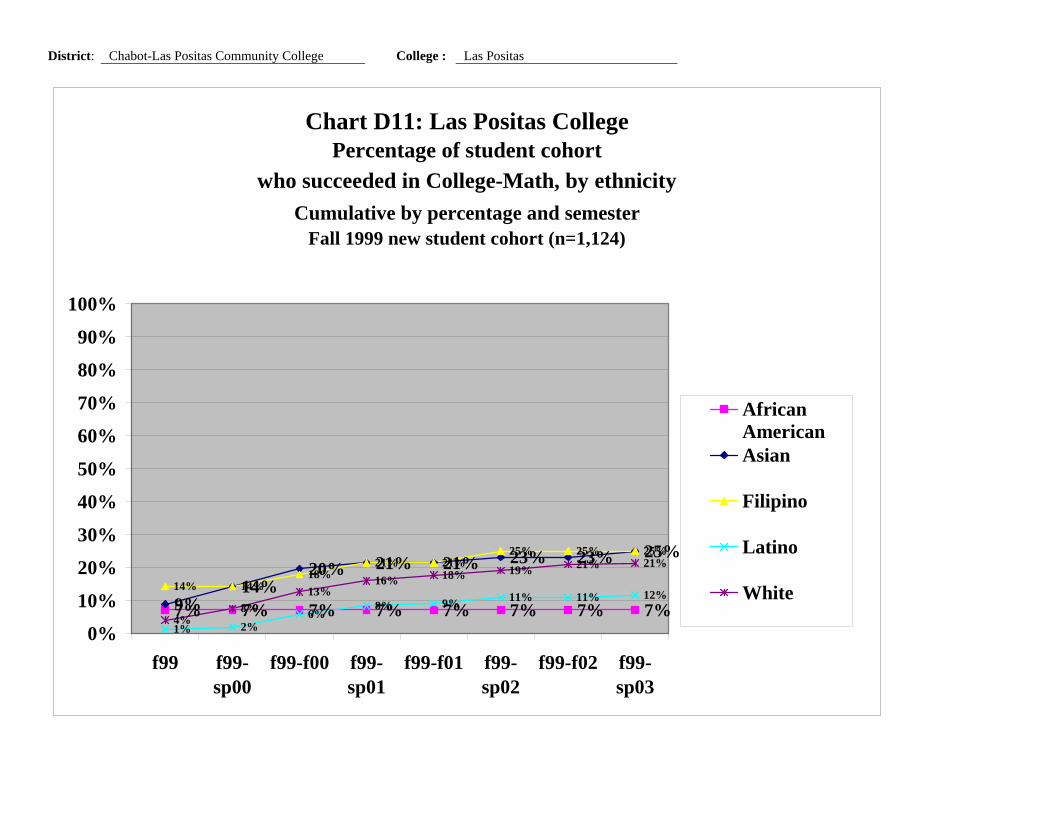
Chart D11: Las Positas CollegePercentage of student cohort
who succeeded in College-Math, by ethnicityCumulative by percentage and semester
Fall 1999 new student cohort (n=1,124)
7% 7% 7% 7% 7% 7% 7% 7%9%14%
20% 21% 21% 23% 23% 25%
14% 14%18%
21% 21%25% 25% 25%
1% 2%6%
8% 9% 11% 11% 12%
4%8%
13%16% 18% 19% 21% 21%
0%
10%
20%
30%
40%
50%
60%
70%
80%
90%
100%
f99 f99-sp00
f99-f00 f99-sp01
f99-f01 f99-sp02
f99-f02 f99-sp03
AfricanAmericanAsian
Filipino
Latino
White
District: Chabot-Las Positas Community College College : Las Positas


District: Chabot-Las Positas Community College College : Las Positas
CAMPUS-BASED RESEARCH
5. TRANSFER. Ratio of the number of students by population group who complete a minimum of 12 units and have attempted a transfer level course in mathematics or English to the number of students in that group who actually transfer after one or more (up to six) years.
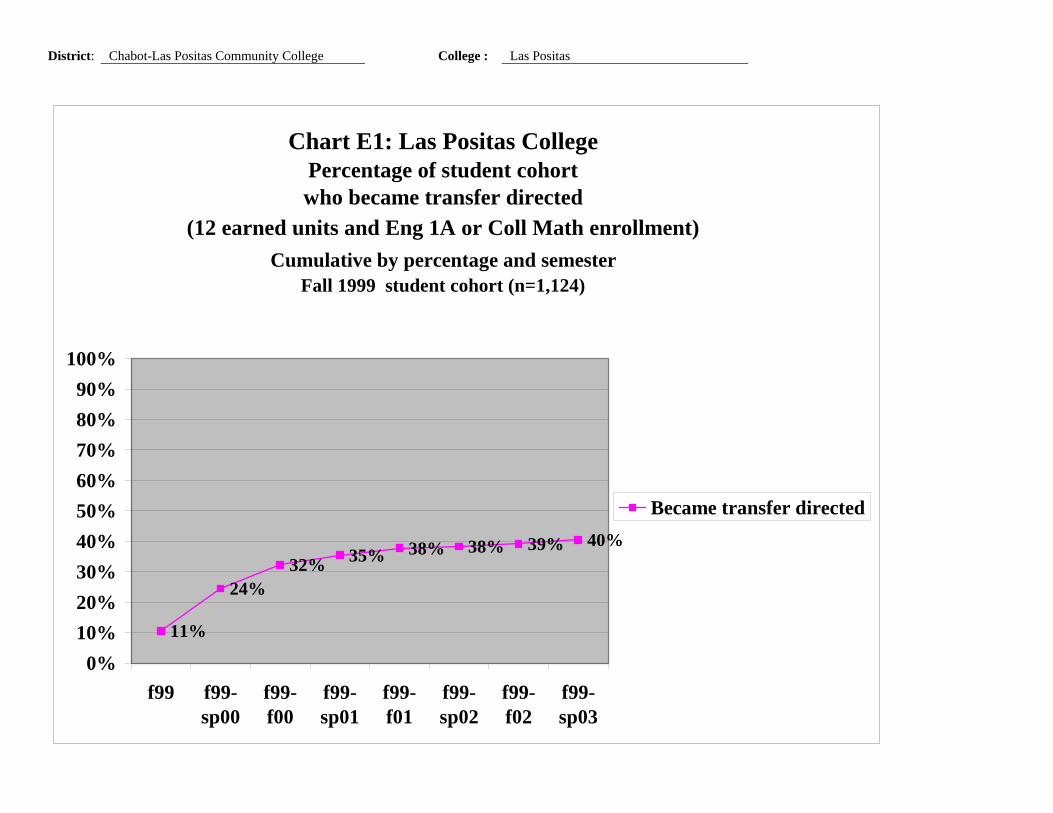
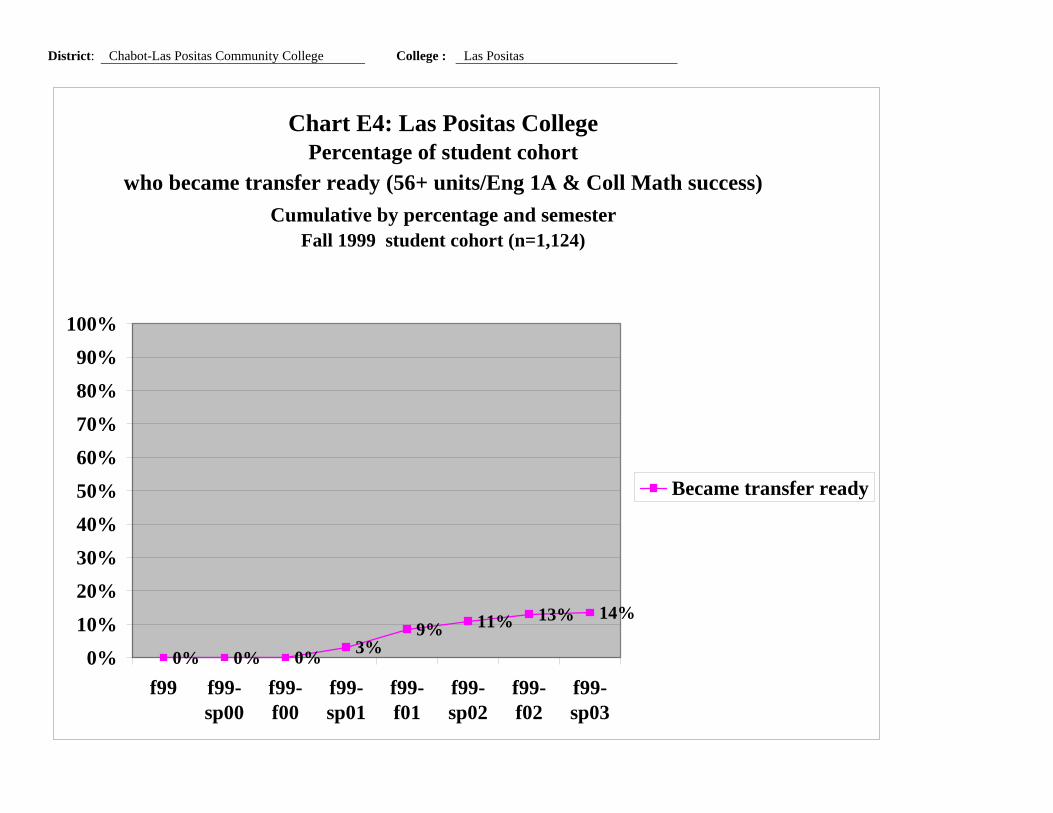
Data for Degree and Certificate Completion was derived from the CLPCCD Institutional Data Base. The Fall 1999 new student cohort was followed to determine the proportions that become 1). Transfer directed (took college level English or Math) and 2) transfer ready (56+ units/English 1A and college math)
Transfer Directed: 40% of the Fall 1999 new student cohort become transfer directed as of Spring 2003 (See Chart E1). Women are more likely to become transfer directed then men (42% vs. 37% - see Chart E2). White students (43%) and Asian students (43%) have higher rates of Transfer Directedness. Filipinos (36%), Latinos (30%), and African Americans (21%) have lower rates (see Chart E3). Transfer Ready: 14% of the Fall 1999 new student cohort became transfer ready by Spring 2003 (see Chart E4). Slightly more women than men became transfer ready (15% of women vs. 13% of men - see Chart E5). Asians (21%) and Filipinos (21%) are the most likely to become transfer ready. Fourteen percent (14%) of White students become transfer ready. Only 9% of Latino students and 4% of African American students became transfer ready (see Chart E6).
District: Chabot-Las Positas Community College College : Las Positas
Chart E1: Las Positas CollegePercentage of student cohort who became transfer directed
(12 earned units and Eng 1A or Coll Math enrollment)Cumulative by percentage and semester
Fall 1999 student cohort (n=1,124)
11%
24%32% 35% 38% 38% 39% 40%
0%10%20%30%40%50%60%70%80%90%
100%
f99 f99-sp00
f99-f00
f99-sp01
f99-f01
f99-sp02
f99-f02
f99-sp03
Became transfer directed

District: Chabot-Las Positas Community College College : Las Positas
Chart E2: Las Positas CollegePercentage of student cohort
who became transfer directed, by genderCumulative by percentage and semesterFall 1999 new student cohort (n=1,124)
12%
27%
37% 40% 42% 42% 43% 42%
9%
21%28%
31% 33% 35% 34% 37%
0%
10%
20%
30%
40%
50%
60%
70%
80%
90%
100%
f99 f99-sp00 f99-f00 f99-sp01 f99-f01 f99-sp02 f99-f02 f99-sp03
WomenMen

District: Chabot-Las Positas Community College College : Las Positas
Chart E3: Las Positas CollegePercentage of student cohort
who became transfer directed, by ethnicityCumulative by percentage and semester
Fall 1999 new student cohort (n=1,124)
4%11%
21% 21% 21% 21% 21% 21%
11%
23%
34%38% 39% 39% 39%
43%
14%18%
29%32% 32%
36% 36% 36%
3%
14%
20%24%
27% 28% 28% 30%
12%
27%
36%39%
41% 42% 43% 44%
0%
10%
20%
30%
40%
50%
60%
70%
80%
90%
100%
f99 f99-sp00
f99-f00 f99-sp01
f99-f01 f99-sp02
f99-f02 f99-sp03
African AmericanAsianFilipinoLatinoWhite
District: Chabot-Las Positas Community College College : Las Positas
Chart E4: Las Positas CollegePercentage of student cohort
who became transfer ready (56+ units/Eng 1A & Coll Math success)Cumulative by percentage and semester
Fall 1999 student cohort (n=1,124)
0% 0% 0% 3%9% 11% 13% 14%
0%
10%
20%
30%
40%
50%
60%
70%
80%
90%
100%
f99 f99-sp00
f99-f00
f99-sp01
f99-f01
f99-sp02
f99-f02
f99-sp03
Became transfer ready

District: Chabot-Las Positas Community College College : Las Positas
Chart E5: Las Positas CollegePercentage of student cohort
who became transfer ready, by genderCumulative by percentage and semester
Fall 1999 new student cohort (n=1,124)
0% 0% 0%6%
10% 13% 14% 15%
0% 0% 0%4% 7% 9% 12% 13%
0%
10%
20%
30%
40%
50%
60%
70%
80%
90%
100%
f99 f99-sp00
f99-f00 f99-sp01
f99-f01 f99-sp02
f99-f02 f99-sp03
WomenMen

Chart E6: Las Positas CollegePercentage of student cohort
who became transfer ready, by ethnicityCumulative by percentage and semester
Fall 1999 new student cohort (n=1,124)
0% 0% 0% 4% 4% 4% 4% 4%0% 0%7% 11%
16% 16% 20% 21%
0% 0% 0%
7% 7% 7%
18%21%
0% 0% 0% 1%5%
8% 8% 9%
0% 0% 0%5%
9%12% 14% 14%
0%
10%
20%
30%
40%
50%
60%
70%
80%
90%
100%
f99 f99-sp00
f99-f00 f99-sp01
f99-f01 f99-sp02
f99-f02 f99-sp03
African AmericanAsianFilipinoLatinoWhite
District: Chabot-Las Positas Community College College : Las Positas


District: Chabot-Las Positas Community College College : Las Positas
CAMPUS-BASED RESEARCH
CAMPUS CLIMATE AND STUDENT LEARNING OUTCOMES (SELF-REPORTED) For data on Campus Climate we used the Fall 2003 LPC Student Survey. We examined selected variables by gender and race. Correlations were run between each variable and gender/race to determine if there were any statistically significant associations. Although correlations do not prove causation, they can be instrumental in determining patterns and identifying associations between gender, race and the selected variables. Gender and Campus Climate/Student Outcomes Female students are statistically more likely to be more satisfied than men with LPC in every aspect tested except their overall impression of LPC. Women report being treating with more respect by instructors, students, office staff, and administrators. Women are more likely to feel there is general respect for differences in race, gender, disability, age, orientation, and religion. Women are more satisfied with their overall experience at LPC and with instructors. Women are more satisfied with the welcoming atmosphere of the college and report more encouragement from instructors to participate/share different viewpoints. In relation to self-reported gains in student learning outcomes, women report greater gains since enrolling at LPC on 29 of the 34 areas. This data is consistent with our other data sources that show men with lower course success, degree completions, and transfer readiness than women. It should also be noted that this gender gap is a well-known phenomenon in higher education. Generally speaking, men do not have the same retention rates or levels of satisfaction with the college experience as women. Race and Campus Climate/Student Outcomes Due to low numbers, correlations were not computed for African Americans, Native American and Middle Eastern students. White students tend to feel that there is more general respect for differences in Race, Gender, Sexual Orientation and Religion than non-white students. White students are also more likely to report encouragement from instructors to participate/share different viewpoints than non-white students. White students reported less gains in 20 out of 34 learning outcomes. This could indicate less growth in this population. Another possible explanation is that these students come to LPC with more skill in these areas and, therefore, do not make the types of gains that other groups do. Another possible explanation is that this group of students is less likely to attribute growth in these areas to LPC than the other groups. Asian students were less likely to feel treated with respect by other students than non-Asian students. Asian students were also less likely to feel that there is a general respect for differences in Race, Gender, and Sexual Orientation than non-Asian students. Asian students were also less likely to report encouragement from instructors to participate/share different viewpoints. Hispanic students were less likely to feel that there was a general respect for differences in Race. Hispanic students also reported more gains in 10 out of the 34 areas. This could indicate greater growth by Hispanic students. Another possible explanation is that these students came to LPC with less skill in these areas.

District: Chabot-Las Positas Community College College : Las Positas Table F1: Las Positas College Fall 2003 Student Survey – Campus Climate
Correlations by Gender and Race on Selected Variables Campus Climate Female White Asian HispanicOverall Impression of LPC Treated with Respect by instructors .354** Treated with respect by Students .336** (-).9l* Treated with respect by Office Staff .337** Treated with respect by Administrators .336** There is general respect for difference: Race .325** .167** (-).116** (-).088* There is general respect for differences: Gender .317** .106* (-).132** There is general respect for differences: Disability .334** There is general respect for differences: Age .363** There is general respect for differences: Orientation .346** .107* (-).143** There is general respect for differences: Religion .296** .106* Overall Experience at LPC .379** Overall experience with instructors .355** Welcoming atmosphere of the college .326** Encouragement from instructors to participate/share different viewpoints .246** .136** (-).159**

District: Chabot-Las Positas Community College College : Las Positas
Table F2: Las Positas College Fall 2003 Student Survey –Student Learning Outcomes Correlations by Gender and Race on Selected Variables
Self-Reported Learning Outcomes Female White Asian HispanicReading Skills .112* (-).157** .122** Writing skills .181* (-).099* .104* Oral communication and speaking skills .128** (-).088* .113* listening effectively .218** Critical Thinking .161* .127** Mathematical Skills and Abilities .119* (-).088*
Ability to read, interpret, and generate charts and graphs (-).123** Using numerical data (-).104* Apply knowledge to new situation to solve problems .152**. Gathering information from multiple sources .173** (-).091* .99* Using logic to draw conclusions from information .149** Ability to learn on my own, pursue ideas and find information .197** Develop clear career goals .203** Skills I can use in my current or future career .240** Ability to meet challenges of a rapidly-changing society .156** (-).098* Ability to meet deadlines and complete tasks .266** Ability to use computers effectively .147** (-)121* Overall technology literacy (-).113* Awareness of my civic or community responsibilities .096* (-).112* Appreciation of my role in a democratic society (-).139* .091* Discovering my own potential .219** Performing to the best of my abilities .279** Clarity of my own values and ethical standards .247** (-).129** .97*
Understanding myself-abilities, interests and limitations .264** Ability to set goals and develop strategies to reach them .267** Learning to work cooperatively with others .229** (-).108* Ability to get along with different kinds of people .239**
Awareness and appreciation of diverse cultures and ways of life .221** (-).113* .124** Recognize my own biases and values .190** (-).129** .129** Desire to contribute to my community/Society .208** (-).145** Accepting responsibility for my own actions .223** (-).137** .098* Demonstrating respect for rights, views, work of others .213** (-).129** .091* Exhibiting personal, professional, and academic honesty .212** (-).105* Appreciation for the Arts and the role art plays in Society .110* ** Significant at .01, * Significant at .05

District: Chabot-Las Positas Community College College : Las Positas