Student Dropout Indicators in Kentucky kid-FRIENDLy Race ...
58
Western Kentucky University TopSCHOLAR® Masters eses & Specialist Projects Graduate School Summer 2016 Student Dropout Indicators in Kentucky kid- FRIENDLy Race-To-e-Top Schools Candace M. Ellio Western Kentucky University, [email protected] Follow this and additional works at: hp://digitalcommons.wku.edu/theses Part of the Child Psychology Commons , and the School Psychology Commons is esis is brought to you for free and open access by TopSCHOLAR®. It has been accepted for inclusion in Masters eses & Specialist Projects by an authorized administrator of TopSCHOLAR®. For more information, please contact [email protected]. Recommended Citation Ellio, Candace M., "Student Dropout Indicators in Kentucky kid-FRIENDLy Race-To-e-Top Schools" (2016). Masters eses & Specialist Projects. Paper 1641. hp://digitalcommons.wku.edu/theses/1641
Transcript of Student Dropout Indicators in Kentucky kid-FRIENDLy Race ...

Western Kentucky UniversityTopSCHOLAR®
Masters Theses & Specialist Projects Graduate School
Summer 2016
Student Dropout Indicators in Kentucky kid-FRIENDLy Race-To-The-Top SchoolsCandace M. ElliottWestern Kentucky University, [email protected]
Follow this and additional works at: http://digitalcommons.wku.edu/theses
Part of the Child Psychology Commons, and the School Psychology Commons
This Thesis is brought to you for free and open access by TopSCHOLAR®. It has been accepted for inclusion in Masters Theses & Specialist Projects byan authorized administrator of TopSCHOLAR®. For more information, please contact [email protected].
Recommended CitationElliott, Candace M., "Student Dropout Indicators in Kentucky kid-FRIENDLy Race-To-The-Top Schools" (2016). Masters Theses &Specialist Projects. Paper 1641.http://digitalcommons.wku.edu/theses/1641

STUDENT DROPOUT INDICATORS IN KENTUCKY
kid-FRIENDLy RACE-TO-THE-TOP SCHOOLS
A Specialist Project Presented to
The Faculty of the Department of Psychology Western Kentucky University
Bowling Green, Kentucky
In Partial Fulfillment Of the Requirements for the Degree
Specialist in Education
By Candace M. Elliott
August 2016


iii
ACKNOWLEDGMENTS
I would like to express my sincerest gratitude to the Western Kentucky University
faculty members who helped me with my thesis. I am incredibly grateful for all the time
they spent assisting me and answering my questions. First, I would like to thank Dr. Jie
Zhang for motivating me to complete my thesis and dedicating her valuable time to
assisting me. I also greatly appreciate the help I received with the statistics involved.
Additionally, I would like to thank Dr. Carl Myers for encouraging me and being
available to assist me with editing, as well as Dr. Tony Norman for the opportunity to
participate with the Rock Solid Evaluation Project. Furthermore, I would like to thank the
members of the Rock Solid Evaluation Project for their encouragement and help with the
data collection process. The individuals who work there were extremely helpful
throughout the development of this thesis.
Last but not least, I would like to thank my family, friends, and cohort members
for their support. I would especially like to thank my mother, Christine Thompson, for
encouraging me to continue my education and always being there to listen when I needed
someone.

iv
CONTENTS
List of Figures .................................................................................................................. V List of Tables ................................................................................................................. VI Abstract ......................................................................................................................... VII Introduction .......................................................................................................................1 Literature Review ..............................................................................................................5 Method ............................................................................................................................21 Results .............................................................................................................................24 Discussion .......................................................................................................................38 References .......................................................................................................................46

v
LIST OF FIGURES
Figure 1. Percentages of Students in Agreement with Dropout Indicator #1…………..27
Figure 2. Percentages of Students in Agreement with Dropout Indicator #2………..…27
Figure 3. Percentages of Students in Agreement with Dropout Indicator #3………..…28 Figure 4. Percentages of Students in Agreement with Dropout Indicator #4………..…28 Figure 5. Percentages of Students in Agreement with Dropout Indicator #5………..…29 Figure 6. Percentages of Students in Agreement with Dropout Indicator #6………..…29
Figure 7. Percentages of Students in Agreement with Dropout Indicator #7……......…30 Figure 8. Percentages of Students in Agreement with Dropout Indicator #8.……….…30 Figure 9. Percentages of Students in Agreement with Dropout Indicator #9………..…31 Figure 10. Percentages of Students in Agreement with Dropout Indicator #10………..31 Figure 11. Percentages of Students Reporting No Dropout Indicators…………...........35
Figure 12. Percentages of Students Reporting One Dropout Indicator ...………….......35 Figure 13. Percentages of Students Reporting Two Dropout Indicators ........................36 Figure 14. Percentages of Students Reporting Three Dropout Indicators ......................36
Figure 15. Percentages of Students Reporting Four Dropout Indicators ........................37 Figure 16. Percentages of Students Reporting Five Dropout Indicators ........................37

vi
LIST OF TABLES Table 1. Total Number and Percent of Participants by Grade ........................................22 Table 2. Dropout Indicator Survey Items……………………………..………………..23 Table 3. Frequencies and Percentages of Students in Agreement with Dropout
Indicators ...........................................................................................................25
Table 4. Frequencies and Percentages of Students with Academic and Non-Academic
Factors…………...….…………………………………………………………33

vii
STUDENT DROPOUT INDICATORS IN KENTUCKY kid-FRIENDLy RACE-TO-THE-TOP SCHOOLS
Candace M. Elliott August 2016 50 Pages
Directed by: Jie Zhang, Carl Myers, and Tony Norman
Department of Psychology Western Kentucky University
This study examined the trend of ten dropout indicators between various grade
levels and focused on those indicators that can be changed, such as attendance or grades,
versus those factors that cannot be changed by the student (i.e., their socioeconomic
status). The study consisted of 111 Race-to-the-Top Schools from 22 districts in the
Green River Regional Educational Cooperative (GRREC) and the Ohio Valley
Educational Cooperative (OVEC) in Kentucky. A total of 18,072 students in fourth, sixth,
eighth, ninth, and eleventh grades completed the 10-item dropout indicator survey.
Results of the Chi-square analysis indicate that percentages of agreement on most of the
ten dropout indicators increase by grade with some exceptions (e.g., repeated a grade and
referrals). Overall, academic and non-academic factors were of equal importance for
most of the grades surveyed. However, ninth grade students were twice as likely to report
non-academic factors over academic.
Keywords: dropout indicators, Race-to-the-Top Schools, academic factors, non-
academic factors

1
Introduction
The United States is currently dealing with a dropout crisis. Approximately every
nine seconds another student leaves high school without earning a diploma (Christenson
& Thurlow, 2004; Lehr, Hanson, Sinclair, & Christenson, 2003). A national report from
Education Week and the Editorial Projects in Education Research Center found that the
graduation rate has dropped for the second year, after a decade that showed some
increases (Education Week, 2010). These new findings raise cause for concern, as those
who fail to finish high school will face far greater hardships than their graduating peers,
particularly during a period of economic instability (Education Week, 2010).
It is estimated that 25% of public school students who began high school in the
fall of 2000 did not earn a diploma four years later in 2003-2004 (Rumberger & Lim,
2008). More recent numbers have shown that 1.3 million students from the high school
class of 2010 failed to graduate from high school. This means three out every ten students
are not obtaining a high school diploma (Education Week, 2010). For the 2003–2004
school year, the U.S. Department of Education estimated a national graduation rate of
74.3%. However, other recent studies have begun to re-evaluate the methods of national
graduation estimation and have reported that the national average graduation rates are
less than 70% (Bowers, 2010). For the class of 2007, only 68.8% of graduating students
earned a high school diploma (Education Week, 2010). That number can vary depending
on the data source and the method used to collect that data. Different sources and studies
have the graduation rate at anywhere from 66 to 88 percent (Heckman & LaFontaine,
2010).

2
Graduating from high school in the United States has been demonstrated to lead
to better quality futures for students, as opposed to students who drop out of school or
earn a substitute diploma (Bowers, 2010; Jimerson, Reschly, & Hess, 2014; Rumberger,
2011; Rumberger & Rotermund 2012). Dropout statistics are surprising because jobs that
pay wages high enough to make a living and provide benefits have almost completely
disappeared for those who do not earn a high school diploma (Christenson & Thurlow,
2004). Students who leave high school have less options for employment and, if they are
employed, they are most likely working in low-skilled, low-paying position with less
opportunities for further advancement (Christle, Jolivette, & Nelson, 2007). The
unemployment rate for high school dropouts was 14.3%, compared to 9.6% for high
school graduates and 8.2% for associate’s degrees or some college and 4.3% for those
with bachelor’s degrees or higher (Goss & Andren, 2014). In today’s world, the cost of
each high school dropout can be astronomical. It is estimated that there is a loss of
billions of dollars in revenue, plus the additional costs of welfare programs,
unemployment programs, underemployment, and crime prevention and prosecution
(Christenson & Thurlow, 2004).
The average annual income for an individual with a high school diploma is
approximately $8,000 to $9,000 higher than their peers who did not graduate
(Bridgeland, DiIulio & Morison, 2006). The U.S. Department of Education reports that
the median income of people ages 18 through 67 who had not completed high school was
roughly $25,000 in 2009 (American Psychological Association, 2012). A recent study
predicted that each student who graduates from high school would create more than
$200,000 in government savings (Northeastern University, 2009; Rumberger &

3
Rotermund, 2012). The Alliance for Excellent Education estimates, “if the students who
dropped out of the class of 2009 had graduated, the nation’s economy would have
benefited from nearly $335 billion in additional income during the course of their
lifetimes” (Deyé, 2011, p. 1).
Early school withdrawal involves interactions between the student, family, school,
and community. It also includes factors that put the student at risk. School policies, which
include suspension and grade retention for students who are considered to be not ready to
advance have been associated with higher dropout rates (Christenson & Thurlow, 2004).
Students need to know that they benefit immensely from earning a high school diploma.
If they understand the importance of one, they are more likely to accept responsibility for
completing their work and following school rules (Knesting, 2008). Dropping out is not
an event that occurs at any single point in time. An increasing amount of research shows
that dropping out is the final stage in an extended and complicated progression of
disengagement and detachment from school (Balfanz, 2009; Bowers, 2010; Finn, 1989;
Jimerson, et al., 2014; Jimerson, Anderson, & Whipple, 2002; Jimerson, Egeland, Sroufe,
& Carlson, 2000; National Research Council, 2011; Rumberger & Rotermund, 2012).
Purpose of the Present Study
The majority of the current literature on dropouts focuses on high school age
students even though early intervention with students at-risk is the most beneficial
(Christenson, Sinclair, Lehr, & Godber, 2001). The purpose of the present study is to
provide information to help fill in the gap in the literature about the trend and differences
in dropout indicators between the various grade levels (i.e., 4, 6, 8, 9, and 11). Identifying
those students that are at-risk for leaving high school without earning a diploma is

4
important for being able to intervene early in their educational career. This study focuses
on those indicators that can be changed, such as attendance or grades, versus those factors
that cannot be changed by students (i.e., their socioeconomic status). The participating
schools were 111 Race-to-the-Top Schools from 22 districts in the Green River Regional
Educational Cooperative (GRREC) and the Ohio Valley Educational Cooperative
(OVEC), which represent a large portion of the schools in Kentucky. The findings from
this study have implications for future research on dropout indicators and dropout
prevention programs in schools.

5
Literature Review
Definition of Dropout
Everyone agrees it is important to locate the students who are at risk for dropping
out, but this is made difficult by the lack of an efficient definition of who is considered a
dropout (Heckman & LaFontaine, 2010). A simple definition is “an individual who quits
school before graduation and has not enrolled in or completed an educational equivalency
program” (Jimerson et al., 2014, p. 83). Traditionally, in the past, individual schools have
determined who is considered a dropout. However, states have a difficult time tracking
individual students over time. This often leads to discrepancies in the data and inaccurate
numbers. In 2001, the No Child Left Behind guidelines specified how to count dropouts,
stating that only those who earn a traditional high school degree at the end of their fourth
year can be considered to be a high school graduate. States are now encouraged to use
aggregated cohort rates (Jimerson et al., 2014; Rumberger, 2011). This is intended to
account for the students who transfer in and out of a cohort and identify those students
most at risk for leaving school before earning their diploma. The U.S. Department of
Education uses the averaged freshmen graduation rate to measure the percentage of
students in a cohort who graduate four years later. Using data reported to the National
Center for Education Statistics Common Core of Data, this measure takes the number of
graduates with a regular diploma and divides it by the number of estimated freshman four
years earlier (Jimerson et al., 2014).
Besides the different definitions of dropouts, there can also be different types of
dropouts. Janosz, LeBlanc, Boulerice, and Tremblay (1997) divided dropouts into four
groups. The first group is the quiet dropouts. Those were the students who had no

6
behavior problems and good levels of commitment to school but whose overall school
grades were lower than those who graduated. The next group is the disengaged dropouts.
These students had average or below-average levels of school misbehavior, low
commitment to school, and average grades. Next is the low achiever dropouts. They had
a very low commitment to schooling, average or lower levels of misbehavior, and failing
grades. The last group are those classified as maladjusted dropouts. They had elevated
levels of behavior problems, low commitment to school, and failing grades. One finding
from previous analyses on dropout indicators is that, although students begin their
disengagement from school for various reasons, two different paths develop: one that is
primarily due to academic struggle and failure and another related more to behavioral
difficulties and misconduct (Balfanz, Herzog, & Mac Iver, 2007).
Dropout Trends
Schools in the United States are losing an average of 7,200 students every day
(American Psychological Association, 2012; Education Week, 2010; Jimerson et al.,
2014; Rumberger & Rotermund, 2012). These numbers vary by state. In 2006, Kentucky
had 57,252 ninth graders. However, four years later, 41,086 students graduated. Those
figures represent 16,166 students from the class of 2010 who did not earn a high school
diploma. Kentucky lost an estimated 90 students per day over the four year period. The
states surrounding Kentucky had higher numbers. In that same period, Indiana had 131
dropouts per day; Illinois had 253; Missouri had 111; Virginia had 180; Tennessee had
157; and Ohio had 218 (Education Week, 2010). Future workplace demands in the
United States will require higher levels of education, however; according to the most

7
recent statistics, the nation is going to have a shortage of up to 3 million postsecondary
degrees by 2018 (Goss & Andren, 2014).
An analysis completed in 2007 used longitudinal data to examine high school
completion rates for the last several decades. They found that the high school graduation
rate has slowly decreased during the last 35 years. As a result of this decline, the number
of working adults with college degrees in the United States has also decreased. Heckman
and LaFontaine (2010) found that the graduation rate in the United States was at its
highest in the late 1960, it was around 80 percent at that time, and since then has
decreased by four to five percentage points. They also found that the percentage of
people that leave high school with a diploma is significantly lower than the 88 percent
estimate provided by the National Center for Educational Statistics.
Some of the recent improvements in high school graduation rates are due to
progress in improving or eliminating “dropout factories.” These high schools represent a
little more than one in ten of all high schools but produce a disproportionate amount of
the nation’s dropouts (Balfanz, Bridgeland, Moore, & Fox, 2010). The term “dropout
factories” refers to those high schools that graduate 60% or less of their overall students.
These particular schools produce half of the nation’s dropouts and two-thirds of the
ethnic minority dropouts. The dropouts in these schools are negatively impacted by the
high amount of poverty. Dropout factories are mainly found in 15 states throughout the
country. These schools account for 12% of the national total, however, they are estimated
to be responsible for about 50% of the nation’s total number of dropouts. Although about
2.1 million students still attend dropout factories as of 2009, that number is almost
184,000 less students than in 2008 (American Psychological Association, 2012). If the

8
nation’s dropout factories, and the roughly 3,000 high schools that currently have
graduation rates between 61 and 75%, were able to increase their graduation rates by 20
percentage points in the next ten years, the United States would reach a 90% graduation
rate (Balfanz et al., 2010).
Early Identification
In the research that has attempted to study and assess which students drop out,
there has been an emphasis on recognizing early indicators of probable student dropouts
to help schools focus resources on those children that are more likely to be at risk
(Bowers, 2010; Jimerson et al., 2014). Risk factors for dropping out of school are present
in all areas of life (i.e., individual, family, school, community, friends), and the
probability of a student dropping out increases as the number of risk factors increase
(Christle et al., 2007). Disengagement may begin as early as elementary school, when
students do not participate in either the academic or the social activities of school life
(Jimerson et al., 2014; Rumberger & Rotermund, 2012). Poor or failing performance on
assignments, misconduct, failure to do schoolwork, and absence of participation in
extracurricular activities are all indications of disengagement. This can often lead to
frequent absences, retention in grades, and repeated transfers to other schools (National
Research Council, 2011). This issue is important not only to help understand which
students will drop out but also to help in a school’s decision to require dropout
interventions for students deemed at-risk for dropping out. If a dropout indicator is not
accurate, then some students could be misidentified as more likely to drop out when in
reality they would have graduated without any interventions. The same is true if it is the
other way around, students who are not flagged and therefore do not receive

9
interventions, and subsequently do not graduate from high school (Balfanz, 2009;
Bowers, Sprott, & Taff, 2013).
For many districts throughout the country, early student dropout identification is
fundamentally important so that the different districts can possibly intervene immediately
in students’ educational careers to help interrupt or avoid having the student dropout.
Balfanz (2009) found that less than one in every four students who had at least one early
warning indicator graduated within an extra year of when they originally should have
graduated. The earlier in their educational career students begin to show signs of
disengagement and a lack of participation in school, the more likely they will be to leave
without having earned their diploma (Balfanz, 2009). Students will often display the
warning signs as early as elementary school (Jimerson et al., 2014). Without successful
intervention for these students, their behaviors do not usually disappear or improve over
time and lead to course failures, grade retentions, and, eventually, dropping out (Balfanz,
2009).
Based on research, there have been various models proposed in the last few
decades that describe the pathways to dropping out. These models show the multifaceted
and diverse process a student may go through before making the decision to drop out.
One model (Finn, 1989), known as the participation-identification model, emphasizes
that students’ active participation within the school and related activities and their
connection to the school impacted whether or not they were able to obtain a high school
diploma. According to this model, absence of engagement in the school was an important
piece to the drop out process. The participation-identification model describes school

10
engagement as being “composed of the student’s behavior (involvement with the
classroom and school activities) and identification with the school” (Finn, 1989, p. 133).
In Finn’s (1989) model, a student dropping out of high school has been through a
long process of disengagement, and thus, dropping out was not something that happened
overnight. To participate in school, the student has to have regular school attendance, be
prepared to do the work, and respond to the teacher’s directions and instructions.
Additional areas of participation include being involved, both at the classroom level and
at the school level, participating in social and peer activities, attending after school
activities and functions, and being an active participant in the decision making process
(Finn, 1989).
Another model proposed by Evans and DiBenedetto (1990) provides four possible
pathways that focus on the interaction of the individual and school factors that can lead to
student dropouts. The four pathways are unexpected events, long-term underlying
problems, early skill deficits, and entry problems (i.e., beginning school with emotional
and/or behavioral problems). Similar to Finn’s model, this model proposes that
examining student behaviors, rather than looking at their predetermined characteristics,
better identifies dropouts. Evans and DiBenedetto believe that when a student drops out it
is the result of a “snowball effect,” where the events that occurred previously have had an
adverse impact on subsequent events (Evans & DiBenedetto, 1990, p. 65; Jimerson et al.,
2002).
A better understanding of why students drop out is needed in order to effectively
address the dropout crisis. Yet recognizing the reasons why a student drops out is
tremendously challenging. Like other methods of scholastic achievement (e.g., test

11
scores), the process of dropping out is manipulated by an assortment of influences
associated with both the individual student and with the family, school, and community
settings in which the student resides (Jimerson et al., 2014; Rumberger & Lim, 2008;
Rumberger, 2011; Rumberger, 2012; Rumberger & Rotermund 2012). These concerns
with early dropout identification are particularly challenging, given current struggles to
design and evaluate dropout prevention programs (Bowers, 2010). An early warning
system is used to notify a school early that a student is at a greater probability for
dropping out in the future (Reschly, Appleton, & Pohl, 2014). Schools need to
appropriately recognize the students who will drop out without inaccurately flagging
students who would have graduated anyway (Balfanz, 2009; Bowers et al., 2013).
Warning Indicators
Attendance is an important indicator for predicting which students are at-risk for
dropping out of high school (Romero & Lee, 2007; Schoeneberger, 2012; Suhyun, Jingo
& Houston, 2007). Attending school less than 90% of the time in sixth grade increases
the chance that the student will not graduate from high school. Fifteen percent of sixth
graders from the Balfanz et al. (2007) study attended school less than 80% of the time.
By the spring of 2000, only 60% of those students were in the 9th grade and 28% had
already left the school district. As the school years progress, a larger number of the
students with this indicator stray off the graduation path. By 2002, only 15% of the
students in the study were in the 11th grade as expected, and 57% had left the district
(Balfanz et al., 2007).
Similar to attendance patterns, failing a class or course was a better predictor of
not graduating from high school than were low test scores. Students who failed either a

12
mathematics or English course in the sixth grade rarely graduated from the school
district. Overall, 14% of the sixth graders failed mathematics. Of those students, 19%
eventually graduated from the school district within a five year time period. Eleven
percent of those same sixth graders failed their English class and only 18% graduated
from the school district within five years (Balfanz et al., 2007).
Early grade retention is one of the most powerful predictors of later school
dropout (Jimerson et al., 2002; Kennelly & Monrad, 2007). The short-term benefits of
being held back may disperse in later years and lead to dropping out of school. Students
who repeat a grade are 40% to 50% more likely to drop out than those promoted, and
students who are retained in two grades are 90% more likely to drop out (Jimerson et al.,
2002). Teachers are usually only aware of a student’s results in the years directly
following retention, and, as such, their perspectives are somewhat limited. Research
during the past 10 years has suggested that the two common beliefs: it is better to retain a
child in kindergarten or first grade rather than in the higher grades; and that elementary
grade retention may result in achievement gains; are unsupported. Often these benefits
disappear after the first few years, and these students eventually fall behind their peers
(Jimerson et al., 2002).
Within the school system, out-of-school suspension is one of the most widely
used disciplinary practices. There are more than 3.3 million students suspended each year
(Lee, Cornell, Gregory, & Fan, 2011). Schools that practice exclusionary discipline may
actually be inhibiting the progress of students. This often facilitates a cycle of failure.
Students who are excluded from school have fewer opportunities to gain academic skills
and appropriate social behaviors (Christle et al., 2007). Balfanz et al. (2007) found that,

13
of the 6% of students who served one or more out-of-school suspensions in sixth grade,
only 20% graduated within a five year period. Additionally, in their sample, 222 6th
graders received in-school suspensions, and only 17% of them remained on the
graduation path in high school. The odds of graduating decreased even more for the 136
students who had two suspensions and the 74 students who had three or more (Balfanz et
al., 2007).
Students leaving high school give reasons for dropping out such as a lack of
motivation, boredom, an unchallenging atmosphere, or an overall lack of engagement in
school. A survey conducted in 2006 with young adults who left high school without
earning diplomas found that almost half (47 percent) said a major reason for dropping out
was that classes were not interesting and roughly 7 in 10 respondents (69 percent) said
they were not motivated or inspired to work hard. Students often report other similar
school-related reasons for why they dropped out (Bridgeland et al., 2006). Often, this
level of disengagement can lead to the student failing academically, which in turn is
another indicator of dropping out (Kennelly & Monrad, 2007).
Most of the studies reviewed focused on the age of the participants and not in
what grade they were in currently. However, Balfanz et al. (2007) looked at early
identification and intervention data for junior high grades to help decrease student
disengagement and increase the number of students earning high school diplomas. They
focused their analyses on sixth grade students in Philadelphia. Around this age is when
they found that students begin to show higher levels of disengagement; this was reflected
in the student’s attendance patterns. They created a longitudinal dataset using student
attendance, demographic information, office data, academic course and credit

14
information, and individual test data provided by the Philadelphia School District.
Overall, their sample included 12,972 students enrolled in sixth grade in 1996/1997 and
followed over eight years through spring 2014, one year past the expected graduation for
those students (Balfanz et al., 2007).
Balfanz et al. (2007) used a multivariate logistic regression to estimate how
predictive each of those indicators from the information they collected could be. The
analyses revealed that chronic absentees were 68% less likely than other students to
graduate; those with a poor behavior grade were 56% less likely to graduate than others;
those who failed math were 54% less likely to graduate; and those who failed English
were 42% less likely to graduate than other students. Using these four dropout indicators,
the authors found that 60% of the students who did not graduate from the school district
within one year of their anticipated graduation date could be identified. The students with
one or more of these indicators had only a 29% graduation rate from high school.
Another longitudinal study (Christle et al., 2007) found that dropping out of high
school is influenced by numerous elements, including early effects beginning in
childhood and involving both family and individual student factors. The study
specifically found that collective individual and family influences, junior high school
achievement, high school achievement and motivation, as well as drug use, were
associated with a higher likelihood of dropping out of school.
The Christle et al. (2007) study involved measuring and comparing the
relationships of family, personal factors, school influences and school dropouts using 19
years of longitudinal data. Including 205 families in the sample, the researchers used
interviews, questionnaires, and home observations starting during the last trimester of

15
pregnancy, and continuing until the children were 19, to gather information on each
family’s lifestyles and values, socioeconomic status, amount of stress, and any drug use.
The researchers found that by including family predictors in their analysis, they were able
to better predict the indicators of student dropouts (Christle et al., 2007).
A study completed in 1971 (Bachman, Davidson, Green, & Wirtanen, 1971)
found that problem behaviors in school, academic achievement, and negative attitudes
about school were the best predictors of school dropout, followed by intelligence and
family history or background (Janosz et al., 1997). Janosz et al. conducted a similar study
in order to identify the dominant predictors of school dropout and examine how
consistent they were over time. Their participants included two samples of boys and girls
from 12 to 16 years old (n = 791 in 1974; n = 791 in 1985). In the year prior to the
students leaving school, they completed a self-administered questionnaire on their
psychosocial adjustment.
Janosz et al. measured the students’ school experiences including academic
grades, any grade retentions, their level of stress in school, misconduct (office referrals,
suspensions, etc.), as well as their engagement in school and involvement in
extracurricular activities. They also included questions that examined the students’
attitudes towards school, self-competence, importance of success, and future educational
goals. Their analysis found that school, family, behavioral, social, and personality factors
could all predict which students would drop out of school in both samples (Janosz et al.,
1997).

16
Prevention and Intervention
Preventing and providing interventions for students at-risk of dropping out of high
school is important because there are years of research to show that students who do not
graduate from high school have higher rates of unemployment and incarceration, as well
as lower lifetime earnings and life expectancy (Bowers, 2010; Bowers, et al. 2013;
Jimerson et al., 2014; Legters & Balfanz, 2010; Rumberger, 1987; Rumberger &
Rotermund, 2012; Schoeneberger, 2012). Around half of all welfare recipients and half of
the prison population in the United States do not have high school degrees (Suh & Suh,
2011). The Center for Democratic Policy, Institute for Educational Leadership, reported
that 52% of welfare recipients, 82% of the prison population, and 85% of juvenile justice
cases are high school dropouts (Christle et al., 2007).
Dropout prevention programs typically provide intensive services to the students
within a school district considered to be most likely to drop out (Gleason & Dynarski,
2002). Prevention programs have been found to be beneficial in helping students succeed
and stay in school (Suh & Suh, 2007). Schools and their staff cannot change the personal,
family, and community factors that often put students at risk for dropping out, but they
can provide protective factors. Protective factors are features provided to individuals or
families that, when present, diminish or eliminate the risk of dropping out of school.
Unsuccessful school experiences, such as poor academic performance, grade retention,
excessive or chronic absenteeism, behavior and discipline problems, and frequent
transfers to different schools accumulate to eventually isolate the student from peers or
school (Christle et al., 2007). Accurate screening of possible students that may drop out

17
of high school requires the knowledge of how many, and which, indicators need to be
considered (Janosz et al., 1997).
Besides prevention programs, early intervention with students may be the most
influential and money-saving approach to preventing students from dropping out
(Rumberger, 2011). Many intervention samples are selected due to their at-risk status;
however, the criteria for determining those at-risk is not consistent. Because of the
different paths that can lead a student to drop out of school, it has been challenging to
develop prevention or intervention programs. Interventions often targeted include
academic enhancement, mentoring and supportive relationships, psychosocial skills
development, and teacher training in child behavior management (Prevatt & Kelly, 2003).
According to Prevatt and Kelly (2003) there is some evidence that interventions
implemented within the elementary school grades should focus on academic skills
acquisition and achievement. They suggest interventions in junior high can be more
beneficial when they focus more on student engagement. Intervention programs also need
to be evidenced based. Roughly 50% of the limited number of studies completed on
dropout intervention programs report statistical significance (Lehr et al., 2003).
More information is known about the students who drop out than about effective
intervention programs (Christenson & Thurlow, 2004). Most interventions have been
designed to help correct or manage specific predictors of dropouts, such as poor
attendance or academic performance. Typically the studies implemented interventions
with high school students that had a history of poor academic performance, poor
attendance, and often had a teacher referral for additional supports. Very few studies
were implemented with elementary age students (Christenson & Thurlow, 2004).

18
Interventions that identified positive effects for at least one dependent variable included
early reading programs, tutoring, counseling, and mentoring, as well as, offered students
community service opportunities. Those identified as effective interventions are more
helpful than simply increasing a student’s attendance or grades. They help students with
overall learning and to feel connected at school with their peers and teachers (Christenson
& Thurlow, 2004).
kid-FRIENDLy
The kid-FRIENDLy (Kids Focused, Responsible, Imaginative, Engaged, and
Determined to Learn) program is one of the two largest Race-to-the-Top district projects
funded by the U.S. Department of Education. For 2013-2017 the Green River Regional
Educational Cooperative and the Ohio Valley Educational Cooperative in Kentucky
received a 40 million dollar grant to personalize student learning and improve student
achievement in 22 of their districts. The kid-FRIENDLy program is based on several
concepts: students as leaders, leaders developing leaders, competency-based learning, and
personalized learning (kid-FRIENDLy, n.d.).
The program emphasizes preparing young children for kindergarten while
preparing older students as they near graduation and begin to make college and career
decisions. The goals of this grant are to: (a) increase the number of students who have
access to highly effective teachers and leaders; (b) improve the academic and non-
cognitive outcomes for students in prekindergarten through twelfth grade; (c) ensure all
students are on track to be college and career ready; and (d) ensure all students are
prepared for post-secondary careers, college and/or technical school (kid-FRIENDLy,
n.d.).

19
STEP Survey
As part of the grant requirement, students attending the schools participating in
the grant took the researcher-developed Student Engagement and Performance (STEP)
survey every spring since 2014. There were a total of 54 questions on this survey, in
addition there were ten dropout indicator questions for the grade levels, 4, 6, 8, 9, and 11.
The Rock Solid external evaluation team contracted by kid-FRIENDLy developed the
STEP survey to measure non-cognitive outcomes (i.e. social-emotional skills, school
engagement and satisfaction).
Item writing for the STEP instrument was conducted by the evaluation team.
After a list of instruments covering the major concepts of interest was compiled, relevant
items from each instrument were sorted and categorized. The items were rephrased from
existing sources or new items were written for each subscale the team was attempting to
measure. Once the initial items were developed, they were informally piloted via a small
sample of elementary age students. This was done to check children’s understanding of
the wording used for survey items. The items that presented with the most difficulty for
children were then modified or simplified to increase their understanding of the survey
question.
The ten dropout indicator questions were included as a part of the STEP survey
for certain grades. The dropout indicators used for this analysis were identified through
research studies and articles on dropout indicators. The indicators utilized were those
identified as the most predictive by previous research studies, while also being easier for
students to self-report (Agree/Disagree) on the survey (Bowers, et al., 2013).

20
The list of ten indicators were divided into two groups, academic and non-
academic. There are five indicators in each category. As shown in Table 3, the academic
factors are 1-5 and the non-academic factors are 6-10. The academic category consists of
items that are based on students’ school records (i.e., grades, attendance, etc.). The non-
academic category consists of the remaining five items. A more detailed description of
the dropout indicators is presented in the Method section.
Research Questions
Two research questions were asked:
1. What is the trend, or differences, in the frequency of student reported
dropout indicators across grade levels, 4, 6, 8, 9, and 11?
2. Are academic or non-academic dropout indicators more prevalent for each
grade level?
The first hypothesis for this thesis is that students in the higher grades would
report more dropout indicators then the lower grades. It is also predicted that students
will report more of the non-academic factors than academic factors.

21
Method
Participants
All participants were students attending various schools participating in the Race-
to-the-Top district project awarded to the Green River Regional Educational Cooperative
(GRREC) and the Ohio Valley Educational Cooperative (OVEC) in Kentucky. The total
number of Kentucky districts participating in the research grant is 22, which includes a
total of 111 schools. The questions pertaining to the dropout indicators were administered
only to the students in grades 4, 6, 8, 9, and 11. These grades were chosen by the U.S.
Department of Education, as stated in the guidelines. The total number of student
participants is 18,072. See the detailed participant information by grade level in Table 1.
Of the participating districts, 16 of 22 are districts of high poverty and these same
16 districts are considered to be rural. More than half of the participating students in the
kid-FRIENDLy schools qualify for free/reduced lunch. In all 22 districts, the college
completion rates are half the national average (30% nationally vs. 17% for these
Kentucky counties), and only 35% of the students in 2011 were considered to be
College/Career Ready on the Kentucky CCR accountability scale.
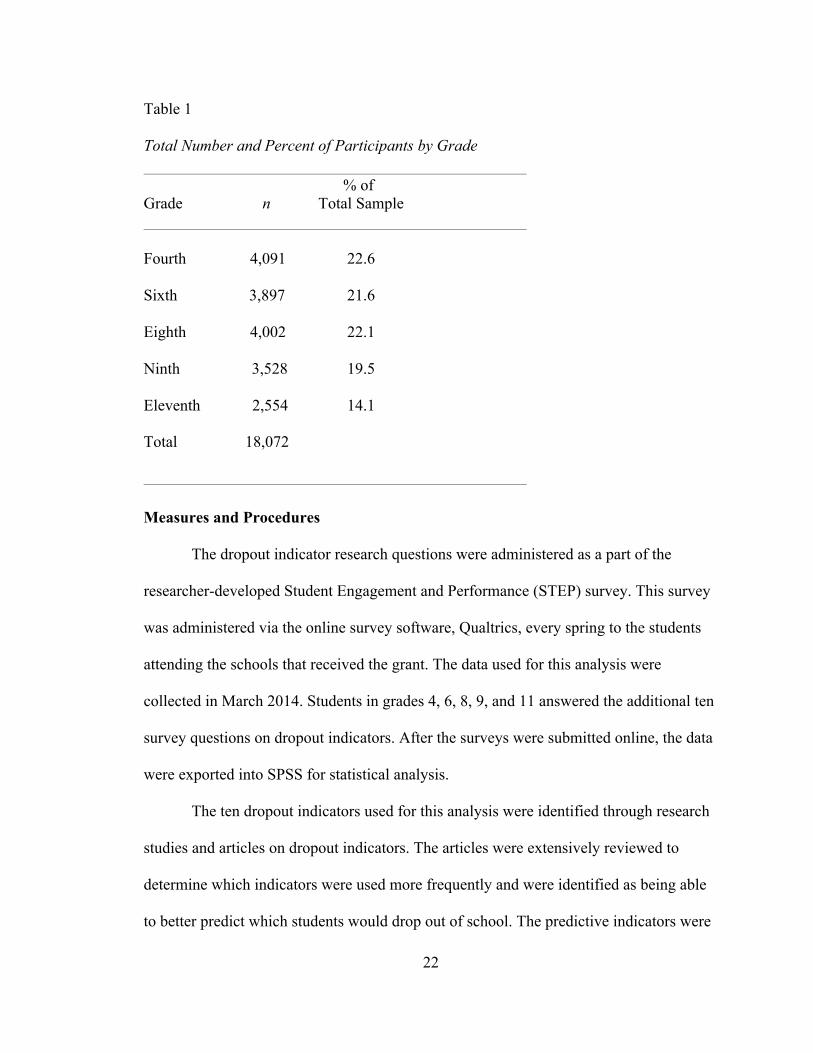
22
Table 1
Total Number and Percent of Participants by Grade % of Grade n Total Sample
Fourth 4,091 22.6
Sixth 3,897 21.6
Eighth 4,002 22.1
Ninth 3,528 19.5
Eleventh 2,554 14.1
Total 18,072
Measures and Procedures
The dropout indicator research questions were administered as a part of the
researcher-developed Student Engagement and Performance (STEP) survey. This survey
was administered via the online survey software, Qualtrics, every spring to the students
attending the schools that received the grant. The data used for this analysis were
collected in March 2014. Students in grades 4, 6, 8, 9, and 11 answered the additional ten
survey questions on dropout indicators. After the surveys were submitted online, the data
were exported into SPSS for statistical analysis.
The ten dropout indicators used for this analysis were identified through research
studies and articles on dropout indicators. The articles were extensively reviewed to
determine which indicators were used more frequently and were identified as being able
to better predict which students would drop out of school. The predictive indicators were

23
listed and frequency data was gathered to determine how often each was used in previous
research studies.
The the list of factors was then further narrowed by eliminating ones that were
deemed too difficult for students to self-report on the survey (e.g., their family's
socioeconomic status). The ultimate goal was to reduce the extensive list of indicators to
factors that were within the student's control (e.g., attendance). It was also necessary for
the survey to be short, as it was added to the end of a longer survey for certain grades.
Table 2 Dropout Indicator Survey Items Item No. Item
1 I have missed 10 or more days of school this year.
2 I have gotten poor or failing grades in reading (English).
3 I have gotten poor or failing grades in math.
4 I have had lots of referrals, suspensions, or both this year.
5 I have had to repeat a year in school (or a class or course credit).
6 I have often chosen NOT to do my schoolwork.
7 I have spent a lot of time with people who don't care about or do well in school.
8 I have thought about dropping out of school.
9 I am usually NOT interested in school.
10 I think that school is mostly boring.

24
Results
Research Question 1
To answer the first research question and determine the trend, or differences, in
the frequency of student reported dropout indicators across grade levels, 4, 6, 8, 9, and
11, a Chi-square analysis was used on each of the ten items. The analysis was used to see
whether there is a significant difference in the indicators across grade levels. Frequency
and percentage data are provided for each item by grade in Table 3. Percentage data by
item is also illustrated in Figures 1-10. Overall, percentages of agreement on most
dropout indicators increase by grade with some exceptions (e.g., repeated a grade and
referrals).
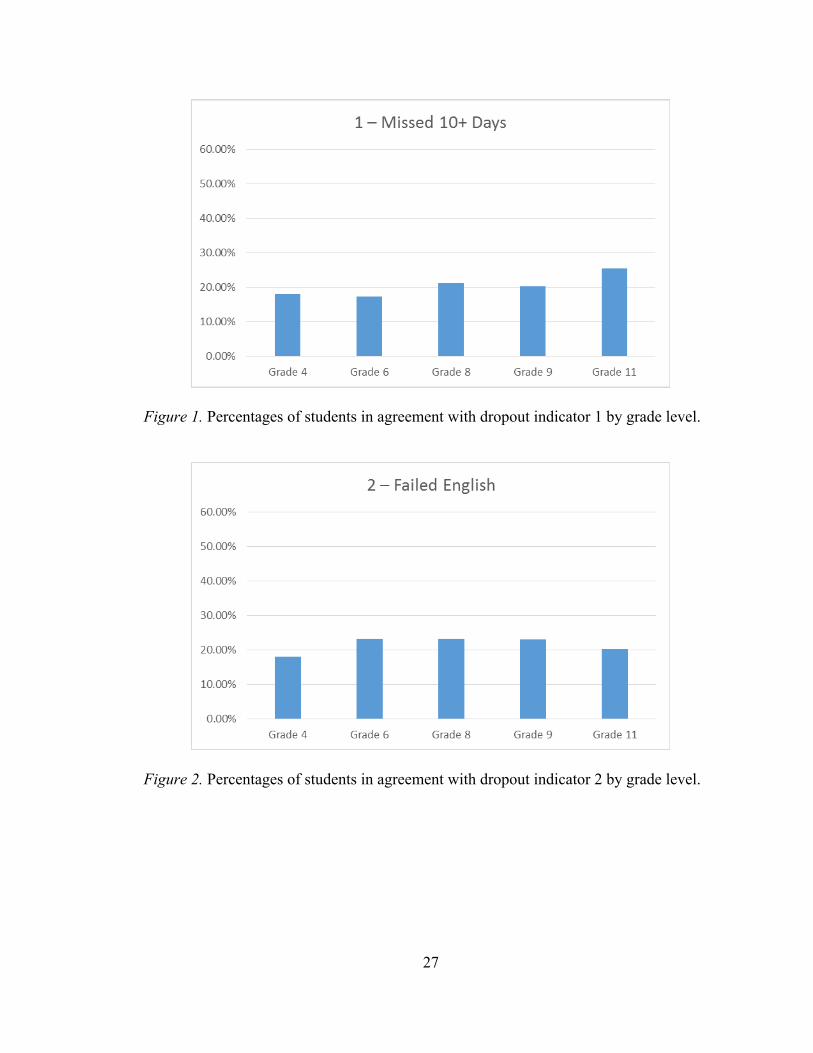
For indicator 1 (missed 10+ days) the percentage of students in agreement with
the item ranged from 18.1 in fourth grade to a 25.4 in eleventh grade. The total percent
decreases by roughly one percent in grades 6 and 9, before jumping by almost 5% in
grade 11. The data collected for indicator 2 (failed English) show that the highest level of
students in agreement with the item are the middle grades: 6, 8, and 9. A higher
percentage of students agreed with indicator 3 (failed math) in the higher grades: 8, 9,
and 11. Item 4 (referrals or suspensions) was one of only two items where the overall
percentage of students in agreement with the indicator decrease as the grades increase.
Overall, 13.4% of fourth graders agreed with the item, whereas only 6.7% of eleventh
grade students agreed. Indicator 5 (repeated a grade) was the other item where the
percentage decreased as grade level increased.

25
Table 3
Frequencies and Percentages of Students in Agreement with Dropout Indicators
T
he
dat
a
coll
ect
ed
for
ind
icat
or
6
(ch
ose
n to not work) shows that the highest level of students in agreement with the item are the
upper grades: 8, 9, and 11. The percentage of students in agreement increases as the grade
level increases. The highest amount of students in agreement with item 7 (friends do not
Item Number Grade 4 Grade 6 Grade 8 Grade 9 Grade 11
1 – Missed 10+ Days
740
(18.1%)
679
(17.4%)
843
(21.1%)
717
(20.3%)
648
(25.4%)
2 – Failed English
741
(18.1%)
905
(23.2%)
933
(23.3%)
816
(23.1%)
520
(20.3%)
3 – Failed Math 825
(20.2%)
837
(21.5%)
1125
(28.1%)
961
(27.2%)
716
(28%)
4 – Referrals or Suspensions
588
(13.4%)
345
(8.9%)
336
(8.4%)
289
(8.2%)
172
(6.7%)
5 – Repeated a Grade
705
(17.2%)
517
(13.3%)
480
(12%)
392
(11.1%)
337
(13.2%)
6 – Chosen to Not Work
424
(10.4%)
610
(15.6%)
987
(24.7%)
1012
(28.7%)
802
(31.4%)
7 – Friends Do Not Care
1039
(25.4%)
1271
(32.6%)
1547
(38.7%)
1303
(37%)
916
(35.8%)
8 – Considered Leaving School
426
(10.4%)
340
(8.7%)
434
(10.8%)
488
(13.8%)
420
(16.4%)
9 – Not Interested
959
(23.5%)
1175
(30.1%)
1491
(37.3%)
1350
(38.3%)
952
(37.2%)
10 – School is Boring
1056
(25.9%)
1583
(40.6%)
2075
(51.8%)
1831
(52%)
1396
(54.6%)

26
care) were in the eighth grade. For the most part, item 8 (considered leaving school),
increased with each grade level, the exception being the decrease from fourth to sixth
grade. A higher percentage of students agreed with indicator 9 (not interested) in the
higher grades: 8, 9, and 11. The same is also true for item 10 (school is boring). Overall,
compared to the other items, indicator 10 also had the most students that agreed with the
item; the percentages ranged from 25.9 to 54.6 and increased with grade.
The Chi-square analysis showed that only item 6 (I have often chosen NOT to do
my school work; x2(4) = 14.3, p = 0.006) and item 10 (I think school is mostly boring; x2
(4)
= 12.7, p = 0.013) showed significant differences across grade levels. This indicates that
these items have more variation between the grade levels than the other items.
27
Figure 1. Percentages of students in agreement with dropout indicator 1 by grade level.
Figure 2. Percentages of students in agreement with dropout indicator 2 by grade level.

28
Figure 3. Percentages of students in agreement with dropout indicator 3 by grade level.
Figure 4. Percentages of students in agreement with dropout indicator 4 by grade level.

29
Figure 5. Percentages of students in agreement with dropout indicator 5 by grade level.
Figure 6. Percentages of students in agreement with dropout indicator 6 by grade level.

30
Figure 7. Percentages of students in agreement with dropout indicator 7 by grade level.
Figure 8. Percentages of students in agreement with dropout indicator 8 by grade level.

31
Figure 9. Percentages of students in agreement with dropout indicator 9 by grade level.
Figure 10. Percentages of students in agreement with dropout indicator 10 by grade level.

32
Research Question 2
In order to answer the second research question and determine if academic or
non-academic dropout indicators were more prevalent for each grade level, a two by five
Cross-tab Chi-square analysis was performed for each number of dropout indicators. The
analysis is used to test the association of academic versus non-academic dropout
indicators and grade levels; given a certain number of dropout indicators reported (0-5) in
each category. Frequency and percentage data are provided in Table 4 and percentage
data are illustrated by Figures 11-16. The Chi-square analysis found no significant
associations between grade level and academic vs. non-academic dropout factors (ps >
.05).
Overall, almost half or less than half of the total students in each grade reported
they did not have any of the ten indicators. The number of students that show no
indicators decreased as the grade level increased. About 50% of the fourth grade students
reported zero academic and non-academic factors, whereas 42.7% (academic) and 33.9%
(non-academic) of eleventh grade students reported zero. More students also reported that
they had no academic, versus non-academic factors. For example, 45.5% of ninth grade
students reported no academic indicators, whereas 33.3% reported no non-academic
factors.
33
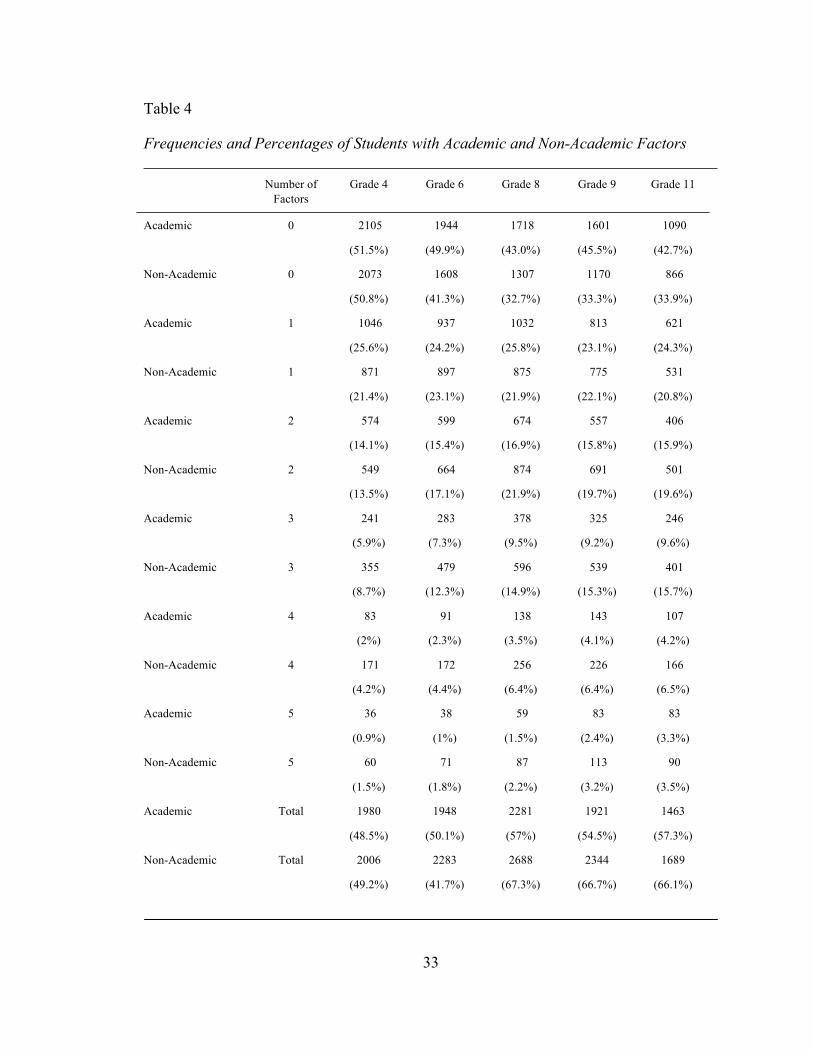
Table 4
Frequencies and Percentages of Students with Academic and Non-Academic Factors
Number of Factors
Grade 4 Grade 6 Grade 8 Grade 9 Grade 11
Academic 0 2105
(51.5%)
1944
(49.9%)
1718
(43.0%)
1601
(45.5%)
1090
(42.7%)
Non-Academic 0 2073
(50.8%)
1608
(41.3%)
1307
(32.7%)
1170
(33.3%)
866
(33.9%)
Academic 1 1046
(25.6%)
937
(24.2%)
1032
(25.8%)
813
(23.1%)
621
(24.3%)
Non-Academic 1 871
(21.4%)
897
(23.1%)
875
(21.9%)
775
(22.1%)
531
(20.8%)
Academic 2 574
(14.1%)
599
(15.4%)
674
(16.9%)
557
(15.8%)
406
(15.9%)
Non-Academic 2 549
(13.5%)
664
(17.1%)
874
(21.9%)
691
(19.7%)
501
(19.6%)
Academic 3 241
(5.9%)
283
(7.3%)
378
(9.5%)
325
(9.2%)
246
(9.6%)
Non-Academic 3 355
(8.7%)
479
(12.3%)
596
(14.9%)
539
(15.3%)
401
(15.7%)
Academic 4 83
(2%)
91
(2.3%)
138
(3.5%)
143
(4.1%)
107
(4.2%)
Non-Academic 4 171
(4.2%)
172
(4.4%)
256
(6.4%)
226
(6.4%)
166
(6.5%)
Academic 5 36
(0.9%)
38
(1%)
59
(1.5%)
83
(2.4%)
83
(3.3%)
Non-Academic 5 60
(1.5%)
71
(1.8%)
87
(2.2%)
113
(3.2%)
90
(3.5%)
Academic Total 1980
(48.5%)
1948
(50.1%)
2281
(57%)
1921
(54.5%)
1463
(57.3%)
Non-Academic Total 2006
(49.2%)
2283
(41.7%)
2688
(67.3%)
2344
(66.7%)
1689
(66.1%)
34
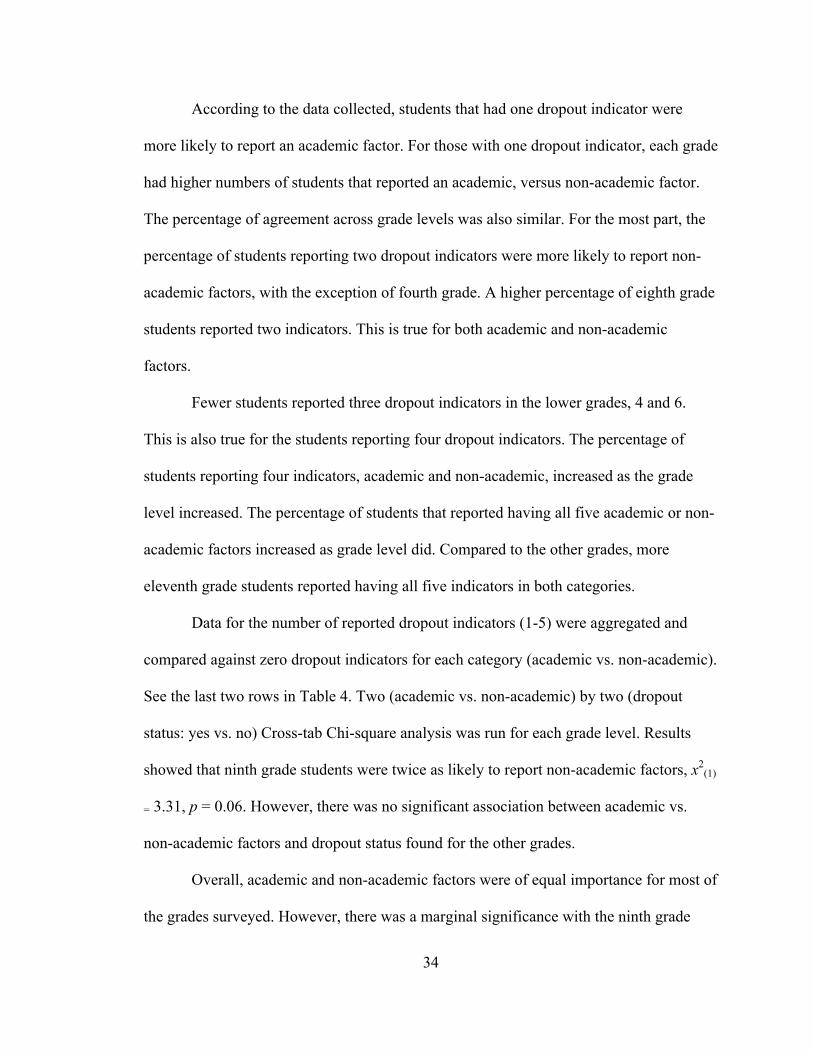
According to the data collected, students that had one dropout indicator were
more likely to report an academic factor. For those with one dropout indicator, each grade
had higher numbers of students that reported an academic, versus non-academic factor.
The percentage of agreement across grade levels was also similar. For the most part, the
percentage of students reporting two dropout indicators were more likely to report non-
academic factors, with the exception of fourth grade. A higher percentage of eighth grade
students reported two indicators. This is true for both academic and non-academic
factors.
Fewer students reported three dropout indicators in the lower grades, 4 and 6.
This is also true for the students reporting four dropout indicators. The percentage of
students reporting four indicators, academic and non-academic, increased as the grade
level increased. The percentage of students that reported having all five academic or non-
academic factors increased as grade level did. Compared to the other grades, more
eleventh grade students reported having all five indicators in both categories.
Data for the number of reported dropout indicators (1-5) were aggregated and
compared against zero dropout indicators for each category (academic vs. non-academic).
See the last two rows in Table 4. Two (academic vs. non-academic) by two (dropout
status: yes vs. no) Cross-tab Chi-square analysis was run for each grade level. Results
showed that ninth grade students were twice as likely to report non-academic factors, x2(1)
= 3.31, p = 0.06. However, there was no significant association between academic vs.
non-academic factors and dropout status found for the other grades.
Overall, academic and non-academic factors were of equal importance for most of
the grades surveyed. However, there was a marginal significance with the ninth grade

35
students. These ninth grade students were twice as likely to report non-academic factors
over academic.
Figure 11. Percentages of students reporting no dropout indicators by grade level.
Figure 12. Percentages of students reporting one dropout indicator by grade level.

36
Figure 13. Percentages of students reporting two dropout indicators by grade level.
Figure 14. Percentages of students reporting three dropout indicators by grade level.

37
Figure 15. Percentages of students reporting four dropout indicators by grade level.
Figure 16. Percentages of students reporting five dropout indicators by grade level.

38
Discussion
The purpose of the current study is to provide information to help fill in the gap in
the literature about the trend in dropout indicators between grade levels. The first
hypothesis for this thesis is that students in the higher grades would report more dropout
indicators then the lower grades. It is also predicted that students will report more of the
non-academic factors than academic factors. This hypothesis is partially supported by the
results of the Chi-square analysis that was used on each dropout indicator and both
categories.
Research Question 1
Results of the Chi-square analyses indicate that percentages of agreement on most
of the ten dropout indicators increased by grade with some exceptions (e.g., repeated a
grade and referrals). This means that students in the upper grades are more likely to
report having at least one dropout indicator. However, there was a statistical difference
found for only items 6 and 10. For indicator 1 (missed 10+ days) the percentage of
students in agreement with the item ranged from 18.1 in fourth grade to a 25.4 in eleventh
grade. Balfanz (2009) found that attending school less than 90% of the time increases the
chance that the student will not graduate from high school. This is important because
18% of all fourth grade students in this study reported missing at least ten days of school
a year. The number of absences reported increases as the grade level increases. It is
possible this is due to the age of the student (i.e., older students are more likely to be
responsible for getting themselves to school).
The results for indicator 2 (failed English) showed that the highest level of
students in agreement with the item were in grades 6, 8, and 9. A higher percentage of

39
students agreed with indicator 3 (failed math) in the higher grades: 8, 9, and 11. A
longitudinal study found that poor junior high and high school academic achievement
was associated with a higher likelihood of dropping out of school (Christle et al., 2007).
Students need to earn a certain number of credits every year during high school in order
to graduate on time. The current findings indicate that eighth and ninth grade students are
more likely to have failed English and/or math than most of the other grades.
Item 4 (referrals or suspensions) was one of only two items where the overall
percentage of students in agreement with the indicator decreased as the grades increased.
Overall, 13.4% of fourth graders agreed with the item, whereas only 6.7% of eleventh
grade students agreed. This is a good indication because students who are excluded from
school have fewer opportunities to gain academic skills and appropriate social behaviors
(Christle et al., 2007). It is possible that the maturity level of the older students in the
sample played a part in the lower levels of misbehavior they are exhibiting at school.
However, it is also possible that the older students are reporting less misbehavior because
the students who would have agreed with the item dropped out of school prior to the
administration of this survey. Balfanz (2009) found that 6% of their sample students
served one or more out of school suspensions in sixth grade, and that only 20% of those
students graduated within a five year period.
Indicator 5 (repeated a grade) was the other item where the percentage decreased
as grade level increased. More fourth grade students reported being retained when
compared to the other grades. It is possible that the fewer of the older students are
reporting grade retention because the students who would have agreed with the item
dropped out of school prior to the administration of this survey. Early grade retention is

40
one of the most powerful predictors of later school dropout (Jimerson et al., 2002;
Kennelly & Monrad, 2007). Students who repeat a grade are 40% to 50% more likely to
drop out than their promoted peers and students who are retained in two grades are 90%
more likely to drop out (Jimerson et al., 2002).
The data collected for indicator 6 (chosen to not work) showed that the highest
level of students in agreement with the item were in grades 8, 9, and 11. Previous studies
have found that high school dropouts often admit they were not inspired or motivated to
complete work (Bridgeland et al., 2006). The Chi-square analysis found that item 6
showed significant differences across grade levels; x2(4) = 14.3, p = 0.006. Ten percent of
fourth grade students reported they have often chosen not to do their school work
whereas 31.4% of eleventh graders admitted to the same. The percentage of students in
agreement increased as the grade level increased. It is possible that the older students
have more responsibility for completing work on their own and do not have someone
who routinely checks to make sure school work has been finished and turned in.
The data collected for indicator 7 (friends do not care) showed that the highest
level of students in agreement with the item were the upper grades: 8, 9, and 11. The
highest amount of students in agreement were in the eighth grade. This was followed by a
slight decrease in ninth and eleventh grades. Research shows that peers have the greatest
impact during adolescence (Rumberger, 2011). This is important to the study because the
older students were more likely to report having friends that did not care about school.
Studies have found that having friends who are interested in school reduces a student’s
odds of dropping out (Rumberger, 2011).

41
For the most part, item 8 (considered leaving school), increased with each grade
level, the exception being the decrease from fourth to sixth grade. This indicator was
more prevalent with the upper grades. This is most likely because students in the lower
grades are the furthest from the age in which they can legally dropout.
A higher percentage of students agreed with indicator 9 (not interested) in the
higher grades: 8, 9, and 11. Those students who are not interested in school often do not
see a reason to do things like complete their schoolwork, attend school regularly, get
passing grades, etc. Those items are other indicators of students at risk for dropping out.
The same is also true for item 10 (school is boring). Overall, compared to the other items,
indicator 10 also had the most students that agreed with the item; the percentages ranged
from 25.9 to 54.6 and increased with grade level. The Chi-square on item 10 showed
significant differences across grade levels; x2(4) = 12.7, p = 0.013. It is possible this is due
to instruction. Elementary age students tend to have daily instruction that is more
engaging. Students who think school is boring are at a greater risk for becoming
disengaged. Students who remain engaged in school are more likely to pay attention,
learn and ultimately graduate from high school (Rumberger, 2011).
The results for research question one, what is the trend, or differences, in the
frequency of student reported dropout indicators across grade levels, 4, 6, 8, 9, and 11,
indicated that percentages of agreement on most of the ten dropout indicators increase by
grade with some exceptions (e.g., repeated a grade and referrals). However, there was a
statistical difference found for only items 6 and 10. Students in the upper grades are more
likely to report having at least one dropout indicator than students in lower grades.

42
Research Question 2
A series of Chi-square analysis was used to determine which of the dropout
categories (academic or non-academic) was more prevalent across grade levels. The
analysis is used to test the association of academic versus non-academic dropout
indicators and grade levels; given a certain number of dropout indicators reported (0-5) in
each category. The analysis found no significant associations between grade level and
academic vs. non-academic dropout factors (ps > .05).
Overall, almost half or less than half of students in each grade reported they did
not have any of the ten indicators. The number of students that show no indicators
decreased as the grade level increased. This means that the upper grade students were
more likely to report having at least one dropout indicator. According to the Chi-square,
students are just as likely to report having academic indicators as non-academic factors.
Fewer students reported three dropout indicators in the lower grades, 4 and 6. It is
possible this is due to age. Younger students have had less years in school to accumulate
more indicators of dropout. Fewer students also reported four dropout indicators in the
lower grades, 4 and 6. The percentage of students reporting four indicators, academic and
non-academic, increased as the grade level increased. The most likely reason for this
trend is similar to the students reporting three dropout indicators; age (i.e., years spent in
school) and the higher prevalence of students that report leaving school for non-academic
reasons.
The percentage of students that reported having all five academic or non-
academic factors increased as grade level did. Compared to the other grades, more

43
eleventh grade students reported having all five indicators in both categories. This trend
is similar to the students that reported having three and four of the dropout indicators.
Implications
This thesis research found that students in the higher grades (8, 9, and 11) would
typically report more dropout indicators then the lower grades, 4 and 6, with some
exceptions (i.e., when only one indicator was present, fourth grade students reported
having more academic and non-academic factors than other grades). Knowing this
information could make it easier to target those students at risk for dropping out. Because
older students are more likely to report more indicators and therefore be at a greater risk
for dropping out of school, early identification and intervention would be most beneficial.
Overall, academic and non-academic factors were of equal importance for most of
the grades surveyed. However, ninth grade students were twice as likely to report non-
academic factors over academic. Students leaving high school give reasons for dropping
out such as a lack of motivation, boredom, or an overall lack of engagement in school;
almost all of which are included in this survey as non-academic factors of dropout
(Bridgeland et al., 2006).
Interventions with the younger students, grades 4 and 6, could focus more on the
academic indicators of dropout, whereas interventions with the older grades could focus
on the non-academic factors. The implementation of social/emotional interventions for
high school students, especially ninth graders, could be beneficial for helping to decrease
non-academic factors of dropout. For example, Goal-driven, Resilient, and Influential
Teens (GRIT) is a program within the kid-FRIENDLy grant. It is designed to engage
students and teachers in order to help students to become goal-driven, resilient and

44
influential members of society (kid-FRIENDLy, n.d.). However, the current study has
shown the importance to take both academic and non-academic factors into account.
The development of the dropout indicator items used in this survey involved an
extensive review of the current literature. The items were also pilot tested prior to the
survey being sent out to the large number of students participating in the kid-FRIENDLy
grant. The items would be beneficial for the future evaluation of dropout prevention
programs.
Limitations
One limitation of this thesis is that it is a cross sectional design, not longitudinal
in nature. A longitudinal design would allow for later follow-up with the same students to
determine who graduated on time and who dropped out. Another limitation of this study
is that it encompasses only one year of data instead of several years. Data collection from
added years would allow for more analyses and comparison of information. Also, the
survey data is collected by students self-reporting agreement or disagreement with the
items. Not only does this allow for errors on the student’s part, but there is no way to
check if students answered the questions honestly. Additionally, there is no control
group. The control group would be students attending schools that are not participating in
the kid-FRIENDLy grant. This would allow for comparison of the dropout indicators
between the kid-FRIENDLy and non-kid-FRIENDLy schools. Furthermore, the
indicators that were used for this survey were selected without statistical analysis, instead
they were selected based on the Rock Solid evaluation team’s clinical judgment. This is
also true for how the items were divided into the academic and non-academic categories.

45
Conclusion
As students continue through school, establishing their personalities and
identities, they experience an extensive assortment of issues that may influence their
choice to leave school. These factors, including failing classes, boredom, numerous
absences, retention in grades, and repeated transfers to other schools, vary according to
the age of the student, the grade in which the student is enrolled, and even the ethnicity
and gender of the student (Stearns & Glennie, 2006). The current dropout problem in the
United States can be improved, as long as student performance is thoroughly examined to
guarantee students are provided with the necessary academic skills, supported by their
families and the community, and are encouraged to see how important school and
learning is for their lives (Christenson & Thurlow, 2004).
This thesis added to the research that will help fill in the gap in the literature about
the trend in dropout indicators between various grade levels. The majority of the current
literature focuses on high school age students, even though early intervention with
students at-risk is the most beneficial (Christenson et al., 2001). Identifying those
students that are at-risk for leaving high school without earning a diploma is important
for being able to intervene early in their educational career. This study focused on those
indicators that can be changed by the student versus those factors that cannot be changed.
The results showed that students in the higher grades, 9 and 11, would typically report
more dropout indicators then the lower grades, 4, 6, and 8 (with some exceptions).
Overall, academic and non-academic factors were of equal importance for most of the
grades surveyed. Future research needs to determine how well the ten indicators that
were used can predict which students are at risk for dropping out of high school.

46
References
American Psychological Association. (2012). Facing the school dropout dilemma.
Washington, DC: Author. Retrieved from
http://www.apa.org/pi/families/resources/school-dropout-prevention.aspx
Bachman, J. G., Davidson, T. N., Green, S., & Wirtanen, I. D. (1971). Dropping out--
problem or symptom? Institute for Social Research, University of Michigan.
Balfanz, R. (2009). Putting middle grades students on the graduation path: A policy and
practice brief. Baltimore, MD: John Hopkins University for the National Middle
School Association.
Balfanz, R., Bridgeland, J. M., Moore, L. A., Fox, J. H. (2010). Building a grad nation.
Progress and Challenge in Ending the High School Dropout Epidemic.
Washington, DC: Civic Enterprises, LLC.
Balfanz, R., Herzog, L., & Mac Iver, D. J. (2007). Preventing student disengagement and
keeping students on the graduation path in urban middle-grades schools: Early
identification and effective interventions. Educational Psychologist, 42(4), 223-
235.
Bowers, A. J. (2010). Grades and graduation: A longitudinal risk perspective to identify
student dropouts. Journal of Educational Research, 103(3), 191-207.
Bowers, A. J., & Sprott, R., & Taff, S. A. (2013). Do we know who will drop out?: A
review of the predictors of dropping out of high school: Precision, sensitivity, and
specificity. The High School Journal, 96(2), 77-100.
Bridgeland, J.M., DiIulio, J.J., & Morison, K. B. (2006). The silent epidemic:
Perspectives of high school dropouts. Washington, DC: Civic Enterprises.

47
Christenson, S. L., Sinclair, M. F., Lehr, C. A., & Godber, Y. (2001). Promoting
successful school completion: Critical conceptual and methodological guidelines.
School Psychology Quarterly, 16(4), 468-484.
Christenson, S. L., & Thurlow, M. L. (2004). School dropouts prevention considerations,
interventions, and challenges. Current Directions in Psychological Science, 13(1),
36-39.
Christle, C. A., Jolivette, K., & Nelson, C. M. (2007). School characteristics related to
high school dropout rates. Remedial and Special education, 28(6), 325-339.
Deyé, S. (2011). A path to graduation for every child: State legislative roles and
responsibilities: A report of the NCSL Task Force on school dropout prevention
and recovery. Denver, CO: National Conference of State Legislatures. Retrieved
from http://www.ncsl.org/documents/educ/ncsldropouttaskforcereport.pdf.
Education Week. (2010). Diplomas count 2010: Graduation by the numbers: Putting
data to work for student success. Washington, DC: Education Week. Retrieved
from http://www.edweek.org/ew/toc/2010/06/10/index.html
Evans, I., & DiBenedetto, A. (1990). Pathways to school dropout: A conceptual model
for early prevention. Special Services in School, 6, 63–80.
Finn, J. D. (1989). Withdrawing from school. Review of Educational Research, 59(2),
117-142.
Gleason, P., & Dynarski, M. (2002). Do we know whom to serve? Issues in using risk
factors to identify dropouts. Journal of Education for Students Placed At Risk,
7(1), 25-41.

48
Goss, C. L., & Andren, K. J. (2014). Dropout prevention. New York, NY: Guilford
Publications.
Heckman, J. J., LaFontaine, P. A. (2010). The American high school graduation rate:
Trends and levels. Review of Economics and Statistics, 92(2), 244-262
Janosz, M., LeBlanc, M., Boulerice, B., & Tremblay, R. E. (1997). Disentangling the
weight of school dropout predictors: A test on two longitudinal samples. Journal
of Youth and Adolescence, 26(6), 733-762.
Jimerson, S. R., Anderson, G. E., & Whipple, A. D. (2002). Winning the battle and losing
the war: Examining the relation between grade retention and dropping out of high
school. Psychology in the Schools, 39(4), 441-457.
Jimerson, S., Egeland, B., Sroufe, L. A., & Carlson, B. (2000). A prospective longitudinal
study of high school dropouts examining multiple predictors across development.
Journal of School Psychology, 38(6), 525-549.
Jimerson, S. R., Reschly, A. L., & Hess, R. S. (2014). Best practices in decreasing
dropout and increasing high school completion. In P. Harrison & A. Thomas
(Eds.), Best practices in school psychology (pp. 83-96). Bethesda, MD: National
Association of School Psychologists
Kennelly, L., & Monrad, M. (2007). Approaches to dropout prevention: Heeding early
warning signs with appropriate interventions. Washington, DC: National High
School Center at the American Institutes for Research.
kid-FRIENDLy. (n.d.). Retrieved June 01, 2016, from http://kidfriendlyky.com/
Knesting, K. (2008). Students at risk for school dropout: Supporting their persistence.
Preventing School Failure: Alternative Education for Children and Youth, 52(4),

49
3-10.
Lee, T., Cornell, D., Gregory, A., & Fan, X. (2011). High suspension schools and dropout
rates for black and white students. Education and Treatment of Children, 34(2),
167-192.
Legters, N., & Balfanz, R. (2010). Do we have what it takes to put all students on the
graduation path? New directions for youth development, 127, 11-24.
Lehr, C. A., Hanson A., Sinclair M. F., & Christenson S. L. (2003). Moving beyond
dropout prevention towards school completion: An integrative review of data-
based interventions. School Psychology Review, 32, 342–364.
Northeastern University - Center for Labor Market Studies (2009). Left behind in
America: the nation’s dropout crisis. Center for Labor Market Studies
Publications. Paper 21. http://hdl.handle.net/2047/d20000598
National Research Council. (2011). High School Dropout, Graduation, and Completion
Rates: Better Data, Better Measures, Better Decisions. Washington, DC: The
National Academies Press.
Prevatt, F., & Kelly, F. D. (2003). Dropping out of school: A review of intervention
programs. Journal of School Psychology, 41(5), 377-395.
Reschly, A. L., Appleton, J. J., & Pohl, A. (2014). Best practices in fostering student
engagement. In P. Harrison & A. Thomas (Eds.), Best practices in school
psychology: Student-level services (pp. 37-50). Bethesda, MD: National
Association of School Psychologists.
Romero, M., & Lee, Y. S. (2007). A national portrait of chronic absenteeism in the early
grades. New York: National Center for Children in Poverty.

50
<www.nccp.org/publications/pub_771.html>
Rumberger, R. (1987). High school dropouts: A review of issues and evidence. Review of
Educational Research, 57, 101-121.
Rumberger, R. W. (2011). Dropping out: why students drop out of high school and what
can be done about it (1st ed.). Cambridge, MA: Harvard University Press.
Rumberger, R., and Lim, S. (2008). Why students drop out of school: A review of 25
years of research, California Dropout Research Project, Santa Barbara.
Rumberger, R.W., & Rotermund, S. (2012). The relationship between engagement and
high school dropout. In S. L. Christenson, A. L. Reschly, & C. Wylie (Eds). The
Handbook of research on student engagement (pp. 491-514). New York, NY:
Springer.
Schoeneberger, J. A. (2012). Longitudinal attendance patterns: Developing high school
dropouts. Clearing House, 85(1), 7-14
Stearns, E., & Glennie, E. J. (2006). When and why dropouts leave high school. Youth &
Society, 38(1), 29-57.
Suh, S., & Suh, J. (2007). Risk factors and levels of risk for high school dropouts.
Professional School Counseling, 10(3), 297-306.
Suh, S., & Suh, J. (2011). Changing pattern and process of high school dropouts between
1980s and 2000s. Educational Research Quarterly, 34(4), 3-13
Suhyun, S., Jingyo, S., & Houston, I. (2007). Predictors of categorical at-risk high school
dropouts. Journal of Counseling & Development, 85(2), 196-203.