Student Debt and the Class of 2010, Project on Student Debt at the Institute for College Access &...
16
November 2011 Student Debt November 2011 and the Class of 2010
-
Upload
statesman-journal -
Category
Documents
-
view
218 -
download
0
Transcript of Student Debt and the Class of 2010, Project on Student Debt at the Institute for College Access &...
8/3/2019 Student Debt and the Class of 2010, Project on Student Debt at the Institute for College Access & Success (TICAS)
http://slidepdf.com/reader/full/student-debt-and-the-class-of-2010-project-on-student-debt-at-the-institute 1/16
November 2011
Student Debt
November 2011
and the Class of 2010

8/3/2019 Student Debt and the Class of 2010, Project on Student Debt at the Institute for College Access & Success (TICAS)
http://slidepdf.com/reader/full/student-debt-and-the-class-of-2010-project-on-student-debt-at-the-institute 2/16The Project on Student Debt
November 2011
Student Debt and the Class of 2010 is our sixth annual report on the cumulative student loan debt of
recent graduates from four-year public and private nonprot colleges. Our analysis found that the debt levels
of students who graduate with loans continued to rise, with considerable variation among states as well as
among colleges.
We estimate that two-thirds of college seniors who graduated in 2010 had student loan debt, with an average of
$25,250 for those with debt, up ve percent from the previous year.1 The ve percent increase in average debt atthe national level is similar to the average annual increase over the past few years.
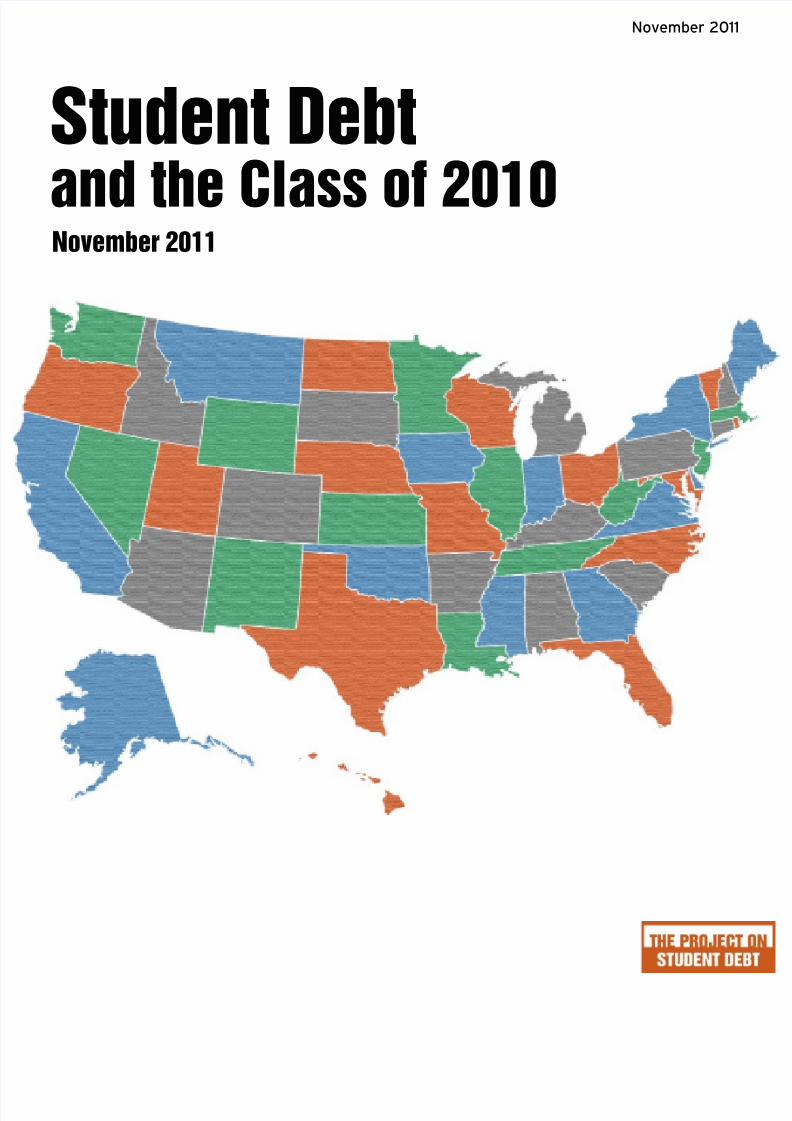
State averages for debt at graduation from four-year colleges ranged widely in 2010, from $15,500 to $31,050.
High-debt states are concentrated in the Northeast and Midwest, while low-debt states are mainly in the West.
Average debt continues to vary even more at the campus level than at the state level, from $950 to $55,250.
Colleges with higher costs tend to have higher average debt, but there are many examples of high-cost colleges
with low average debt, and vice versa.
In the current economic climate, recent college graduates who borrowed for their education face particular
challenges in paying back their student loans. The unemployment rate for young college graduates rose from
8.7 percent in 2009 to 9.1 percent in 2010, the highest annual rate on record. However, the unemployment rate
for young college graduates continues to be much lower than that for young high school graduates. The averageunemployment rate for 20- to 24-year-olds with only a high school education was 20.4% in 2010.2
Many factors inuence student debt levels for each graduating class and the rate of increase over time, such as
changes in college costs, family resources, and need-based grant aid. Most students in the Class of 2010 started
college before the recent economic downturn, but the economy soured while they were still in school, widening
the gap between rising college costs and what students and their parents could afford. State budget cuts led to
sharp tuition increases at some public colleges, also increasing the need to borrow. On the other hand, federal
grant aid increased while the Class of 2010 was in college, with an especially large increase in 2009-10. State
and institutional grant aid also rose, with many colleges taking steps to increase or maintain need-based grant aid
when the economy faltered, so that students could afford to stay in school.3 These increases in grant aid may have
helped mitigate the other factors, keeping student debt from growing faster than it has in recent years.
Given the growing enrollment in and attention to for-prot colleges in recent years, it is important to note that this
report reects only graduates of public and private nonprot four-year colleges because so few for-prot colleges
report the necessary student debt data. However, based on national surveys conducted by the U.S. Department of
Education, we know that on average, graduates of for-prot four-year colleges are much more likely to borrow
student loans and borrow signicantly more than their counterparts at public and private nonprot colleges. For
more information, see page 8.
A companion interactive map with details for all 50 states, the District of Columbia, and more than 1,000
public and private nonprot four-year colleges is available at http://projectonstudentdebt.org/state_by_
state-data.php.
1 These gures reect the percentage of 2009-10 bachelor’s degree recipients with student loan debt at public and private nonprot four-year colleges and the
average cumulative debt level for those with loans. See the Where the Numbers Come From and How We Use Them section for more information. All dollar
gures in this report are given in current or nominal dollars, not adjusted for infation. Adjusting for ination, average cumulative debt increased four percent
between 2008-09 and 2009-10.2 These annual unemployment gures are from unpublished data from the Current Population Survey (CPS), provided by the Bureau of Labor Statistics
(BLS) in response to personal communications in August 2010 and April 2011. The gures apply to those in the civilian non-institutional population who are
aged 20 to 24 and are actively seeking work. The unemployment rate measures the proportion of that population who are not working.3 For data on federal, state, and institutional grant aid to undergraduates over time, see College Board. 2011. Trends in Student Aid 2011. Table 2a. http://
trends.collegeboard.org/student_aid/report_ndings/indicator/301#f913 . Accessed October 28, 2011.
1

8/3/2019 Student Debt and the Class of 2010, Project on Student Debt at the Institute for College Access & Success (TICAS)
http://slidepdf.com/reader/full/student-debt-and-the-class-of-2010-project-on-student-debt-at-the-institute 3/16
The Project on Student Debt
Student Debt and the Class of 2010
Student Debt Highs and Lows, by State
The statewide average debt levels for the Class of 2010 vary widely among the states, but most of the same states
appear at the high and low ends of the spectrum as in previous years.4 We base state averages on the best available
college-level data, which were reported voluntarily by 1,067 public and private nonprot four-year colleges for
the Class of 2010.5 For more information on our methodology, see the Where the Numbers Come From and How
We Use Them section.
The following tables show the states with the highest and lowest average debt levels for the Class of 2010.
States in the Northeast and Midwest are disproportionately represented among the “high debt” states, while those
in the West are disproportionately represented among the “low debt” states.6 This may be related to the fact that a
larger than average share of students in the Northeast and Midwest attend private nonprot four-year colleges. In
comparison, Western states have a larger share of students attending public four-year colleges.7
In general, private nonprot colleges have higher costs than public ones, and higher average costs at the state or
college level are associated with higher average debt. However, there are many colleges with high costs and low
debt, and vice versa. Multiple factors inuence average debt levels at a college, such as endowment resources
available for nancial aid, student demographics, state policies, institutional nancial aid packaging policies,
and the cost of living in the local area. For more about debt at the college level, see the Student Debt at Colleges
section on page 4.
4 The state averages and rankings in this report are not directly comparable to those in previous years’ reports due to changes in which colleges in each state
report data each year, corrections to the underlying data submitted by colleges, and changes in methodology. To compare state averages over time based on
the current data and methodology, please visit College InSight, http://College-InSight.o rg.5 The institutional debt data used in this report are provided voluntarily by colleges in response to questions that are part of the Common Data Set (CDS),
http:// www.commondataset.org. The Project on Student Debt’s parent organization, the Institute for College Access & Success, licenses these data through
an agreement with Peterson’s, a publisher of college guides. The data are copyright 2011 Peterson’s, a Nelnet company. All rights reserved.6 These regions are as dened in: U.S. Census Bureau. Census regions and divisions with State FIPS Codes. http://www.census.gov/geo/www/us_regdiv.pdf .
Accessed October 14, 2011.7 Based on calculations by the Project on Student Debt on student charges and 12-month unduplicated undergraduate enrollment during the 2009-10 year
from the U.S. Department of Education, Integrated Postsecondary Education Data System (IPEDS).
High Debt States
New Hampshire $31,048
Maine $29,983
Iowa $29,598
Minnesota $29,058
Pennsylvania $28,599
Vermont $28,391
Ohio $27,713
Indiana $27,001
Rhode Island $26,340
New York $26,271
Low Debt States
Utah $15,509
Hawaii $15,550
New Mexico $16,399
Nevada $16,622
California $18,113
Arizona $18,454
Georgia $18,888
Kentucky $19,375
Tennessee $19,957
Wyoming $20,571
2

8/3/2019 Student Debt and the Class of 2010, Project on Student Debt at the Institute for College Access & Success (TICAS)
http://slidepdf.com/reader/full/student-debt-and-the-class-of-2010-project-on-student-debt-at-the-institute 4/16The Project on Student Debt
November 2011
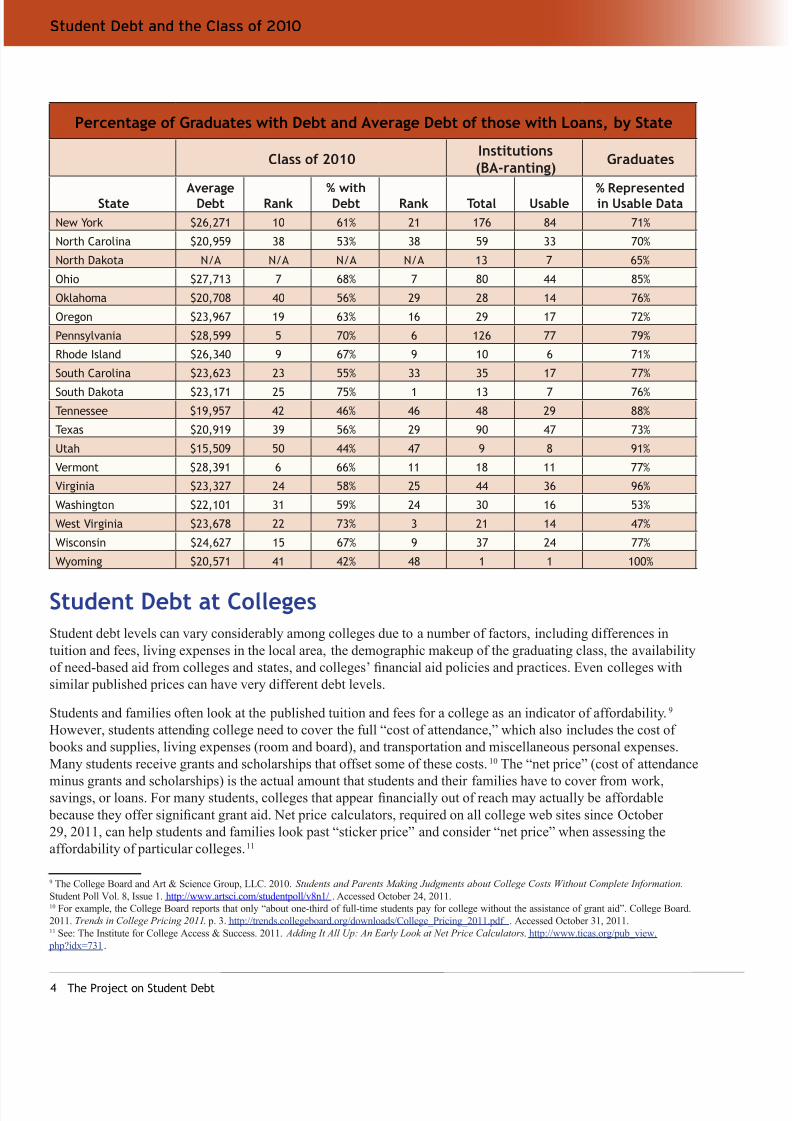
The following table shows each state’s average debt and proportion of students borrowing for graduates in the
Class of 2010, along with information about the amount of usable data actually available for each state.8
8 In order for their data to be considered usable for calculating state averages, colleges had to report both the percent of graduating students with loans and
their average debt, and report granting bachelor’s degrees during the 2009-10 year. As shown in the table for North Dakota, we did not calculate state aver -
ages when the usable cases with student debt data cover less than 30% of the state’s bachelor’s degree recipients in the Class of 2010, or when the underlying
data for that state showed a change of 30% or more in average debt from the previous year. Such large year-to-year swings likely reect different institutions
reporting each year, reporting errors, or changes in methodology by institutions reporting the data, rather than actual changes in debt levels.
Percentage of Graduates with Debt and Average Debt of those with Loans, by State
Class of 2010
Institutions
(BA-Granting) Graduates
StateAverage
Debt Rank% withDebt Rank Total Usable
% Representedin Usable Data
Alabama $24,821 14 56% 29 33 16 68%
Alaska $22,717 27 50% 40 4 4 100%
Arizona $18,454 45 47% 45 11 6 99%
Arkansas $21,408 35 57% 27 23 10 59%
California $18,113 46 48% 43 127 73 85%
Colorado $22,017 32 55% 33 22 16 86%
Connecticut $25,360 13 61% 21 23 14 88%
Delaware $21,500 34 50% 40 6 3 72%District of Columbia $24,191 17 54% 36 9 7 90%
Florida $21,184 37 49% 42 75 29 85%
Georgia $18,888 44 55% 33 53 30 85%
Hawaii $15,550 49 38% 50 7 2 64%
Idaho $24,178 18 66% 11 9 3 43%
Illinois $23,885 20 62% 18 76 43 75%
Indiana $27,001 8 62% 18 50 35 91%
Iowa $29,598 3 72% 4 35 24 93%
Kansas $22,280 29 57% 27 29 11 68%
Kentucky $19,375 43 58% 25 32 23 96%
Louisiana $24,548 16 48% 43 26 11 64%
Maine $29,983 2 68% 7 19 10 74%
Maryland $21,750 33 54% 36 34 17 67%
Massachusetts $25,541 12 63% 16 81 48 75%
Michigan $25,675 11 60% 23 58 32 87%
Minnesota $29,058 4 71% 5 38 27 81%
Mississippi $22,142 30 52% 39 17 6 70%
Missouri $22,601 28 65% 14 54 22 70%
Montana $22,768 26 65% 14 10 7 93%
Nebraska $21,227 36 62% 18 24 11 58%
Nevada $16,622 47 39% 49 8 3 94%New Hampshire $31,048 1 74% 2 16 9 76%
New Jersey $23,792 21 66% 11 37 19 73%
New Mexico $16,399 48 56% 29 10 4 40%
3
8/3/2019 Student Debt and the Class of 2010, Project on Student Debt at the Institute for College Access & Success (TICAS)
http://slidepdf.com/reader/full/student-debt-and-the-class-of-2010-project-on-student-debt-at-the-institute 5/16
The Project on Student Debt
Student Debt and the Class of 2010
Percentage of Graduates with Debt and Average Debt of those with Loans, by State
Class of 2010Institutions(BA-ranting)
Graduates
StateAverage
Debt Rank% withDebt Rank Total Usable
% Representedin Usable Data
New York $26,271 10 61% 21 176 84 71%
North Carolina $20,959 38 53% 38 59 33 70%
North Dakota N/A N/A N/A N/A 13 7 65%
Ohio $27,713 7 68% 7 80 44 85%
Oklahoma $20,708 40 56% 29 28 14 76%
Oregon $23,967 19 63% 16 29 17 72%
Pennsylvania $28,599 5 70% 6 126 77 79%
Rhode Island $26,340 9 67% 9 10 6 71%
South Carolina $23,623 23 55% 33 35 17 77%
South Dakota $23,171 25 75% 1 13 7 76%Tennessee $19,957 42 46% 46 48 29 88%
Texas $20,919 39 56% 29 90 47 73%
Utah $15,509 50 44% 47 9 8 91%
Vermont $28,391 6 66% 11 18 11 77%
Virginia $23,327 24 58% 25 44 36 96%
Washington $22,101 31 59% 24 30 16 53%
West Virginia $23,678 22 73% 3 21 14 47%
Wisconsin $24,627 15 67% 9 37 24 77%
Wyoming $20,571 41 42% 48 1 1 100%
Student Debt at Colleges
Student debt levels can vary considerably among colleges due to a number of factors, including differences in
tuition and fees, living expenses in the local area, the demographic makeup of the graduating class, the availability
of need-based aid from colleges and states, and colleges’ nancial aid policies and practices. Even colleges with
similar published prices can have very different debt levels.
Students and families often look at the published tuition and fees for a college as an indicator of affordability.9
However, students attending college need to cover the full “cost of attendance,” which also includes the cost of
books and supplies, living expenses (room and board), and transportation and miscellaneous personal expenses.
Many students receive grants and scholarships that offset some of these costs.10 The “net price” (cost of attendance
minus grants and scholarships) is the actual amount that students and their families have to cover from work,savings, or loans. For many students, colleges that appear nancially out of reach may actually be affordable
because they offer signicant grant aid. Net price calculators, required on all college web sites since October
29, 2011, can help students and families look past “sticker price” and consider “net price” when assessing the
affordability of particular colleges.11
9 The College Board and Art & Science Group, LLC. 2010. Students and Parents Making Judgments about College Costs Without Complete Information.
Student Poll Vol. 8, Issue 1. http://www.artsci.com/studentpoll/v8n1/ . Accessed October 24, 2011.10 For example, the College Board reports that only “about one-third of full-time students pay for college without the assistance of grant aid”. College Board.
2011. Trends in College Pricing 2011. p. 3. http://trends.collegeboard.org/downloads/College_Pricing_2011.pdf . Accessed October 31, 2011.11 See: The Institute for College Access & Success. 2011. Adding It All Up: An Early Look at Net Price Calculators . http://www.ticas.org/pub_view.
php?idx=731.
4

8/3/2019 Student Debt and the Class of 2010, Project on Student Debt at the Institute for College Access & Success (TICAS)
http://slidepdf.com/reader/full/student-debt-and-the-class-of-2010-project-on-student-debt-at-the-institute 6/16The Project on Student Debt
November 2011
At some selective private nonprot colleges, the “net price” for low- and moderate-income students can be lower
than at many public colleges due to nancial aid packaging policies and considerable resources for need-based
aid from endowments and fundraising. This in turn contributes to relatively low average debt at graduation. At
some schools the small share of students with low and moderate incomes may also contribute to low student debt
levels. For example, four colleges with no-loan or reduced-loan nancial aid policies for low- and middle-income
students are notable for charging over $30,000 for tuition and fees in 2009-10 but graduating bachelor’s degree
recipients with, on average, less than $10,000 in student loans. These schools are Pomona College, PrincetonUniversity, Williams College, and Yale University.12
Other factors can affect the way that colleges report the debt gures used in this analysis. There are differences
in how colleges interpret the relevant survey questions and calculate their average debt gures, despite attempts
to provide clear denitions and instructions.13 There are also colleges that do not report these gures at all or fail
to update them. Of the 1,923 public and private nonprot four-year colleges in the U.S. that granted bachelor’s
degrees during the 2009-10 year, 1,067 – just 55 percent – reported gures for both average debt and percent with
debt. Some colleges choose not to respond to the survey used to collect these data, or choose not to respond to the
student debt questions.14
There is great variation from college to college, with average debt gures from $950 to $55,250 among the 1,067
colleges with usable data. At the high end, 98 colleges reported average debt of more than $35,000. The shareof students with loans also varies widely. Among all colleges with usable data, the percentage of graduates with
debt ranges from two to 100 percent. Seventy-three colleges reported more than 90 percent of the Class of 2010
graduating with debt.
Our analysis suggests that the available campus-level data are not reliable enough to rank individual colleges with
especially high or low debt levels. However, we have identied colleges with reported debt levels that fall into
high or low ranges relative to the levels reported by all institutions. These lists illuminate the high and low ends of
the spectrum for colleges reporting student debt data.15
For public and private nonprot four-year colleges, campus-level data on student debt, enrollment, costs,
and the percentage of students receiving Pell Grants are available through an interactive map at http://
projectonstudentdebt.or g/state_by_state-data.php. These and additional data related to affordability, diversity, andsuccess are also available online at http://College-InSight.org, where users can compare data over several years
and for states, sectors, individual colleges, and the nation as a whole.
12 For more information about Financial Aid Pledges, please visit our website, http://www.projectonstudentdebt.o rg/pledges.
13 The survey instructions and other information on our data source can be found in the Where the Numbers Come From and How We Use Them section.14 Differences in the identiers used for colleges and the way campuses are grouped in different surveys also limit the number of colleges with usable data.15 These lists present the 20 colleges at the top and bottom of the spectrum in terms of the average debt of borrowers. Only colleges that reported both
average debt and percent with debt for the Class of 2010 and had at least 100 bachelor’s degree recipients in 2009-10 are included on these lists. We excluded
colleges for which our analysis raised serious questions about the accuracy of the data, as well as colleges that informed us that they intend to correct their
debt gures with Peterson’s.
5
8/3/2019 Student Debt and the Class of 2010, Project on Student Debt at the Institute for College Access & Success (TICAS)
http://slidepdf.com/reader/full/student-debt-and-the-class-of-2010-project-on-student-debt-at-the-institute 7/16
The Project on Student Debt
Student Debt and the Class of 2010
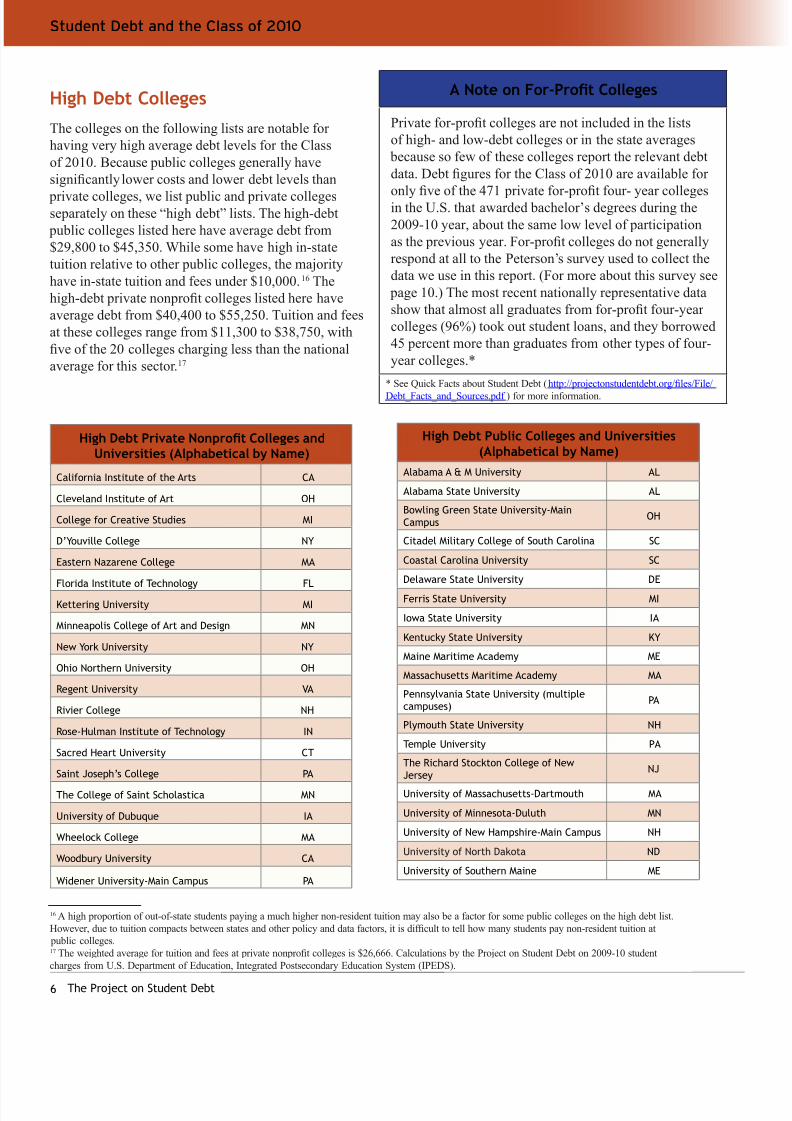
A Note on For-Proft Colleges
Private for-prot colleges are not included in the lists
of high- and low-debt colleges or in the state averages
because so few of these colleges report the relevant debt
data. Debt gures for the Class of 2010 are available for
only ve of the 471 private for-prot four- year collegesin the U.S. that awarded bachelor’s degrees during the
2009-10 year, about the same low level of participation
as the previous year. For-prot colleges do not generally
respond at all to the Peterson’s survey used to collect the
data we use in this report. (For more about this survey see
page 10.) The most recent nationally representative data
show that almost all graduates from for-prot four-year
colleges (96%) took out student loans, and they borrowed
45 percent more than graduates from other types of four-
year colleges.*
* See Quick Facts about Student Debt (http://projectonstudentdebt.org/les/File/
Debt_Facts_and_Sources.pdf ) for more information.
High Debt Public Colleges and Universities(Alphabetical by Name)
Alabama A & M University AL
Alabama State University AL
Bowling Green State University-MainCampus
OH
Citadel Military College of South Carolina SC
Coastal Carolina University SC
Delaware State University DE
Ferris State University MI
Iowa State University IA
Kentucky State University KY
Maine Maritime Academy ME
Massachusetts Maritime Academy MA
Pennsylvania State University (multiplecampuses)
PA
Plymouth State University NH
Temple University PA
The Richard Stockton College of NewJersey
NJ
University of Massachusetts-Dartmouth MA
University of Minnesota-Duluth MN
University of New Hampshire-Main Campus NH
University of North Dakota ND
University of Southern Maine ME
High Debt Private Nonproft Colleges andUniversities (Alphabetical by Name)
California Institute of the Arts CA
Cleveland Institute of Art OH
College for Creative Studies MI
D’Youville College NY
Eastern Nazarene College MA
Florida Institute of Technology FL
Kettering University MI
Minneapolis College of Art and Design MN
New York University NY
Ohio Northern University OH
Regent University VA
Rivier College NH
Rose-Hulman Institute of Technology IN
Sacred Heart University CT
Saint Joseph’s College PA
The College of Saint Scholastica MN
University of Dubuque IA
Wheelock College MA
Woodbury University CA
Widener University-Main Campus PA
High Debt Colleges
The colleges on the following lists are notable for
having very high average debt levels for the Class
of 2010. Because public colleges generally have
signicantly lower costs and lower debt levels than
private colleges, we list public and private collegesseparately on these “high debt” lists. The high-debt
public colleges listed here have average debt from
$29,800 to $45,350. While some have high in-state
tuition relative to other public colleges, the majority
have in-state tuition and fees under $10,000.16 The
high-debt private nonprot colleges listed here have
average debt from $40,400 to $55,250. Tuition and fees
at these colleges range from $11,300 to $38,750, with
ve of the 20 colleges charging less than the national
average for this sector.17
16 A high proportion of out-of-state students paying a much higher non-resident tuition may also be a factor for some public colleges on the high debt list.
However, due to tuition compacts between states and other policy and data factors, it is difcult to tell how many students pay non-resident tuition at
public colleges.17 The weighted average for tuition and fees at private nonprot colleges is $26,666. Calculations by the Project on Student Debt on 2009-10 student
charges from U.S. Department of Education, Integrated Postsecondary Education System (IPEDS).
6

8/3/2019 Student Debt and the Class of 2010, Project on Student Debt at the Institute for College Access & Success (TICAS)
http://slidepdf.com/reader/full/student-debt-and-the-class-of-2010-project-on-student-debt-at-the-institute 8/16The Project on Student Debt
November 2011
Low Debt Colleges and Universities (Alphabetical by Name)
Augusta State University GA Public
Berea College KY Private nonprot
California State University-Bakerseld CA Public
Cameron University OK Public
College of the Ozarks MO Private nonprot
Coppin State University MD Public
CUNY College of Staten Island NY Public
CUNY Hunter College NY Public
Elizabeth City State University NC Public
Governors State University IL Public
Kennesaw State University GA Public
Lamar University TX Public
Mount Carmel College of Nursing OH Private nonprot
Princeton University NJ Private nonprot
Texas Southern University TX Public
The Baptist College of Florida FL Private nonprot
University of Alaska Southeast AK Public
University of Houston-Clear Lake TX Public
Western New Mexico University NM Public
Williams College MA Private nonprot
Low Debt Colleges
The colleges on the following list are notable for having low debt levels for the Class of 2010, with reported average debt
between $950 and $8,700. Some of these colleges are low-tuition public colleges, but a few have tuition and fees over
$10,000. Some are highly selective national universities and liberal arts colleges with fairly large endowments, which tend
to enroll fewer students who need loans to pay for college and often give generous grant aid to lower income students.
Berea College and the College of the Ozarks are “work colleges,” where all students work instead of paying tuition.However, students at these colleges may still need to borrow to cover the rest of the cost of attendance. (See page 4 for a
discussion of the full cost of attendance.)
7
8/3/2019 Student Debt and the Class of 2010, Project on Student Debt at the Institute for College Access & Success (TICAS)
http://slidepdf.com/reader/full/student-debt-and-the-class-of-2010-project-on-student-debt-at-the-institute 9/16
The Project on Student Debt
Student Debt and the Class of 2010
Private (Non-federal) Loans
Private student loans are one of the riskiest ways to pay for college. The majority of these non-federal loans are
made to students by private banks and lenders.18 No more a form of nancial aid than a credit card, private student
loans typically have uncapped variable interest rates that are highest for those who can least afford them. Even
when xed rates are offered, private loans lack the basic consumer protections and exible repayment options of
federal student loans, such as unemployment deferment, income-based repayment, and loan forgiveness programs.
The most recent available national data indicate that 33 percent of bachelor’s degree recipients graduated with
private loans, with an average private loan amount of $12,550.19 However, there is great variation in private loan
borrowing among different types of institutions. Students graduating from private for-prot colleges are the most
likely to have taken out private loans, with 64 percent of their seniors graduating with private loans.20
Although private loans are not reported separately in the data used for this report, colleges are asked about both
federal loan borrowing and overall borrowing. These gures suggest that at least 22 percent of all student debt for
the Class of 2010 at public and private nonprot four-year colleges was composed of private loans.21 However,
the proportion of this debt that is from private loans varies greatly across individual colleges. The composition of
student debt can signicantly affect borrowers’ ability to repay their loans, as private loans typically have much
higher costs and provide little, if any, relief for struggling borrowers.
At some colleges with high borrowing rates and high average debt, a large proportion of their graduates’ debt
comes from private loans, but this is not always the case. For example, seven of the 40 colleges noted earlier for
high debt have more than 50 percent of that debt from private loans and are included on the list on the right.22
However, at four of the 40 colleges on the high-debt list, less than 20 percent of student debt is from private loans.
The four-year colleges on the following list (see page 9) are notable for both high overall borrowing and a
high share of debt from private loans. At these schools, the majority of the Class of 2010 borrowed, those who
borrowed had average debt above the national average, and the majority of the debt was composed of private
loans.23
18 Some states and colleges offer non-federal student loans as well. While some state and college loan programs may have certain features that are similar to
or rival federal student loans, such as relatively low xed interested rates, the fact that the loan comes from a state agency or directly from the college does
not guarantee its affordability or consumer friendliness.19 Calculations by the Project on Student Debt on data from the 2008 National Postsecondary Student Aid Study (NPSAS). Figures reect the cumulative
private (non-federal) loan debt of bachelor’s degree recipients who were U.S. citizens or permanent residents and graduated from a public, private nonprot,
or private for-prot four-year postsecondary institution during the 2007-08 academic year.20 Ibid .21 Note that the data used here and throughout this report includes only student loans and does not include federal Parent PLUS loans, which parents of
dependent undergraduates can use to cover any college costs not already covered by other aid.22 Three other colleges noted earlier for high debt may have more than 50 percent of that debt from private loans, but they are excluded from the list in this
section because our analysis raised questions about the reliability of the data.23 This list includes the 14 colleges where more than 50% of graduating seniors had student loans, the average debt for those with loans was greater than the
national average of $25,250, and the proportion of debt from non-federal loans was greater than 50%. Only colleges that reported the average debt, percent
with debt, average federal debt and percent with federal debt for the Class of 2010 and had at least 100 bachelor’s degree recipients in 2009-10 are included
on these lists. We excluded colleges for which our analysis raised serious questions about the accuracy of the data, as well as colleges that informed us that
they intend to correct their debt gures with Peterson’s.
8

8/3/2019 Student Debt and the Class of 2010, Project on Student Debt at the Institute for College Access & Success (TICAS)
http://slidepdf.com/reader/full/student-debt-and-the-class-of-2010-project-on-student-debt-at-the-institute 10/16The Project on Student Debt
November 2011
While there is broad consensus that private student loans should be used only as a last resort, the majority of
undergraduates who take out risky private loans have not used the maximum available in safer federal student
loans.24 Our recent report, Critical Choices: How Colleges Can Help Students and Families Make Better
Decisions about Private Loans, shows that college nancial aid ofces can and should play a signicant role in
reducing their students’ reliance on private loans.25 Drawing on interviews with nancial aid administrators at
more than 20 colleges of varied types, sizes, and locations, we found both promising and problematic practices.
The most promising practices involve some form of counseling for students when they apply for privateloans, particularly those who have untapped federal loan eligibility. Such counseling helps address widespread
misunderstandings about federal and private student loans and the differences between them.26 At schools that
tracked their policy’s impact, about half of students contacted changed their borrowing plans. The problematic
college practices identied in the report involve bypassing such counseling opportunities or including private
loans in the initial nancial aid package, giving the school’s tacit approval of this risky form of nancing. These
types of differences in college policies and practices can be an important factor in the differences in private loan
usage, even among otherwise similar colleges.
24 Project on Student Debt. 2011. Private Loans: Facts and Trends. http://projectonstudentdebt.org/les/pub/private_loan_facts_trends.pdf . In this analysis,
the term “private student loan” refers to non-federal loans from banks and lenders.25 Project on Student Debt. 2011. Critical Choices: How Colleges Can Help Students and Families Make Better Decisions about Private Loans. http://
projectonstudentdebt.org/pub_view.php?idx=766 .26 Barnard College, Mount Holyoke College, Grinnell College, San Diego State University, Colorado State University, Loyola University New Orleans, the
University of California-Berkeley, Syracuse University, and Stanford University are all noted in the report for promising practices involving counseling for
private loan applicants.
Colleges and Universities with High Debt and a Majority of the Debt from Private Loans(Alphabetical by Name)
Anna Maria College MA Private nonprot
California Institute of the Arts CA Private nonprot
Eastern Nazarene College MA Private nonprot
Grove City College* PA Private nonprot
Kettering University MI Private nonprot
Occidental College CA Private nonprot
Ohio Northern University OH Private nonprot
Rensselaer Polytechnic Institute NY Private nonprot
Rivier College NH Private nonprot
Rose-Hulman Institute of Technology IN Private nonprot
Saint Anselm College NH Private nonprot
Saint Joseph’s University PA Private nonprot
Saint Mary-of-the-Woods College IN Private nonprot
University of Alaska Fairbanks AK Public
*Grove City College does not participate in federal aid programs, so students who need to borrow only have private loan options.
9

8/3/2019 Student Debt and the Class of 2010, Project on Student Debt at the Institute for College Access & Success (TICAS)
http://slidepdf.com/reader/full/student-debt-and-the-class-of-2010-project-on-student-debt-at-the-institute 11/16
The Project on Student Debt
Student Debt and the Class of 2010
Where the Numbers Come From and How We Use Them
Several organizations conduct annual surveys of colleges that include questions about student loan debt, including
U.S. News & World Report , Peterson’s (publisher of its own college guides), and the College Board. To make the
process easier for colleges, these organizations use questions from a shared survey instrument, called the Common
Data Set. Despite the name “Common Data Set,” there is no actual repository or “set” of data. Each surveyor
conducts, follows up, and reviews the results of its own survey independently. For this analysis we licensed and
used the data from Peterson’s.27 Below is the section of the Common Data Set 2010-11 used to collect student debt
data for the Class of 2010:
Note: These are the graduates and loan types to include and exclude in order to ll out CDS H4, H4a, H5 and H5a.
Include:
* 2010 undergraduate class who graduated between July 1, 2009 and June 30, 2010 who started at
your institution as rst-time students and received a bachelor’s degree between July 1, 2009 and
June 30, 2010.
* only loans made to students who borrowed while enrolled at your institution.
* co-signed loans.
Exclude:
* those who transferred in.
* money borrowed at other institutions.
H4. Provide the percentage of the class (dened above) who borrowed at any time through any loan programs
(institutional, state, Federal Perkins, Federal Stafford Subsidized and Unsubsidized, private loans that were certied
by your institution, etc.; exclude parent loans). Include both Federal Direct Student Loans and Federal Family
Education Loans.
________%
H4a. Provide the percentage of the class (dened above) who borrowed at any time through federal loan programs-
-Federal Perkins, Federal Stafford Subsidized and Unsubsidized. Include both Federal Direct Student Loans and
Federal Family Education Loans. NOTE: exclude all institutional, state, private alternative loans and parent loans.
_____%
H5. Report the average per-undergraduate-borrower cumulative principal borrowed of those in line H4.
$____________
H5a. Report the average per-undergraduate-borrower cumulative principal borrowed, of those in H4a, through
federal loan programs--Federal Perkins, Federal Stafford Subsidized and Unsubsidized. Include both Federal Direct
Student Loans and Federal Family Education Loans. These are listed in line H4a. NOTE: exclude all institutional,
state, private alternative loans and exclude parent loans.$ _______________ 28
We calculated per capita debt—the average debt across all graduates whether they borrowed or not—by
multiplying the percent with debt (H4) by the average debt (H5); per capita federal debt by multiplying the percent
with federal debt (H4a) by the average federal debt (H5a); and per capita non-federal debt by subtracting per
capita federal debt from per capita debt. The proportion of debt that is non-federal is calculated as the per capita
non-federal debt divided by the per capita debt.
27 Peterson’s Undergraduate Financial Aid and Undergraduate Databases, copyright 2011 Peterson’s, a Nelnet company. All rights reserved.28 Common Data Set Initiative. Common Data Set 2010-11. http://www.commondataset.org. Accessed October 28, 2011..
10

8/3/2019 Student Debt and the Class of 2010, Project on Student Debt at the Institute for College Access & Success (TICAS)
http://slidepdf.com/reader/full/student-debt-and-the-class-of-2010-project-on-student-debt-at-the-institute 12/16The Project on Student Debt
November 2011
Our state-level gures and the lists of high- and low-debt colleges are based on the 1,067 colleges that answered
both overall debt questions (H4 and H5 in the above CDS excerpt) for the Class of 2010, and reported granting
bachelor’s degrees in the Integrated Postsecondary Education Data System (IPEDS), a set of federal surveys on
higher education. These colleges represent 55 percent of all public and private nonprot four-year colleges that
granted bachelor’s degrees and 78 percent of all bachelor ’s degree recipients in these sectors in 2009-10.29 Around
two-thirds (63%) are private nonprot colleges, which is similar to the ratio found among all colleges.
In this report, the term “colleges” refers to public four-year and private nonprot four-year institutions of higher
education that granted bachelor’s degrees during the 2009-10 year and are located in the 50 states plus the District
of Columbia.
Estimating National Averages
The most comprehensive and reliable source of nancial aid data at the national level, the National Postsecondary
Student Aid Study (NPSAS), consistently shows higher student debt than national estimates derived from data
that some colleges voluntarily report to Peterson’s. For example, the most recent NPSAS showed average debt for
the Class of 2008 that exceeded the average based on Peterson’s data for the same year by about $1,550. NPSAS
is only conducted by the U.S. Department of Education every four years, does not provide representative data
for all states, and provides no data for individual colleges.30 Therefore, in years when NPSAS is not conducted,
we estimate the national average student debt upon graduation by using the change in the national average from
Peterson’s to update the most recent NPSAS gure. The college-level data from Peterson’s show an increase in
average debt of eleven percent over two years between borrowers in the Class of 2008 and the Class of 2010, from
$21,200 to $23,600. NPSAS data show that bachelor’s degree recipients at public and private nonprot four-year
colleges who graduated with loans in the Class of 2008 had an average of $22,750 in debt. Applying an eleven
percent increase to $22,750, we estimate that the actual student debt for the Class of 2010 is $25,250.
NPSAS data also show that about two-thirds (65%) of bachelor’s degree recipients at public and private nonprot
four-year colleges graduated with loans in the Class of 2008. The CDS data show no increase in the overall
percentage of bachelor’s degree recipients graduating with loans between the Class of 2008 and the Class of 2010.
Therefore, we estimate that two-thirds of the Class of 2010 graduated with loans.
Data Limitations
There are several reasons why CDS data provide an incomplete picture of the debt levels of graduating seniors.
Although the CDS questions ask colleges to report cumulative debt from both federal and private (non-federal)
student loans, colleges may not be aware of all the private loans their students carry. The CDS questions also
instruct colleges to exclude transfer students and the debt those students carried in. In addition, since the survey
is voluntary and not audited, colleges may actually have a disincentive for honest and full reporting. Colleges that
accurately calculate and report each year ’s debt gures rightfully complain that other colleges may have students
with higher average debt but fail to update their gures, under-report actual debt levels, or never report gures at
all. Additionally, very few for-prot colleges report debt data through CDS, and national data show that borrowing
levels at for-prot colleges are, on average, much higher than borrowing levels at other types of colleges. See page6 for more about for-prot colleges.
29 Out of the 2,287 public four-year and private nonprot four-year colleges in the federal Integrated Postsecondary Education Data System (IPEDS) for
2009-10, 1,923 granted bachelor’s degrees during the 2009-10 year, with 1,554,686 bachelor’s degree recipients in the Class of 2010. The 1,067 colleges
included in our calculations have a total of 1,215,503 bachelor’s degree recipients in the Class of 2010. Of the 1,923 colleges in IPEDS that awarded
bachelor’s degrees, 512 were not found in the Peterson’s dataset, because the IPEDS institution identier was missing or incorrect in the Peterson’s dataset.
Another 344 institutions were in the Peterson’s dataset, but did not report gures for both overall debt questions for the Class of 2010.30 NPSAS uses multiple sources (student-level data obtained by colleges, the National Student Loan Data System, and student surveys), allowing it to better
account for all types of loans and avoid errors. The survey is also based on a representative sample of all college students and includes transfer students.
NPSAS 2008 provided representative samples for only six states: California, Georgia, Illinois, Minnesota, New York, and Texas.
1

8/3/2019 Student Debt and the Class of 2010, Project on Student Debt at the Institute for College Access & Success (TICAS)
http://slidepdf.com/reader/full/student-debt-and-the-class-of-2010-project-on-student-debt-at-the-institute 13/16
The Project on Student Debt
Student Debt and the Class of 2010
Despite the limitations of the CDS data, they are the only data available that show cumulative student debt levels
for bachelor’s degree recipients every year and at the college level. While far from perfect, CDS data are still
useful for illustrating the variations in student debt across states and colleges.
What Data are Included in the State Averages?
The state averages are calculated from data reported by the 1,067 colleges described above. These campus-level
debt gures are estimates, which, as noted above, are reported voluntarily by campus ofcials and are not audited
or reviewed by any outside entity. In order for their data to be considered usable for calculating state averages,
colleges had to report both the percent of graduating students with loans and their average debt, and report
granting bachelor’s degrees during the 2009-10 year. We did not calculate state averages when the usable cases
with student debt data covered less than 30 percent of bachelor’s degree recipients in the Class of 2010 or when
the underlying data for that state showed a change of 30 percent or more in average debt from the previous year.
Such large year-to-year swings likely reect different institutions reporting each year, reporting errors, or changes
in methodology by institutions reporting the data, rather than actual changes in debt levels. We weight the state
averages according to the size of the graduating class (number of bachelor’s degree recipients during the 2009-10
year) and the proportion of graduating seniors with debt.
The state averages and rankings in this report are not directly comparable to averages in previous years’ reports
due to changes in which colleges in each state report data each year, corrections to the underlying data submitted
by colleges, and changes in methodology. College InSight (at http://College-InSight.org) includes averages
for states, sectors, and other groupings of colleges, covering eight academic years. However, we recommend
using caution when generating year-to-year comparisons for aggregates with the student debt data or other data
taken from CDS. The underlying cohort of colleges reporting data for a particular topic or variable may not be
representative of the grouping as a whole, the list of colleges reporting data within each grouping may change
from year to year, and colleges may even change sectors.
Recommendations to Reduce the Burden of Student Debt
Student debt is widely understood to be a serious and growing problem in the United States. Too many qualiedyoung people are deterred from college by the presumed or actual cost, and two-thirds of those who graduate from
four-year colleges have student loan debt. Graduating with substantial debt, especially in tough economic times,
can limit career options and make it difcult to save for a home, a family, retirement, or their own children’s
educations. To help reduce the burden of student debt, we recommend the following two changes in particular.
• Increase access to need-based student aid. Colleges, states, and the federal government all need to maintain
and/or increase need-based aid programs to enable low- and moderate-income students to attend and complete
college without being saddled with heavy debt. Federal Pell Grants are the cornerstone of need-based aid
packages and help over nine million students per year afford college.31 Pell Grant recipients are already more
likely to borrow than other students. The most recent available data show that 86 percent of Pell recipients
who graduated from public and nonprot four-year colleges had debt, compared to 51 percent of non-Pell
recipients.32 Research studies show that need-based grant aid increases college enrollment among low- andmoderate-income students and reduces their likelihood of dropping out.33
31 U.S. Department of Education. 2011. Student Financial Assistance Fiscal Year 2012 Budget Request . http://www2.ed.gov/about/overview/budget/
budget12/justications/index.html . Accessed October 23, 2011.32 Calculations by the Project on Student Debt on data from the 2008 National Postsecondary Student Aid Study (NPSAS). Figures reect borrowing by
students who received bachelor’s degrees from public and nonprot four-year colleges in 2007-08.33 See: Bettinger, Eric. 2004. How Financial Aid Affects Persistence. National Bureau of Economic Research Working Paper 10242. Kane, Thomas J.. 2003.
A Quasi-Experimental Estimate of the Impact of Financial Aid on College-Going .National Bureau of Economic Research Working Paper 9703. Leslie, Larry
L. and Paul T. Brinkman. 1988. The Economic Value of Higher Education. Washington: American Council on Education, cited in Heller, Donald E.. 1997.
Student Price Response in Higher Education: An Update to Leslie and Brinkman. The Journal of Higher Education 68 (6): 624-659. Seftor, Neil S. and Sarah
E. Turner. 2002. Back to School: Federal Student Aid Policy and Adult College Enrollment. The Journal of Human Resources 37 (2): 336-352.
12
8/3/2019 Student Debt and the Class of 2010, Project on Student Debt at the Institute for College Access & Success (TICAS)
http://slidepdf.com/reader/full/student-debt-and-the-class-of-2010-project-on-student-debt-at-the-institute 14/16The Project on Student Debt
November 2011
• Require school certifcation of private loans: Organizations representing lenders, nancial aid ad-
ministrators, colleges, and students support requiring lenders to obtain school certication of private
loans — often referred to as “mandatory school certication” — and see it as a critical tool for en-
suring that students who borrow use safer federal loans rst. 34 Such certication would require that
lenders conrm with the college that a borrower is enrolled, eligible to borrow the requested amount, and
that the college has informed the student of any untapped federal loan eligibility before disbursing a
private loan. Some colleges already counsel students about options for covering college costs when thecollege learns a student has applied for a private loan. Mandatory school certication would expand the
reach of these practices by ensuring that colleges are aware of all applications for private loans.35 The
federal Consumer Financial Protection Bureau (CFPB) should require school certication of private
loans, a common-sense step to protect student borrowers.36 The current system of borrower “self-cer-
tication” is insufcient and ineffective.37 A recent survey of nancial aid administrators found that
many would prefer mandatory school certication to self-certication.38
Recommendations to Improve Student Debt Data
It is important for students, policymakers, and the public to have timely and accurate information on
student debt at the college level to inform decision making and hold colleges accountable for their policies and practices. There is currently no comprehensive or externally veried source of data on student
debt at the college level that is available on an annual basis. As discussed above, the Common Data Set
(CDS) is the only source for college-level cumulative student debt, but the data are far from perfect.
Although the federal government has taken a number of steps to ll in the gaps, more action is needed to
ensure that reliable data on student debt across states and colleges are available every year.
A few important changes would greatly improve the available data and understanding of the student debt
issues:
• Expand federal collection of student debt data: Students, colleges and policy makers would all ben-
et from expanded federal collection of student debt data, particularly cumulative debt at graduation and
the annual usage of private loans by all undergraduates. Currently, the federal government only collectsannual, college-level private loan data for rst-time, full-time students, greatly limiting its utility. With
more comprehensive federal data on student loan borrowing, prospective students would be able to com-
pare average debt at graduation across all colleges. With the inclusion of all federal and private loans in
one federal database, student borrowers would be able to see all their loans, federal and private, in one
place and receive counseling based on their total student debt. Colleges would be able to assess their stu-
dents’ usage of federal and private loans and craft policies to better encourage the use of federal loans rst.
34 See December 10, 2009 letter signed by 25 organizations, including TICAS, in support of mandatory certication (http://projectonstudentdebt.
org/pub_view.php?idx=534), and May 7, 2010 letter signed by lenders and others urging inclusion of mandatory school certication in the Senate
nancial reform bill (http://insidehighered.com/content/download/347825/4312983/version/1/le/NASFAASchoolCert.pdf , accessed October 14,
2011).35 For more about college’s private loan counseling practices, see: Project on Student Debt. 2011. Critical Choices: How Colleges Can Help
Students and Families Make Better Decisions about Private Loans. http://projectonstudentdebt.org/pub_view.php?idx=766 .36 See: Dodd-Frank Wall Street Reform and Consumer Protection Act , Pub. L. No. 111-203, 124 Stat. 1376 (2010). http://www.gpo.gov/fdsys/pkg/
PLAW-111publ203/pdf/PLAW-111publ203.pdf . Accessed October 14, 2011. and Project on Student Debt. 2010. Big Wins for Students in Final
Financial Reform Bill . http://projectonstudentdebt.org/les/pub/TICAS_Conference_STA.pdf .37 Self-certication requires the lender to collect a form from the loan applicant with the student’s cost of attendance, estimated nancial
assistance, and the difference between those two amounts. As currently implemented, self-certication does not require any notication to the
college, so college ofcials may not have the opportunity to check that the cost of attendance and estimated nancial assistance gures are
accurate or to counsel the student about other options. The relevant regulations can be found at 12 CFR 226.48(e), 34 CFR 601.11(d) and 34 CFR
668.14(b)(29).38 Student Lending Analytics. 2010. Improving the Self-Certication Process For Private Student Loans. Student Lending Analytics Blog. http://
studentlendinganalytics.typepad.com/student_lending_analytics/2010/10/improving-the-private-student-loan-self-certication-process.html . Ac-
cessed October 23, 2011.
1

8/3/2019 Student Debt and the Class of 2010, Project on Student Debt at the Institute for College Access & Success (TICAS)
http://slidepdf.com/reader/full/student-debt-and-the-class-of-2010-project-on-student-debt-at-the-institute 15/16
The Project on Student Debt
Student Debt and the Class of 2010
Comprehensive annual data on private loan usage and cumulative debt at graduation would provide policy
makers with a more accurate picture of borrowing patterns across different states, types of colleges, and types
of students.
We urge the Department of Education to make the minor enhancements to its annual survey of colleges
necessary to collect these data right away. We also urge the Department to make the necessary changes to
its database of student loans to improve the publicly available data about student debt at the college level,which is ultimately the best way to provide accurate and comprehensive data while minimizing the report-
ing burden for colleges.39 In addition, we urge the CFPB to work with the Department to improve the col-
lection of private loan data from lenders.
• Publish loan repayment rates and debt-to-income ratios: The Department of Education should publish
program-level loan repayment rates and debt-to-income ratios for programs required by law to prepare
students for gainful employment. New federal regulations require colleges to provide the Department
with the data necessary to calculate these debt measures and to disclose these rates to consumers once the
calculations are nal.40 The Department should publish these data annually to help students, parents, re-
searchers and policymakers make informed comparisons between programs.
39 For details on these and other ways to improve federal nancial aid data, see National Postsecondary Education Cooperative. Suggestions for Im-
provements to the Collection and Dissemination of Federal Financial Aid Data. U.S. Department of Education. Forthcoming, November 2011. http://
nces.ed.gov/pubsearch/pubsinfo.asp?pubid=2012834 .40 See: 34 CFR 668.6, 75 FR 66948, Program Integrity Issues. Federal Register . October 29, 2010. http://www.federalregister.gov/
articles/2010/10/29/2010-26531/program-integrity-issues#p-1737 . And 34 CFR 668.7(g)6) , 76 FR 34452, Program Integrity: Gainful Employment-
Debt Measures. Federal Register . June 13, 2011, http://www.federalregister.gov/articles/2011/06/13/2011-13905/program-integrity-gainful-
employment-debt-measures#p-691 .
14

8/3/2019 Student Debt and the Class of 2010, Project on Student Debt at the Institute for College Access & Success (TICAS)
http://slidepdf.com/reader/full/student-debt-and-the-class-of-2010-project-on-student-debt-at-the-institute 16/16
November 2011
The Project on Student Debt is an initiative of TheInstitute for College Access & Success, an independent,nonprot organization working to make higher education more available and affordable for people of all backgrounds. For more about the Institute, see http://
www.ticas.org.
This report was researched and written by Matthew Reed.
Lauren Asher, Pauline Abernathy, Diane Cheng, Debbie
Frankle Cochrane, and Laura Szabo-Kubitz also made
important contributions. This report was designed by
Shannon Gallegos, with a cover design by Dixon Wong.
Special thanks to the staff of Aeronet Communications,
who have helped to make all of this information easily
available on our web sites, http://projectonstudentdebt.org and http://College-InSight.org.