
Student Affairs Assessment Workshop Day 2
23
dent Affairs Assessment Workshop 2 Presented by: Dr. Gary R. Hanson Educational Leader & Policy Studies Arizona State Unive Sponsored by: NASPA – Hawai’i
-
Upload
anthony-whitaker -
Category
Documents
-
view
20 -
download
4
description
Student Affairs Assessment Workshop Day 2. Presented by: Dr. Gary R. Hanson Educational Leadership & Policy Studies Arizona State University. Sponsored by: NASPA – Hawai’i. Overview – Day 2. - PowerPoint PPT Presentation
Transcript of Student Affairs Assessment Workshop Day 2

Student Affairs Assessment Workshop Day 2
Presented by: Dr. Gary R. Hanson Educational Leadership & Policy Studies Arizona State University
Sponsored by: NASPA – Hawai’i
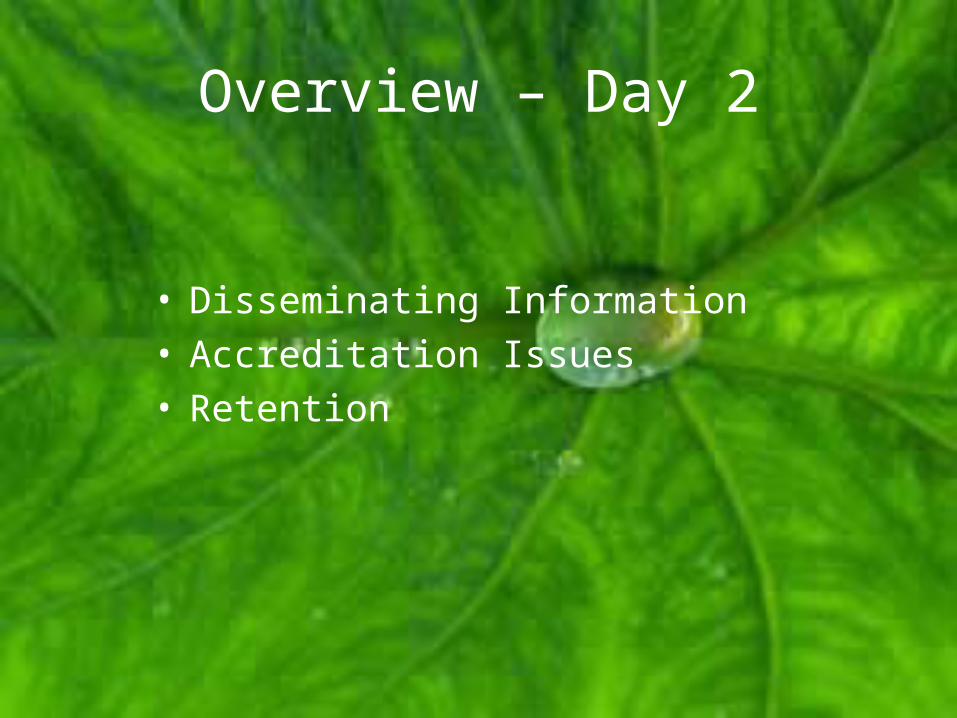
Overview – Day 2
• Disseminating Information• Accreditation Issues• Retention

Information DisseminationHow to Get Your Message Out !!!

Effective Dissemination . . .
…means getting the right information to the rightpeople at the right time so they can do the rightthing.
Brigman & Hanson, 2000

Establishing the Goals
• Begin with the end in mind
• Think win-win
• Synergize
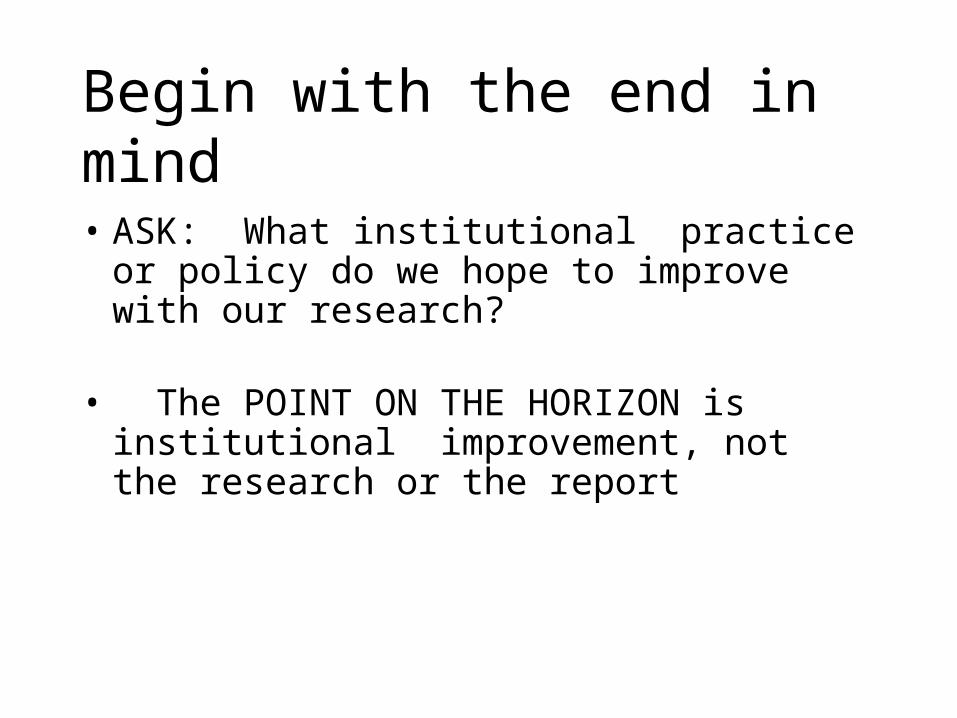
Begin with the end in mind
• ASK: What institutional practice or policy do we hope to improve with our research?
• The POINT ON THE HORIZON is institutional improvement, not the research or the report
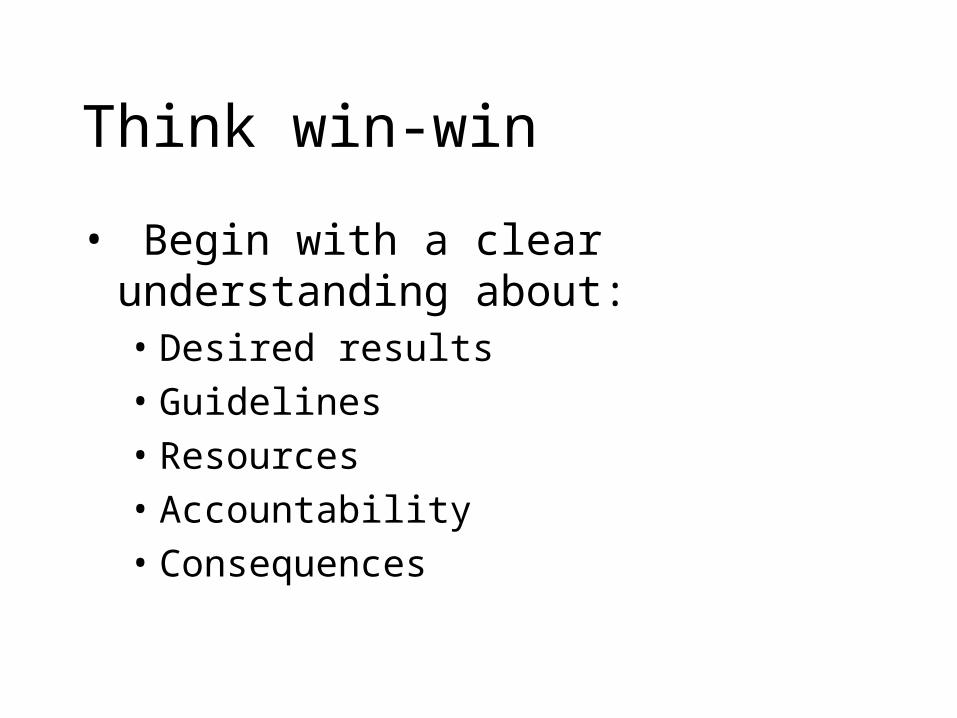
Think win-win
• Begin with a clear understanding about:• Desired results• Guidelines• Resources• Accountability• Consequences

Synergize
• Sell the importance of doing research
• Involve others in planning, conducting and reporting research
• Use research to identify “starting points” for the improvement process

Effective Dissemination…
…requires a change of attitude
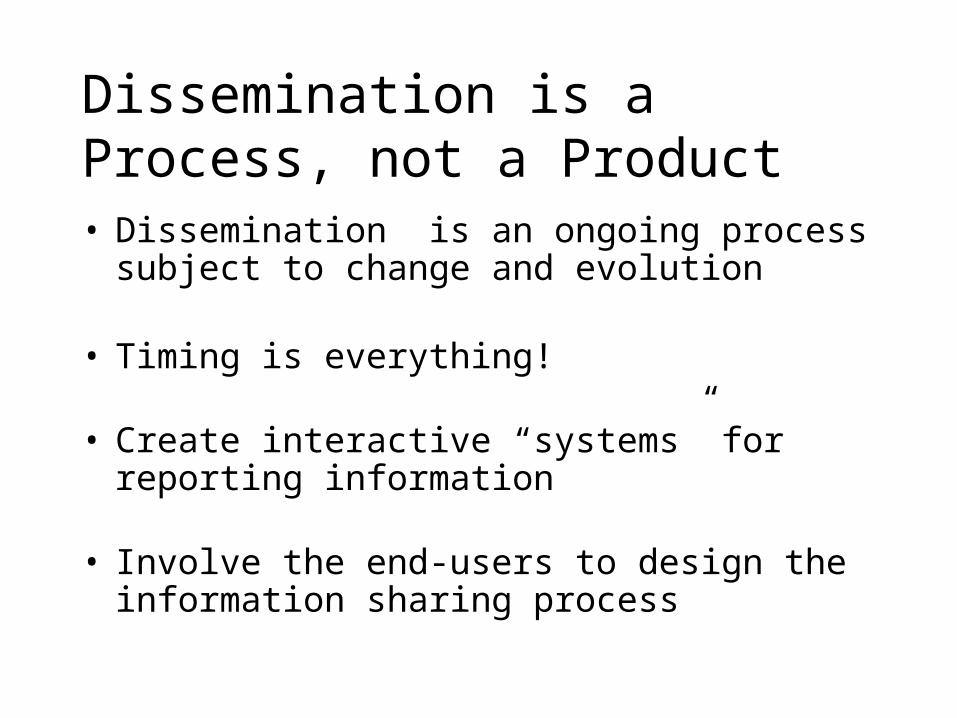
Dissemination is a Process, not a Product• Dissemination is an ongoing process subject to
change and evolution
• Timing is everything!
• Create interactive “systems” for reporting information
• Involve the end-users to design the information sharing process
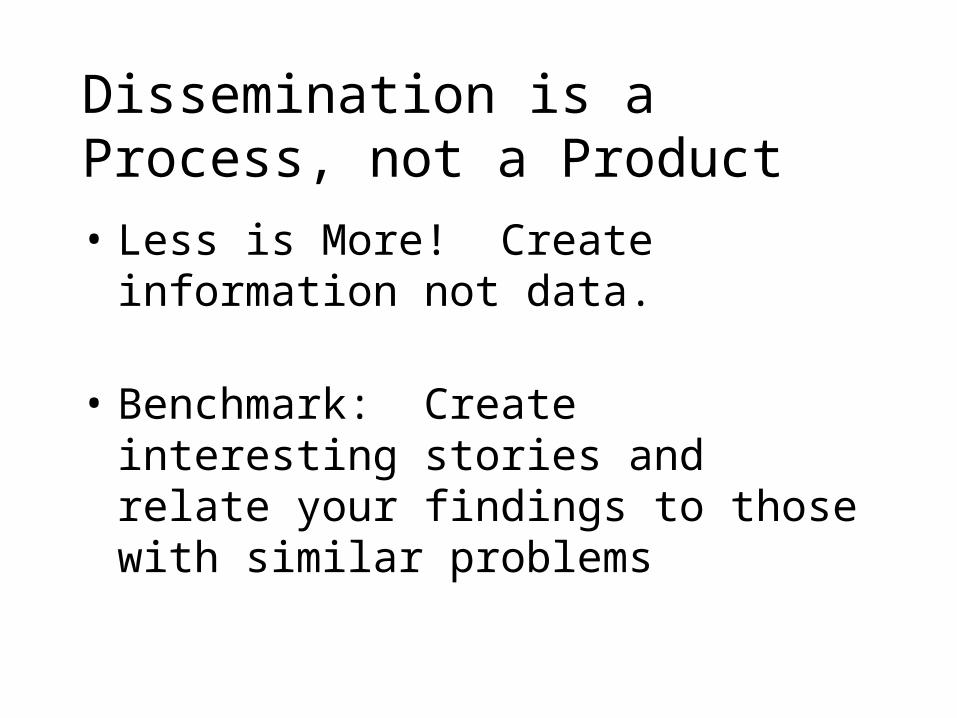
• Less is More! Create information not data.
• Benchmark: Create interesting stories and relate your findings to those with similar problems
Dissemination is a Process, not a Product

• Conduct a political analysis of key decision makers
• Who should receive the report first? Second? Last?
• Analyze the information processing mode of your decision makers• Textual• Graphical• Numerical
Step #1: Identify WHO receives the report
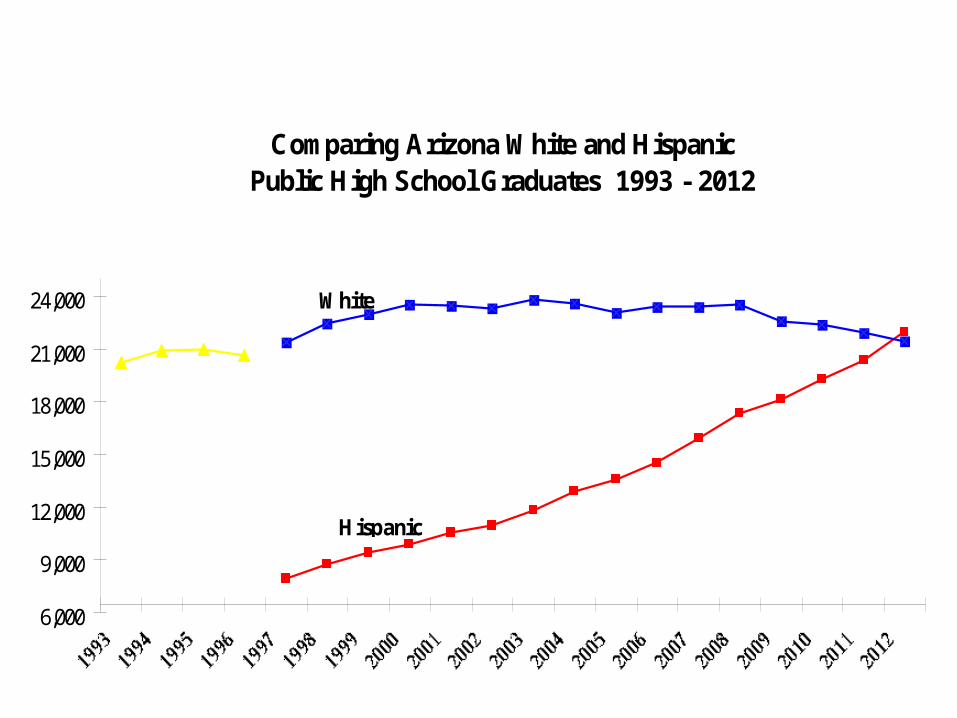
Comparing Arizona White and Hispanic Public High School Graduates 1993 - 2012
6,000
9,000
12,000
15,000
18,000
21,000
24,000 White
Hispanic
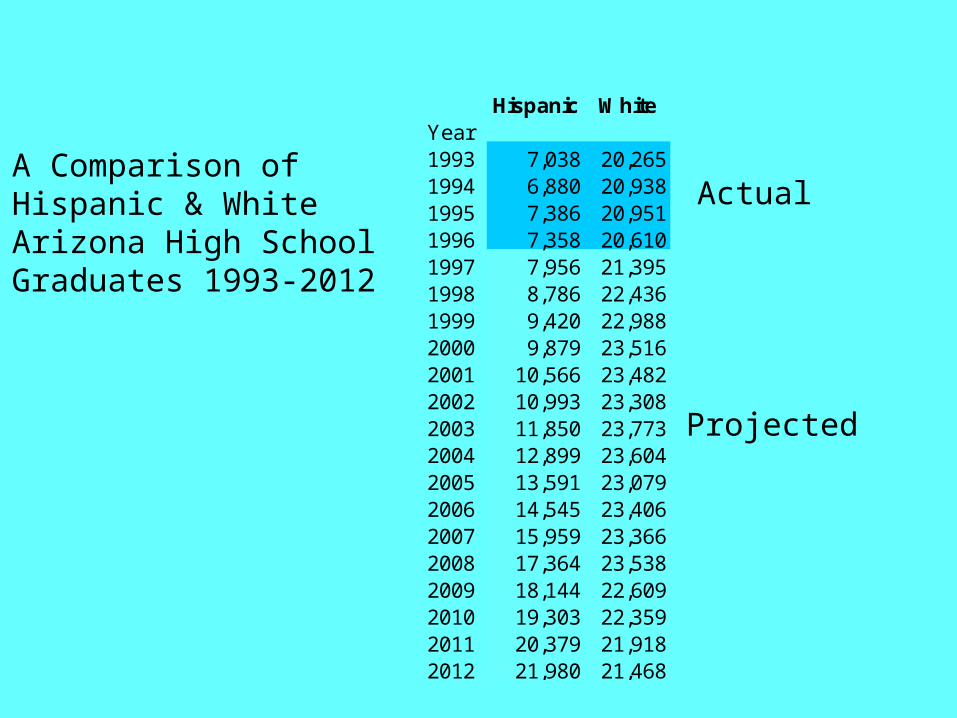
Hispanic WhiteYear1993 7,038 20,2651994 6,880 20,9381995 7,386 20,9511996 7,358 20,6101997 7,956 21,3951998 8,786 22,4361999 9,420 22,9882000 9,879 23,5162001 10,566 23,4822002 10,993 23,3082003 11,850 23,7732004 12,899 23,6042005 13,591 23,0792006 14,545 23,4062007 15,959 23,3662008 17,364 23,5382009 18,144 22,6092010 19,303 22,3592011 20,379 21,9182012 21,980 21,468
Projected
ActualA Comparison ofHispanic & WhiteArizona High SchoolGraduates 1993-2012
Summary
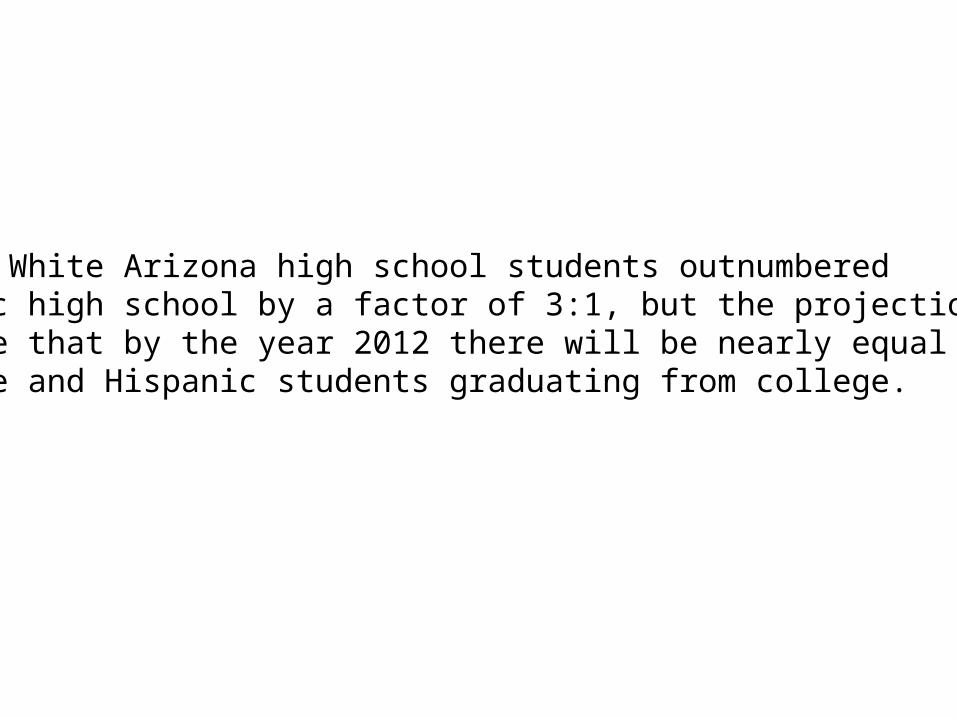
In 1993 White Arizona high school students outnumbered Hispanic high school by a factor of 3:1, but the projections indicate that by the year 2012 there will be nearly equal numbersof White and Hispanic students graduating from college.

Comparing Arizona White and Hispanic Public High School Graduates 1993 - 2012
6,000
9,000
12,000
15,000
18,000
21,000
24,000
19931994199519961997199819992000200120022003200420052006200720082009201020112012
White
Hispanic
Hispanic WhiteYear1993 7,038 20,2651994 6,880 20,9381995 7,386 20,9511996 7,358 20,6101997 7,956 21,3951998 8,786 22,4361999 9,420 22,9882000 9,879 23,5162001 10,566 23,4822002 10,993 23,3082003 11,850 23,7732004 12,899 23,6042005 13,591 23,0792006 14,545 23,4062007 15,959 23,3662008 17,364 23,5382009 18,144 22,6092010 19,303 22,3592011 20,379 21,9182012 21,980 21,468
Summary
In 1993 White Arizona high school students outnumbered Hispanic high school by a factor of 3:1, but the projections indicate that by the year 2012 there will be nearly equal numbers of White and Hispanic students graduating from high school.
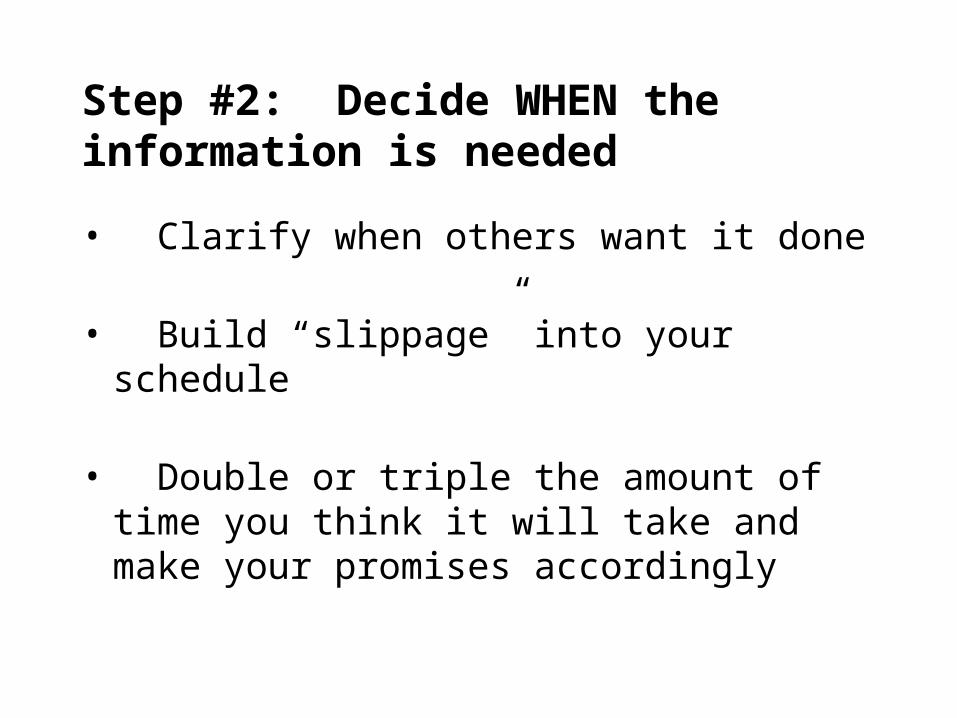
• Clarify when others want it done
• Build “slippage” into your schedule
• Double or triple the amount of time you think it will take and make your promises accordingly
Step #2: Decide WHEN the information is needed

Step #3: Determine the statistical sophistication of your user audience
• Determine the statistical sophistication of your audience(s).
• What kind of data summary will they understand?
• How much data do they want?
• What data format will be most effective?

• Consider AGAIN the information processing preferences of your primary decision makers
• Use several short reports rather than one long one
• Select the Media Mode for sharing your information• Print• Web• Multi-media• Oral• Interactive computer
Step #4: Decide the report format

• What information is needed to make the decision?
• PROVIDE IT !!!
Step #5: Decide the CONTENT of the report
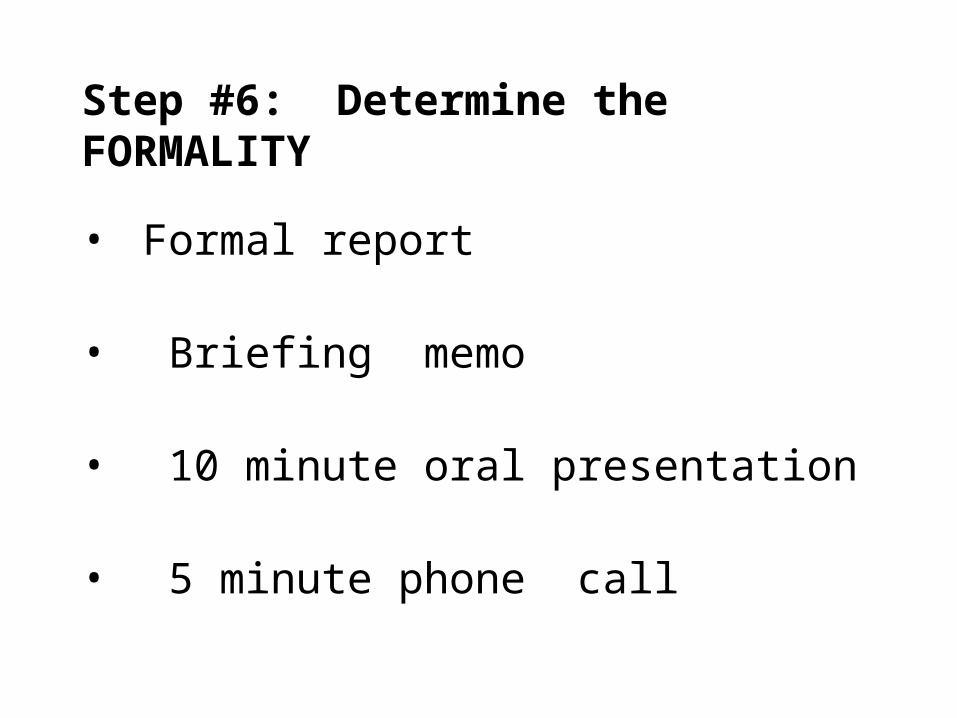
• Formal report
• Briefing memo
• 10 minute oral presentation
• 5 minute phone call
Step #6: Determine the FORMALITY

• Release “preliminary” findings
• Provide decision makers with time to counteract bad news
• Outline dissemination options for release
Step #7: How do you share “BAD NEWS” ?