Student Achievement Data Display Mathematics, Reading & Writing Grade 4
35
Student Achievement Data Student Achievement Data Display Display Mathematics, Reading Mathematics, Reading & Writing Grade 4 & Writing Grade 4 Revised: October 30, 2009 Official WASL Results AYP Status
-
Upload
suelita-ypina -
Category
Documents
-
view
19 -
download
0
description
Student Achievement Data Display Mathematics, Reading & Writing Grade 4. Official WASL Results AYP Status. Revised: October 30, 2009. WASL Mathematics : 2005-2009. Grade 4. Grade 4 WASL: Mathematics Performance. Grade 4 WASL: Mathematics Performance. - PowerPoint PPT Presentation
Transcript of Student Achievement Data Display Mathematics, Reading & Writing Grade 4
Student Achievement Data DisplayStudent Achievement Data DisplayMathematics, ReadingMathematics, Reading
& Writing Grade 4& Writing Grade 4
Revised: October 30, 2009
Official WASL Results
AYP Status

2
WASL WASL MathematicsMathematics: 2005-2009: 2005-2009
Grade 4Grade 4
Lowell Elementary

3
Grade 4 WASL: Grade 4 WASL: Mathematics PerformanceMathematics Performance
Percent Meeting Math Standard
0
10
20
30
40
50
60
70
80
90
100
Pe
rce
nt
Me
eti
ng
Sta
nd
ard
Lowell Elementary 59 52 54 42 42
2004-05 2005-06 2006-07 2007-08 2008-09
4
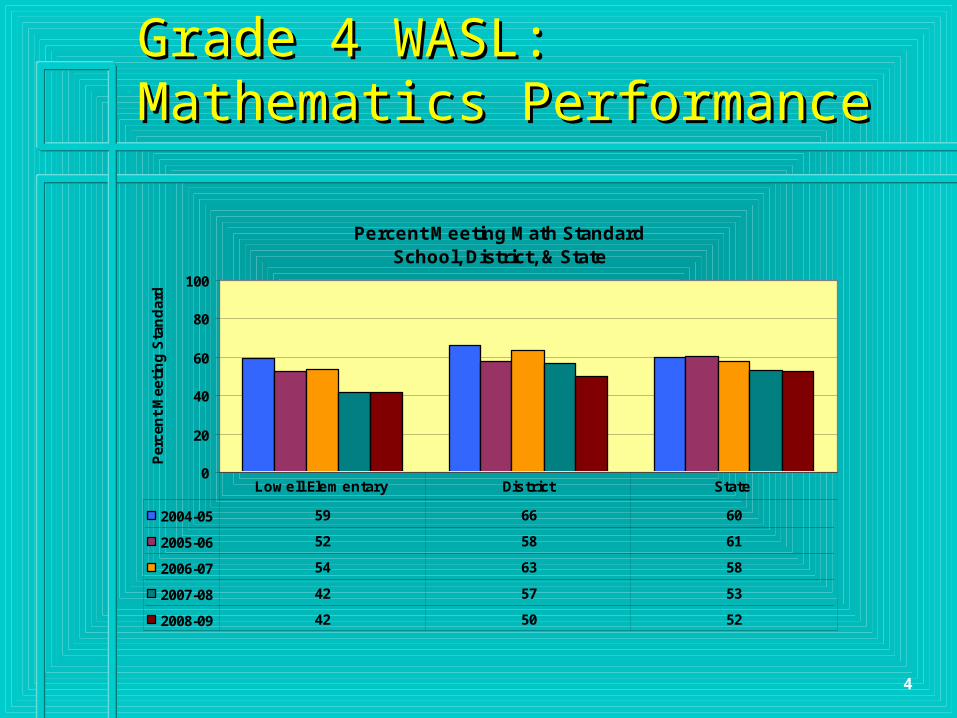
Grade 4 WASL: Grade 4 WASL: Mathematics PerformanceMathematics Performance
Percent Meeting Math StandardSchool, District, & State
0
20
40
60
80
100
Per
cen
t M
eeti
ng
Sta
nd
ard
2004-05 59 66 60
2005-06 52 58 61
2006-07 54 63 58
2007-08 42 57 53
2008-09 42 50 52
Lowell Elementary District State

5
Adequate Yearly Progress: Adequate Yearly Progress: Annual Targets for Grade 4 MathAnnual Targets for Grade 4 Math
MATH Accountability Goal
Adequate Yearly Progress (AYP)
29.7
47.3
64.9
82.4
100.0
0
10
20
30
40
50
60
70
80
90
100
2001-02
2002-03
2003-04
2004-05
2005-06
2006-07
2007-08
2008-09
2009-10
2010-11
2011-12
2012-13
2013-14
Per
cen
t M
eeti
ng
Sta
nd
ard
AYP_Goal
6
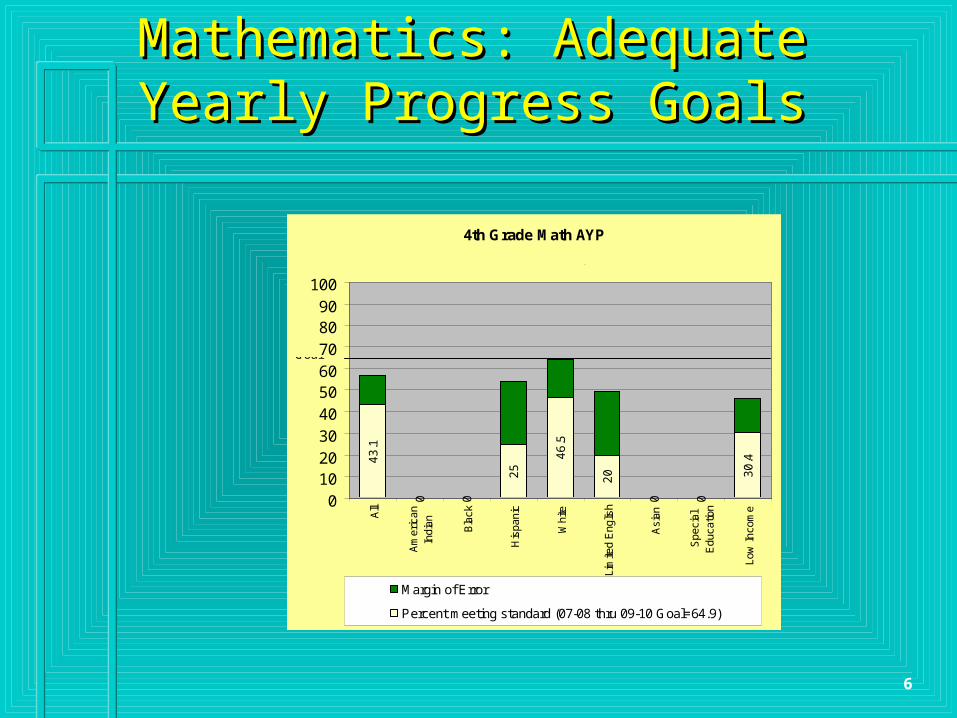
Grade 4 WASL-Mathematics: Grade 4 WASL-Mathematics: Adequate Yearly Progress GoalsAdequate Yearly Progress Goals
4th Grade Math AYP
43
.1
0 0
25
46
.5
20
0 0
30
.4
0102030405060708090
100
All
Am
eric
anIn
dian Bla
ck
His
pani
c
Whi
te
Lim
ited
Eng
lish
Asi
an
Spe
cial
Edu
catio
n
Low
Inco
me
Margin of Error
Percent meeting standard (07-08 thru 09-10 Goal=64.9)
Goal
Lowell Elementary

7
Grade 4 WASL Mathematics: Grade 4 WASL Mathematics: Proficiency Level TrendsProficiency Level Trends
Percent of Students Scoring in Each Performance Level Math Grade 4
14
27
37
2218
30 27 2525 2129
2534
25 231922
36
2517
0
20
40
60
80
100
Level 1 Level 2 Level 3 Level 4
Performance Level
Per
cen
t in
Lev
el
2004-05
2005-06
2006-07
2007-08
2008-09
Does not meet standard Meets standard
Lowell Elementary
8
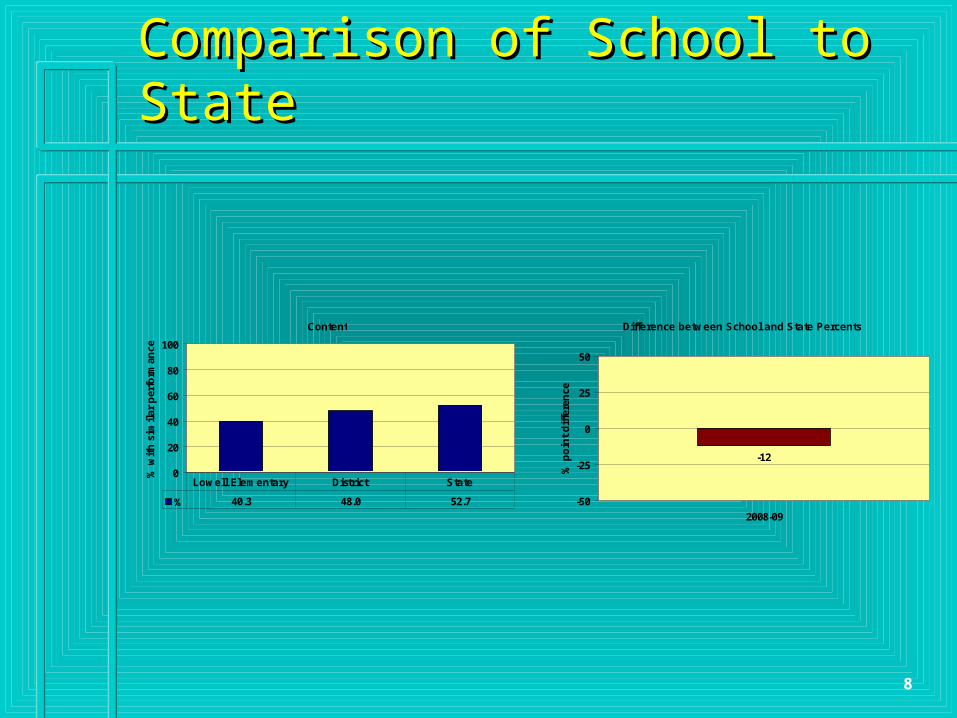
Grade 4 Content:Grade 4 Content:Comparison of School to StateComparison of School to State
Content
0
20
40
60
80
100
% w
ith
sim
ilar
per
form
ance
% 40.3 48.0 52.7
Lowell Elementary District State
Difference between School and State Percents
-12
-50
-25
0
25
50
2008-09
% p
oin
t d
iffe
ren
ce

9
Grade 4 Processes:Grade 4 Processes:Comparison of School to StateComparison of School to State
Processes
0
20
40
60
80
100
% w
ith
sim
ila
r p
erf
orm
an
ce
% 33.8 47.3 47.2
Lowell Elementary District State
Difference between School and State Percents
-13
-50
-25
0
25
50
2008-09
% p
oin
t d
iffe
ren
ce

10
Grade 4 Number Sense:Grade 4 Number Sense:Comparison of School to StateComparison of School to State
Difference between School and State Percents
3
-12-7 -8
-50
-25
0
25
50
2004-05 2005-06 2006-07 2007-08
% p
oin
t d
iffe
ren
ce 0%10%20%30%40%50%60%70%80%90%100%LiteraryInformationalPerc
en
tSchool 1997School 1998School 1999District 1997District 1998District 1999School 2000District 2000School 2001District 2001Math - Number Sense
0
20
40
60
80
100
% w
ith
sim
ilar
per
form
ance
% 46.2 53.0 54.6
Lowell Elementary District State
2005-2008

11
Grade 4 Measurement:Grade 4 Measurement:Comparison of School to StateComparison of School to State
Difference between School and State Percents
-7
-1
-6-14
-50
-25
0
25
50
2004-05 2005-06 2006-07 2007-08
% p
oin
t d
iffe
ren
ce 0%10%20%30%40%50%60%70%80%90%100%LiteraryInformationalPe
rcen
tSchool 1997School 1998School 1999District 1997District 1998District 1999School 2000District 2000School 2001District 2001Math - Measurement
0
20
40
60
80
100
% w
ith
sim
ila
r p
erf
orm
an
ce
% 38.5 57.1 52.5
Lowell Elementary District State
2005-2008

12
Grade 4 Geometric Sense:Grade 4 Geometric Sense:Comparison of School to StateComparison of School to State
Difference between School and State Percents
-19
10 92
-50
-25
0
25
50
2004-05 2005-06 2006-07 2007-08
% p
oin
t d
iffe
ren
ce 0%10%20%30%40%50%60%70%80%90%100%LiteraryInformationalPe
rcen
tSchool 1997School 1998School 1999District 1997District 1998District 1999School 2000District 2000School 2001District 2001Math - Geometric Sense
0
20
40
60
80
100
% w
ith
sim
ila
r p
erf
orm
an
ce
% 58.5 65.5 56.3
Lowell Elementary District State
2005-2008
13
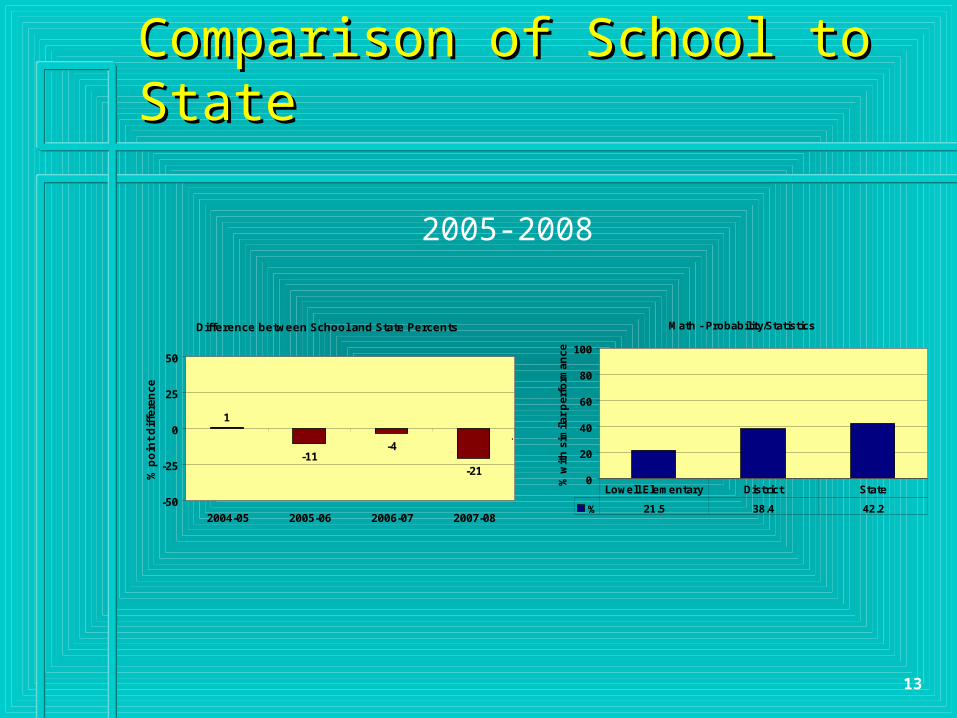
Grade 4 Probability & Statistics:Grade 4 Probability & Statistics:Comparison of School to StateComparison of School to State
Difference between School and State Percents
1
-11-4
-21
-50
-25
0
25
50
2004-05 2005-06 2006-07 2007-08
% p
oin
t d
iffe
ren
ce 0%10%20%30%40%50%60%70%80%90%100%LiteraryInformationalPe
rcen
tSchool 1997School 1998School 1999District 1997District 1998District 1999School 2000District 2000School 2001District 2001Math - Probability/Statistics
0
20
40
60
80
100
% w
ith
sim
ila
r p
erf
orm
an
ce
% 21.5 38.4 42.2
Lowell Elementary District State
2005-2008

14
Grade 4 Algebraic Sense:Grade 4 Algebraic Sense:Comparison of School to StateComparison of School to State
Difference between School and State Percents
-8
0
-8-16
-50
-25
0
25
50
2004-05 2005-06 2006-07 2007-08
% p
oin
t d
iffe
ren
ce 0%10%20%30%40%50%60%70%80%90%100%LiteraryInformationalPe
rcen
tSchool 1997School 1998School 1999District 1997District 1998District 1999School 2000District 2000School 2001District 2001Math - Algebraic Sense
0
20
40
60
80
100
% w
ith
sim
ila
r p
erf
orm
an
ce
% 30.8 49.7 46.4
Lowell Elementary District State
2005-2008

15
Grade 4 Solves Problems/Reasons Logically:Grade 4 Solves Problems/Reasons Logically:ComparisonComparison of School to State of School to State
Difference between School and State Percents
1
-15-9
-15
-50
-25
0
25
50
2004-05 2005-06 2006-07 2007-08
% p
oin
t d
iffe
ren
ce 0%10%20%30%40%50%60%70%80%90%100%LiteraryInformationalPe
rcen
tSchool 1997School 1998School 1999District 1997District 1998District 1999School 2000District 2000School 2001District 2001Math - Solves Problems/Reasons Logically
0
20
40
60
80
100
% w
ith
sim
ila
r p
erf
orm
an
ce
% 41.5 60.4 56.2
Lowell Elementary District State
2005-2008

16
Grade 4 Communicates Understanding:Grade 4 Communicates Understanding:Comparison of School to StateComparison of School to State
Difference between School and State Percents
-3
13
-8
6
-50
-25
0
25
50
2004-05 2005-06 2006-07 2007-08
% p
oin
t d
iffe
ren
ce 0%10%20%30%40%50%60%70%80%90%100%LiteraryInformationalPe
rcen
tSchool 1997School 1998School 1999District 1997District 1998District 1999School 2000District 2000School 2001District 2001Math - Communicates Understanding
0
20
40
60
80
100
% w
ith
sim
ila
r p
erf
orm
an
ce
% 50.8 46.9 45.2
Lowell Elementary District State
2005-2008
17
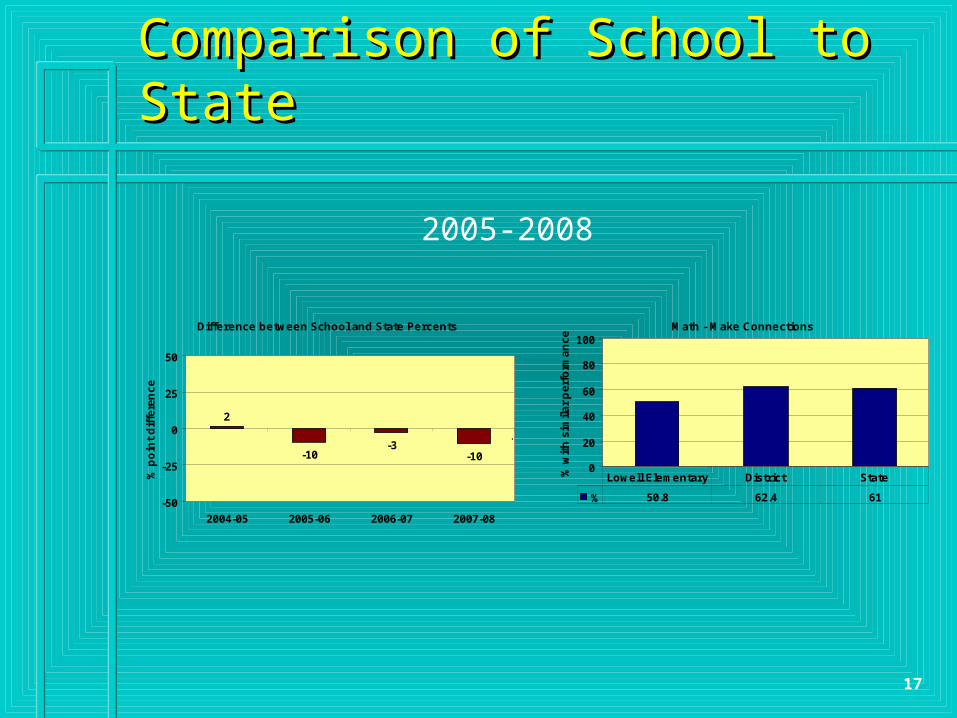
Grade 4 Make Connections:Grade 4 Make Connections:Comparison of School to StateComparison of School to State
Difference between School and State Percents
2
-10-3
-10
-50
-25
0
25
50
2004-05 2005-06 2006-07 2007-08
% p
oin
t d
iffe
ren
ce 0%10%20%30%40%50%60%70%80%90%100%LiteraryInformationalPe
rcen
tSchool 1997School 1998School 1999District 1997District 1998District 1999School 2000District 2000School 2001District 2001Math - Make Connections
0
20
40
60
80
100
% w
ith
sim
ila
r p
erf
orm
an
ce
% 50.8 62.4 61
Lowell Elementary District State
2005-2008

18
WASL WASL ReadingReading: 2005-2009: 2005-2009
Grade 4Grade 4
Lowell Elementary

19
Grade 4 WASL Grade 4 WASL Reading PerformanceReading Performance
Percent Meeting Reading Standard
0
10
20
30
40
50
60
70
80
90
100
Per
cen
t M
eeti
ng
Sta
nd
ard
Lowell Elementary 85 79 76 57 65
2004-05 2005-06 2006-07 2007-08 2008-09

20
Grade 4 WASL Grade 4 WASL Reading PerformanceReading Performance
Percent Meeting Reading StandardSchool, District, & State
0
20
40
60
80
100
Per
cen
t M
eeti
ng
Sta
nd
ard
2004-05 85 82 74
2005-06 79 81 80
2006-07 76 81 77
2007-08 57 77 72
2008-09 65 77 74
Lowell Elementary District State

21
Adequate Yearly Progress:Adequate Yearly Progress: Annual Targets for Grade 4 Reading Annual Targets for Grade 4 Reading
READING Accountability Goal
Adequate Yearly Progress (AYP) Trend
52.2
64.2
76.1
88.1
100.0
0
10
20
30
40
50
60
70
80
90
100
2001-02
2002-03
2003-04
2004-05
2005-06
2006-07
2007-08
2008-09
2009-10
2010-11
2011-12
2012-13
2013-14
Per
cen
t M
eeti
ng
Sta
nd
ard
AYP_Goal
22
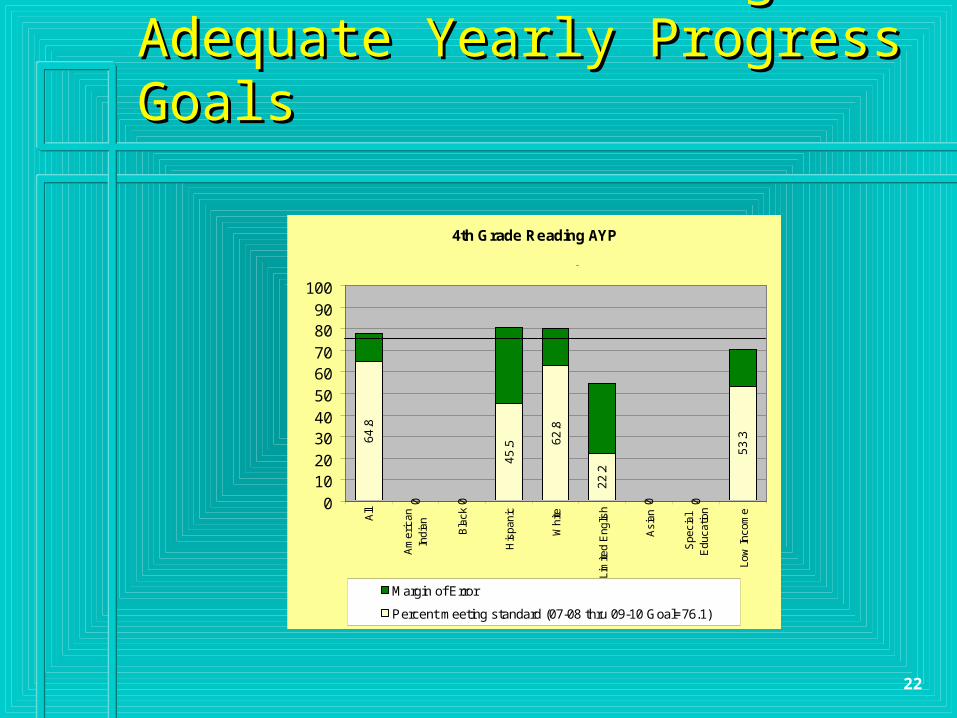
Grade 4 WASL-Reading: Grade 4 WASL-Reading: Adequate Yearly Progress GoalsAdequate Yearly Progress Goals
4th Grade Reading AYP
64
.8
0 0
45
.5 62
.8
22
.2
0 0
53
.3
0102030405060708090
100
All
Am
eric
anIn
dian Bla
ck
His
pani
c
Whi
te
Lim
ited
Eng
lish
Asi
an
Spe
cial
Edu
catio
n
Low
Inco
me
Margin of Error
Percent meeting standard (07-08 thru 09-10 Goal=76.1)
Goal
Lowell Elementary

23
Grade 4 WASL ReadingGrade 4 WASL ReadingProficiency Level TrendsProficiency Level Trends
Percent of Students Scoring in Each Performance Level Reading Grade 4
1
14
49
36
3
18
49
31
7
17
52
24
8
35
45
125
30
44
21
0
20
40
60
80
100
Level 1 Level 2 Level 3 Level 4
Performance Level
Per
cen
t in
Lev
el
2004-05
2005-06
2006-07
2007-08
2008-09
Does not meet standard Meets standard
Lowell Elementary

24
Grade 4 Comprehension:Grade 4 Comprehension:Comparison of School to StateComparison of School to State
Comprehension
0
20
40
60
80
100
% w
ith
sim
ilar
per
form
ance
% 57.1 73.2 69.8
Lowell Elementary District State
Difference between School and State Percents
-13
-50
-25
0
25
50
2008-09
% p
oin
t d
iffe
ren
ce
25
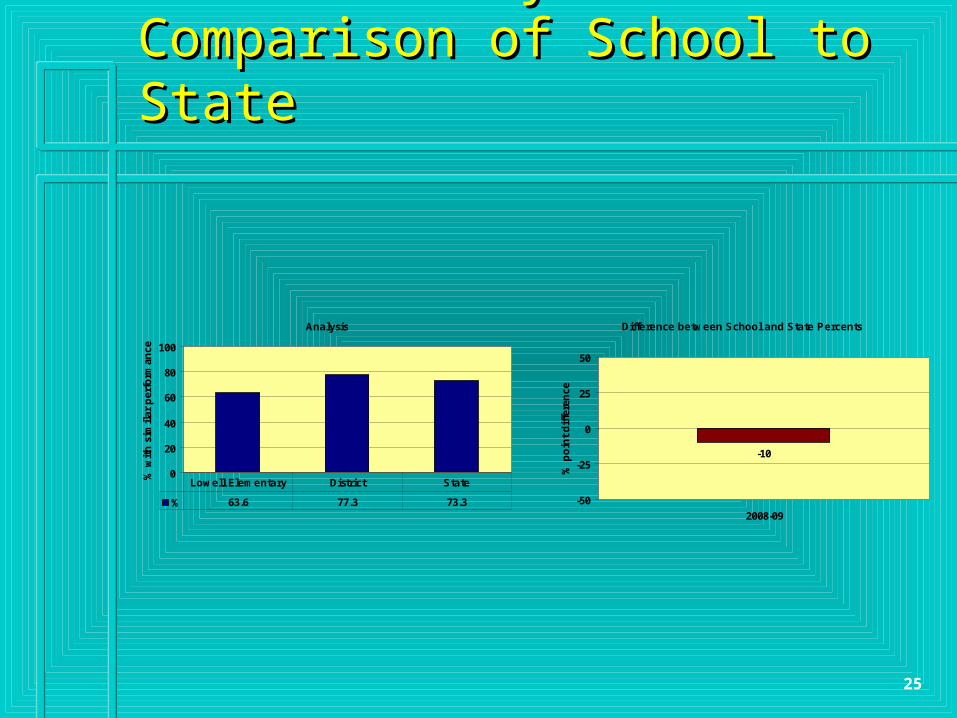
Grade 4 Analysis:Grade 4 Analysis:Comparison of School to StateComparison of School to State
Analysis
0
20
40
60
80
100
% w
ith
sim
ilar
per
form
ance
% 63.6 77.3 73.3
Lowell Elementary District State
Difference between School and State Percents
-10
-50
-25
0
25
50
2008-09
% p
oin
t d
iffe
ren
ce

26
Grade 4 Comprehension of Literary Grade 4 Comprehension of Literary Text: Comparison of School to StateText: Comparison of School to State
Difference between School and State Percents
8
-10-5
-10
-50
-25
0
25
50
2004-05 2005-06 2006-07 2007-08
% p
oin
t d
iffe
ren
ce 0%10%20%30%40%50%60%70%80%90%100%LiteraryInformationalPerc
en
tSchool 1997School 1998School 1999District 1997District 1998District 1999School 2000District 2000School 2001District 2001Literary Text - Comprehension
0
20
40
60
80
100
% w
ith
sim
ilar
per
form
ance
% 61.5 76.4 71.6
Lowell Elementary District State
2005-2008

27
Grade 4 Literary Analysis with Thinking Grade 4 Literary Analysis with Thinking Critically: Comparison of School to StateCritically: Comparison of School to State
0%10%20%30%40%50%60%70%80%90%100%LiteraryInformationalPerc
en
tSchool 1997School 1998School 1999District 1997District 1998District 1999School 2000District 2000School 2001District 2001Difference between School and State Percents
0
-3 -2-10
-50
-25
0
25
50
2004-05 2005-06 2006-07 2007-08
% p
oin
t d
iffe
ren
ce
Literary Text - Analyze and Interpret
0
20
40
60
80
100%
wit
h s
imil
ar p
erfo
rman
ce
% 52.3 67.9 61.9
Lowell Elementary District State
2005-2008

28
Grade 4 Informational Comprehension:Grade 4 Informational Comprehension:Comparison of School to StateComparison of School to State
Difference between School and State Percents
6 5 1
-18
-50
-25
0
25
50
2004-05 2005-06 2006-07 2007-08
% p
oin
t d
iffe
ren
ce 0%10%20%30%40%50%60%70%80%90%100%LiteraryInformationalPerc
en
tSchool 1997School 1998School 1999District 1997District 1998District 1999School 2000District 2000School 2001District 2001
Informational Text - Comprehension
0
20
40
60
80
100
% w
ith
sim
ilar
per
form
ance
% 46.2 70.3 64.2
Lowell Elementary District State
2005-2008

29
Grade 4 Analysis with Thinking Critically:Grade 4 Analysis with Thinking Critically:Comparison of School to StateComparison of School to State
Difference between School and State Percents
5
-5 -9-19
-50
-25
0
25
50
2004-05 2005-06 2006-07 2007-08
% p
oin
t d
iffe
ren
ce 0%10%20%30%40%50%60%70%80%90%100%LiteraryInformationalPerc
en
tSchool 1997School 1998School 1999District 1997District 1998District 1999School 2000District 2000School 2001District 2001Informational Text - Analyze and Interpret
0
20
40
60
80
100
% w
ith
sim
ilar
per
form
ance
% 52.3 75.8 71
Lowell Elementary District State
2005-2008
30
WASL WASL WritingWriting: 2005-2009: 2005-2009
Grade 4Grade 4
Lowell Elementary
31
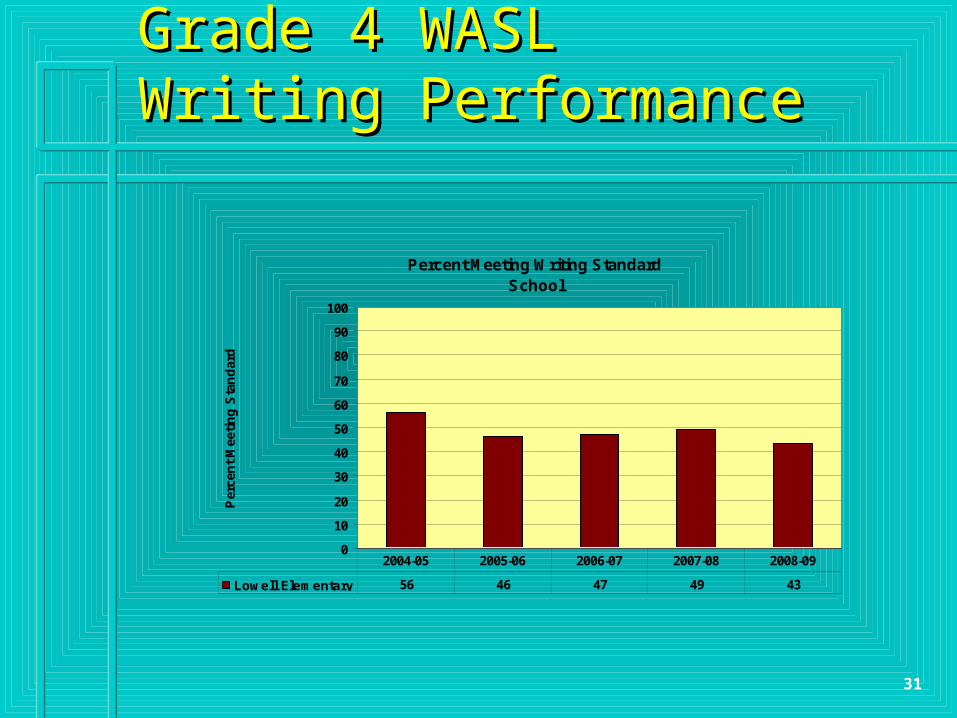
Grade 4 WASL Grade 4 WASL Writing PerformanceWriting Performance
Percent Meeting Writing StandardSchool
0
10
20
30
40
50
60
70
80
90
100
Per
cen
t M
eeti
ng
Sta
nd
ard
Lowell Elementary 56 46 47 49 43
2004-05 2005-06 2006-07 2007-08 2008-09
32
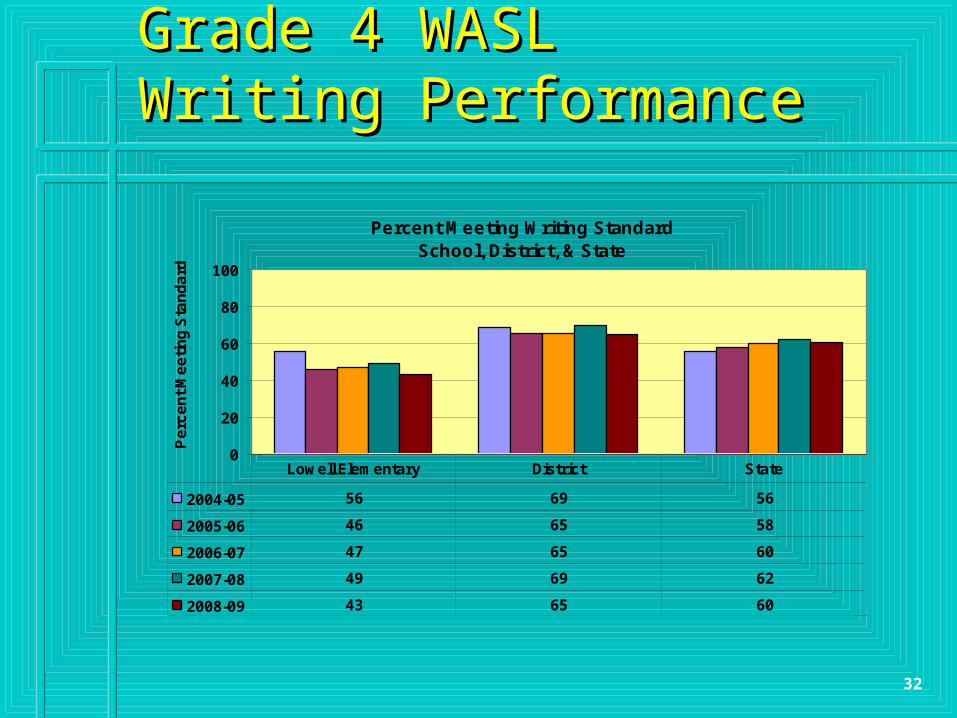
Grade 4 WASL Grade 4 WASL Writing PerformanceWriting Performance
Percent Meeting Writing StandardSchool, District, & State
0
20
40
60
80
100
Pe
rce
nt
Me
eti
ng
Sta
nd
ard
2004-05 56 69 56
2005-06 46 65 58
2006-07 47 65 60
2007-08 49 69 62
2008-09 43 65 60
Lowell Elementary District State
33
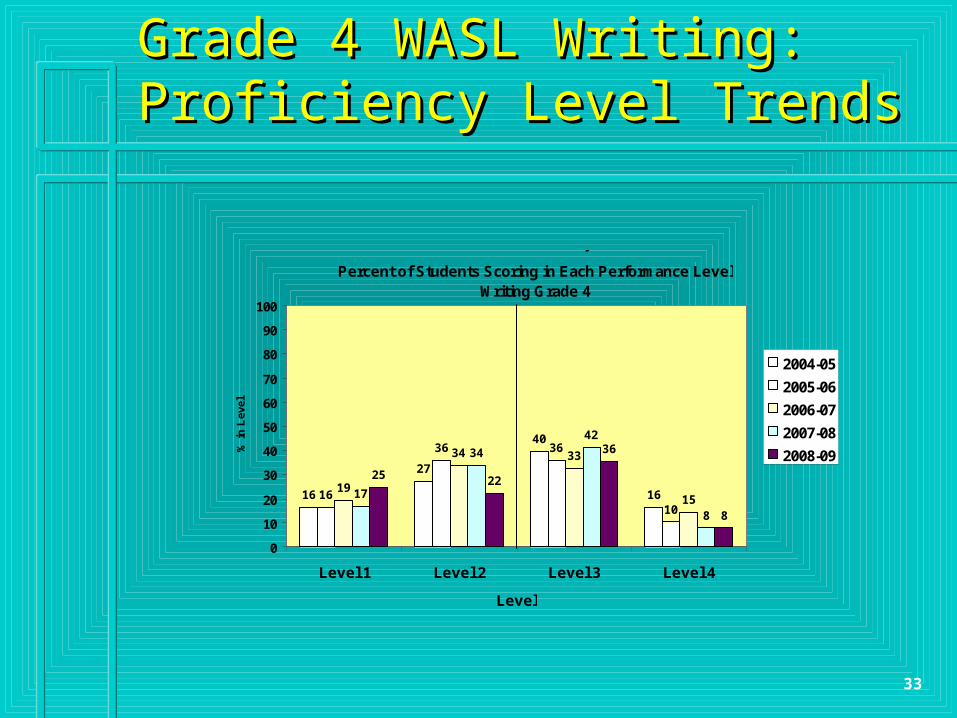
Grade 4 WASL Writing:Grade 4 WASL Writing:Proficiency Level TrendsProficiency Level Trends
Percent of Students Scoring in Each Performance LevelWriting Grade 4
16
27
40
1616
36 36
10
19
34 33
1517
34
42
8
22
36
8
25
0
10
20
30
40
50
60
70
80
90
100
Level 1 Level 2 Level 3 Level 4
Level
% in
Lev
el
2004-05
2005-06
2006-07
2007-08
2008-09
Lowell Elementary
Meets standardDoes not meet standard

34
Grade 4 Content, Organization, and Style:Grade 4 Content, Organization, and Style:Comparison of School to StateComparison of School to State
Difference between School and State Percents
-4-10 -12 -14
-18
-50
-25
0
25
50
2004-05 2005-06 2006-07 2007-08 2008-09
% p
oin
t d
iffe
ren
ce 0%10%20%30%40%50%60%70%80%90%100%LiteraryInformationalPerc
en
tSchool 1997School 1998School 1999District 1997District 1998District 1999School 2000District 2000School 2001District 2001Writing - Content, Organization, Style
0
20
40
60
80
100
% w
ith
sim
ilar
per
form
ance
% 36.2 62.3 54.6
Lowell Elementary District State
2005-2009
35
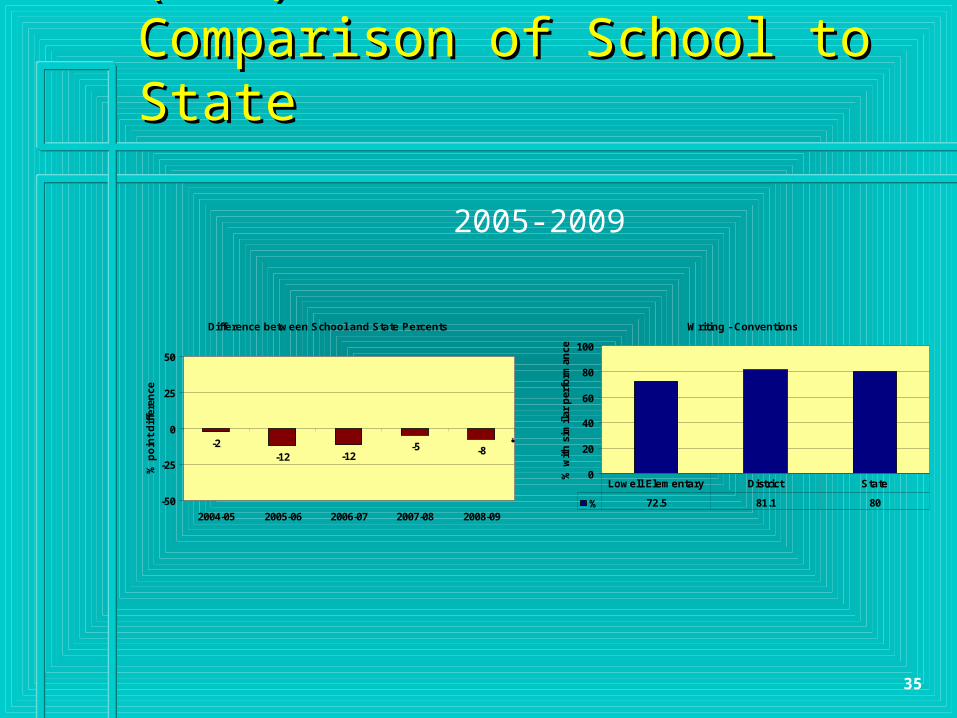
Grade 4 Conventions (CON): Grade 4 Conventions (CON): Comparison of School to StateComparison of School to State
Difference between School and State Percents
-2-12 -12
-5 -8
-50
-25
0
25
50
2004-05 2005-06 2006-07 2007-08 2008-09
% p
oin
t d
iffe
ren
ce 0%10%20%30%40%50%60%70%80%90%100%LiteraryInformationalPerc
en
tSchool 1997School 1998School 1999District 1997District 1998District 1999School 2000District 2000School 2001District 2001Writing - Conventions
0
20
40
60
80
100
% w
ith
sim
ilar
per
form
ance
% 72.5 81.1 80
Lowell Elementary District State
2005-2009