Strut-and-tie models for deteriorated reinforced concrete ...
14
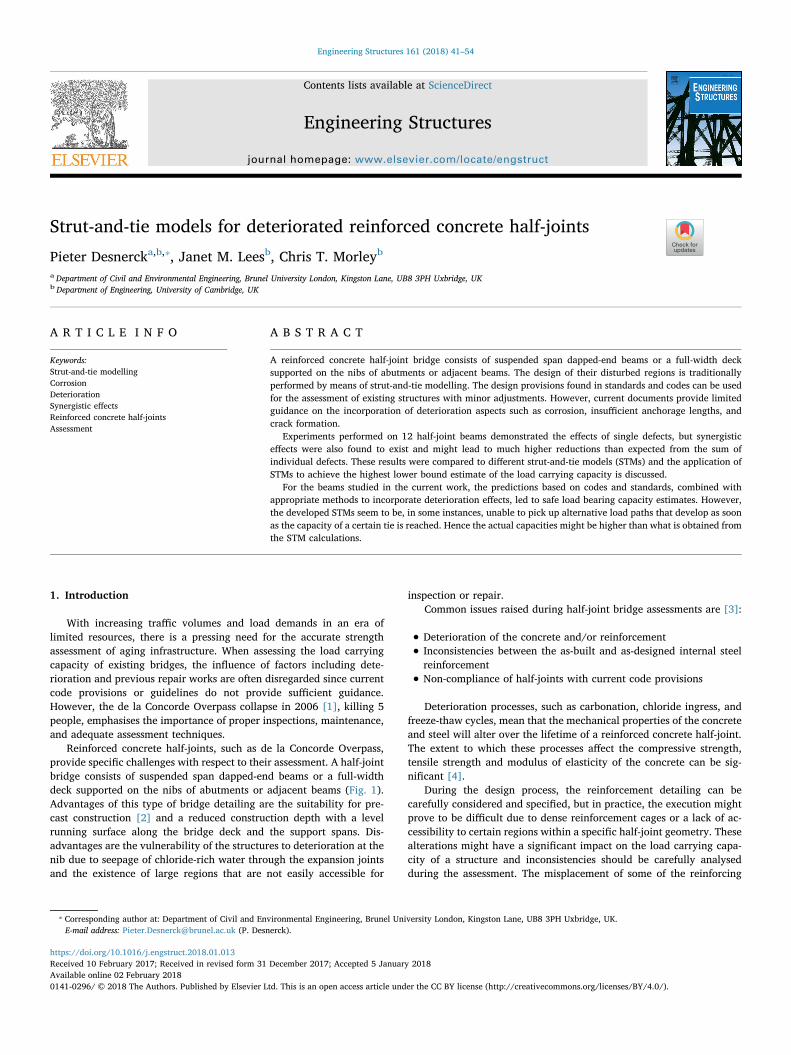
Contents lists available at ScienceDirect Engineering Structures journal homepage: www.elsevier.com/locate/engstruct Strut-and-tie models for deteriorated reinforced concrete half-joints Pieter Desnerck a,b, ⁎ , Janet M. Lees b , Chris T. Morley b a Department of Civil and Environmental Engineering, Brunel University London, Kingston Lane, UB8 3PH Uxbridge, UK b Department of Engineering, University of Cambridge, UK ARTICLE INFO Keywords: Strut-and-tie modelling Corrosion Deterioration Synergistic effects Reinforced concrete half-joints Assessment ABSTRACT A reinforced concrete half-joint bridge consists of suspended span dapped-end beams or a full-width deck supported on the nibs of abutments or adjacent beams. The design of their disturbed regions is traditionally performed by means of strut-and-tie modelling. The design provisions found in standards and codes can be used for the assessment of existing structures with minor adjustments. However, current documents provide limited guidance on the incorporation of deterioration aspects such as corrosion, insufficient anchorage lengths, and crack formation. Experiments performed on 12 half-joint beams demonstrated the effects of single defects, but synergistic effects were also found to exist and might lead to much higher reductions than expected from the sum of individual defects. These results were compared to different strut-and-tie models (STMs) and the application of STMs to achieve the highest lower bound estimate of the load carrying capacity is discussed. For the beams studied in the current work, the predictions based on codes and standards, combined with appropriate methods to incorporate deterioration effects, led to safe load bearing capacity estimates. However, the developed STMs seem to be, in some instances, unable to pick up alternative load paths that develop as soon as the capacity of a certain tie is reached. Hence the actual capacities might be higher than what is obtained from the STM calculations. 1. Introduction With increasing traffic volumes and load demands in an era of limited resources, there is a pressing need for the accurate strength assessment of aging infrastructure. When assessing the load carrying capacity of existing bridges, the influence of factors including dete- rioration and previous repair works are often disregarded since current code provisions or guidelines do not provide sufficient guidance. However, the de la Concorde Overpass collapse in 2006 [1], killing 5 people, emphasises the importance of proper inspections, maintenance, and adequate assessment techniques. Reinforced concrete half-joints, such as de la Concorde Overpass, provide specific challenges with respect to their assessment. A half-joint bridge consists of suspended span dapped-end beams or a full-width deck supported on the nibs of abutments or adjacent beams (Fig. 1). Advantages of this type of bridge detailing are the suitability for pre- cast construction [2] and a reduced construction depth with a level running surface along the bridge deck and the support spans. Dis- advantages are the vulnerability of the structures to deterioration at the nib due to seepage of chloride-rich water through the expansion joints and the existence of large regions that are not easily accessible for inspection or repair. Common issues raised during half-joint bridge assessments are [3]: • Deterioration of the concrete and/or reinforcement • Inconsistencies between the as-built and as-designed internal steel reinforcement • Non-compliance of half-joints with current code provisions Deterioration processes, such as carbonation, chloride ingress, and freeze-thaw cycles, mean that the mechanical properties of the concrete and steel will alter over the lifetime of a reinforced concrete half-joint. The extent to which these processes affect the compressive strength, tensile strength and modulus of elasticity of the concrete can be sig- nificant [4]. During the design process, the reinforcement detailing can be carefully considered and specified, but in practice, the execution might prove to be difficult due to dense reinforcement cages or a lack of ac- cessibility to certain regions within a specific half-joint geometry. These alterations might have a significant impact on the load carrying capa- city of a structure and inconsistencies should be carefully analysed during the assessment. The misplacement of some of the reinforcing https://doi.org/10.1016/j.engstruct.2018.01.013 Received 10 February 2017; Received in revised form 31 December 2017; Accepted 5 January 2018 ⁎ Corresponding author at: Department of Civil and Environmental Engineering, Brunel University London, Kingston Lane, UB8 3PH Uxbridge, UK. E-mail address: [email protected] (P. Desnerck). Engineering Structures 161 (2018) 41–54 Available online 02 February 2018 0141-0296/ © 2018 The Authors. Published by Elsevier Ltd. This is an open access article under the CC BY license (http://creativecommons.org/licenses/BY/4.0/). T
Transcript of Strut-and-tie models for deteriorated reinforced concrete ...
Contents lists available at ScienceDirect
Engineering Structures
journal homepage: www.elsevier.com/locate/engstruct
Strut-and-tie models for deteriorated reinforced concrete half-joints
Pieter Desnercka,b,⁎, Janet M. Leesb, Chris T. Morleyb
a Department of Civil and Environmental Engineering, Brunel University London, Kingston Lane, UB8 3PH Uxbridge, UKbDepartment of Engineering, University of Cambridge, UK
A R T I C L E I N F O
Keywords:Strut-and-tie modellingCorrosionDeteriorationSynergistic effectsReinforced concrete half-jointsAssessment
A B S T R A C T
A reinforced concrete half-joint bridge consists of suspended span dapped-end beams or a full-width decksupported on the nibs of abutments or adjacent beams. The design of their disturbed regions is traditionallyperformed by means of strut-and-tie modelling. The design provisions found in standards and codes can be usedfor the assessment of existing structures with minor adjustments. However, current documents provide limitedguidance on the incorporation of deterioration aspects such as corrosion, insufficient anchorage lengths, andcrack formation.
Experiments performed on 12 half-joint beams demonstrated the effects of single defects, but synergisticeffects were also found to exist and might lead to much higher reductions than expected from the sum ofindividual defects. These results were compared to different strut-and-tie models (STMs) and the application ofSTMs to achieve the highest lower bound estimate of the load carrying capacity is discussed.
For the beams studied in the current work, the predictions based on codes and standards, combined withappropriate methods to incorporate deterioration effects, led to safe load bearing capacity estimates. However,the developed STMs seem to be, in some instances, unable to pick up alternative load paths that develop as soonas the capacity of a certain tie is reached. Hence the actual capacities might be higher than what is obtained fromthe STM calculations.
1. Introduction
With increasing traffic volumes and load demands in an era oflimited resources, there is a pressing need for the accurate strengthassessment of aging infrastructure. When assessing the load carryingcapacity of existing bridges, the influence of factors including dete-rioration and previous repair works are often disregarded since currentcode provisions or guidelines do not provide sufficient guidance.However, the de la Concorde Overpass collapse in 2006 [1], killing 5people, emphasises the importance of proper inspections, maintenance,and adequate assessment techniques.
Reinforced concrete half-joints, such as de la Concorde Overpass,provide specific challenges with respect to their assessment. A half-jointbridge consists of suspended span dapped-end beams or a full-widthdeck supported on the nibs of abutments or adjacent beams (Fig. 1).Advantages of this type of bridge detailing are the suitability for pre-cast construction [2] and a reduced construction depth with a levelrunning surface along the bridge deck and the support spans. Dis-advantages are the vulnerability of the structures to deterioration at thenib due to seepage of chloride-rich water through the expansion jointsand the existence of large regions that are not easily accessible for
inspection or repair.Common issues raised during half-joint bridge assessments are [3]:
• Deterioration of the concrete and/or reinforcement
• Inconsistencies between the as-built and as-designed internal steelreinforcement
• Non-compliance of half-joints with current code provisions
Deterioration processes, such as carbonation, chloride ingress, andfreeze-thaw cycles, mean that the mechanical properties of the concreteand steel will alter over the lifetime of a reinforced concrete half-joint.The extent to which these processes affect the compressive strength,tensile strength and modulus of elasticity of the concrete can be sig-nificant [4].
During the design process, the reinforcement detailing can becarefully considered and specified, but in practice, the execution mightprove to be difficult due to dense reinforcement cages or a lack of ac-cessibility to certain regions within a specific half-joint geometry. Thesealterations might have a significant impact on the load carrying capa-city of a structure and inconsistencies should be carefully analysedduring the assessment. The misplacement of some of the reinforcing
https://doi.org/10.1016/j.engstruct.2018.01.013Received 10 February 2017; Received in revised form 31 December 2017; Accepted 5 January 2018
⁎ Corresponding author at: Department of Civil and Environmental Engineering, Brunel University London, Kingston Lane, UB8 3PH Uxbridge, UK.E-mail address: [email protected] (P. Desnerck).
Engineering Structures 161 (2018) 41–54
Available online 02 February 20180141-0296/ © 2018 The Authors. Published by Elsevier Ltd. This is an open access article under the CC BY license (http://creativecommons.org/licenses/BY/4.0/).
T

bars was noted in the investigations into the de La Concorde Overpasscollapse [5].
Code provisions have changed over the last few decades. Back in the1960s and 1970s, the shear provisions, for example, were typically lessstringent than they are in current codes. In some cases, minimum shearreinforcement ratios were not required [6] and, hence, older half-jointsbeing assessed today might fail the assessment by default as they lackthe minimum amount of shear links. Mitchell et al. [7] compared an-chorage requirements for half-joints provided by historical and currentversions of the PCI Handbook [8]. They concluded that there were caseswhere the older design guidance underestimated the need for ancho-rage measures and might provide insufficient protection against shearfailure.
Hence, deterioration, inconsistencies and non-compliance withcurrent codes can all create concerns when performing assessments.IAN 53/04 ‘Concrete Half-Joint Deck Structures’ [9] states that asses-sors should use their engineering judgement to take into account thedeteriorated state of the half-joint during capacity checks, includinglikely reinforcement section loss and any delamination of the concretecover. BA 39/93 [10] on the ‘Assessment of reinforced concrete half-joints’ provides a method to evaluate crack widths (in the serviceabilitylimit state) and emphasises the importance of accounting for corrosioneffects in the calculations of the ultimate load capacity. In addition, IAN53/04 specifically mentions the use of strut-and-tie methods (STM) toassess the remaining load carrying capacity of reinforced concrete half-
joints. However, no specific guidance is provided on how to account forcertain defects detected during inspections. The way in which dete-rioration and inadequate anchorage conditions should be dealt withremains unknown.
This paper summarizes the basis of the STM for assessment and STMprovisions available in selected design codes. An experimental programexploring the impact of reinforcement layout, anchorage and concretecracking on the structural capacity of half-joints is briefly discussed,after which the accuracy and validity of the current STM provisions areevaluated in the context of the experimental program.
2. Strut-and-tie method
The application of strut-and-tie methods for the assessment of re-inforced concrete half-joints, differs from how STMs would be used inthe design of new construction. Assessors are no longer able to designand place tensile reinforcement freely, but have to comply with theprovided reinforcement layout of the structure under assessment. Otherdesign options, such as the selection of the preferred concrete qualityand strength, are also no longer available. Nevertheless, the use of aSTM for assessment shows significant similarities to an STM designprocess. A typical STM design process can be split up into 3 mainphases:
• Step 1: Defining the B- and D-regions
Nomenclature
Abbreviations and notations
α residual bond factor (range of 0.15–0.40) [–]αs angle between compressive strut and adjoining tension tie
[–]αcr bond reduction factor [–]β bar type coefficient (0.70 in case of deformed bars in
tension) [–]εs tensile strain in concrete in direction of tension tie [–]γmb partial safety factor ranging between 1.25 and 1.4 [–]λ ratio of actual to provided bond length [–]ν reduction factor [–]σc,st concrete compressive stress in strut [MPa]σs,st steel compressive stress in strut reinforcement [MPa]σs,tie steel tensile stress in tie reinforcement [MPa]Ac,st effective concrete area of the strut [mm2]As,st area of provided compressive reinforcement along strut
[mm2]As,tie area of provided tensile reinforcement along tie [mm2]Atr area of transverse reinforcement [mm2]D0 original reinforcing bar diameter [mm]db reinforcement bar diameter [mm]dp depth of pit corrosion [mm]e distance between the bearing plate and the reinforcing bar
[mm]
fbd design bond strength assuming perfect bond conditions[MPa]
fbd,red reduced bond strength [MPa]fc′ concrete compressive strength [MPa]fcd design concrete compressive strength [MPa]fck characteristic concrete compressive strength [MPa]fc,u allowable concrete compressive stress [MPa]fn lateral pressure [MPa]fs steel stress at critical section [MPa]fy yield stress of reinforcing steel [MPa]fyd design yield stress of reinforcing steel [MPa]Fn,st bar force in a strut [N]Fn,tie bar force in a tie [N]Fult ultimate failure load of half-joint [N]Fult, exp experimentally obtained ultimate failure load of half-joint
[N]Fult, STM ultimate failure load of half-joint according to STM [N]la actual provided anchorage length of reinforcing bar [mm]ld anchorage length of reinforcing bar [mm]STM strut-and-tie method]s spacing of reinforcing bars [mm]t depth of the strut [mm]w width of the strut [mm]xb, xy dimension of remaining cross-sectional area after corro-
sion [mm]xc, xc dimension of pitting corrosion [mm]
Lower nib ofhalf-joint
Drop-in span
Half-joint
Joint
Upper nib ofhalf-joint Drop-in
span
Fig. 1. Half-joint principle for reinforced concretebridges.
P. Desnerck et al. Engineering Structures 161 (2018) 41–54
42

• Step 2: Development of a strut-and-tie model
• Step 3: Design of individual STM members
Each of these phases is discussed below, with emphasis on the half-joint specific aspects. In Section 3, the modifications when applyingSTMs to the assessment of existing reinforced concrete half-joints willbe discussed in more detail.
2.1. Defining B- and D-regions
When designing reinforced concrete half-joints, the half-joint beamscan be divided into B- and D-regions [11]. B-regions are those zoneswhere the hypothesis of Bernoulli holds, whereas D-regions are areas ofdiscontinuities in which the hypothesis is no longer valid. B-regions areusually assessed using ‘normal’ beam theory, while for D-regions STMmethods can be used [12].
In order to identify the extent of a D-region, the St.-Venant’s prin-ciple can be applied [13]. For half-joints, it is generally accepted[11,13–15] that the D-region extends into the full-depth section of thebeam over a distance beyond the nib that is equal to the depth of thebeam itself, as illustrated in Fig. 2.
Once the D-region has been identified, the bending moments, shearforces, and axial forces can be determined at the B-region/D-regioninterface.
2.2. Development of a strut-and-tie model
A strut-and-tie model consists of 3 main components: struts, ties,and nodes. The struts carry the compressive forces, and the ties are thetension members in the model. Nodes, or nodal areas, represent thepoints where the struts and ties meet [16].
For a given half-joint, a strut-and-tie model is not unique. The STMonly requires that equilibrium and the yield criteria are satisfied anddoes not require strain compatibility. It is a lower bound plasticitymethod [11]. Hence, numerous strut-and-tie models can be mapped onto a specific half-joint design, as long as the external applied loads andreaction forces are in equilibrium with the assumed distribution of in-ternal forces and the stresses developed in the struts, ties and nodes arewithin acceptable limits.
Several methods have been developed to identify possible strut-and-tie models, these are all based on elastic solutions [13]. With respect tohalf-joints, the most commonly used STMs can be grouped into one ofthree categories (see Fig. 3) that depend on the reinforcement layout.These are diagonal, orthogonal or combination models. In Europe, adiagonal reinforcement bar is often used to transfer (part of) the appliedload from the nib to the full-depth section of the beam, leading to e.g. adiagonal strut-and-tie model (Fig. 3a) [17]. An approach more commonin the US, however, is to provide a substantial amount of longitudinalreinforcement in the nib that extends sufficiently far into the full-depthsection in conjunction with a reasonable amount of transverse steel inthe full depth beam. This leads to orthogonal strut-and-tie models(Fig. 3b–d) [7,13,18]. More complex ‘combination type’ strut-and-tiemodels have been proposed for half-joints with diagonal bars [19–21]e.g. as shown in Fig. 3e.
Based on the reinforcement layout of the assessed half-joint struc-ture, the engineer has to select a model where the tension ties line upwith the reinforcement bars as closely as possible. A compressive strutcan be freely placed as long as the angle between the strut and ties iswithin reasonable limits and the integrity of the concrete at that loca-tion is guaranteed. The chosen angle should be large enough to avoidstrain incompatibilities. Several codes and guidelines suggest aminimum angle, such as 25° in ACI318 [22]. Furthermore, ACI318 al-lows ties to cross, but states that struts should only intersect or overlapat nodes. In Eurocode 2 [16] no explicit minimum value of the anglebetween the struts and ties is stipulated although 10% higher concretestresses are allowed for angles above 55°. AASHTO, on the other hand,
penalises the allowable concrete stress in struts at small angles [23].
2.3. Design of individual STM members
Once the forces in the different members of a particular strut-and-tiemodel have been determined, the allowable stresses in the individualmembers need to be verified. The stresses in all members should notexceed the allowable stresses under the applied (factored) load, in orderto deem the half-joint to be safe.
2.3.1. StrutsThe concrete compressive stress in the strut σc,st, can be calculated
from:
= +F σ A σ An st c st c st s st s st, , , , , (1)
where Fn,st is the bar force in the strut obtained from the static trussanalysis, Ac,st is the effective concrete area of the strut, As,st is the area ofprovided compression reinforcement along the strut, and σs,st is thecompressive stress in the reinforcement at the given strut force. Thisstress can be taken to be equal to the design yield stress of the re-inforcing steel, fyd, when the yield strength is reached.
The effective concrete area of the strut Ac,st is determined by thewidth of the strut, w, and the depth t of the strut. The depth t can betaken as equal to the thickness of the specimen according to Eurocode 2[16] and ACI 318 [22] unless the supports are narrower in which casethe width of the strut should be taken to be equal to the width of thesupport for struts originating at the support. AASHTO [23] applies amore conservative approach for struts that are anchored by reinforce-ment. The effective concrete area of the strut in such cases has a widthof 6 bar diameters (or 8 as suggested by Mitchell et al. [24]) from theanchoring bars (Fig. 4).
The applied concrete compressive stress in the strut σc,st should notexceed the allowable concrete stress fc,u. This allowable stress, alsoreferred to as effective stress or limiting compressive stress, has beenthe subject of much debate, but is generally assumed to be a fraction(less than or equal to 1) of the concrete compressive strength fc′:
= ′f υfc u c, (2)
The factor ν takes into account the effect of concrete cracking andtensile strains transverse to the strut. Table 1 provides an overview ofallowable stresses suggested by several researchers and found in codeprovisions.
As mentioned earlier, the AASHTO provisions take into account theangle αs between the compressive strut and the adjoining tension ties inthe determination of fc,u:
=′
+⩽ ′f
fε
f0.8 170
0.85c uc
c,1 (3)
for which:
= + +ε ε ε cot α( 0.002)s s s12 (4)
Fig. 2. B- and D-region for half-joint specimen.
P. Desnerck et al. Engineering Structures 161 (2018) 41–54
43

where εs is the tensile strain in the concrete in the direction of thetension tie. In this way, even struts with very small angles can be takeninto account, although their contribution will be small as can be seen inEqs. (3) and (4).
2.3.2. TiesThe stress induced in a reinforcing tie of a reinforced concrete half-
joint, σs,tie, can be calculated from:
=F σ An tie s tie s tie, , , (5)
where Fn,tie is the bar force in the tie obtained from the static trussanalysis and As,tie is the area of the provided tensile reinforcement. Theinduced stress σs,tie is limited to the reinforcement design yield stress fyd.Reference is made to fib Bulletin 45 [11] for guidance on incorporatingthe effect of tendons in pre-/post-tensioned elements.
According to Yun and Ramirez [27], concrete ties can be used incases where steel reinforcement cannot be, or is not, provided. Theysuggest that the effective tensile stress level of a concrete tie can betaken as the smallest of the concrete rupture modulus or the tensionfailure stress of two-dimensional plain concrete under biaxial com-pression-tension loading which is approximately 0.1 fc′ [28]. However,concerns can be raised over this approach given the brittle nature ofconcrete tensile failure and the fact that the concrete tensile capacitycan reduce over time (e.g. due to shrinkage, creep or corrosioncracking). In light of these concerns, in the current work concrete tieswill not be used.
2.3.3. NodesA multi-directional stress state exists in nodes, where compressive
struts and tension ties intersect. The strength of a node is dependent on
the tensile straining (due to the tension ties), the confinement providedby compressive struts and the transverse reinforcement [29]. Four typesof nodal conditions can be identified (Fig. 5). CCC or TTT type nodesare fairly rare in half-joint strut-and-tie models as most nodes are of theCCT or CTT type (Fig. 3). In several nodes of, e.g. the combination-typehalf-joint, more than 3 bars are joined. But, based on the modifiedhydrostatic approach, these can be converted to a series of closelylinked 3 bar nodes as will be discussed later.
The allowable compressive stress in a node is determined by ap-plying a reduction factor to the compressive strength of the material.Table 2 summarizes the proposed allowable nodal stresses as found inthe selected literature and code provisions.
It is common practice to apply the classic method of hydrostaticnode construction for the assessment of nodal zones [11]. For nodeswhere more than three members intersect, a modified hydrostatic ap-proach as proposed by Schlaich and Anagnostou [30] can be taken(Fig. 6) to maintain a set of concurrent forces.
An important aspect of nodal zones is the anchorage check for thetension ties. Reinforcing bars need to be anchored properly to allow tiesto develop their full capacity. Codes [22,23,31] generally agree that theanchorage length of a tie can be taken from the point where the re-sultant tension tie force enters the extended nodal zone, as illustrated inFig. 7.
Tension ties in CCT and CTT nodes experience lateral pressure fromthe compressive strut. Therefore, Bergmeister et al. [32] suggest thatthe confinement action due to the lateral pressure reduces the requireddevelopment length ld. Based on test results, they suggested the fol-lowing expression for ld:
Fig. 3. Common strut-and-tie models for reinforcedhalf-joints: (a) diagonal model, (b), (c) and (d) or-thogonal models, and (e) combination type model.
A
A
AA
≤ 8db db
concrete
area
anchoring
bar
Fig. 4. Strut width according to AASHTO of a strutanchored by reinforcement.
P. Desnerck et al. Engineering Structures 161 (2018) 41–54
44

=′ −
+ + +l
d f fc d A B
[(3 / ) 50]1.2 3 /d
b s c
b
1/2
(6)
with
= ⩽A A f sd( )/(3.4 ) 3.0tr y b (7)
= − ⩽B f e(2.4 /58000) 6.0n1/2 2 (8)
where db is the bar diameter, Atr is the area of transverse reinforcement(normal to the plane of splitting through the anchored bars [33]), fs isthe steel stress at the critical section, e is the distance between thebearing plate and the reinforcing bar, fn is the lateral pressure, and s isthe spacing of the bars. The equation takes into account the lateralpressure up to a distance of e=350mm.
3. Use of Strut-and-Tie methods for the assessment of RC Half-Joints
The design principles and guidelines discussed in Section 2, can be
Table 1Allowable stress levels in concrete struts.
Allowable stress level Concrete strut Proposed by
0.80 fc′ Undisturbed and uniaxial state of compressive stress that may exist for prismatic struts Schlaich et al. [13]0.68 fc′ Tensile strain and/or reinforcement perpendicular to the axis of the strut may cause cracking parallel to the strut with
normal crack width0.51 fc′ Tensile strain causing skewed cracks and/or reinforcement at skew angles to the struts' axis0.34 fc′ For skew cracks with extraordinary crack widths. Skew cracks would be expected if modelling of the struts departed
significantly from the theory of elasticity's flow of internal forces
0.85 fc′ Moderately confined diagonal struts going directly from point load to support with shear span to depth ratio less than 2.0 Alshegeir [25]0.75 fc′ Struts forming arch mechanism0.50 fc′ Arch members in pre-stressed beams and fan compression members0.95 fc′ Undisturbed and highly stressed compression struts
1.00 ν2 fc′* Uncracked uniaxially stressed struts or fields MacGregor [26]0.80 ν2 fc′* Struts cracked longitudinally in bulging compression fields without transverse reinforcement0.65 ν2 fc′* Struts cracked longitudinally in bulging compression fields with transverse reinforcement0.60 ν2 fc′* Struts in cracked zone with transverse tension from transverse reinforcement0.30 ν2 fc′* Severely cracked webs of slender beams with θ=30°0.55 ν2 fc′* Severely cracked webs of slender beams with θ=45°
0.85 fc′ Struts with uniform cross-sectional area along length ACI 318 [22]0.64 fc′ Struts located in a region of a member where the width of the compressed concrete at mid-length can spread laterally
(bottle-shaped struts) and with transverse reinforcement0.51 fc′ Struts located in a region of a member where the width of the compressed concrete at mid-length can spread laterally
(bottle-shaped struts) and without transverse reinforcement0.34 fc′ Struts located in tension members or the tension zones of members0.51 fc′ All other cases
1.00 fcd** Compressive struts without tensile stresses in transverse direction Eurocode 2 [16]0.60 ν′ fcd** Compressive struts with tensile stresses in transverse directionmin (fc′/(0.8+ 170ε1); 0.85 fc′) Compressive strut at an angle with adjoining tension tie AASHTO [23]
* With ν2= 0.5+1.25/√(fc′).** With fcd taken as the design concrete compressive strength and ν′=1-fck/250, fck the characteristic concrete compressive strength.
T
T T
TC
TT
C C
C
C
Fig. 5. Different types of nodes: CCC, CCT, CTT and TTT.
Table 2Allowable stress levels in nodal zones.
Allowable stress level Nodal zone Proposed by
0.85 fc′ CCC nodes Schlaich et al. [13]0.68 fc′ Nodes where reinforcement is anchored in or crossing the node
1.00 ν2 fc′* Nodes bounded by compressive struts and bearing areas0.85 ν2 fc′* Nodes anchoring one tension tie MacGregor [26]0.70 ν2 fc′* Nodes anchoring tension ties in more than one direction
0.85 ϕ fc′** Nodal zones bounded by compressive struts and bearing areas AASHTO [23]0.75 ϕ fc′** Nodal zones anchoring one-direction tension tie0.65 ϕ fc′** Nodal zones anchoring tension ties in more than one direction
0.85 fc′ Nodal zone bounded by struts, bearing areas, or both0.68 fc′ Nodal zones anchoring one tie ACI 318 [22]0.51 fc′ Nodal zones anchoring two or more ties
ν′ fcd*** Compression nodes where no ties are anchored at the node Eurocode 2 [16]0.85 ν′ fcd*** Compression - tension nodes with anchored ties provided in one direction0.75 ν′ fcd*** Compression - tension nodes with anchored ties provided in more than one direction
* With ν2= 0.5+1.25/√(fc′).** With ϕ being a capacity reduction factor for bearing (taken as 0.70 in ACI318-14 [22]).*** Where fcd is the design concrete compressive strength and ν′=1-fck/250.
P. Desnerck et al. Engineering Structures 161 (2018) 41–54
45

used as the basis for a STM assessment process for existing reinforcedconcrete half-joints.
Bridge inspection reports can provide information about the in-tegrity of the concrete and inform the potential location of struts.Existing crack patterns can also be used to identify the principal tensileand compressive stress directions at certain points in the half-joint, andhence the potential orientation and location of compressive struts.
The entire process in itself can become iterative. The calculation ofthe stresses in individual members in a strut-and-tie model might in-dicate that the allowable stresses have been exceeded or the re-inforcement detailing provides insufficient anchorage. In such cases,the width of the struts can be adjusted (if the physical dimensions of thespecimen allow) or the forces in the bars can be limited to reduce thedemand on the anchorage. In this way, an iterative process is initiated.When additional iteration steps and corresponding adjustments nolonger lead to an increase in load carrying capacity, the process can bestopped. The maximum load, carried by the STM, that was in com-pliance with the equilibrium requirements and yield analysis, and thatdoes not lead to stresses exceeding the allowable levels, can be con-sidered to be the load carrying capacity of the assessed half-joint.
However, limited knowledge and guidance is available with respectto the incorporation of defects, deterioration and/or construction errorsin the assessment of reinforced concrete half-joints. When corrosion isdetected BA38/98 [34] can be used, whereas for insufficient anchorage,Clark [35] has published recommendations.
3.1. Corrosion of tension ties
One of the most commonly detected deterioration outcomes in re-inforced concrete half-joints is the corrosion of (part of) the steel re-inforcing bars. According to guidance published by the UK HighwaysAgency (BA 51/95 [36]), general corrosion (over an extensive length ofthe rebar) should be taken into account by assuming the strength loss ofthe bar is proportional to the section loss (Fig. 8(a)) [36]. The re-maining bar cross-sectional area can be taken as π·xb·yb/4 where xb andyb are measured in perpendicular directions and either xb or yb is theminimum width (Fig. 8(b)) when corrosion is detected mostly on oneside of the rebar. BA38/98 [34] states that for local corrosion (e.g.pitting corrosion), the sectional loss can be accounted for in a similarway to general corrosion. The width xc and depth yc of the pittingcorrosion are measured (Fig. 8(c) and (d)) and the total cross-sectionalarea is reduced by xc·yc. For more irregular boundaries of damage, asshown in Fig. 8(e), an approximation of the un-corroded cross-sectionalarea can be made based on the net cross-sectional area.
Fig. 6. Example of a modified hydrostatic node.
Fig. 7. Anchorage length of a tension tie.
y
x
x
y
Dr
y
x
)c()b(
)e()d(
(a)
b
b
c
c
c
c
Fig. 8. Residual steel cross-section according toBA38/98 (based on [34]).
P. Desnerck et al. Engineering Structures 161 (2018) 41–54
46

Other sources have suggested that the effect of pitting corrosionshould be dealt with in a more conservative way (Fig. 9). Rodriguezet al. [37,39] suggest that the residual cross-sectional area of the cor-roding steel bar should be limited to a circular cross-section which fitsbelow the maximum pit depth dp (see Fig. 9a), although several re-searchers, including Harnisch [40], have shown this approach to behighly conservative. Val et al. [38] developed a dome-shaped corrosionpit model as shown in Fig. 9(b), which was later extended by Dar-mawan [41].
In all these cases, although the steel corrosion is considered to re-duce the cross-sectional area, the steel properties are assumed not to beaffected. Zhu and Francois [42] tested reinforcing bars with corrosionlevels up to 50% and confirmed that, if the cross-sectional area loss istaken into account, the yield strength and rupture strength of the barsare not greatly affected by corrosion.
One important aspect to remember is that the STM is based on thelower bound theorem of plasticity and hence is only valid when ade-quate ductility can develop within the structure. Sufficient ductility ofthe concrete should be confirmed and a check of the reinforcing steelquality during the assessment (regardless of its corroded state) is ad-vised.
3.2. Anchorage of ties
In the STM, reinforcing bars are assumed to be able to develop theirfull tensile strength and have a constant force over the length of the tie.Hence, full anchorage of a reinforcing bar is necessary to assume yieldwill occur. If an insufficient bond length is provided, the tie can’t de-velop its full capacity and a limit should be applied to the maximumforce that can be taken by the tie. Clark [35] suggests an ultimate limitshould be applied to the assessment force of a bar Fn,tie,ult of:
=Fαβγ
f πd ln tie ultmb
c b a, ,(9)
where la is the actual provided anchorage length of the bar (which isless than the full anchorage length), α is the residual bond strengthfactor in the range of 0.15–0.40, β is the bar type coefficient (0.70 incase of deformed bars in tension) and γmb is a partial safety factor equalto 1.4, unless the worst credible concrete strength is used, in which caseit is equal to 1.25.
As an alternative approach to the more rigorous method describedabove, a reduction factor λ can be applied to all the tension ties within astrut-and-tie model based on their anchorage conditions [35]. Thefactor λ is calculated as the ratio of the actual bond length to the re-quired anchorage length (if sufficient anchorage is provided, λ is takenas equal to 1.0). It is emphasised that this method does not strictlysatisfy the requirements of a lower bound method, but does provide asimplified approach.
3.3. Concrete cracking
Little to no guidance is provided by codes and standards on how toaccount for cracking in the assessment of structures by means of strut-and-tie methods. Minor crack formation is indirectly taken into accountin STMs by means of the effective stress levels. In zones where tensilestresses (and hence cracks) might develop, the allowable effective stressof the strut is reduced, as discussed in Section 2.3.1. However, this doesnot cover all the types of cracks that can occur in reinforced concretehalf-joints where, for example, deterioration has led to additionalcracks.
Mander and Scott [43] studied alkali-silica reaction (ASR) and de-layed ettringite formation (DEF) in beams and developed an appro-priate strut-and-tie method. The expansive nature of the ASR/DEFprocess was modelled and the confining action of reinforcement andcompressive forces in the struts accounted for. This resulted in forces
reflecting the ASR/DEF expansion strains being introduced into theSTM at the nodes.
One of the major causes of concrete cracking in existing structuresis, however, corrosion. Due to the formation of expansive corrosionproducts at the surface of the reinforcing bars, longitudinal cracks alongthe bars might develop. As this phenomenon is rarely addressed in STMrelated documents, there is little guidance for assessors to account forlongitudinal cracks in their assessments. However, research on bondcapacities of corroded reinforcing bars has proven anchorage capacitiescan be significantly reduced due to crack formation [44].
Desnerck et al. studied the effect of cracks on the bond behaviour ofreinforcing bars subjected to different levels of confinement [45]. Theresults showed a reduction of the bond capacity as high as 65% in somecases. A potential method to take this reduction into account in STMassessments, is by applying a bond factor αcr to the bond strength of theconcrete:
=f α fbd red cr bd, (10)
where fbd,red is the reduced bond strength and fbd is the design bondstrength (assuming perfect bond conditions). For direct pull-out speci-mens considered in [45], the bond factor αcr was found to be 0.85 forhighly confined bars with a single crack or 0.70 in the case of doublecracked regions. The corresponding values were 0.40 and 0.30 for un-confined single and double cracked specimens respectively [45]. Fur-ther work needs to be done to determine reduction factors for otherscenarios, and evaluate the applicability of these factors to RC half-jointbeams.
Despite the fact that there is recognition that concrete cracking cansignificantly reduce the anchorage capacity of reinforcing bars in con-crete [44,45], the potential impact of concrete cover spalling has notbeen quantified for half-joint structures, e.g. in [9].
In order to gather insight in the effect of improper anchorage,concrete cracking in the anchorage zone and changes in the reinforce-ment layout on the load carrying capacity of reinforced concrete half-joints, a large-scale half-joint experimental program was undertaken.The results of the study are used to help evaluate the accuracy of theSTM and the potential for modifying the STM to reflect deteriorationprocesses.
4. Experimental program
In the experimental program, different anchorage, reinforcementlayouts, concrete quality and anchorage zone cracking conditions (atotal of 12 scenarios) were tested and analysed. A total of six beamseach with two half-joint ends were cast. Further details can be found in[46].
)b()a(
D0 D0
Dr
dp dp
a
Fig. 9. Residual cross-section after pitting corrosion according to (a) Rodriguez [37] and(b) Val and Melchers [38].
P. Desnerck et al. Engineering Structures 161 (2018) 41–54
47

4.1. Test setup and scenarios
The half-joint beams had an overall height of 700mm and a reducedheight at the nib of 325mm, a length of 3320mm and a thickness of400mm. The beams were cast using a normal strength (C30/37) or lowstrength (C12/15) concrete according to European strength classes [31]with a maximum aggregate size of 10mm. After curing for 72 h, thespecimens were stored in a standard lab environment (21 ± 2 °C and arelative humidity of 70 ± 10% as measured by a relative humidity/temperature sensor) until the date of testing (27–35 days).
A reference half-joint was designed according to STM principles andis shown in Fig. 10. The bottom reinforcement consisted of 5 bars with adiameter of 25mm, 5 bars of diameter 20mm were used as top re-inforcement and the shear reinforcement consisted of two-legged stir-rups with a diameter of 10 mm in the D-region, while three-leggedstirrups with a diameter of 10mm were used in the B-region (over-reinforced to avoid premature shear failure in the central section of thebeam). In the nib, 4 diagonal reinforcing bars with a diameter of 12mmwere placed, as well as 3 U-shaped reinforcing bars with a diameter of12 mm. The anchorage length of the individual bars (especially the U-bars and diagonal bars) are also indicated in Fig. 10. All reinforcementbars were ribbed and their mechanical properties are given in Table 3.
The beams were tested in three-point bending under a stepwiseincreasing central load until failure at one half-joint end occurred. Thespecimens were then unloaded, the support at the failed end movedinwards, and the loading restarted until failure occurred at the oppositeend as well. During the test, the applied load, deformations, strains inthe reinforcing bars at multiple locations and crack pattern were re-corded. More information about the applied test setup, casting processand instrumentation can be found elsewhere [46].
An overview of the different parameter combinations is given inTable 4 indicating the aspects incorporated into the different specimens[46,47]. As a first step, a series of specimens were designed to evaluatethe impact of changes in the reinforcement layout and omittance ofcertain reinforcing bars. As such, a reference specimen (NS-REF), aspecimen without diagonal bars (NS-ND), without U-Bars (NS-NU) andwith a reduced number of shear links (NS-RS) were tested.
In specimen NS-AD, the anchorage of the diagonal bars was reducedby removing the hooked anchorage. The cross-sectional area of the barsin the inner nib region (see Fig. 10) were reduced by 50% in specimenNS-LR to mimic localised corrosion. This was achieved by locally mil-ling down the bars as will be discussed in a later section.
The impact of anchorage cracking was evaluated using specimensNS-CC&AL (locally cracked concrete around the ends of the bottom
reinforcement) and NS-PS&AL (local insertion of a plastic sheet at theends of the bottom reinforcement) as shown in Fig. 11. In both cases,only 2 tensile reinforcing bars were provided over the full length of thespecimen, whereas the remaining three bars were curtailed at theirintersection with the diagonal bar. In specimen NS-CC&AL, two sets ofthree cracked cylinders with a length of 110mm were placed aroundthe longitudinal bottom reinforcement bars anchorage zone, with aspacing of 10mm to allow for the placement of the stirrups. The plasticsheet applied in specimen NS-PS&AL, was placed in the same zone asthe cracked cylinders were placed for NS-CC&AL (last 340mm of thereinforcing bar).
In the final test series, the impact of a lower concrete compressivestrength (15.4 MPa at the age of testing) and synergistic effects wassimulated. A lower concrete strength reference specimen (LS-REF), anda specimen with a combination of reduced shear reinforcement and thecurtailment of the bottom bars, LS-AB&RS&AL, were tested. SpecimenNS-PS&AD&AL combined the insertion of a plastic sheet at the ancho-rage zone of the bottom reinforcement with improper anchorage of thediagonal bar, while specimen LS-PS&AD&RS&AL further reduced thecapacity by also reducing the concrete strength.
All the test specimens are schematically shown in Fig. 12.
4.2. Test results
The maximum load applied to the specimens (considered to be thefailure load Fult) was recorded for all the beams and is reported inTable 5. Both reference specimens obtained a failure load of over400 kN even though a weaker concrete was used in LS-REF than in NS-REF, indicating that for the given reinforcement layout the concretestrength was not governing the failure. The impact of reducing theamount of shear reinforcement to about 50% in the D-region or theintroduction of cracks around the bottom reinforcement (by means ofcracked cylinders or plastic sheets) seemed to have a small impact onthe load carrying capacity. When the diagonal bars or U-bars were notplaced, or when a local reduction of the reinforcing bar diameters at the
Fig. 10. Geometry and dimensions of experimentalhalf-joint specimens NS-REF and LS-REF.
Table 3Mechanical characteristics of the reinforcing bars.
ϕ [mm] fy [MPa] fu [MPa]
10 539 59612 529 55925 578 674
P. Desnerck et al. Engineering Structures 161 (2018) 41–54
48

inner nib zone was applied, the loss in the load carrying capacity wasaround 40% relative to the original capacity of the equivalent referencebeam.
Synergistic effects occurred when several defects were combined,leading to a strength reduction of more than 55% in the worst casescenario (LS-PS&AD&RS&AL).
5. STM predictions of load carrying capacity
For all the 12 experimentally tested half-joints, a statically de-terminate STM was developed according to the principles discussed inSections 2 and 3, and based on the actual reinforcement layout anddeterioration state. In order to be able to compare the obtained STMfailure load predictions with the experimentally obtained results, allload factors and material safety factors were set to unity. The STM tieforces were compared to the experimentally measured reinforcing steelstresses recorded by means of strain gauges. In this way, the impact ofvarious parameters on the failure loads predicted by the STM, Fult,STM,can be analysed. The comparisons were performed using the meanvalue of the recorded stresses since strain gauges were mounted to thereinforcing bars closest to the concrete outer surface on both sides ofthe specimen. Stresses measured at a specific location in the specimenwere considered to be representative of the stress in the tie in thecorresponding STM model. Special care was taken when strain gaugeswere located close to cracks to assure the measurements reflected theoverall bar stresses rather than local phenomena linked to the crackformation.
Table 6 provides a comparison of the experimentally recordedfailure loads of the specimens and the STM predictions.
For all the specimens, the predicted load carrying capacity from theSTM was governed by the yielding of the reinforcing bars (under-re-inforced half-joint) or insufficient anchorage lengths, rather than ex-ceeding the capacity of the concrete struts. This was the case even forthe lower concrete strength specimens. The longitudinal reinforcingsteel bars had a diameter of 25mm which, even according to AASHTOprinciples, allowed for the use of the full width (minus the concretecover layer as indicated in Fig. 4) of the specimen in the STM. For allthe beams, the five possible STM combinations shown in Fig. 3 wereconsidered, and the location of the nodes was optimised based on the
reinforcement layout, the allowable stresses in the concrete struts/nodes as per EC2 provisions and the force redistribution in the differentbars. The STM leading to the highest lower bound was selected.
With respect to criteria used for evaluating the capacity of thecompressive struts, all the approaches detailed in Table 2 were con-sidered. No concrete ties were used (given the concerns raised earlier).
The impact of the different parameters on the STM predictions andthe corresponding experimental results are discussed in detail in thefollowing.
5.1. Influence of the compressive strength
The strut-and-tie model for NS-REF is shown in Fig. 13. The modelconsists of ties along the bottom longitudinal bars, along the U-bars andalong the diagonal bars. Additional ties are provided by the stirrups(the first and second stirrup were grouped in the STM – an assumptionwhich was verified during the nodal checks). Compressive struts arepositioned along the top reinforcement, in the nib, and in the full depthsection, completing a combination type model as shown in Fig. 3e.
The position of the deflection point B on the diagonal bar and thelocation of the node C at the top of the first vertical tie (representing thefirst and second stirrup) were determined by an iterative process to takefull advantage of the provided reinforcement. By repositioning thenodes, the load distribution in the diagonal bar and the stirrups can bealtered to achieve the highest failure load. The strut-and-tie modelpredicts that the half-joint should have a load carrying capacity Fult,STMof 336.5 kN when the strut AB makes an angle of 67.6° with the hor-izontal and the strut BC is at an angle of 28.5°.
At the predicted STM failure load of 336.5 kN, the diagonal tie aswell as the first stirrups reach their yield strength almost simulta-neously (the measured reinforcing steel stresses in the diagonal barsand the first stirrup at a load of 336.5 kN were 533MPa and 494MParespectively). The required bar force FFG of 134.8 kN could be properlyanchored with the five bars with a diameter of 25mm over the providedanchorage length. However, whereas the strut-and-tie model predictsstresses in the U-bars of 406MPa, experimental data shows that thesebars were yielding as well. A potential explanation might be that in theactual test, the positions of the struts are not fixed in time and hencemight rotate as soon as certain bars are yielding in order to redistributeforces and develop higher load carrying capacities. This hypothesis issupported by the observed crack pattern. Cracks initially formed in thenib at an angle of 60° with the horizontal at load levels of about 200 kN,whereas at a higher load level of 300 kN, cracks formed at an angle of45° as shown in Fig. 14.
The comparison with the actual experimental data shows that theSTM provides a safe underestimation of the load carrying capacity (theactual failure load Fult,exp was 402 kN) which is expected from a plas-ticity-based lower bound method. The STM underestimates the actual
Table 4Specifications of different tested reinforced concrete half-joints.
Specimen Concrete strength Omitted or reduced area Anchorage Cracking
C12/15 C30/37 Diagn. bars U-bars Stirrups Local reduct. Diagn. bars Bottom bars Cracked cylinder Plastic sheet
NS-REF XNS-ND X XNS-NU X XNS-RS X XNS-LR X XNS-AD X XNS-CC&AL X X XNS-PS&AL X X XLS-REF XLS-AB&RS&AL X X XLS-PS&AD&AL X X X XLS-PS&AD&RS&AL X X X X
Fig. 11. Induced anchorage cracking for specimens NS-CC&AL and NS-PS&AL.
P. Desnerck et al. Engineering Structures 161 (2018) 41–54
49

failure load by about 16%.A similar strut-and-tie model can be developed for specimen LS-
REF, which was cast with a lower grade concrete. Due to the lowercompressive strength, the anchorage lengths are increased, however,the provided anchorage length for the bottom reinforcement still
suffices. Therefore, the same failure load as for NS-REF is predicted bythe STM.
The experiments confirmed that the concrete strength was not cri-tical, and the specimen failed at a load of 400 kN. The critical compo-nents once again were shown to be the diagonal tie and first stirrupsand a similar crack rotation was noted. The initial cracks appeared at anangle of 60°, while cracks occurring at higher loads formed at an angleof 47°.
5.2. Influence of the reinforcement layout
The impact of the reinforcement layout was investigated by com-paring specimens NS-NU, NS-ND, and NS-RS.
When no U-bars are provided, the combination type STM can nolonger develop. In this specimen, the external forces exerted by thesupports are carried to the top of the nib by a compressive strut andfrom that point they are transferred to the full depth section by meansof a tension tie along the diagonal reinforcement bars and a compres-sive strut at the top of the specimen (diagonal type STM as shown inFig. 3a). In diagonal type strut-and-tie models, the assessor has limitedpossibilities for optimising the load sharing between the differentcomponents. The position of node B (Fig. 15) is determined by the lo-cation where the compressive strut AB and the diagonal reinforcing tiemeet.
Fig. 12. Reinforcement layouts of the different tested half-joints.
Table 5Specifications for the different tested reinforced concrete half-joints.
Specimen Fult [kN] Failure mode
NS-REF 402.3 Rupture of bars at inner nib zoneNS-ND 244.9 Rupture of diagonals bars and first stirrupNS-NU 295.8 Rupture of U-bars and first stirrupNS-RS 358.7 Shear failure with crack originating at bottom
cornerNS-LR 261.9 Rupture of bars at inner nib zoneNS-AD 394.6 Shear failure combined with spalling and
debonding of bottom barsNS-CC&AL 367.6 Anchorage failure bottom reinforcementNS-PS&AL 385.0 Anchorage failure bottom reinforcementLS-REF 400.0 Rupture of bars at inner nib zoneLS-RS&AL 302.8 Shear failure combined with spalling and
debonding of bottom barsLS-PS&AD&AL 234.9 Anchorage failure bottom reinforcementLS-PS&AD&RS&AL 177.1 Anchorage failure bottom reinforcement
P. Desnerck et al. Engineering Structures 161 (2018) 41–54
50

As shown in Fig. 15, the first four stirrups do not contribute to thetruss and hence the obtained failure load is significantly lower than forthe reference specimen. The ultimate failure load predicted by the STM,Fult,STM, was found to be 207.0 kN at which point yielding of the diag-onal reinforcing bar is induced.
The actual recorded failure load of the specimen, Fult,exp, was295.8 kN indicating the STM model underestimated the failure load byabout 30%. The recorded stresses in the diagonal bars were 448MPa ata load level of 207 kN, which were lower than the yield stress predictedby the STM at this load level. During the experiments yielding of thediagonal bars was noted at 250 kN. Experimental data also showedsignificant stresses being built up in the first stirrup. At a load of 207 kN(the STM predicted failure load), the steel stresses in the first stirrup are
around 260MPa. The subsequent stirrups carry little or no load and themeasured steel stresses are below 20MPa. This seems to indicate that,although the crack pattern confirms the verticality of strut AB [46], aload path is being developed in the specimen where the first stirrup isactivated as a tie.
When no diagonal bar is present (specimen NS-ND), neither acombination type STM nor a diagonal type STM can develop. Fig. 16shows the orthogonal STM mapped onto the reinforcement layout ofspecimen NS-ND. The location of node C was varied in order to influ-ence the load sharing between the different ties that line up with thestirrups and the U-bar. Failure in the STM was reached at a load of149.0 kN and was governed by the yielding of the U-bars as well as thefirst stirrup.
The actual failure load of 244.9 kN for specimen NS-ND was sig-nificantly higher than the calculated Fult,STM of 149.0 kN, leading to anunderestimation of the failure load by the STM of 39%. The failuremode is predicted correctly in that the experimental specimen failed
Table 6Comparison of experimental and STM failure loads.
Specimen Fult,exp [kN] Fult,STM [kN] Fult,STM/Fult,exp [%] Controlling element in STM
NS-REF 402.3 336.5 83.6% Yielding of diagn. bars and first stirrupNS-ND 244.9 149.0 60.8% Yielding of U-bars and first stirrupNS-NU 295.8 207.0 70.0% Yielding of diagonal barsNS-RS 358.7 261.0 72.8% Yielding of diagn. bars and stirrupsNS-LR 261.9 187.0 71.4% Yielding of diagn. bars and U-barsNS-AD 394.6 181.0 45.9% Anchorage of diagonal barNS-CC&AL 367.6 288.5 78.4% Anchorage of longitudinal barsNS-PS&AL 385.0 312.0 81.0% Anchorage of longitudinal barsLS-REF 400.0 336.5 84.1% Yielding of diagn. bars and first stirrupLS-RS&AL 302.8 246.0 81.2% Yielding of diagn. bars and first stirrupLS-PS&AD&AL 234.9 113.0 48.1% Anchorage of diagonal and long. barsLS-PS&AD&RS&AL 177.1 76.0 42.9% Anchorage of diagn. bars and yielding 1st stirrup
Fig. 13. Strut-and-tie model for specimens NS-REF and LS-REF.
Fig. 14. Crack formation and crack angle in the nib of specimen NS-REF.
Fig. 15. Strut-and-tie model for specimen NS-NU.
Fig. 16. Strut-and-tie model for specimen NS-ND.
P. Desnerck et al. Engineering Structures 161 (2018) 41–54
51

due to the yielding (and rupture) of the U-bars and first stirrup.However, the experimentally determined load at which the first stirrupstarted to yield was 200.8 kN, whereas the U-bars started to yield at aload of 216 kN. The possibility of the existence of a concrete tie at thelocation of the missing diagonal bar is unlikely. The crack initiated atthe inner nib of the specimen and had grown significantly by the time aload level of 125 kN was reached, cutting the entire zone in which aconcrete tie could develop.
Reducing the amount of shear reinforcement had a significant im-pact on the predicted failure load. The combination type STM for NS-RSshows high similarities with the one for NS-REF. Due to the reducedamount of stirrups, however, the location of the ties was adjusted andthe tie capacity significantly reduced. In this way, a predicted failureload of 261 kN was obtained at which point the first stirrup, secondstirrup as well as diagonal bars were predicted to yield simultaneously.The calculated stresses in the U-bar at this point were only 150MPa.
The experimental results confirmed the failure to be due to theyielding of the first stirrup and diagonal bar, but at a much higher loadlevel of 358.7 kN. At this point, the U-bars were close to yielding aswell, which is not reflected in the STM.
5.3. Influence of detailing
The impact of a reduced anchorage length due to improper detailingis taken into account in strut-and-tie models at the level of the nodalchecks where the capacities of the ties are reduced based on theavailable anchorage length (see Section 3.2).
For specimen NS-AD, the maximum load carrying capacity as de-termined by the STM is governed by the anchorage capacity of the di-agonal bar at the lower end of the bar (the STM model as shown inFig. 13 was applied). Due to the limited anchorage length (in thisspecimen the bend and extension of the bar along the bottom re-inforcement was not provided), only a limited force can be developed inthe diagonal bar (see Fig. 17). This results in a failure load for NS-AD of181 kN which represents a slight increase in Fult,STM of 32 kN whencompared to NS-ND, a case where the diagonal bar was not present. Ithas to be noted that the allowable force in the diagonal tie of 41.1 kNwas determined using the simplified method (ratio of provided to re-quired bond length) as proposed by Clark [35] using the EuroCode 2provisions [31] for calculating the required anchorage length and set-ting all safety factors to 1.0. When the more elaborate approach, usingEq. (9) is used, a lower allowable tie force is obtained, reducing Fult,STMto 170.5 kN.
The tested specimen NS-AD failed at 394.6 kN which is a muchhigher load than the STM prediction. The beam exhibited a shear failureand debonding of the bottom reinforcing bars (which was initiated bythe debonding of the diagonal reinforcement).
The discrepancy between the STM predictions and the experimen-tally determined failure load can possibly be explained using themeasurements of the steel stresses in the diagonal reinforcing bars.Whereas the EuroCode 2 (without applying safety factors) accounts fora bond strength of 5.1 MPa for the ribbed reinforcing bars and concretecompressive strength used in the current work, the experimentallymeasured steel stresses indicate much higher bond stresses. At themoment of failure (394.6 kN), the strain gauges recorded a reinforcingsteel stress of 160MPa in the diagonal bars at a distance of 20mm fromthe end of the bar. Assuming a uniform stress distribution over theanchorage length of the bar, this results in an average bond stress of24MPa. This value is in line with experimentally determined pull-outbond strengths for similar bar diameters and concrete strengths[45,48]. When a bond strength of 24MPa is applied in the STM, theultimate failure load increases significantly to 300.5 kN at which pointanchorage failure of the diagonal bar occurs simultaneously withyielding of the first stirrup and U-bars. Although applying a higher bondstrength of 24MPa leads to an improvement in the predicted failureload, special care needs to be taken when other reinforcement layout,
concrete strengths and/or confinement conditions are considered. Ap-plying bond strength values as provided by the standards and guidelineswill, in most cases, provide a safe lower limit to the actual failure load.
5.4. Influence of deterioration
The impact of deterioration outcomes were investigated in the ex-perimental program in two ways. In specimen (NS-LR), a local reduc-tion of the steel bar diameters at the nib were used to mimic localcorrosion in the nib reinforcement, while in specimens NS-PS&AL andNS-CC&AL the impact of crack formation in the anchorage zone of thelongitudinal reinforcement was studied. In practice longitudinal crackscould form due to expansive forces generated in the concrete due tosteel corrosion.
A combination type model similar to that of NS-REF (see Fig. 13)was found to be relevant for specimen NS-LR. The location of the tiesand struts were unchanged, however, the capacity of the diagonal bars,U-bars, and first stirrup were reduced. Despite the fact that only acentral part of the rebars was milled down to 50% of their originalsection in the STM, the capacity of the entire tie was reduced accord-ingly. The STM predicted failure load turned out to be 187.0 kN withthe critical elements being the diagonal bars and U-bars that simulta-neously reached their yield capacity.
The yielding of the diagonal bars and U-bars was confirmed in theexperiments, and shortly after the yielding of these bars, the first stirrupstarted to yield as well. The specimen finally failed due to the rupture ofall the bars in the inner corner of the nib at a failure load of 261.9 kN,which means the STM model prediction was 71.4% of the actual failureload.
With respect to the specimens NS-PS&AL and NS-CC&AL, the cur-rent codes and standards do not provide any guidance on how to dealwith cracks in the anchorage zone. Hence, applying standard strut-and-tie methods (and a combination type STM as in Fig. 13) would lead tosimilar capacities for reference specimens as for the specimen with in-duced cracks along the bottom reinforcement. When the longitudinalcracks are taken into account, according to the principles described inSection 3.3, Fult,STM would expect to be reduced. In the case of NS-CC&AL, a confined state of double cracking exists in the anchorage zone ofthe longitudinal bottom bars. Whereas in the case of NS-PS&AL thesituation is more analogous to a confined single cracked anchoragezone. In both specimens, the confinement is provided by the shearstirrups crossing the crack planes in the anchorage zone. The ultimateloading capacity in both cases is limited by the anchorage capacity of
lb
Fig. 17. Provided anchorage length of diagonal reinforcement assuming a hydrostaticnodal zone.
P. Desnerck et al. Engineering Structures 161 (2018) 41–54
52

the longitudinal reinforcement and hence the force that can build up inthe tie FG (see Fig. 13). For specimen NS-PS&AL a predicted failure loadof 312.0 kN is obtained, while NS-CC&AL has a lower Fult,STM of288.5 kN due to a higher penalty for double cracked anchorage zones.However, it has to be emphasized that the bottom reinforcing bars arewell confined by the stirrups and, hence, the bond properties of half-joint structures with reduced confinement or with alternative geome-tries/reinforcement lay-outs might differ siginificantly. Further re-search needs to be done to develop a specific methodology to accountfor anchorage zone cracking.
The experimental results confirm that the strength capacity of NS-CC&AL was lower than that of NS-PS&AL. Both specimens failed due tothe debonding of the longitudinal reinforcement. The failure loads were367.6 kN and 385.0 kN respectively or 27.4% and 23.4% higher thanthe predicted values. The maximum force that was built up in sectionFG along the longitudinal reinforcement during the experiments was185.6 kN for NS-PS&AL and 167.0 kN for NS-CC&AL. Comparing thesenumbers to the STM tie capacity limits of 114.5 kN and 92.5 kN, showsthat the actual forces in the reinforcement were higher than calculatedby the STM. This is most likely due to the high confinement provided bythe stirrups in the anchorage zone.
5.5. Synergistic effects
The impact of changes in the concrete compressive strength on theSTM assessment was small as shown in Section 5.1. However, when thecompressive strength reduction was combined with a reduction in theamount of the reinforcing bars in the anchorage zone and reduced shearreinforcement (specimen LS-RS&AL), the impact of the compressivestrength was reflected in a decrease in the bond strength. Due to thisdecrease in cube compressive strength, fc,cub, from 35.8MPa to15.2 MPa, the required anchorage lengths increased by 75.5%. Giventhe fact that in reducing the amount of shear reinforcement the first andthird stirrup were removed, the first vertical tie in the STM (tie CF inFig. 13) is shifted inwards as well, resulting in an increased availablebond length for tie FG. Hence, the anchorage of the bars turns out not tobe critical in the STM assessment, and the capacity of the beam islimited by the yield strength of the diagonal bars and the shear re-inforcement. An assessed ultimate failure load of 246 kN was obtainedwhich is 81.2% of the experimental value of 302.8 kN.
The predicted failure load drops to 113 kN when, in addition, thediagonal bars are improperly anchored (specimen LS-PS&AD&AL). Inthe STM assessment, both the anchorage of the diagonal bar as well asthe anchorage of the bottom reinforcement become critical. Whereassome redistribution of forces was possible in specimen NS-AD, resultingin higher demands on the stirrups and bottom longitudinal reinforce-ment, this is no longer possible when the anchorage of both bars isreduced as is the case in LS-PS&AD&AL.
The experimental results indeed showed that the failure appeared tobe induced by the debonding of the longitudinal reinforcement, but at afailure load of 234.9 kN which is significantly higher than the predictedload. However, as was the case for NS-AD, the STM model potentiallyunderestimated the anchorage capacity and hence the force developedin the diagonal tie. Experiments indicated a maximum diagonal barforce of 56.2 kN while the STM model only allows for a force of 21 kN,confirming the earlier observation that the high confinement at node G(Fig. 13) allows for the development of higher bond stresses than givenby the EuroCode 2 provisions.
A similar conclusion can be drawn for LS-PS&AD&RS&AL. By re-ducing the amount of shear reinforcement, in addition to the lowercompressive strength and improper anchorage of the diagonal andlongitudinal bars, the capacity decreases to 72.5 kN according to acombination type STM model. The experimentally obtained value,however, is 177.1 kN, indicating an underestimation of more than100%. In contrast to LS-PS&AD&AL, the STM capacity of LS-PS&RS&AD&AL is governed by the anchorage of the diagonal bar and the yield
strength of the shear reinforcement. A redistribution of forces from thediagonal bars to the stirrups and longitudinal reinforcement is nolonger possible due to the low amount of shear reinforcement provided.
6. Conclusions
The design of disturbed regions in reinforced concrete half-joints istraditionally performed by means of strut-and-tie modelling. A trussconsisting of struts and ties is assumed as a system to transfer the forcesthrough the D-region into the B-region. The design provisions found instandards and codes can be used for the assessment of existing struc-tures with minor adjustments. However, current documents providelimited guidance on the incorporation of deterioration aspects such ascorrosion, insufficient anchorage lengths, and crack formation. To re-flect corrosion, a reduction in the cross-sectional area of the reinforcingbar, and thereby the capacity of the tension tie, can be incorporated.Insufficient anchorage lengths can be taken into account using a pro-portional reduction in the tie capacity or by penalising the residualbond capacity. In this paper, suggestions have been made to allow as-sessors to incorporate longitudinal crack formation into the capacitychecks. It is suggested to reduce the bond strength of the concrete by afactor ranging from 0.85 to 0.3 depending on the confinement condi-tions and the crack state. In some cases, the reduction factor can evenbe as low as 0.0.
Experiments performed on 12 half-joint beams demonstrated theeffects of single defects. Synergistic effects also exist and might lead tomuch higher reductions than expected from the sum of individual de-fects.
For the beams studied in the current work, the governing conditionsin the STM assessments turned out to be the capacity and the anchorageconditions of the ties. In all cases, the STM predictions were lower thanthe experimentally obtained capacity, as would be expected from alower bound method. However, the underestimation varied sig-nificantly within a range of 57–16%. A lack of anchorage capacity inthe diagonal bar seemed to be penalised significantly by the STM whereexperimental results indicated a lower reduction in capacity, indicatingfurther research into the anchorage of ties in highly confined nodes isnecessary.
When cracks are present in the anchorage zone, those should not bedisregarded, as current standards and guidelines seem to indicate. Theirimpact on the load carrying capacity was clearly noted during the ex-perimental program. Based on pull-out tests performed on reinforcingbars embedded in cracked concrete, an approach applying reductionfactors to the bond strength is proposed. This reduction factor wouldvary depending on the crack state and the extent of cracking. Furtherresearch is needed to obtain sufficient data to develop a rigorousmethod applicable for half-joints with geometries, reinforcement lay-outs and confinement different from the ones applied in this study.
Based on this study, it can be stated that current codes and stan-dards, combined with recent findings and guidelines on deteriorationeffects, led to safe load bearing capacity estimates for a specific set ofexperimentally tested reinforced concrete half-joints. However, thedeveloped STMs seem to be, in some instances, unable to pick up al-ternative load paths that develop as soon as the capacity of a certain tieis reached. Hence the actual capacities might be higher than what isobtained from STM calculations, however, a wide range of obtainedFult,exp/Fult,STM ratios is obtained indicating assessors should treat theresults with due care.
Acknowledgements
The authors would like to acknowledge the financial support ofEPSRC – the Engineering and Physical Sciences Research Council (UK) –through the EPSRC Project ‘Reinforced concrete half-joint structures:Structural integrity implications of reinforcement detailing and dete-rioration’ [Grant no. EP/K016148/1].
P. Desnerck et al. Engineering Structures 161 (2018) 41–54
53

Additional data related to this publication is available at theUniversity of Cambridge’s institutional data repository: https://doi.org/10.17863/CAM.18300.
References
[1] Johnson P, Couture A, Nicolet R. Commission of inquiry into the collapse of aportion of the de la Concorde overpass – report; 2007.
[2] Mattock A, Chan T. Design and behavior of dapped-end beams. PCI J 1979:28–45.[3] Allison B. The structures management information system (SMIS) database. Bridg.
Manag. 5 Insp. maintenance, Assess. repair; 1999.[4] Desnerck P, Lees JM, Morley CT. Assessment of reinforced concrete half-joint
structures: dealing with deterioration. In: Proc. 2014 PCI conv. natl. bridg. conf.,Washington DC, USA: Precast/Prestressed Concrete Institute; 2014. p. 16.
[5] Mitchell D, Marchand J, Croteau P, Cook W. Concorde overpass collapse: structuralaspects. J Perform Constr Facil 2011;25:545–53.
[6] ACI Committee 318. Building code requirements for reinforced concrete (ACI 318-56). Detroit; 1956.
[7] Mitchell D, Cook W, Peng T. Importance of reinforcement detailing. ACI Spec Publ2010;273:1–16.
[8] Prestressed Concrete Institute. PCI design handbook. 7th ed. Precast/PrestressedConcrete Institute; 2007.
[9] Loudon N. IAN 53/04 – concrete half-joint deck structures; 2004. p. 18.[10] Department of Transportation. BA39/93 assessment of reinforced concrete half-
joints; 1993. p. 22.[11] fib Task Group 4.4. fib Bulletin 45 – practitioners’ guide to finite element modelling
of reinforced concrete structures. Lausanne, Switzerland: International Federationfor Structural Concrete (fib); 2008.
[12] BSI. PD 6687-1:2010 Background Paper to the National Annexes to BS EN 1992-1and BS EN 1992-3. London, UK: British Standards Institution (BSI); 2010.
[13] Schlaich J, Schafer K, Jennewein M. Towards a consistent design of structuralconcrete. PCI J 1987:77–150.
[14] Narayanan R. Precast Eurocode 2: design manual. Leicester, UK: British PrecastConcrete Federation; 2007.
[15] Goodchild C, Morrison J, Vollum R. Strut-and-tie models. Camberley, UK: TheConcrete Centre; 2014.
[16] European Committee for Standardization. EN 1992-1-1 Eurocode 2: design ofconcrete structures – Part 1–1: general rules and rules for buildings. EuropeanCommittee for Standardization; 2004.
[17] Fernández Ruiz M, Muttoni A. On development of suitable stress fields for structuralconcrete. ACI Struct J 2008:495–502.
[18] Tjhin TN, Kuchma DA. Computer-based tools for design by strut-and-tie method:advances and challenges. ACI Struct J 2002;99:586–94.
[19] Wang Q, Guo Z, Hoogenboom P. Experimental investigation on the shear capacityof RC dapped end beams and design recommendations. Struct Eng Mech2005;21:221–35. http://dx.doi.org/10.12989/sem.2005.21.2.221.
[20] Bergmeister K, Breen J, Jirsa J, Kreger M. Detailing for structural concrete. Austin;1993.
[21] Wight J, MacGregor J. Reinforced concrete: mechanics & design. 6th ed. NewJersey, US: Pearson; 2012.
[22] ACI Committee 318. Building code requirements for structural concrete (ACI 318M-14) and commentary (ACI 318RM-14). 1st ed. Farmington Hills, MI, USA: AmericanConcrete Institute; 2014.
[23] AASHTO. LRFD bridge design specifications. 7th ed. American Association of StateHighways and Transportation Officials; 2014.
[24] Mitchell D, Collins M. Revision of strut-and-tie provisions in the AASHTO LRFDbridge design specifications – final report. Dorion, Canada; 2013.
[25] Alshegeir A. Analysis and design of disturbed regions with strut-tie models. PurdueUniversity; 1992.
[26] MacGregor J. Reinforced concrete – mechanics and design. 3rd ed. EnglewoodCliffs, US: Prentice Hall; 1997.
[27] Yun Y, Ramirez J. Strength of struts and nodes in strut-tie model. J Struct Eng1996;122:20–9. http://dx.doi.org/10.1061/(ASCE)0733-9445(1996) 122:1(20).
[28] Kupfer H, Hilsdorf H, Rusch H. Behavior of concrete under biaxial stresses. ACI JProc 1969;66:626–66.
[29] ASCE- ACI committee 445. Recent Approaches to Shear Design of StructuralConcrete. J Struct Eng 1998;124:1375–417. http://dx.doi.org/10.1061/(ASCE)0733-9445(2000)%20126:7(856).
[30] Schlaich M, Anagnostou G. Stress fields for nodes of strut-and-tie models. J StructEng 1990;116:13–23.
[31] European Committee for Standardization. EN 1992-1-2 Eurocode 2: design ofconcrete structures – Part 1-2: general rules – structural fire design. EuropeanCommittee for Standardization; 2008.
[32] Bergmeister K, Breen JE, Jirsa JO. Dimensioning of the nodes and development ofreinforcement. IABSE Reports, vol 62, IABSE Colloqium; 1991. p. 551–6.
[33] Orangun C, Jirsa J, Breen J. A reevaluation of test data on development length andsplices. TX, USA: Austin; 1975.
[34] Department of Transportation. BA38/98 – assessment of the fatigue life of corrodedor damaged reinforcing bars, vol. 16; 1993.
[35] Clark L. IAN53 Half-joint assessment advice – ULS Assessment of half-joints.Highways Agency; 2010.
[36] The Highways Agency. BA 51/95 – the assessment of concrete structures affected bysteel corrosion; 1995.
[37] Rodriguez J, Ortega L, Garcia A. Assessment of structural elements with corrodedreinforcement. In: Swamy R, editor. Proc. int. conf. corros. corros. prot. steel concr.,Sheffield, UK: Sheffield Academic Press; 1994. p. 171–85.
[38] Val D, Stewart M, Melchers R. Effect of reinforcement corrosion on reliability ofhighway bridges. Eng Struct 1998;20:1010–9. http://dx.doi.org/10.1016/S0141-0296(97)00197-1.
[39] Rodriguez J, Ortega L, Casal J, Diez J. Corrosion of reinforcement and service life ofconcrete structure. In: Sjostrom C, editor. Proc. 7th Int. conf. durab. build. mater.components, Stockholm, Sweden; 1996. p. 117–26.
[40] Harnisch J, Raupach M. The residual cross section factor as a key parameter for thestatic evaluation of corroding reinforced concrete structures. Mater Corros2015;66:829–38.
[41] Darmawan M. Pitting corrosion model for reinforced concrete structures in achloride environment. Mag Concr Res 2010;62:91–101.
[42] Zhu W, François R. Experimental investigation of the relationships between residualcross-section shapes and the ductility of corroded bars. Constr Build Mater2014;69:335–45. http://dx.doi.org/10.1016/j.conbuildmat.2014.07.059.
[43] Mander J, Scott R. Guidelines for determining the capacity of D-regions with pre-mature concrete deterioration of ASR/DEF; 2015.
[44] Task Group Bond Models. fib Bulletin 10 – bond of reinforcement in concrete.Lausanne; 2000.
[45] Desnerck P, Lees JM, Morley CT. Bond behaviour of reinforcing bars in crackedconcrete. Constr Build Mater 2015;94:126–36.
[46] Desnerck P, Lees JM, Morley CT. Impact of the reinforcement layout on the loadcapacity of reinforced concrete half-joints. Eng Struct 2016;127:227–39.
[47] Desnerck P, Lees JM, Morley CT. The effect of local reinforcing bar reductions andanchorage zone cracking on the load capacity of RC half-joints. Eng Struct2017;152:865–77. http://dx.doi.org/10.1016/j.engstruct.2017.09.021.
[48] Desnerck P, De Schutter G, Taerwe L. Bond behaviour of reinforcing bars in self-compacting concrete: experimental determination by using beam tests. Mater Struct2010;43:53–62. http://dx.doi.org/10.1617/s11527-010-9596-6.
P. Desnerck et al. Engineering Structures 161 (2018) 41–54
54