Structure of mid-latitude cyclones crossing the California Sierra Nevada as seen by vertically...
16
Structure of mid-latitude cyclones crossing the California Sierra Nevada as seen by vertically pointing radar Socorro Medina, Robert Houze, Christopher Williams and David Kingsmill International Conference on Alpine Meteorology (ICAM), Rastatt, Germany, 15 May 2009
-
date post
19-Dec-2015 -
Category
Documents
-
view
213 -
download
0
Transcript of Structure of mid-latitude cyclones crossing the California Sierra Nevada as seen by vertically...
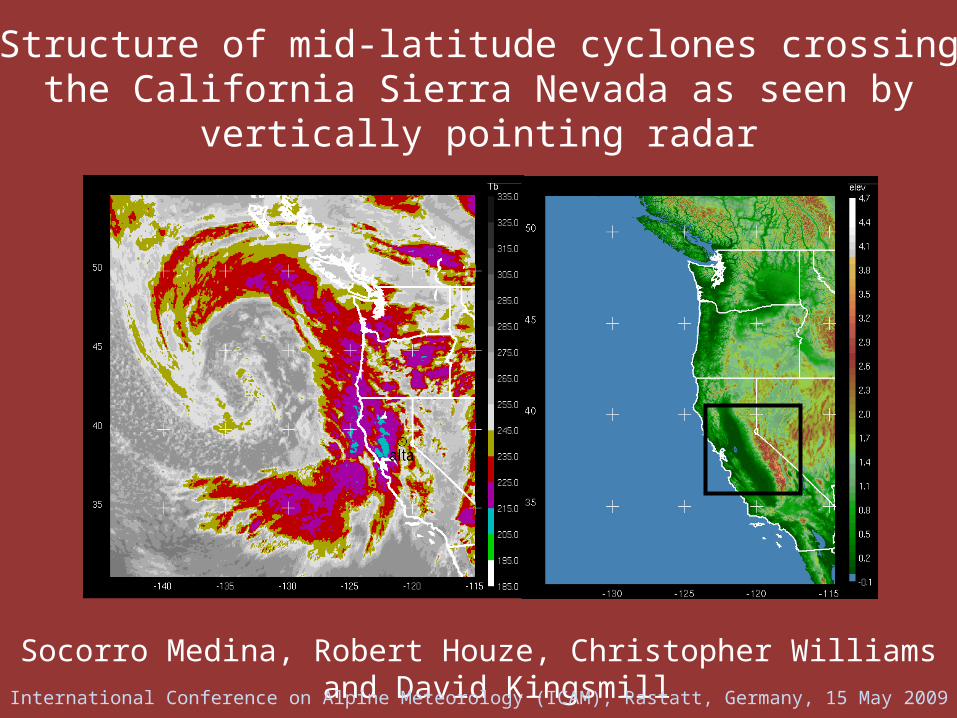
Structure of mid-latitude cyclones crossing the California Sierra Nevada as seen by vertically pointing radar
Socorro Medina, Robert Houze, Christopher Williams and David KingsmillInternational Conference on Alpine Meteorology (ICAM), Rastatt, Germany, 15 May 2009

Sponsored in part by:
NSF Award# ATM-0505739
NSF Award# ATM-0820586
NASA Award# NNX07AD59G
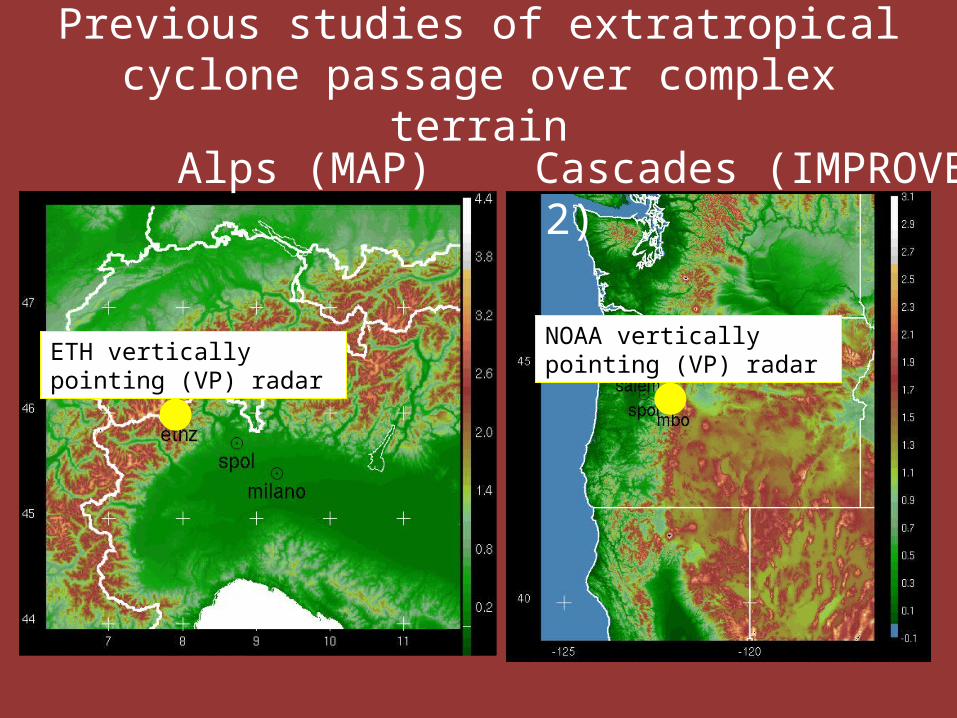
Previous studies of extratropical cyclone passage over complex terrain
Alps (MAP) Cascades (IMPROVE-2)
ETH vertically pointing (VP) radar
NOAA vertically pointing (VP) radar

Alps VP radar data Cascades VP radar data
Time (19991021)09:00 08:00
09:00 08:00
Time (19991021)
REFLECTIVITY (dBZ)
RADIAL VELOCITY (m s-1)
Time (20011214)01:00 00:00
01:00 00:00
Time (20011214)
REFLECTIVITY (dBZ)
RADIAL VELOCITY (m s-1)OBSERVATIONS IN MIDDLE SECTOR OFSTORM, IN STATICALLY STABLE LAYER
WITH STRONG VERTICAL SHEAR TURBULENCE

Conceptual model of dynamical and microphysical mechanisms active when the middle sector of extratropical cyclone passes over a windward slope
Houze and Medina 2005
Updrafts ~1-3 m/sCell width ~1-5 km
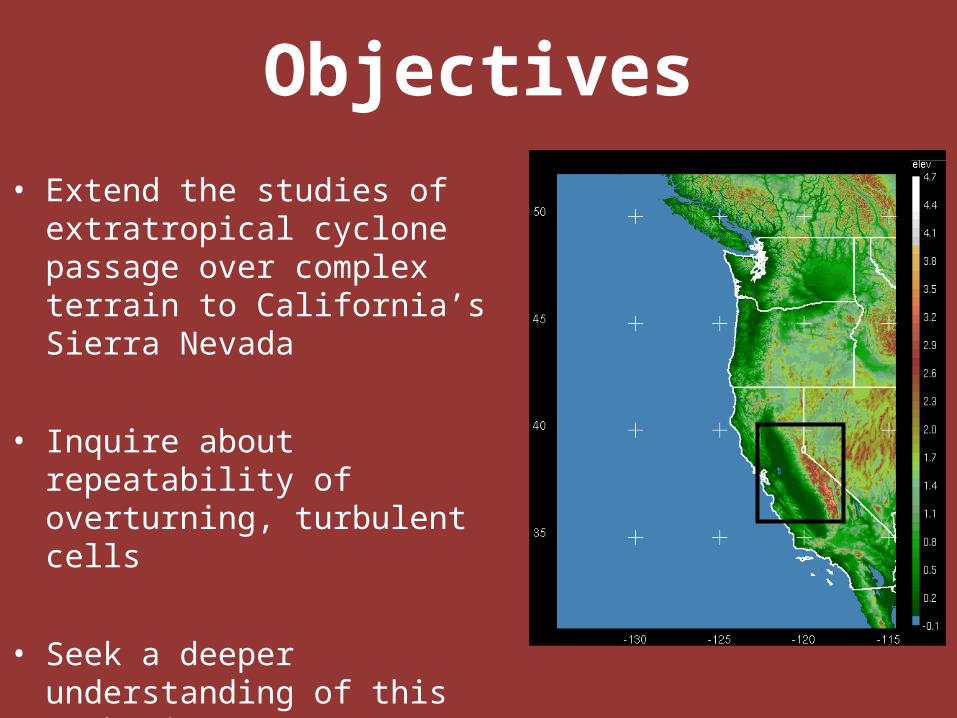
Objectives
• Extend the studies of extratropical cyclone passage over complex terrain to California’s Sierra Nevada
• Inquire about repeatability of overturning, turbulent cells
• Seek a deeper understanding of this mechanism
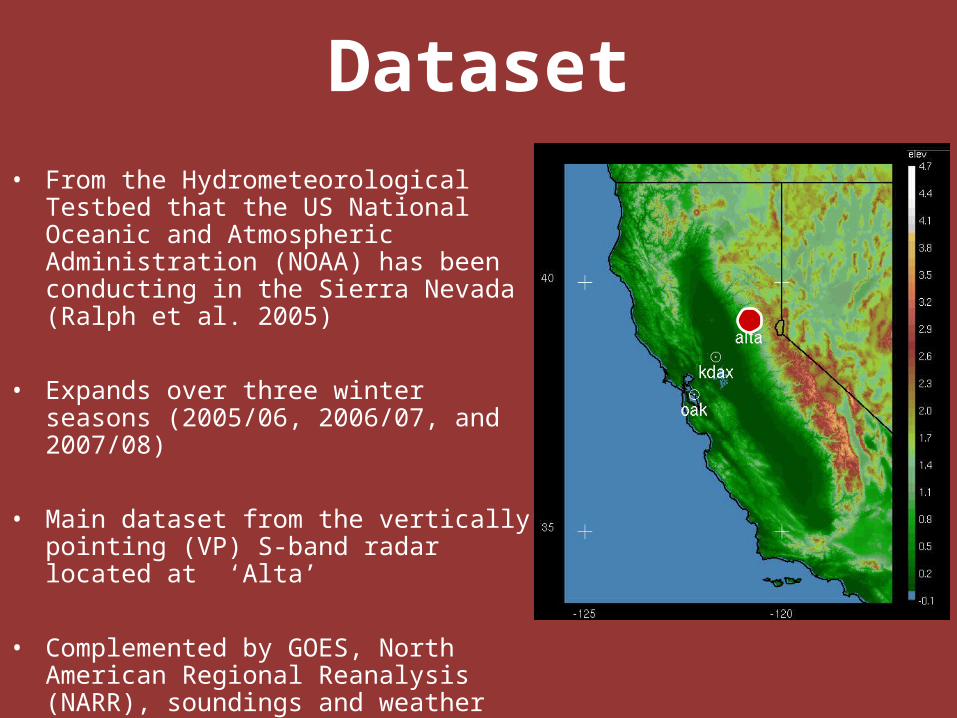
Dataset• From the Hydrometeorological Testbed that
the US National Oceanic and Atmospheric Administration (NOAA) has been conducting in the Sierra Nevada (Ralph et al. 2005)
• Expands over three winter seasons (2005/06, 2006/07, and 2007/08)
• Main dataset from the vertically pointing (VP) S-band radar located at ‘Alta’
• Complemented by GOES, North American Regional Reanalysis (NARR), soundings and weather surveillance radar data
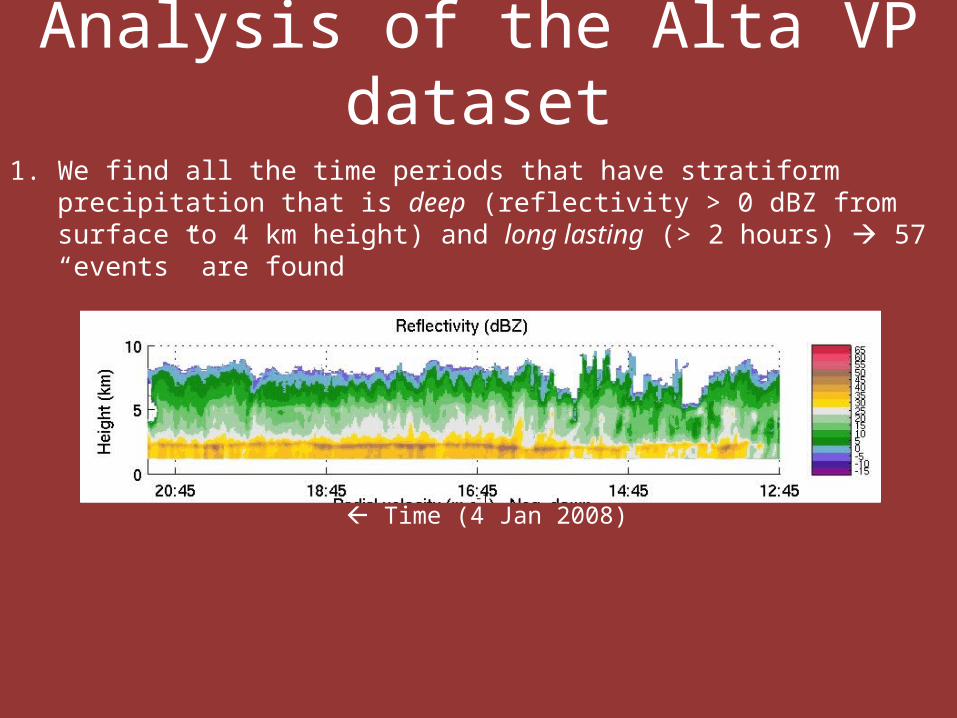
Analysis of the Alta VP dataset
1. We find all the time periods that have stratiform precipitation that is deep (reflectivity > 0 dBZ from surface to 4 km height) and long lasting (> 2 hours) 57 “events” are found
Time (4 Jan 2008)

1. We find all the time periods that have stratiform precipitation that is deep (reflectivity > 0 dBZ from surface to 4 km height) and long lasting (> 2 hours) 57 “events” are found
2. We investigate the upward motions for these events
Analysis of the Alta VP dataset

VP Alta data for 04 Jan 2008 Estimate of upward motions using perturbation radial velocity
Reflectivity (Z = [dBZ])
Radial Velocity [m/s]
1 hr running meanradial velocity [m/s]
Perturbation radialvelocity [m/s]
1. We find all the time periods that have stratiform precipitation that is deep (reflectivity > 0 dBZ from surface to 4 km height) and long lasting (> 2 hours) 57 “events” are found
2. We investigate the upward motions for these events
3. These calculations indicate that ~10 (out of a total of 57 events) have clearly defined, intermittent up and downdrafts, similar to what was seen in the Oregon Cascades and the Alps
Analysis of the Alta VP dataset
1. We find all the time periods that have stratiform precipitation that is deep (reflectivity > 0 dBZ from surface to 4 km height) and long lasting (> 2 hours) 57 “events” are found
2. We investigate the upward motions for these events
3. These calculations indicate that ~10 (out of a total of 57 events) have clearly defined, intermittent up and downdrafts, similar to what was seen in the Oregon Cascades and the Alps
4. Example of 4 Jan 2008 (case shown before)
Analysis of the Alta VP dataset

Synoptic setting of 4 Jan 2008 caseInfrared satellite temperature (~15 UTC)
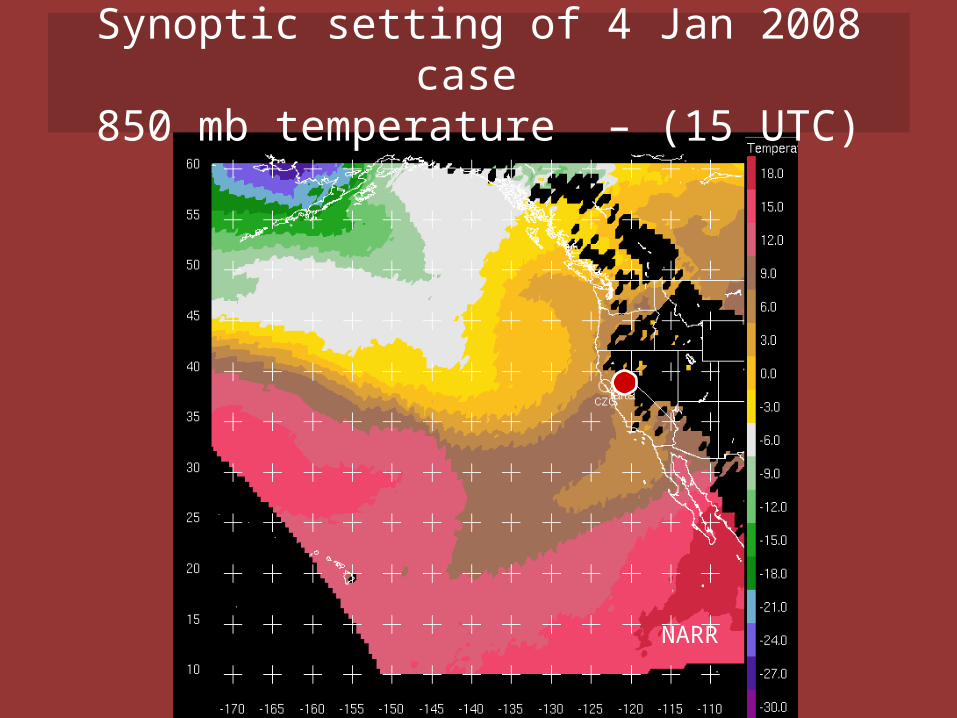
Synoptic setting of 4 Jan 2008 case 850 mb temperature – (15 UTC)
NARR
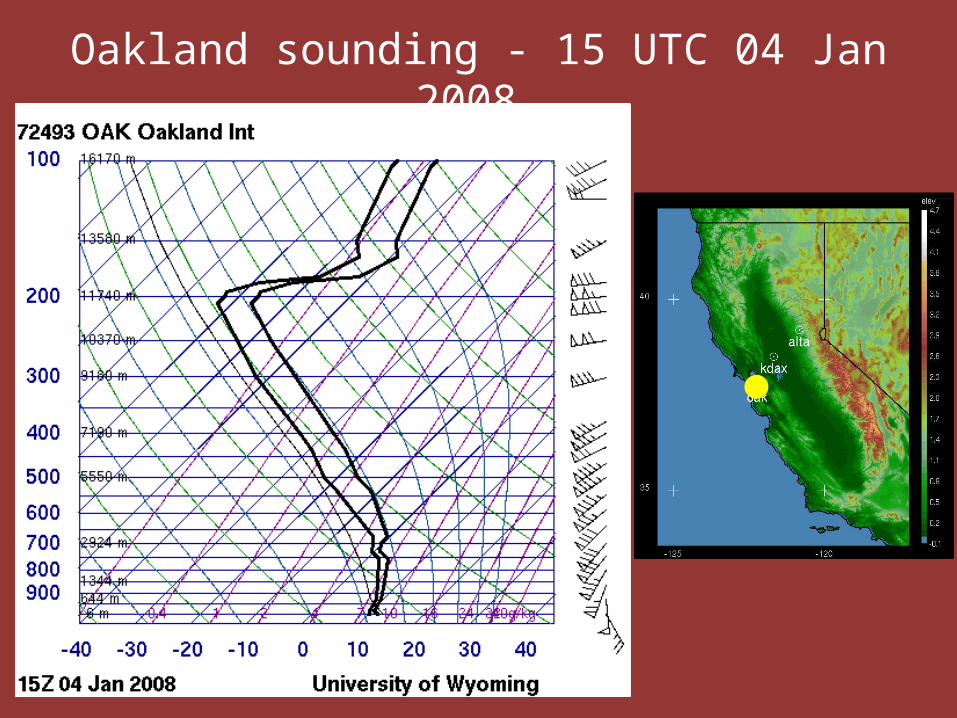
Oakland sounding - 15 UTC 04 Jan 2008
Conclusions• Intermittent cells were clearly defined in at
least ~17% of the deep, long lasting stratiform events in the Sierra Nevada
• Case study analysis suggest that the updrafts occur as the middle sector of the storm passes over the windward slopes, in a statically stable layer and in a region of strong vertically shear i.e., similarly to what was observed in other mountain ranges
FUTURE STEP: Analyze the distribution of updraft magnitude in relationship to shear, static stability, precipitation, etc