Structure and dynamics of water at liquid–vapour interfaces covered by surfactant monolayers of...
6
Structure and dynamics of water at liquid–vapour interfaces covered by surfactant monolayers of neutral stearic acid and charged stearate ions Sandip Paul, Amalendu Chandra ⁎ Department of Chemistry, Indian Institute of Technology, Kanpur, 208016 India Received 9 July 2007; received in revised form 28 December 2007; accepted 3 January 2008 Available online 19 January 2008 Abstract The behaviour of water molecules at liquid–vapour interfaces with a surfactant monolayer of either stearic acid molecules or anionic stearate ions is investigated by means of molecular dynamics simulations. The density and dipolar orientational profiles and also the dynamics of translational and rotational motion of interfacial water molecules are calculated in the present work and the results are compared with the bulk liquid water and also of liquid–vapour interface of surfactant-free water. The present simulation results are also compared with available experimental results of similar interfacial systems with a monolayer of either neutral or ionic surfactants. © 2008 Elsevier B.V. All rights reserved. Keywords: Liquid–vapour interface; Simulation; Stearic acid; Stearate ions 1. Introduction Studies of aqueous surfaces covered by neutral and ionic surfactants have practical implications in many important chemical and biological processes and in industrial applications. Such systems have relevance to processes such as detergent action, lubrication, molecular self assembly, foam stability, mi- croemulsions, vesicle formation etc. [1]. Besides, many biologi- cally important processes occur at aqueous interfaces, e.g., the surface of cell membranes where a multitude of hydrophilic, hydrophobic, neutral or ionized functional groups can be present. An air–water interface covered with a chosen surfactant provides a simplified model system that may prove useful in an attempt to approach this complex problem. Amphiphilic surfactants such as long chain fatty acids, alcohols, amines, etc. form ordered, well- characterized monolayers at the air–water interface [2,3] with the head group immersed in the water phase and the organic tail pointing up in the air [3,4]. This enables one to investigate how the structure of interfacial water is affected by the surfactant head groups as compared to that of free surfaces of water [5,6]. There have been numerous experimental studies of surfac- tant monolayers at the water–vapour interface. Gragson et al. [7] did a comparative study of the different effects of cationic and anionic surfactants on the interfacial water orientation using vibrational sum frequency generation (VSFG) on sodium dodecyl sulfate (SDS) and DDA (dodecyl ammonium) mono- layers at the air–water interface [7]. They observed a flip in orientation of the interfacial water molecules at interfaces with cationic and anionic surfactants. They found that, at the air– water interface with a cationic surfactant monolayer, the inter- facial water molecules align with their oxygen atoms pointing toward the air, i.e., hydrogen atoms of water molecules pointing toward the solution, and the reverse is true for an anionic sur- factant where the interfacial water molecules orient with their oxygen atoms pointed into the solution. There have been several neutron reflection studies of monolayers containing SDS [8,9] and also other types of monolayers, such as those formed from the various C n TAB class of surfactants [10–13]. In addition, a second harmonic generation (SHG) study on aqueous interfaces with the surfactant sodium 1-dodecylnaphthalene-4-sulfonate (SDNS) compared the orientation of the surfactant monolayers at the air–water, water–decane and water–carbon tetrachloride interfaces [14]. Journal of Molecular Liquids 140 (2008) 33 – 38 www.elsevier.com/locate/molliq ⁎ Corresponding author. Fax: +91 512 2597436. E-mail address: [email protected] (A. Chandra). 0167-7322/$ - see front matter © 2008 Elsevier B.V. All rights reserved. doi:10.1016/j.molliq.2008.01.006
-
Upload
sandip-paul -
Category
Documents
-
view
212 -
download
0
Transcript of Structure and dynamics of water at liquid–vapour interfaces covered by surfactant monolayers of...

ids 140 (2008) 33–38www.elsevier.com/locate/molliq
Journal of Molecular Liqu
Structure and dynamics of water at liquid–vapour interfaces covered bysurfactant monolayers of neutral stearic acid and charged stearate ions
Sandip Paul, Amalendu Chandra ⁎
Department of Chemistry, Indian Institute of Technology, Kanpur, 208016 India
Received 9 July 2007; received in revised form 28 December 2007; accepted 3 January 2008Available online 19 January 2008
Abstract
The behaviour of water molecules at liquid–vapour interfaces with a surfactant monolayer of either stearic acid molecules or anionic stearateions is investigated by means of molecular dynamics simulations. The density and dipolar orientational profiles and also the dynamics oftranslational and rotational motion of interfacial water molecules are calculated in the present work and the results are compared with the bulkliquid water and also of liquid–vapour interface of surfactant-free water. The present simulation results are also compared with availableexperimental results of similar interfacial systems with a monolayer of either neutral or ionic surfactants.© 2008 Elsevier B.V. All rights reserved.
Keywords: Liquid–vapour interface; Simulation; Stearic acid; Stearate ions
1. Introduction
Studies of aqueous surfaces covered by neutral and ionicsurfactants have practical implications in many importantchemical and biological processes and in industrial applications.Such systems have relevance to processes such as detergentaction, lubrication, molecular self assembly, foam stability, mi-croemulsions, vesicle formation etc. [1]. Besides, many biologi-cally important processes occur at aqueous interfaces, e.g., thesurface of cell membranes where a multitude of hydrophilic,hydrophobic, neutral or ionized functional groups can be present.An air–water interface covered with a chosen surfactant providesa simplified model system that may prove useful in an attempt toapproach this complex problem. Amphiphilic surfactants such aslong chain fatty acids, alcohols, amines, etc. form ordered, well-characterized monolayers at the air–water interface [2,3] with thehead group immersed in the water phase and the organic tailpointing up in the air [3,4]. This enables one to investigate how thestructure of interfacial water is affected by the surfactant headgroups as compared to that of free surfaces of water [5,6].
⁎ Corresponding author. Fax: +91 512 2597436.E-mail address: [email protected] (A. Chandra).
0167-7322/$ - see front matter © 2008 Elsevier B.V. All rights reserved.doi:10.1016/j.molliq.2008.01.006
There have been numerous experimental studies of surfac-tant monolayers at the water–vapour interface. Gragson et al.[7] did a comparative study of the different effects of cationicand anionic surfactants on the interfacial water orientation usingvibrational sum frequency generation (VSFG) on sodiumdodecyl sulfate (SDS) and DDA (dodecyl ammonium) mono-layers at the air–water interface [7]. They observed a flip inorientation of the interfacial water molecules at interfaces withcationic and anionic surfactants. They found that, at the air–water interface with a cationic surfactant monolayer, the inter-facial water molecules align with their oxygen atoms pointingtoward the air, i.e., hydrogen atoms of water molecules pointingtoward the solution, and the reverse is true for an anionic sur-factant where the interfacial water molecules orient with theiroxygen atoms pointed into the solution. There have been severalneutron reflection studies of monolayers containing SDS [8,9]and also other types of monolayers, such as those formed fromthe various CnTAB class of surfactants [10–13]. In addition, asecond harmonic generation (SHG) study on aqueous interfaceswith the surfactant sodium 1-dodecylnaphthalene-4-sulfonate(SDNS) compared the orientation of the surfactant monolayersat the air–water, water–decane and water–carbon tetrachlorideinterfaces [14].

34 S. Paul, A. Chandra / Journal of Molecular Liquids 140 (2008) 33–38
Recently, Benderskii and Eisenthal [15,16] investigated theeffects of the negatively charged carboxylate group of thestearate ion surfactant CH3(CH2)16COO
− on the solvation dy-namics at the surfactant air–water interface and a direct com-parison was made with the solvation dynamics at aqueoussurface with a monolayer of the neutral stearic acid CH3(CH2)16COOH and the surfactant-free air–water interface [15,16]. Theyfound that the solvation dynamics at the negatively chargedcarboxylate monolayer was significantly slower than that at theinterface with the neutral surfactants and at the surfactant-freeinterface. They proposed that this slowing down is due to theincrease of hydrogen bonding order of water molecules inducedby the electric field of the charged surfactants.
On the theoretical side, there are also a number of moleculardynamics studies at air–water or vapour–water interfaces withsurfactant monolayers [17–22]. Brickmann et al. [17] studiedthe structure of air–water interface covered by a monolayer ofn-hexadecyltrimethylammonium chloride by means of mole-cular dynamics simulation. They analyzed the structure of theinterface in terms of various distance and angular distributionfunctions and they also compared their data with the X-ray andneutron diffraction studies. A molecular dynamics study on theadsorption of p-n-pentylphenol at infinite dilution at the waterliquid–vapour interface was carried out by Pohorille andBenjamin [18]. They calculated the free energy of adsorptionof p-n-pentylphenol at the water–vapour interface and they alsolooked at the orientation of the solute molecules at theinterfacial region. It was found that, at the water surface, thephenol head group is mostly immersed in aqueous solvent. Asthe polar head group is being moved into the solvent, the tailbecomes increasingly aligned to the surface normal such that theexposure of the nonpolar part of the molecule is minimized.They also observed the same effect when phenol was replacedby a more polar head group, phenolate. Klein et al. [19] studiedthe air–water interface with a monolayer of tetradecyltrimethy-lammonium bromide (C14TAB) and found a decrease in thewidths of the headgroup and the hydrocarbon chain distribu-tions with increasing surface area per molecule. Their calculateddensity profiles for the head groups and hydrocarbon tails werefound to be in good agreement with those derived from neutronreflection data. They also reported the distribution functions ofwater molecules and bromide counterions with respect to theheadgroups. The in-plane diffusion constant for the center-of-mass of the C14TAB molecules was also calculated and foundto be of the same order of magnitude as those in lipid–watersystems. Berkowitz et al. [20] carried out molecular dynamicssimulation of water–vapour and water–carbon tetrachlorideinterfaces covered by a monolayer of SDS. It was found that, atthe water–vapour interface, the solute in its most probableconfiguration was bent giving rise to two domains within themolecule: The first containing the head group and severalmethylene groups, was solvated in water; the second containingthe rest of the molecule, lay down on the water surface. Hayashiet al. [21] investigated the infrared spectra and orientationalbehaviour of stearic acid monolayers at the air–water interface.They found that the orientation of the head group does notdepend on the surface area but the chain orientation does.
Recently, Chanda et al. [22] investigated the structural anddynamical properties of a monolayer of the anionic surfactantsodium bis(2-ethyl-1-hexyl) sulfosuccinate (aerosol-OT)adsorbed at the air–water interface.
The primary focus of majority of the above studies was on thestructural and orientational behaviour of the surfactants at air–water interfaces. Whereas, the present study focuses more on thebehaviour of water molecules at surfaces that are covered by asurfactant monolayer. In particular, we have considered twosurfactants, the neutral stearic acid and ionic sodium stearate andwe investigated how the equilibrium and dynamical propertiesof interfacial water are modified in presence of the surfactants.
The rest of the letter is organized as follows. In Section 2, wehave discussed the simulation details and methodology. Sections3 and 4 deal with the results of structural and dynamical prop-erties, respectively, of both the interfaces and our conclusions aresummarized in Section 5.
2. Simulation details and methodology
We first describe the models of the surfactants, water andsodium ions that are employed in the present study. We em-ployed the “polar-H” model for the surfactants where onlyhydrogen atoms attached to the oxygen are explicitly repre-sented and the nonpolar hydrogens are implicitly representedthrough the heavy atoms to which they are attached, i.e., themethylene and methyl groups are considered as united atoms.For the alkyl chain atoms of both stearic acid and stearate ion,we adopted the carbon atom, methyl group, and methylenegroup Lennard–Jones parameters of Jorgensen [23]. The sur-factant chains were made flexible by including the bondstretching, bond bending and torsional interactions [24]. For thehead group atoms of stearic acid we have adopted the OPLSparameters of the atoms of COOH group of acetic acid used byBriggs et al. [25]. The potential parameters of the carboxylatehead group atoms were taken from the studies of Watanabe et al.who simulated micelles of sodium octanoate amphiphiles inaqueous solution [24]. The same partial charges for the carbo-xylate head group have also been used by Balasubramanian etal. [26] in their studies of the dynamics of water molecules nearan aqueous micellar interface of cesium pentadecaflorooctano-ate (CsPFO) in water. The sodium ions are modeled as chargedLennard–Jones atoms [27] and we have used the SPC/E modelfor water [28].
We first carried out a bulk simulation of 864 water moleculesperiodically replicated in all three dimensions. The dimension ofthe simulation box was adjusted according to the experimentaldensity of water at 298 K. After the bulk solution was properlyequilibrated, two empty boxes of equal size were added on eitherside of the original simulation box along the z-direction and thislarger rectangular box (of dimension L×L×3L) was taken as thesimulation box in the next phase of the simulation run and thesystem was reequilibrated by imposing periodic boundary con-ditions in all three directions. This resulted in a liquid slab ofapproximate width L separated by vacuum layers of approximatewidth 2L. Thus, a water–vapour interface was created on bothsides of the box along the z-direction and this system was further
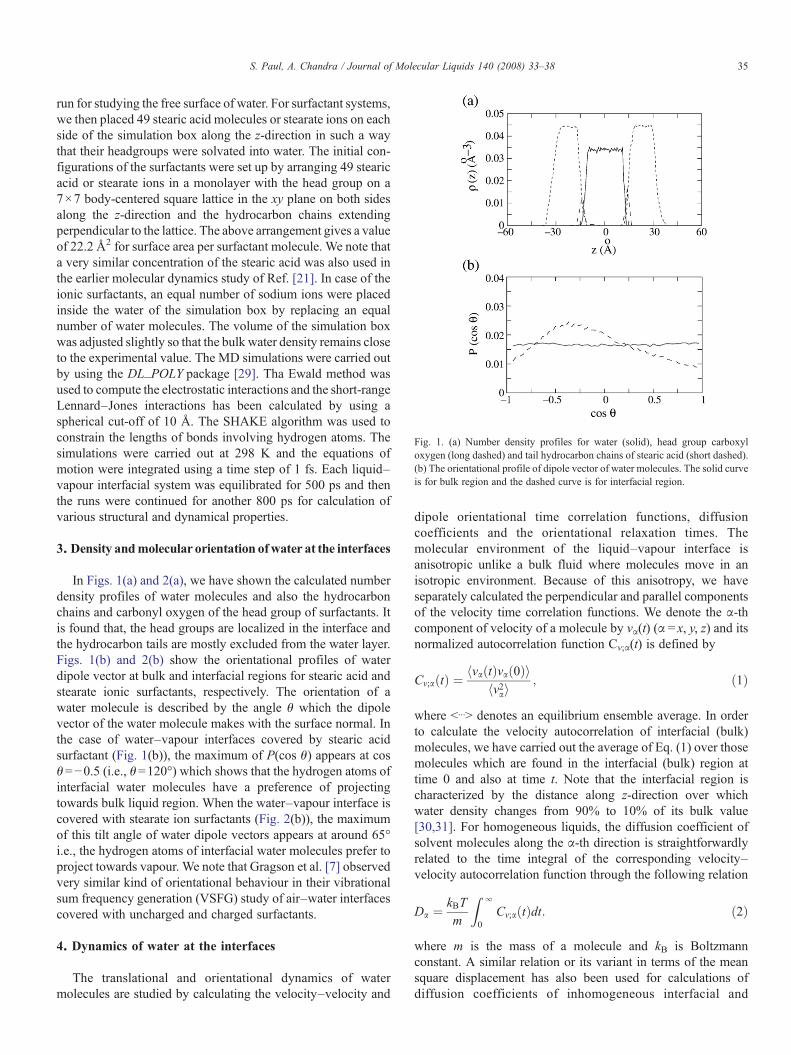
Fig. 1. (a) Number density profiles for water (solid), head group carboxyloxygen (long dashed) and tail hydrocarbon chains of stearic acid (short dashed).(b) The orientational profile of dipole vector of water molecules. The solid curveis for bulk region and the dashed curve is for interfacial region.
35S. Paul, A. Chandra / Journal of Molecular Liquids 140 (2008) 33–38
run for studying the free surface of water. For surfactant systems,we then placed 49 stearic acid molecules or stearate ions on eachside of the simulation box along the z-direction in such a waythat their headgroups were solvated into water. The initial con-figurations of the surfactants were set up by arranging 49 stearicacid or stearate ions in a monolayer with the head group on a7×7 body-centered square lattice in the xy plane on both sidesalong the z-direction and the hydrocarbon chains extendingperpendicular to the lattice. The above arrangement gives a valueof 22.2 Å2 for surface area per surfactant molecule. We note thata very similar concentration of the stearic acid was also used inthe earlier molecular dynamics study of Ref. [21]. In case of theionic surfactants, an equal number of sodium ions were placedinside the water of the simulation box by replacing an equalnumber of water molecules. The volume of the simulation boxwas adjusted slightly so that the bulk water density remains closeto the experimental value. The MD simulations were carried outby using the DL_POLY package [29]. Tha Ewald method wasused to compute the electrostatic interactions and the short-rangeLennard–Jones interactions has been calculated by using aspherical cut-off of 10 Å. The SHAKE algorithm was used toconstrain the lengths of bonds involving hydrogen atoms. Thesimulations were carried out at 298 K and the equations ofmotion were integrated using a time step of 1 fs. Each liquid–vapour interfacial system was equilibrated for 500 ps and thenthe runs were continued for another 800 ps for calculation ofvarious structural and dynamical properties.
3. Density andmolecular orientation ofwater at the interfaces
In Figs. 1(a) and 2(a), we have shown the calculated numberdensity profiles of water molecules and also the hydrocarbonchains and carbonyl oxygen of the head group of surfactants. Itis found that, the head groups are localized in the interface andthe hydrocarbon tails are mostly excluded from the water layer.Figs. 1(b) and 2(b) show the orientational profiles of waterdipole vector at bulk and interfacial regions for stearic acid andstearate ionic surfactants, respectively. The orientation of awater molecule is described by the angle θ which the dipolevector of the water molecule makes with the surface normal. Inthe case of water–vapour interfaces covered by stearic acidsurfactant (Fig. 1(b)), the maximum of P(cos θ) appears at cosθ=−0.5 (i.e., θ=120°) which shows that the hydrogen atoms ofinterfacial water molecules have a preference of projectingtowards bulk liquid region. When the water–vapour interface iscovered with stearate ion surfactants (Fig. 2(b)), the maximumof this tilt angle of water dipole vectors appears at around 65°i.e., the hydrogen atoms of interfacial water molecules prefer toproject towards vapour. We note that Gragson et al. [7] observedvery similar kind of orientational behaviour in their vibrationalsum frequency generation (VSFG) study of air–water interfacescovered with uncharged and charged surfactants.
4. Dynamics of water at the interfaces
The translational and orientational dynamics of watermolecules are studied by calculating the velocity–velocity and
dipole orientational time correlation functions, diffusioncoefficients and the orientational relaxation times. Themolecular environment of the liquid–vapour interface isanisotropic unlike a bulk fluid where molecules move in anisotropic environment. Because of this anisotropy, we haveseparately calculated the perpendicular and parallel componentsof the velocity time correlation functions. We denote the α-thcomponent of velocity of a molecule by vα(t) (α=x, y, z) and itsnormalized autocorrelation function Cv;α(t) is defined by
Cv;a tð Þ ¼ hva tð Þva 0ð Þihv2ai
; ð1Þ
where b⋯N denotes an equilibrium ensemble average. In orderto calculate the velocity autocorrelation of interfacial (bulk)molecules, we have carried out the average of Eq. (1) over thosemolecules which are found in the interfacial (bulk) region attime 0 and also at time t. Note that the interfacial region ischaracterized by the distance along z-direction over whichwater density changes from 90% to 10% of its bulk value[30,31]. For homogeneous liquids, the diffusion coefficient ofsolvent molecules along the α-th direction is straightforwardlyrelated to the time integral of the corresponding velocity–velocity autocorrelation function through the following relation
Da ¼ kBTm
Z l
0Cv;a tð Þdt: ð2Þ
where m is the mass of a molecule and kB is Boltzmannconstant. A similar relation or its variant in terms of the meansquare displacement has also been used for calculations ofdiffusion coefficients of inhomogeneous interfacial and
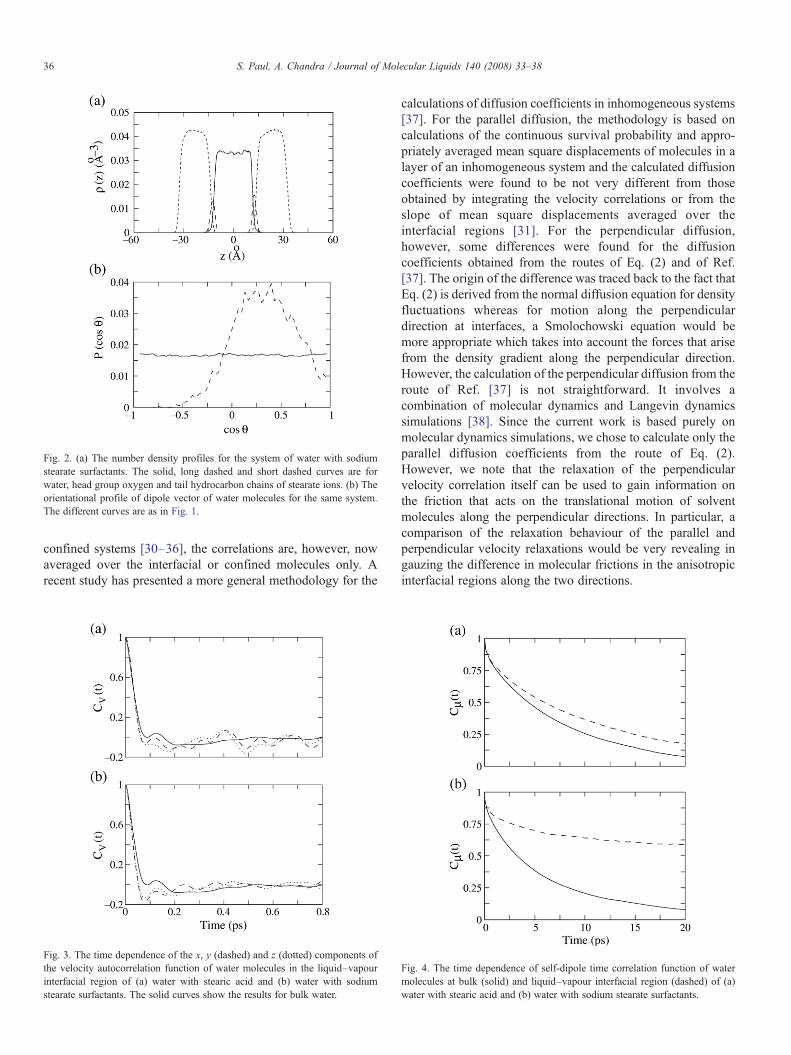
Fig. 2. (a) The number density profiles for the system of water with sodiumstearate surfactants. The solid, long dashed and short dashed curves are forwater, head group oxygen and tail hydrocarbon chains of stearate ions. (b) Theorientational profile of dipole vector of water molecules for the same system.The different curves are as in Fig. 1.
36 S. Paul, A. Chandra / Journal of Molecular Liquids 140 (2008) 33–38
confined systems [30–36], the correlations are, however, nowaveraged over the interfacial or confined molecules only. Arecent study has presented a more general methodology for the
Fig. 3. The time dependence of the x, y (dashed) and z (dotted) components ofthe velocity autocorrelation function of water molecules in the liquid–vapourinterfacial region of (a) water with stearic acid and (b) water with sodiumstearate surfactants. The solid curves show the results for bulk water.
calculations of diffusion coefficients in inhomogeneous systems[37]. For the parallel diffusion, the methodology is based oncalculations of the continuous survival probability and appro-priately averaged mean square displacements of molecules in alayer of an inhomogeneous system and the calculated diffusioncoefficients were found to be not very different from thoseobtained by integrating the velocity correlations or from theslope of mean square displacements averaged over theinterfacial regions [31]. For the perpendicular diffusion,however, some differences were found for the diffusioncoefficients obtained from the routes of Eq. (2) and of Ref.[37]. The origin of the difference was traced back to the fact thatEq. (2) is derived from the normal diffusion equation for densityfluctuations whereas for motion along the perpendiculardirection at interfaces, a Smolochowski equation would bemore appropriate which takes into account the forces that arisefrom the density gradient along the perpendicular direction.However, the calculation of the perpendicular diffusion from theroute of Ref. [37] is not straightforward. It involves acombination of molecular dynamics and Langevin dynamicssimulations [38]. Since the current work is based purely onmolecular dynamics simulations, we chose to calculate only theparallel diffusion coefficients from the route of Eq. (2).However, we note that the relaxation of the perpendicularvelocity correlation itself can be used to gain information onthe friction that acts on the translational motion of solventmolecules along the perpendicular directions. In particular, acomparison of the relaxation behaviour of the parallel andperpendicular velocity relaxations would be very revealing ingauzing the difference in molecular frictions in the anisotropicinterfacial regions along the two directions.
Fig. 4. The time dependence of self-dipole time correlation function of watermolecules at bulk (solid) and liquid–vapour interfacial region (dashed) of (a)water with stearic acid and (b) water with sodium stearate surfactants.

Table 1Values of the diffusion coefficients and dipole orientational relaxation times ofwater molecules in bulk liquid and at interfaces
System D (bulk) Dx,y (interface) τµ (bulk) τµ (interface)
Water 2.70 4.70 6.0 5.6Water+stearic acid 2.72 2.07 7.1 10.5Water+sodium stearate 2.80 1.40 6.8 93.5
The diffusion coefficients and the relaxation times are expressed in units of10−5 cm2 s−1 and ps, respectively.
37S. Paul, A. Chandra / Journal of Molecular Liquids 140 (2008) 33–38
The rotational motion of water molecules at liquid–vapourinterfaces is investigated by calculating the time dependence ofthe self correlation function of dipole fluctuations
CA tð Þ ¼ hPA tð Þ � PA 0ð ÞihPA 0ð Þ2i ; ð3Þ
where µ̄(t)= µ̄(t)−bµN, µ(t) is the dipole vector of a moleculeat time t and bµN is the average value of the dipole vector asobtained from the simulation trajectory by averaging over all thewater molecules and over the simulation time. We havecalculated Cµ(t) for both interfacial and bulk water molecules.The orientational relaxation time τµ is defined as the timeintegral of the dipole orientational correlation function
sA ¼Z l
0CA tð Þdt; ð4Þ
where we have calculated the integral explicitly up to 20 ps byusing the simulation data of Cµ(t) and the contribution of the tailpart is obtained by using a tri-exponential fit to the overall decayof the dipole correlation functions.
In Figs. 3 and 4, we have shown the velocity–velocity and self-dipole correlation functions respectively and the correspondingvalues of the parallel diffusion coefficients and orientationalrelaxation times are given in Table 1. For surfaces covered bysurfactant monolayers, both parallel and perpendicular compo-nents of velocity correlations decay at a faster rate than that of bulkwater and this rate of decay is even faster for the systemwith ionicsurfactants than the neutral ones. Clearly, the water molecules atinterfaces feel more friction on translational motion both in theparallel and perpendicular directions and this friction is higher forthe case of ionic surfactants. For a given system, it is found that thevelocity relaxation occurs at a slower rate in the parallel directionthan that in the perpendicular direction which means a higherfriction on the translational motion along the perpendiculardirection. It is found that the diffusion coefficient of bulk watermolecules is higher than interfacial diffusion coefficients in theparallel direction. Again, the decrease is more pronounced forionic surfactants rather than the neutral surfactants. Such restrictedmobility of watermolecules at the interfacial regions arise becauseof the hindered motion and the presence of water molecules thatare bound to the hydrophilic surfactant head groups by stronghydrogen bonds. The rotational dynamics of the interfacial watermolecules are also affected. Fig. 4 shows that the rotationalmotionof water molecules at the interface is significantly restricted com-pared to that of pure bulkwater. The slowing downof orientationalrelaxation is much stronger when the interface is covered with
negatively charged stearate ions rather than the neutral stearic acid.For example, the rotational dynamics at interfaces covered byionic and neutral surfactants are found to be, respectively, about 20and 2 times slower than that at the surfactant-free surface. This isdue to the existence of hydrogen bonding of water with theheadgroups of the surfactant and the hydrogen bonding is strongerfor negatively charged stearate ions. This orientational behaviourdue to hydrogen bonding is clearly seen in the dipolar orientationalprofiles of Fig. 2. In case of negative stearate ion surfactants theinterfacial water molecules project their hydrogen atoms towardthe vapour to maximize the hydrogen bonds with the head groupsof the surfactant molecules. Chanda et al. [22] also observedsimilar kind of much slower dynamics of the interfacial watermolecules in their study of monolayers of Aerosol-OT surfactantsat the air–water interface.We note that the present observation thatthe solvent dynamics at liquid–vapour interface with ionicsurfactants is significantly slower than that at the interface withthe neutral surfactants and at the surfactant-free interface is inqualitative agreement with the recent experimental results ofsolvation dynamics at these interfaces [15,16].
5. Summary and conclusions
In this work, we have investigated the behaviour of aqueoussurfaces with a surfactant monolayer of either stearic acid orstearate ions by means of molecular dynamics simulations. Thefree surface of water is also considered. The structural prop-erties such as density profiles of water molecules, head groupand hydrocarbon chains of the surfactants and orientation ofwater molecules for both the systems are calculated. The inter-facial water molecules are found to orient differently dependingupon the charge of the surfactants. Our calculated dipolar orien-tational profiles agree well with observations of the sum fre-quency generation experiments of similar aqueous surfacescovered with monolayers of neutral and ionic surfactants [7]. Wealso found that, for water-surfactant systems, the reorientationaland translational motion of interfacial water molecules areslower than that of bulk liquid molecules. This behaviour isdifferent from the free surfaces of water where the interfacialwater molecules are found to translate and rotate at a faster ratethan that of bulk liquid water. In particular, the dynamics ofinterfacial water molecules with stearate ion surfactants isfound to be much slower than that of both neutral surfactant andsurfactant-free water–vapour systems which is in qualitativeagreement with recent experimental observations [15,16].
Acknowledgment
We gratefully acknowledge the financial support from De-partment of Science and Technology (DST) and Council ofscientific and Industrial Research (CSIR), Government of India.
References
[1] W.M. Gelbert, A. Ben-Shaul, J. Phys. Chem. 100 (1996) 13169.[2] A.W. Adamson, Physical Chemistry of Interfaces, Wiley-Interscience,
New York, 1982.

38 S. Paul, A. Chandra / Journal of Molecular Liquids 140 (2008) 33–38
[3] G.L. Gaines Jr., Insoluble Monolayers at Liquid–Gas Interfaces, Wiley-Interscience, New York, 1966.
[4] P. Guyot-Sionnest, J.H. Hunt, Y.R. Shen, Phys. Rev. Lett. 59 (1987) 1597.[5] K.B. Eisenthal, Chem. Rev. 96 (1996) 1343 and references therein.[6] M.C. Goh, J.M. Hicks, K. Kemnitz, G.R. Pinto, K. Bhattacharyya, K.B.
Eisenthal, T.F. Heinz, J. Phys. Chem. 92 (1988) 5074.[7] D.E. Gragson, B.M. McCarty, G. Richmond, J. Phys. Chem. 100 (1996)
14272.[8] R.J. Lu, A. Marrocco, J.T. Su, R.K. Thomas, J. Penfold, J. Colloid
Interface Sci. 158 (1993) 303.[9] P.I. Purcell, R.K. Thomas, J. Penfold, A.M. Howe, Colloids Surf. 94
(1995) 125.[10] R.J. Lu, M. Hromadova, R.K. Thomas, J. Penfold, J. Phys. Chem. 98
(1994) 11519.[11] R.J. Lu, M. Hromadova, R.K. Thomas, J. Penfold, J. Chem. Soc., Faraday
Trans. 92 (1996) 403.[12] E.A. Simister, R.K. Thomas, J. Penfold, R. Aveyard, B.P. Binks, P. Cooper,
P.D.I. Fletcher, J.R. Lu, A. Solokowski, J. Phys. Chem. 96 (1992) 1383.[13] E.A. Simister, E. Lee, R.K. Thomas, J. Penfold, J. Phys. Chem. 96 (1992)
1373.[14] S.G. Grubb, M.W. Kim, T. Raising, Y.R. Shen, Langmuir 4 (1988) 452.[15] A.V. Benderskii, K.B. Eisenthal, J. Phys. Chem., B 104 (2000) 11723.[16] A.V. Benderskii, K.B. Eisenthal, J. Phys. Chem., B 105 (2001) 6698.[17] J. Böcker, M. Schlenkrich, P. Bopp, J. Brickmann, J. Phys. Chem. 96
(1992) 9915.[18] A. Pohorille, I. Benjamin, J. Phys. Chem. 97 (1993) 2664.[19] M. Tarek, D.J. Tobias, M.L. Klein, J. Phys. Chem. 99 (1995) 1393.[20] K.J. Schweighofer, U. Essmann, M. Berkowitz, J. Phys. Chem., B 101
(1997) 3793.
[21] E. Okamura, N. Fukushima, S. Hayashi, Langmuir 15 (1999) 3589.[22] J. Chanda, S. Chakraborty, S. Bandyopadhyay, J. Phys. Chem., B 109
(2005) 471.[23] W.L. Jorgensen, J. Chem. Phys. 77 (1982) 4156.[24] S.L. Mayo, B.D. Olafson, W.A. Goddard III, J. Phys. Chem. 94 (1990)
8897.[25] J.M. Briggs, T.B. Nguyen,W.L. Jorgensen, J. Phys. Chem. 95 (1991) 3315.[26] K. Watanabe, M. Ferrario, M.L. Klein, J. Phys. Chem. 92 (1988) 819.[27] D.E. Smith, L.X. Dang, J. Chem. Phys. 100 (1994) 3757;L.X. Dang, J. Chem. Phys. 102 (1995) 3483.[28] H.J.C. Berendsen, J.R. Grigera, T.P. Straatsma, J. Phys. Chem. 91 (1987)
6269.[29] DL_POLY is a package of molecular simulation routines written by W.
Smith and T.R. Forester, copyright CCLRC for the Central Laboratory ofthe Research Councils, Daresbury Laboratory at Daresbury, Nr. Warring-ton (1996).
[30] R.S. Taylor, L.X. Dang, B.C. Gerrett, J. Phys. Chem. 100 (1996) 11720.[31] S. Paul, A. Chandra, Chem. Phys. Lett. 373 (2003) 87;J. Chem. Phys. 123 (2005) 184706;J. Chem. Phys. 123 (2005) 174712.[32] I. Benjamin, J. Chem. Phys. 97 (1992) 1432.[33] S. Senapatia, M.L. Berkowitz, J. Chem. Phys. 118 (2003) 1937.[34] J. Marti, M.C. Gordillo, J. Chem. Phys. 119 (2003) 12540.[35] N. Choudhury, B.M. Pettit, J. Phys. Chem., B 109 (2005) 6422.[36] C.R. Kamala, K.G. Ayappa, S. Yashonath, J. Phys. Chem., B 109 (2005)
22092.[37] P. Liu, E. Harder, B.J. Berne, J. Phys. Chem., B 108 (2004) 6595.[38] M.P. Allen, D.J. Tildesley, Computer Simulation of Liquids, , 1987 Oxford.