Structural Testing of Navy Vessels Using Bragg Gratings and a Prototype Digital Spatial Wavelength...
8
health monitoring system based on fiber optic technology. Application of this new health monitoring system to U.S. Navy ves- sels will improve maintenance programs by predicting need-based maintenance schedules, thereby eliminating costly cyclic preventative maintenance schedules. This new system will also increase operational availability and ship survivability by providing ship operators real-time information concerning the state of the ship structure. This paper describes the operational capabilities of this new system and recent test results on large-scale naval structures including a U.S. Navy Landing Platform Dock 17 (LPD 17) ship propeller. Introduction The system under development is based on digital spatial wavelength domain multiplex- ing (DSWDM) technology (patent pending), which allows for the interrogation of large numbers of Bragg grating sensors to provide real-time ship structural assessment capabili- ty. This hardware system is integrated into a modular, ruggedized unit controlled by a laptop computer to enable sampling of 120 gratings at 2000 samples per second at low cost. This allows for monitoring of ship hull girder primary bending deformations and hull panel vibrations due to wave impacts as well as lower frequency primary hull bend- ing deformations. The results presented in this paper are for an initial full-scale test of the prototype DSWDM demodulation sys- tem on an LPD 17 propulsion propeller. This test was performed to demonstrate the capa- bilities of the DSWDM technology on a large ship structure. A schematic diagram of the envisioned ship- wide health monitoring network system con- cept is shown in Figure 1, where a control computer interrogates sensor nodes distrib- uted along the ship via an optical data net- work. Each sensor node will be instrumented ABSTRACT Repairing and maintaining the Fleet have been long-standing problems for the Navy. In recent years, decreasing resources and Fleet assets have made repair and maintenance an even more difficult problem. In response to these pressures, Navy personnel have been seeking new methods to reduce overall maintenance costs. One such approach has been to instrument ships during operation with resistance strain gage technology in order to provide information for estimating the structural health of ship hulls. To date, a limited number of naval ships have been instrumented in this way, and have collected data to validate computer models that predict damage accumulation over the expected service life of the vessel (Adamchak 1984; Sikora 1983). The Navy is currently developing a new ship structural FIGURE 1: Ship Sensor Network TECHNICAL PAPER NAVAL ENGINEERS JOURNAL WINTER 2002 ■ 63 Structural Testing of Navy Vessels Using Bragg Gratings and a Prototype Digital Spatial Wavelength Domain Multiplexing (DSWDM) System ■ Chris Baldwin, John Niemczuk, Jason Kiddy, Peter Chen, Martin Christiansen and Shiping Chen This paper was presented during ASNE Day 2001 on Tuesday, May 1st.
-
Upload
chris-baldwin -
Category
Documents
-
view
212 -
download
0
Transcript of Structural Testing of Navy Vessels Using Bragg Gratings and a Prototype Digital Spatial Wavelength...

health monitoring system based on fiberoptic technology. Application of this newhealth monitoring system to U.S. Navy ves-sels will improve maintenance programs bypredicting need-based maintenance schedules,thereby eliminating costly cyclic preventativemaintenance schedules. This new system willalso increase operational availability andship survivability by providing ship operatorsreal-time information concerning the state ofthe ship structure. This paper describes theoperational capabilities of this new systemand recent test results on large-scale navalstructures including a U.S. Navy LandingPlatform Dock 17 (LPD 17) ship propeller.
Introduction The system under development is based ondigital spatial wavelength domain multiplex-ing (DSWDM) technology (patent pending),which allows for the interrogation of largenumbers of Bragg grating sensors to providereal-time ship structural assessment capabili-ty. This hardware system is integrated into amodular, ruggedized unit controlled by alaptop computer to enable sampling of 120gratings at 2000 samples per second at lowcost. This allows for monitoring of ship hull
girder primary bending deformations andhull panel vibrations due to wave impacts aswell as lower frequency primary hull bend-ing deformations. The results presented inthis paper are for an initial full-scale test ofthe prototype DSWDM demodulation sys-tem on an LPD 17 propulsion propeller. Thistest was performed to demonstrate the capa-bilities of the DSWDM technology on alarge ship structure.
A schematic diagram of the envisioned ship-wide health monitoring network system con-cept is shown in Figure 1, where a controlcomputer interrogates sensor nodes distrib-uted along the ship via an optical data net-work. Each sensor node will be instrumented
ABSTRACTRepairing and maintaining the Fleet have been long-standing problems for the Navy. In recent years, decreasingresources and Fleet assets have made repair and maintenance an even more difficult problem. In response to thesepressures, Navy personnel have been seeking new methods to reduce overall maintenance costs. One such approachhas been to instrument ships during operation with resistance strain gage technology in order to provide informationfor estimating the structural health of ship hulls. To date, a limited number of naval ships have been instrumented inthis way, and have collected data to validate computer models that predict damage accumulation over the expectedservice life of the vessel (Adamchak 1984; Sikora 1983). The Navy is currently developing a new ship structural
FIGURE 1:Ship Sensor Network
T E C H N I C A L P A P E R
NAVAL ENGINEERS JOURNAL WINTER 2002 ■ 6 3
Structural Testing of Navy Vessels UsingBragg Gratings and a Prototype DigitalSpatial Wavelength Domain Multiplexing(DSWDM) System■ Chris Baldwin, John Niemczuk, Jason Kiddy, Peter Chen, Martin Christiansen and Shiping Chen
This paper was presented during ASNE Day 2001 on Tuesday, May 1st.

with Bragg grating sensors to measure strainand temperature at key locations along theship so as to measure stresses associated withhull bending, wave impacts, and stress con-centrations. A graphical user interface (GUI)will allow for control of various parametersof the data acquisition and health monitoringsystem, as well as graphically display struc-tural deflections in real-time. Strain data willuse one of the dedicated structural analysismodules executing simultaneously for real-time health assessment or logged for post-processing and analysis.
The completed health measurement systempossesses many advantages. First, fiber sen-sors are serially multiplexible, allowing forup to 30 sensors along a single fiber array.Because these sensors are optical in nature,they do not emit electromagnetic noise andare themselves not susceptible to electromag-netic interference from other shipboard elec-tronics. Second, the system is open architec-ture and can be retrofit to existing shipswithout the need to install expensive, bulky,and complex multi-strand copper conductorcables and associated stuffing tubes. Thisresults in significant reduction in cableweight and improvements in modularity thatallow for easy system upgrades as new tech-nologies arise. The fiber-optic based systemprovides lower integration costs with newshipboard optical network backbones. Thesystem sensors can be integrated into exist-
ing optical fiber cable runs on the ship andallow for the transmission of other sensorand communication data in addition to thestructural strain data. Finally, a key advan-tage of this technology is that optical sensorsare self-referencing, enabling long-termabsolute strain measurements without theneed for frequent sensor calibrations andbridge balancing such as that required byresistance strain gage sensors.
The structural health monitoring technologydeveloped in this effort is applicable to adiverse range of applications in defense, civilinfrastructure, and industrial applications. Inthe defense area, the technology is applicableto service life extension programs of ships,submarines, and airborne platforms. In thecivil infrastructure area, the technology isapplicable to monitoring the condition ofbridges, dams, and highways. In the industri-al area, the technology is applicable to vari-ous uses in production facilities, transporta-tion, construction, and aerospace — wherev-er structural integrity must be monitored.
This paper provides an overview of theDSWDM based structural monitoring sys-tem and details the efforts for a large scaletest of the DSWDM system for structuralhealth monitoring of Naval structures. Thetests outlined here were the first field test ofthe prototype sensor system and consisted ofmounting 24 fiber Bragg grating (FBG) sen-sors to an LPD 17 propulsion propeller,shown in Figure 2. Most of these sensorswere collocated with resistance strain gagesfor comparative analysis.
Digital Spatial Wavelength DomainMultiplexing (DSWDM) SystemDigital Spatial Wavelength DomainMultiplexing (DSWDM) is the technologybeing used to develop a high-speed, massive-ly multiplexed optical fiber sensor based sys-tem for ship structural health monitoring.The system will enable more than 120 FBGsensors, each sampled at 2 kHz at a resolu-tion of approximately 2 microstrain (µε). Aunique feature of this technology is thateach sensor in the system can be addressedindependently. This allows the sample rateand resolution of each sensor to be changedby software reconfiguration to tailor the sys-
Structural Testing of Navy Vessels Using Bragg Gratings and a Prototype DSWDM System
6 4 ■ WINTER 2002 NAVAL ENGINEERS JOURNAL
FIGURE 2:LPD-17 Ship Propeller
Test Apparatus
tem to different application needs. Forexample, the system can be software re-con-figured to accommodate more than 1000sensors if only 60 are sampled at 2 kHzwhile the remaining sensors are sampled at100 Hz. In addition, the sensor interroga-tion instrument is compact, lightweight,robust, and contains no moving parts. Inshort, this technique offers significant per-formance improvements over existing FBG-based sensor demodulation systems.
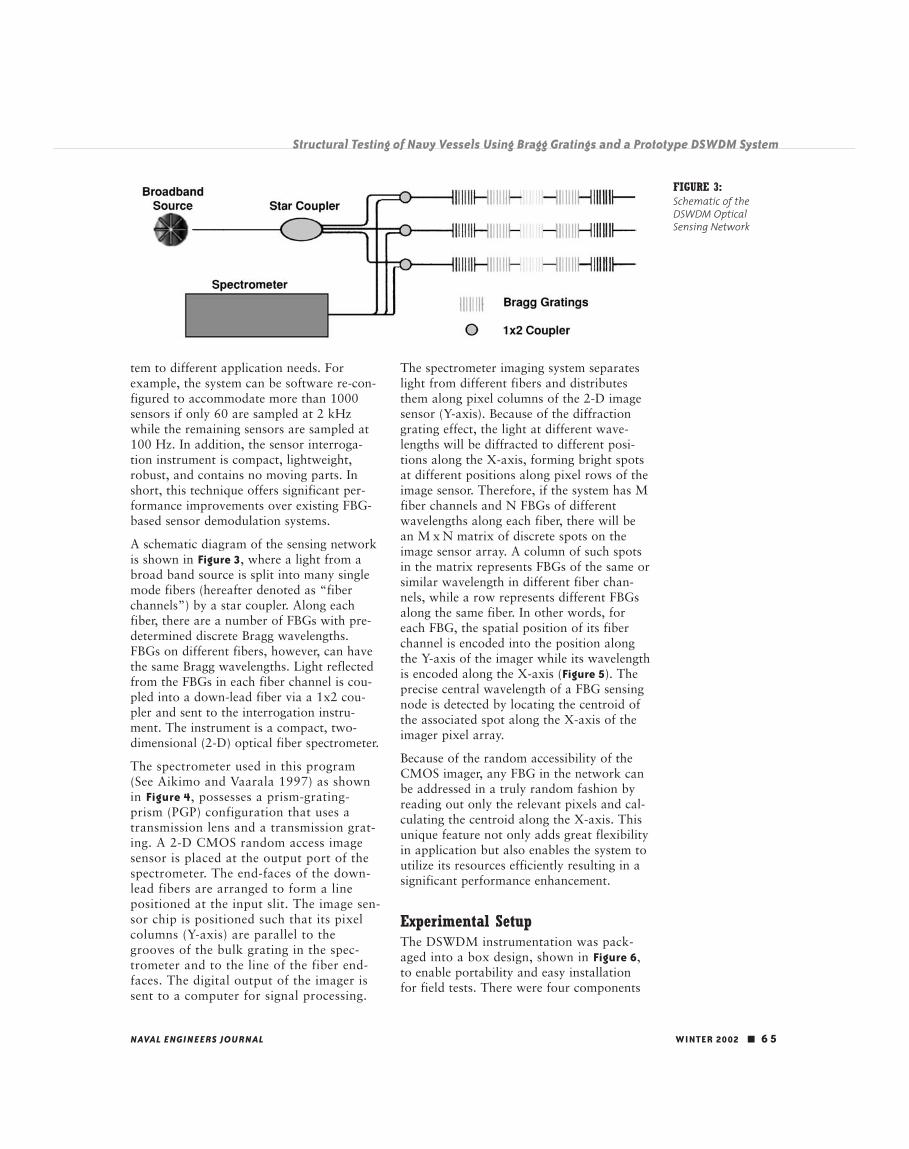
A schematic diagram of the sensing networkis shown in Figure 3, where a light from abroad band source is split into many singlemode fibers (hereafter denoted as “fiberchannels”) by a star coupler. Along eachfiber, there are a number of FBGs with pre-determined discrete Bragg wavelengths.FBGs on different fibers, however, can havethe same Bragg wavelengths. Light reflectedfrom the FBGs in each fiber channel is cou-pled into a down-lead fiber via a 1x2 cou-pler and sent to the interrogation instru-ment. The instrument is a compact, two-dimensional (2-D) optical fiber spectrometer.
The spectrometer used in this program(See Aikimo and Vaarala 1997) as shownin Figure 4, possesses a prism-grating-prism (PGP) configuration that uses atransmission lens and a transmission grat-ing. A 2-D CMOS random access imagesensor is placed at the output port of thespectrometer. The end-faces of the down-lead fibers are arranged to form a linepositioned at the input slit. The image sen-sor chip is positioned such that its pixelcolumns (Y-axis) are parallel to thegrooves of the bulk grating in the spec-trometer and to the line of the fiber end-faces. The digital output of the imager issent to a computer for signal processing.
The spectrometer imaging system separateslight from different fibers and distributesthem along pixel columns of the 2-D imagesensor (Y-axis). Because of the diffractiongrating effect, the light at different wave-lengths will be diffracted to different posi-tions along the X-axis, forming bright spotsat different positions along pixel rows of theimage sensor. Therefore, if the system has Mfiber channels and N FBGs of differentwavelengths along each fiber, there will bean M x N matrix of discrete spots on theimage sensor array. A column of such spotsin the matrix represents FBGs of the same orsimilar wavelength in different fiber chan-nels, while a row represents different FBGsalong the same fiber. In other words, foreach FBG, the spatial position of its fiberchannel is encoded into the position alongthe Y-axis of the imager while its wavelengthis encoded along the X-axis (Figure 5). Theprecise central wavelength of a FBG sensingnode is detected by locating the centroid ofthe associated spot along the X-axis of theimager pixel array.
Because of the random accessibility of theCMOS imager, any FBG in the network canbe addressed in a truly random fashion byreading out only the relevant pixels and cal-culating the centroid along the X-axis. Thisunique feature not only adds great flexibilityin application but also enables the system toutilize its resources efficiently resulting in asignificant performance enhancement.
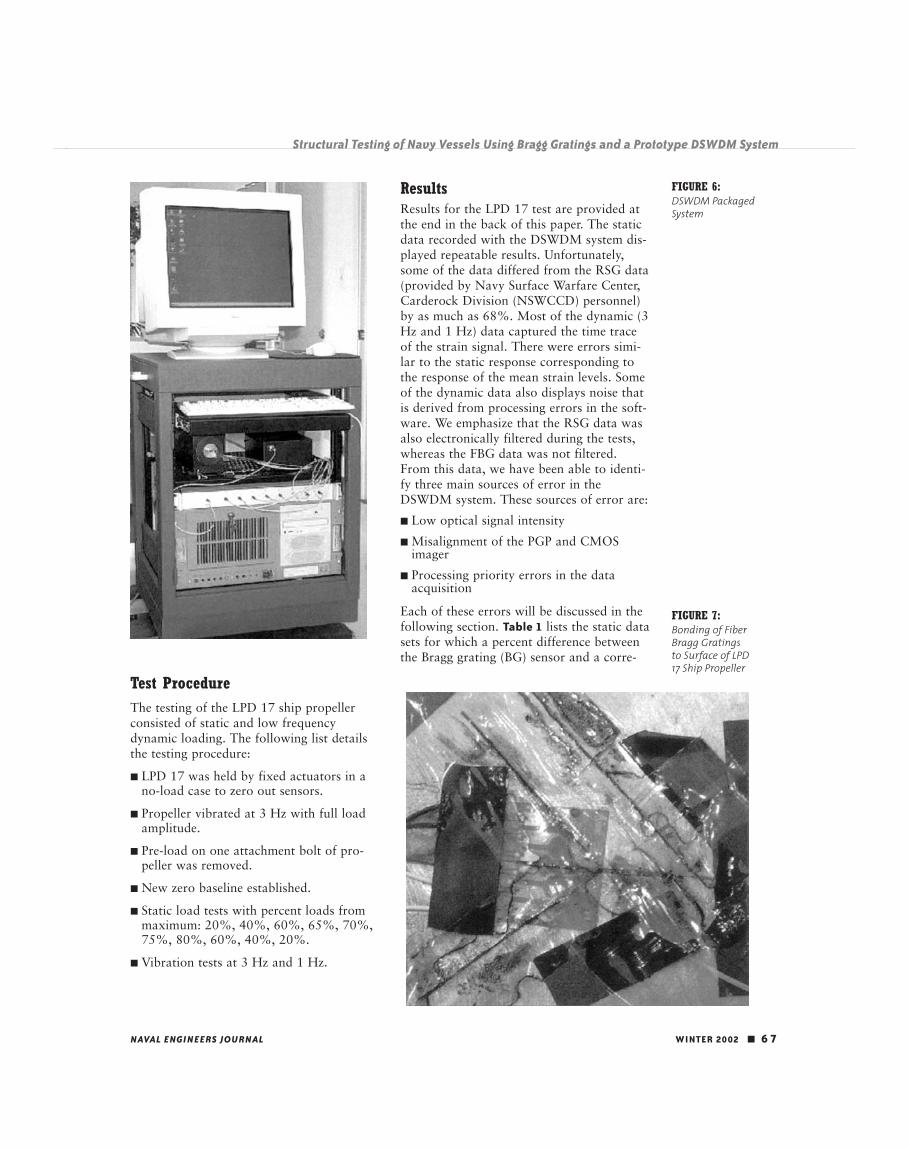
Experimental SetupThe DSWDM instrumentation was pack-aged into a box design, shown in Figure 6,to enable portability and easy installationfor field tests. There were four components
Structural Testing of Navy Vessels Using Bragg Gratings and a Prototype DSWDM System
NAVAL ENGINEERS JOURNAL WINTER 2002 ■ 6 5
FIGURE 3:Schematic of the
DSWDM Optical
Sensing Network

in the system—the super luminescent diode(SLD), the DC power supply for the SLD,the 1x8 dispatch box and the PGP interroga-tion instrument. The interrogation instru-ment consisted of the PGP spectrometer—CMOS camera and the fiber array. The DCpower supply was considered to be quiteheavy, and it was decided that banana plugsfrom outside the box would be used to con-nect to the SLD. The major disadvantage tothe current design is the size of the box (8.5cu. ft). The prototype box was made over-sized to allow for ease of connecting the sys-tem and trouble shooting. Future packagedsystems will be limited to a smaller design,preferably around 1 cu. ft.
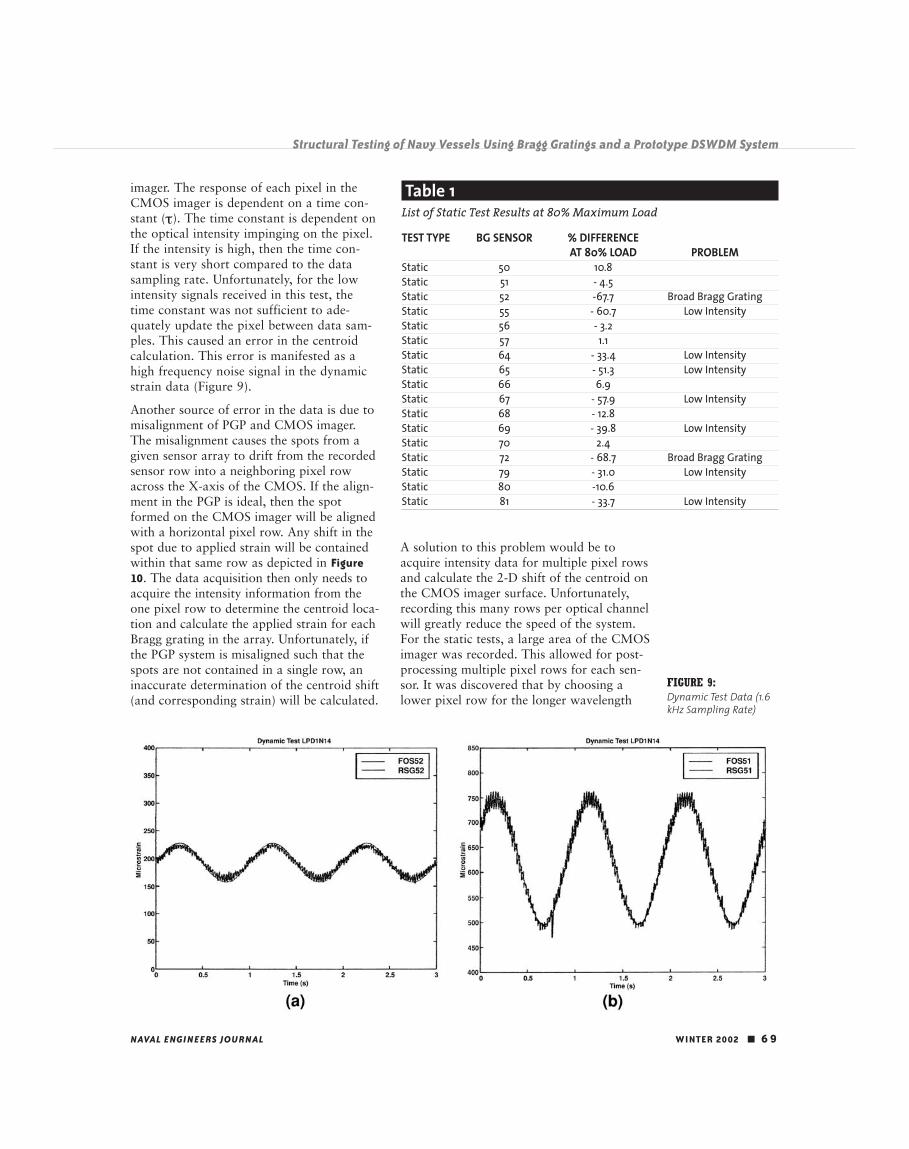
Four arrays of Bragg gratings were manufac-tured and surface mounted to the LPD 17propeller. Each of these arrays contained sixBragg gratings for a total of 24 Bragg grat-ings. Three of the arrays (labeled A, C, andD) were mounted such that each Bragg grat-ing corresponded to an existing strain gagelocation on the LPD 17 propeller. The otherarray (labeled B) was mounted such thatthree of the Bragg gratings were strainrelieved and acted as temperature sensors,where the other three Bragg gratings for arrayB were mounted to the propeller in key areas.
Measurements Group AE-10 epoxy wasused to bond all Bragg gratings to the LPD17 propeller surface, shown in Figure 7.
Each array of Bragg gratings was connected tothe DSWDM instrumentation by a 30 m opti-cal lead line. This allowed the instrumentationto be located in a control room away from thetest environment. The lead lines used werestandard SMF-28, which act as multimodeoptical fibers for the 800 nm wavelengthrange of the operating system. This adverselyaffected the results by decreasing the opticalpower delivered in system due to the core mis-match between the lead lines and the opticalfiber used for the arrays and the instrumenta-tion. The loss of optical power resulted indimmer spots detected by the CMOS imagerin the DSWDM. The resulting low intensitycaused significant differences in the strainreadings as compared to the resistance straingages (RSGs) for some of the Bragg gratingsensors. These differences can be corrected bymaking system improvements such as a higherintensity light source and/or use of appropri-ate fiber optic leads for the sensor arrays.
Structural Testing of Navy Vessels Using Bragg Gratings and a Prototype DSWDM System
6 6 ■ WINTER 2002 NAVAL ENGINEERS JOURNAL
FIGURE 4:Prism-Grating-Prism
(PGP) Spectrometer
Configuration of VTT
Electronics
FIGURE 5:Distribution of
Reflected Light from
Fiber Bragg Gratings
onto Imager
Test ProcedureThe testing of the LPD 17 ship propellerconsisted of static and low frequencydynamic loading. The following list detailsthe testing procedure:
■ LPD 17 was held by fixed actuators in ano-load case to zero out sensors.
■ Propeller vibrated at 3 Hz with full loadamplitude.
■ Pre-load on one attachment bolt of pro-peller was removed.
■ New zero baseline established.
■ Static load tests with percent loads frommaximum: 20%, 40%, 60%, 65%, 70%,75%, 80%, 60%, 40%, 20%.
■ Vibration tests at 3 Hz and 1 Hz.
ResultsResults for the LPD 17 test are provided atthe end in the back of this paper. The staticdata recorded with the DSWDM system dis-played repeatable results. Unfortunately,some of the data differed from the RSG data(provided by Navy Surface Warfare Center,Carderock Division (NSWCCD) personnel)by as much as 68%. Most of the dynamic (3Hz and 1 Hz) data captured the time traceof the strain signal. There were errors simi-lar to the static response corresponding tothe response of the mean strain levels. Someof the dynamic data also displays noise thatis derived from processing errors in the soft-ware. We emphasize that the RSG data wasalso electronically filtered during the tests,whereas the FBG data was not filtered.From this data, we have been able to identi-fy three main sources of error in theDSWDM system. These sources of error are:
■ Low optical signal intensity
■ Misalignment of the PGP and CMOSimager
■ Processing priority errors in the dataacquisition
Each of these errors will be discussed in thefollowing section. Table 1 lists the static datasets for which a percent difference betweenthe Bragg grating (BG) sensor and a corre-
Structural Testing of Navy Vessels Using Bragg Gratings and a Prototype DSWDM System
NAVAL ENGINEERS JOURNAL WINTER 2002 ■ 6 7
FIGURE 6:DSWDM Packaged
System
FIGURE 7:Bonding of Fiber
Bragg Gratings
to Surface of LPD
17 Ship Propeller

sponding RSG could be calculated. Each dis-played data set describes the error (if any)which caused the discrepancy from the RSGdata. Comparison data for a select numberof static tests is shown in Figure 8. Figure 9provides an example of the dynamic datarecorded at 1.6 kHz sampling rate (sixBragg grating sensors were recorded simulta-neously at this sampling rate). The RSG dataacquisition was carried out on an existingplatform at NSWCCD causing the phaseshift in the dynamic data seen in Figure 9.
DiscussionAfter examining the data sets for the LPD17 test, three main sources of error wereidentified. The main source of error was lowoptical intensity signals being detected by
the CMOS imager. The low intensity signalleads to two difficulties. The first difficultydeals with signal-to-noise ratio. Because ofoptical fiber connections within theDSWDM system, there exists a level of opti-cal background noise in the system. Thebackground noise is detected by the CMOSimager has a broadband low intensity signal.In order for the processing software to accu-rately determine the centroid of the spot onthe CMOS imager, the intensity detectedfrom the Bragg grating must be sufficientlyabove this background noise. Because of theinclusion of the multimode patchcord (leadfiber), a significant drop in intensity for eachBragg grating was experienced making it dif-ficult to determine accurate centroid shifts.The other error caused by low intensitydeals with the response time of the CMOS
Structural Testing of Navy Vessels Using Bragg Gratings and a Prototype DSWDM System
6 8 ■ WINTER 2002 NAVAL ENGINEERS JOURNAL
FIGURE 8:Static Test Data
imager. The response of each pixel in theCMOS imager is dependent on a time con-stant (τ). The time constant is dependent onthe optical intensity impinging on the pixel.If the intensity is high, then the time con-stant is very short compared to the datasampling rate. Unfortunately, for the lowintensity signals received in this test, thetime constant was not sufficient to ade-quately update the pixel between data sam-ples. This caused an error in the centroidcalculation. This error is manifested as ahigh frequency noise signal in the dynamicstrain data (Figure 9).
Another source of error in the data is due tomisalignment of PGP and CMOS imager.The misalignment causes the spots from agiven sensor array to drift from the recordedsensor row into a neighboring pixel rowacross the X-axis of the CMOS. If the align-ment in the PGP is ideal, then the spotformed on the CMOS imager will be alignedwith a horizontal pixel row. Any shift in thespot due to applied strain will be containedwithin that same row as depicted in Figure10. The data acquisition then only needs toacquire the intensity information from theone pixel row to determine the centroid loca-tion and calculate the applied strain for eachBragg grating in the array. Unfortunately, ifthe PGP system is misaligned such that thespots are not contained in a single row, aninaccurate determination of the centroid shift(and corresponding strain) will be calculated.
A solution to this problem would be toacquire intensity data for multiple pixel rowsand calculate the 2-D shift of the centroid onthe CMOS imager surface. Unfortunately,recording this many rows per optical channelwill greatly reduce the speed of the system.For the static tests, a large area of the CMOSimager was recorded. This allowed for post-processing multiple pixel rows for each sen-sor. It was discovered that by choosing alower pixel row for the longer wavelength
Structural Testing of Navy Vessels Using Bragg Gratings and a Prototype DSWDM System
NAVAL ENGINEERS JOURNAL WINTER 2002 ■ 6 9
Table 1List of Static Test Results at 80% Maximum Load
TEST TYPE BG SENSOR % DIFFERENCE AT 80% LOAD PROBLEM
Static 50 10.8Static 51 - 4.5Static 52 -67.7 Broad Bragg GratingStatic 55 - 60.7 Low IntensityStatic 56 - 3.2Static 57 1.1Static 64 - 33.4 Low IntensityStatic 65 - 51.3 Low IntensityStatic 66 6.9Static 67 - 57.9 Low IntensityStatic 68 - 12.8Static 69 - 39.8 Low IntensityStatic 70 2.4Static 72 - 68.7 Broad Bragg GratingStatic 79 - 31.0 Low IntensityStatic 80 -10.6Static 81 - 33.7 Low Intensity
FIGURE 9:Dynamic Test Data (1.6
kHz Sampling Rate)

sensors, the percent difference from the RSGdata was greatly reduced. The percent differ-ence results (at maximum load) are presentedin Table 1. For the cases where the percentdifference exceeds 30%, the Bragg gratingswere observed to posses low optical intensity,causing the increased percent difference. Forthe cases labeled BG sensor 52 and 72, theseBragg gratings were approximately 1 nmwide (in the wavelength regime). This is con-sidered broad, and the centroid locationalgorithm could not accurately predict theproper center wavelength for these Bragggratings causing the large percent difference.For the dynamic tests, only a single pixel rowwas recorded for each sensor array.Therefore, the misalignment error and thelow intensity error combined to provideBragg grating sensor responses that detectedthe dynamic signal but at different strain lev-els as compared to the RSG data (Figure 9).
The final source of error relates to the pro-cessing priority of the software in theDSWDM system. This error stems from theCMOS imager and imager acquisition cardnot functioning properly with the PC oper-ating system. The priority error manifestsitself as spikes and unexplained shifts in thedynamic strain data, as seen in Figure 9.This error has been successfully eliminatedby the use of a new computer that can beproperly configured to operate with theCMOS imager and imager acquisition card.
ConclusionsThe results presented in this paper arepromising first test data for the DSWDMsystem. The data presented in Table 1 and
Figures 8 and 9 demonstrate the currentcapabilities of the DSWDM system. Theresults of the LPD 17 test demonstratedthree main sources of error. Each of theseerrors will be easily fixed in future tests by1) using proper lead fibers to overcome thelow intensity optical signals, 2) adjusting thealignment of the PGP and CMOS imager,and 3) configuring a new computer to func-tion properly with the CMOS imager andimager card. Most of the Bragg grating sen-sors experienced a percent difference of13% (or less) as compared to resistancestrain gages at the maximum static load. Forall others, either a low intensity optical sig-nal or a broad Bragg grating spectrumcaused difficulties in the calculation of thesensor centroid (leading to larger percentdifferences). The dynamic data possessederrors due to the low optical intensity sig-nals and the misalignment of the PGP andCMOS imager. Fortunately, these errors onlyaffected the measured strain level of theresponse, and the dynamic event could beseen from the sensor response.
AcknowledgementsThis work was funded by the Office ofNaval Research (ONR) Phase II SBIR con-tract number N00014-99-C-0039. ■
REFERENCES
Adamchak, J.C., “An Approximate Method forEstimating the Collapse of a Ship’s Hull inPreliminary Design,” Society of Naval Architectsand Marine Engineers, Ship StructuralSymposium, Arlington, Virginia, 1984.
Aikimo, M. and T. Vaarala., “Intelligent Prism-Grating-Prism Spectrograph for Multipoint FiberOptic Remote Spectroscopy”, Proceedings of 12thInternational Conference on Optical FiberSensors, pp. 552-555, 1997.
Sikora, J.P., A. Dinsenbacher,. and J.E. Beach,., “AMethod for Estimating Lifetime Loads and FatigueLives for SWATH and Conventional MonohullShips,” Naval Engineers Journal, May 1983.
Structural Testing of Navy Vessels Using Bragg Gratings and a Prototype DSWDM System
7 0 ■ WINTER 2002 NAVAL ENGINEERS JOURNAL
FIGURE 10:Spot Shift Due to
Applied Strain for
Perfect PGP Alignment
CHRIS BALDWIN is currently a senior research engineer for the Smart Materials TechnologyDevelopment Group at Systems Planning and Analysis, Inc. He has over seven years of experience work-ing on FOS and smart structures. Projects include fiber optic based acoustic sensors, strain sensors forembedded composites, multi-point strain and temperature sensor systems, and shape sensing systems.