Structural studies of the human hematopoietic receptor...
81
Structural studies of the human hematopoietic receptor tyrosine kinase Flt3 David DE PUE Master’s dissertation submitted to obtain the degree of Master of Biochemistry and Biotechnology Major Biochemistry and Structural Biology Academic year 2011-2012 Promoter: Prof. Dr. Savvas Savvides Scientific supervisor: Dr. Kenneth Verstraete Department of Biochemistry and Microbiology Laboratory for Protein Biochemistry & Biomolecular Engineering
Transcript of Structural studies of the human hematopoietic receptor...

Structural studies of the human hematopoietic receptor tyrosine kinase Flt3
David DE PUE
Master’s dissertation submitted to obtain the degree of
Master of Biochemistry and Biotechnology
Major Biochemistry and Structural Biology
Academic year 2011-2012
Promoter: Prof. Dr. Savvas Savvides
Scientific supervisor: Dr. Kenneth Verstraete
Department of Biochemistry and Microbiology
Laboratory for Protein Biochemistry & Biomolecular Engineering

Preface A master thesis is more than the icing on the cake or the last hurdle in the pursuit to obtain a degree. This thesis is the result of a hard year’s work. It has been a road strewn with hurdles,
which required an academic year full of dedication and commitment to complete it.
The main raison why I chose for the biochemistry and biotechnology program five years ago
is the fact that I wanted to obtain a thorough understanding of life on a molecular level. Structural biology is a discipline that is situated at the very heart of the molecular life sciences. I’m very thankful to my promoter, prof. Savvas Savvides, for giving me the
opportunity to obtain hands-on experience in this fascinating field and for giving me the chance to contribute to the research in his group. I would also like to thank dr. Kenneth Verstraete, for all the time and effort he invested as a great scientific supervisor of my
thesis.
Thanks to all other people in the lab, for being so helpful and supportive. Your drive and
enthusiasm was quite contagious. It was very inspiring for me to be amidst such intelligent and passionate people. Finally, thanks to my colleagues, the other thesis students Erwin, Jeroen and Dagmar, for the inspiring conversations about structural biology and for the less
inspiring but nevertheless pleasant conversations about less serious subjects.
It has been a great time,
David De Pue

Table of contents
Abbreviations
i
Abstract
iii
Samenvatting
iv
Part 1: Introduction
1
1.1 Hematopoiesis: the generation of new blood cells
1
1.1.1 Hematopoiesis is a hierachical process
1
1.1.2 Hematopoietic cytokines control hematopoiesis
2
1.1.3 Deregulated hematopoiesis results in hematological malignancies 2
1.2 Flt3, an RTK drug target in AML
3
1.2.1 Architecture and function of receptor tyrosine kinases
3
1.2.2 Flt3, a RTK III family member important for hematopoiesis 5
1.2.3 Flt3 as a drugtarget in acute myeloid leukemia
5
1.3 Current structural knowledge of RTK III receptors
7
1.3.1 Flt3 ligand is a helical bundle cytokine
7
1.3.2 Structures of complexes homologous to Flt3:FL
9
1.3.3 Flt3, a structural outlier within the RTK III family
12
Part 2: Aim
17
Part 3: Results
18
3.1 Flt3 domain 1 (Flt3D1)
18
3.1.1 Purification of recombinant Flt3D1
18
3.1.2 Crystallization screens of deglycosylated Flt3D1
20
3.2 Flt3 domain 5 (Flt3D5)
21
3.2.1 Small-scale expression of Flt3D5
21
3.2.2 Pilot expression and purification of Flt3D5
22
3.2.3 Deglycosylation test
22
3.2.4 Crystallization screens of glycosylated Flt3D5
23
3.2.5 Large-scale expression and purification of Flt3D5
24
3.2.6 Crystallization screens of deglycosylated Flt3D5
28
3.3 Flt3 ectodomain constructs in complex with FL
29
3.3.1 Cloning of ectodomain constructs
29
3.3.2 Small-scale expression test of Flt3D2-D3 and Flt3D2-D4
29
3.3.3 Small-scale coexpression test of Flt3D2-D4 and nFL
32
3.3.4 Large-scale expression and purification of Flt3D2-D4 coexpressed with FL 33
3.3.5 Crystallization screens of Flt3D2-D4:FL complex
36
Part 4: Summary and Discussion
38
4.1 Some general considerations
38
4.2 Flt3 domain 1 (Flt3D1)
38
4.2.1 Expression, purification and deglycosylation of Flt3D1
38
4.2.2 Crystallization screens of deglycosylated Flt3D1
39
4.2.3 Future prospects regarding Flt3D1
39
4.3 Flt3 domain 5 (Flt3D5)
39

4.3.1 Expression, purification and deglycosylation of Flt3D5
39
4.3.2 Crystallization screens of glycosylated and deglycosylated Flt3D5 40
4.3.3 Future prospects regarding Flt3D5
40
4.4 Flt3 ectodomain constructs in complex with FL
40
4.4.1 Cloning, expression and purification of Flt3D2-D4
40
4.4.2 Crystallization screens of glycosylated Flt3D2-D4 in complex with FL 41
4.4.3 Future prospects regarding Flt3D2-D4
41
Part 5: Nederlandstalige samenvatting
42
Part 6: Material and Methods
45
6.1 Cloning of Flt3 ectodomain constructs
45
6.2 Small-scale expression test of Flt3 ectodomain constructs in HEK293T cells 46
6.3 Large scale expression of Flt3 ectodomain constructs in mammalian cells 47
6.3.1 Pilot expression of Flt3D5 in HEK293T cells
47
6.3.2 Tetracycline-induced expression of Flt3D1 in HEK293S GnTI-/- cells 48
6.3.3 Upscaled expression of Flt3D5 in roller bottles
48
6.3.4 Coexpression of Flt3D2-D4 and nFL
48
6.4 Purification, concentration and deglycosylation of Flt3 ectodomain constructs 49
6.4.1 Immobilized metal affinity chromatography
49
6.4.2 Desalting
49
6.4.3 Concentrating the protein samples
50
6.4.4 Enzymatic deglycosylation
50
6.4.5 Gel filtration
50
6.4.6 Cation exchange
51
6.5 Crystallization screens
51
Part 7: References
53
Part 8: Protocols and buffers
57
Part 9: Additional information about Flt3 ectodomain constructs 69

i
Abbreviations
ADCC antibody-dependent cell-mediated cytotoxicity ALL acute lymphoblastic leukemia AML acute myeloid leukemia
BM bone marrow BME β-mercaptoethanol CDC complement-dependent cytotoxicity
CLP common lymphoid progenitor CMP common myeloid progenitor CSF-1 colony stimulating factor-1
CSF-1R colony stimulating factor-1 receptor DC dentritic cell DLS dynamic light scattering
DMEM Dulbecco's modified Eagle medium DMSO dimethyl sulfoxide EC ectodomain
EM electron microscopy EndoH endoglycosidase H EPO erythropoietin
FCS foetal calf serum FL Flt3 ligand Flt3 fms-like tyrosine kinase 3
GF gel filtration GH growth hormone GM-CSF granulocyte-macrophage colony-stimulating factor
HEK human embryonic kidney HRP horseradish peroxidase HSC hematopoietic stem cell
IFN interferon Ig-like immunoglobulin-like IL23-p19 p19 subunit of interleukin-19
IL-3 Interleukin-3 IL-34 Interleukin-34 IMAC immobilized metal affinity chromatography
ITC isothermal titration calorimetry ITD internal tandem duplication JM juxtamembrane domain
LSC leukemic stem cell MCS multiple cloning site M-CSF macrophage colony-stimulating factor
MPP multipotent progenitor MWCO molecular weight cut off NK natural killer cell

ii
PCR polymerase chain reaction PDB Protein Data Bank PDGF platelet derived growth factor
PDGFR platelet derived growth factor receptor PEI polyethyleneimine PM point mutation
PNGase F Peptide:N-glycosidase F RTK receptor tyrosine kinase SAXS small-angle x-ray scattering
SCF stem cell factor SDS-PAGE sodium dodecyl sulfate polyacrylamide gel electrophoresis SEC size exclusion chromatography
TK tyrosine kinase TKI tyrosine kinase inhibitor TM transmembrane domain
VEGF vascular endothelial growth factor

iii
Abstract FMS-like tyrosine kinase 3 (Flt3) is a class III receptor tyrosine kinase with a central role in hematopoiesis, the formation of new blood cells. Signaling via this receptor is essential for
proliferation and differentiation of hematopoietic progenitor cells. RTK III members have a characteristic modular architecture. The extracellular part, consisting of five immunoglobuline-like domains, serves to bind the dimeric ligand, while the intracellular
tyrosine kinase domain carries out signal transduction. Mutations in the Flt3 receptor occur in 35% of all the patients that suffer from acute myeloid leukemia (AML), and cause constitutive activity of the receptor. Flt3 is therefore an important drug target in the
treatment of AML. The recently uncovered structure of the Flt3 ectodomain in complex with FL (Flt3 ligand), determined at a resolution of 4.30 Å, revealed that Flt3 is a structural outlier within the RTK III family. The binding interface is surprisingly compact, covering only 900 Ų
of buried surface area. Flt3 does not exhibit homotypic contacts mediated by domain 4, in contrast to homologous receptors. Domain 1 is projected outwards and does not interact with the ligand, nor with the rest of the receptor.
A higher resolution structure of the Flt3 ectodomain in complex with FL would allow to acquire a more detailed view on the binding interface, uncovering the precise interactions
between the ligand and the receptor. Therefore, truncated Flt3 ectodomain constructs were cloned that lack domain 1. The rationale behind this truncated constructs is that domain 1 possibly decreases the diffraction quality of the crystals because of its inherent flexibility.
One particular Flt3 ectodomain construct, Flt3D2-D4 (domain 2, domain 3 and domain 4), was coexpressed with FL in HEK293T cells. Complex formation of Flt3D2-D4 with FL was demonstrated with size exclusion chromatography. This indicates that Flt3D2-D4 is stable and
able to form a complex with FL in the absence of domain 1.
Two additional crystallographic targets of this thesis are Flt3D5 (domain 5) and Flt3D1 (domain
1). A high-resolution structure of domain 5 could shed some light on its function and would allow to gain some structural insights into the effect of the oncogenic Ser451Phe mutation. Flt3D5 was transiently expressed in HEK293T cells. Domain 1 of Flt3 is unusually large,
because of a long N-terminal segment that is completely absent in homologous receptors. A crystal structure of Flt3D1 would allow to gain some knowledge about its hitherto unknown function. Flt3D1 was expressed by a HEK293S GnT-/- cell line that was stably transfected with
a Flt3D1 construct. Both domains, Flt3D1 and Flt3D5, were expressed and purified to substantial levels, and subsequently used for initial crystallization screening.

iv
Samenvatting FMS-gerelateerd tyrosine kinsase 3 (Flt3) is een klasse III receptor tyrosine kinase met sleutelrol in hematopoëse, de vorming van nieuwe bloedcellen. Signalisatie via deze
receptor is van primordiaal belang voor proliferatie en differentiatie van hematopoëtische voorlopercellen. RTK III leden hebben een karakteristieke modulaire opbouw. Het extracellulaire gedeelte bestaat uit vijf immunoglobuline-achtige domeinen en staat in voor
binding van het dimere ligand, terwijl het intracellulaire tyrosine kinase domein belangrijk is voor signaaltransductie. Mutaties in de Flt3 receptor komen voor in 35% van de acute myeloïde leukemie (AML) patiënten, en veroorzaken constitutieve activering van de
receptor. Flt3 is dan ook een belangrijk doelwit voor geneesmiddelen gebruikt in de behandeling van AML. De recent opgehelderde structuur van het Flt3 ectodomein in complex met FL (Flt3 ligand), bepaald bij een resolutie van 4.30 Å, onthulde een aantal
opvallende kenmerken die Flt3 tot een structureel ‘buitenbeentje’ maken binnen de RTK III familie. De bindingssite is met zijn 900Ų oppervlakte opvallend compact. Flt3 gaat geen homotypische interacties aan ter hoogte van domein 4, in scherp contrast met homologe
receptoren. Domein 1 is naar buiten georiënteerd en vertoont geen interacties met het ligand en met de rest van de receptor.
Een hoge resolutie structuur van het Flt3 ectodomein in complex met FL laat toe een meer gedetailleerd zicht op de bindingssite te bekomen, en kan de precieze interacties tussen ligand en receptor aan het licht brengen. Daarom werden er getrunceerde Flt3
ectodomeinconstructen gekloneerd waarin domein 1 ontbreekt. Omwille van het feit dat domein 1 een hoge mate van flexibiliteit vertoont vermindert het wellicht de diffractiekwaliteit van de kristallen. Eén ectodomeinconstruct, Flt3D2-D4 (domein 2, domein 3
en domein 4) werd gecoëxpresseerd met FL in HEK293T cellen. Complexvorming tussen Flt3D2-D4 en FL werd aangetoond met gelfiltratie. Dit wijst erop dat Flt3D2-D4 stabiel is en in staat om een complex te vormen met FL in afwezigheid van domein 1.
Twee bijkomende kristallografische doelwitten van deze thesis zijn Flt3D5 (domein 5) en Flt3D1 (domein 1). Een hoge resolutie structuur van domein 5 zou licht kunnen werpen op
haar functie en zou toelaten structureel inzicht te verwerven in het effect van de oncogene Ser451Phe mutatie. Flt3D5 werd transiënt geëxpresseerd in HEK293T cellen. Domein 1 van Flt3 is ongebruikelijk groot omwille van zijn lange N-terminale segment die volledig afwezig
is in homologe receptoren. Een kristalstructuur van Flt3D1 zou toelaten inzicht te verkrijgen in de tot nog toe onbekende functie van dit domein. Flt3D1 werd geëxpresseerd door een HEK293S GnT-/- cellijn die stabiel getransfecteerd zijn met een Flt3D1 construct. Beide
domeinen, Flt3D1 en Flt3D5, werden geëxpresseerd en gezuiverd tot aanzienlijke hoeveelheden en vervolgens gebruikt voor initiële kristallisatietesten.

1
Part 1: Introduction
1.1 Hematopoiesis: the generation of new blood cells
1.1.1 Hematopoiesis is a hierarchical process Hematopoiesis, the formation of new blood cells, is a tightly regulated process that initiates
in the bone marrow (BM). All cells in the blood system are produced in a hierarchical way from a small population of hematopoietic stem cells (HSCs) that reside in the BM. Tight regulation of HSC levels is of utmost importance to maintain a homeostatic level of blood
cells (Pietras et al, 2011). HSCs give rise to increasingly lineage restricted progenitor cells, that further develop into mature blood cells. The whole process of hematopoiesis can be viewed as a hierarchical system with HSCs on top and terminally differentiated cells on the
bottom (figure 1.1). HSCs develop into all blood cell types via a process of subsequent lineage commitment, differentiation and maturation (Socolovsky et al, 1998). This process is controlled by specific transcription factors, growth factors and growth factor receptors that
specify the developmental direction that is followed (Passegue et al, 2003). The classic model of hematopoiesis can be split up in two fundamental branches. The lymphoid branch, with the CLP (common lymphoid progenitor) on top, gives rise to T cells, B cells and natural
killer (NK) cells. The myeloid branch, with the CMP (common myeloid progenitor) as progenitor cell, gives rise to granulocytes, monocytes, erythrocytes and platelets (Doulatov et al, 2012; Geismann et al, 2010). Dendritic cells (DCs) can arise from both branches
(Geissmann et al, 2010).
Figure 1.1: Hierarchical scheme of hematopoiesis. On top of the pyramid are hematopoietic stem cells (HSCs). Further downstream the pathway, the scheme splits in two branches. The lymphoid branch, with CLP (common lymphoid progenitor) on top, gives rise to T cells, B cells and natural killer (NK) cells. The myeloid branch, with CMP (common myeloid progenitor) as progenitor cell, gives rise to granulocytes, monocytes, erythrocytes and platelets. MPP: multipotent progenitor. Pro-T: Progenitor of T cell. Pro-B: Progenitor of B cell. Pro-NK: Progenitor of NK cell. E: Erythrocyte. MEP: megakaryocyte-erythroid progenitor. GMP: granulocyte-monocyte progenitor. Mo: monocyte. Mf: macrophage. Gr: Granulocyte. Adapted from Warr et al, 2011.

2
1.1.2 Hematopoietic cytokines control hematopoiesis Cytokines are relatively small proteins which function as signaling molecules that mediate
intercellular communication. The majority of cytokines are secreted, although some may occur in membrane-bound form (Metcalf, 2008). Cytokines bind to their cognate receptors with nanomolar to picomolar affinity (Robb, 2007). The production of blood cells is
orchestrated by the concerted action of hematopoietic cytokines. They can either act on one lineage (lineage restricted), or on multiple lineages. Most cytokines are multifunctional. Besides providing a proliferative stimulus, they can also promote survival, differentiation and
maturation of the target cell (Metcalf, 2008). Some typical broadly acting cytokines include GM-CSF (granulocyte-macrophage colony-stimulating factor), SCF (stem cell factor) and FL (Flt3 Ligand) (Robb, 2007).
Hematopoietic cytokines are often pleiotropic. A good example is FL signaling, which plays a role in proliferation of multipotent progenitors (MPPs) and in differentiation of dendritic
cells (Doulatov et al, 2012). There are currently two opposing models that describe the role of cytokines in hematopoiesis: the instructive model and the permissive model. In the instructive model, cytokine signaling plays a decisive role in lineage commitment. In the
permissive model, cytokines are merely signals that allow permissive growth and survival, while the differentiation itself is primarily driven by transcription factors (Robb, 2007).
1.1.3 Deregulated hematopoiesis results in hematological malignancies Hematopoiesis mainly involves generating and maintaining homeostatic levels of blood cells
(Pietras et al, 2011). In adults, HSCs are usually kept in a quiescent state (G0 phase) (Doulatov et al, 2012; Warr et al, 2011). Abnormal proliferation of hematopoietic stem cells or committed progenitors results in leukemia or blood cancer, which is characterized by
increased numbers of white blood cells. Leukemic stem cells (LSCs) arise after malignant transformation of HSCs or from transformation of more restricted progenitors (figure 1.2). In the former case, the LSCs retain the self-renewal capability of the HSCs, while in the latter
case, the LSCs have reacquired stem cell characteristics (Passegue et al, 2003). The main mechanisms of leukemic transformation include increased cell survival, increased proliferation, increased self-renewal capacity and genomic instability (Passegue et al, 2003).
Leukemias are usually not homogenous, but hierarchically organized like normal hematopoietic tissue. One could say that leukemias originate from normal hematopoietic development that has gone slightly awry (Hope et al, 2004).
The most common leukemia affecting adults is acute myeloid leukemia (Deschler and Lübbert, 2006). Acute myeloid leukemia (AML) is, as the name suggests, an acute leukemia
of the myeloid lineage. It is characterized by the presence of so-called blasts, which are increased numbers of undifferentiated progenitors (Estey, 2012). In AML, the leukemic stem cells seem to be primarily derived from hematopoietic stem cells, not from more restricted
progenitors (Hope et al, 2004). AML is a very heterogeneous disease, which consists of various molecularly-defined subgroups. This implies that every patient needs to be treated with a unique therapy, specifically adapted to the AML subtype (Estey, 2009). One of the
most common genetic aberrations found in AML is an internal tandem duplication (ITD) in the receptor tyrosine kinase Flt3, which results in constitutive activation of the receptor. This mutation is present in one third of all patients and is associated with a poor prognosis
(Stirewalt and Radich, 2003; Estey, 2012; Santos et al, 2010).

3
Figure 1.2: Two possible origins of LSCs. LSCs can arise from transformation of HSCs (left) or from transformation of more restricted progenitors (right). HSC: hematopoietic stem cell. LSC: leukemic stem cell. Adapted from Passegue et al, 2003.
1.2 Flt3, an RTK drug target in AML
1.2.1 Architecture and function of receptor tyrosine kinases Tyrosine phosphorylation is one of the key posttranslational modifications in cell signaling and is carried out by enzymes that are called tyrosine kinases. Receptor tyrosine kinases (RTKs) are transmembrane receptors that are activated when they bind their cognate ligand,
after which they transduce the signal via autophoshorylation and phosphorylation of target proteins in the cytoplasm (Hubbard and Till, 2000; Hubbard and Miller, 2007). All RTKs have a similar architecture, consisting of an extracellular ligand binding domain (EC), a single
transmembrane helix (TM) and a cytoplasmic tyrosine kinase domain (TK) (Lemmon and Schlessinger, 2010). RTKs have a prominent role in important cellular processes such as growth, differentiation, metabolism and mobility (Hubbard and Till, 2000; Hubbard and
Miller, 2007). Because of their role in cell proliferation, receptor tyrosine kinases are often involved in cancer, which makes them ideal candidates for therapeutic intervention (Hubbard and Miller, 2007). Ligand-induced oligomerization of receptor molecules is the
paradigm of RTK activation (Hubbard and Miller, 2007; Lemmon and Schlessinger, 2010). In most cases, the ligand induces dimerization of the receptor, but in some cases higher oligomers occur (Lemmon and Schlessinger, 2010).
Many important hematopoietic cytokines bind to receptors of the receptor tyrosine kinase III family (RTK III), which is also known as the PDGFR (platelet derived growth factor receptor)
family (Grassot et al, 2006). Some examples are CSF-1, IL-34, SCF and FL, which bind respectively to CSF-1R (which has both CSF-1 and IL-34 as ligand), KIT and Flt3. The EC-domain of RTK III members consist of five Ig-like domains, while the intracellular TK domain

4
is split in two parts interrupted by a kinase insert region (figure 1.3A). Figure 1.3B shows a cartoon of the ectodomain of the receptor KIT in complex with SCF, demonstrating how the
bivalent ligand induces receptor dimerization.
Figure 1.4 demonstrates the mechanism of RTK III activation. In the absence of ligand, the
inactive form of the receptor is stabilized by binding of the juxtamembrane (JM) domain (figure 1.4A), the intracellular region closest to the membrane, to the C-terminal lobe of the kinase domain (Chan et al, 2003; Griffith et al, 2004; Hubbard, 2004; Toffalini et al, 2010).
Ligand binding causes receptor dimerization, which results in abolishing of the autoinhibition by the JM domain (figure 1.4B). The now active intracellular tyrosine kinase domain phosphorylates key regulatory tyrosine residues, which then function as a binding platform
for a variety of downstream signaling molecules (Toffalini et al, 2010). Disruption of the JM domain leads to constitutive activation of the receptor, which can result in cancer (Lemmon and Schlessinger, 2010). A good example is the presence of internal tandem duplications in
the JM domain of Flt3, which occurs in approximately one third of all AML patients (Stirewalt and Radich, 2003; Estey, 2012; Santos et al, 2010).
Figure 1.3: Architecture of RTK III receptors. (A) Domain organization of RTK III. The extracellular domain (EC) consists of five immunoglobuline-like (Ig-like) domains (black curls), a single transmembrane helix (TM), and an intracellular tyrosine kinase domain (TK, red boxes) interrupted by a kinase insert region. Adapted from Hubbard and Till, 2000. (B) Cartoon representing the ectodomain of KIT in complex with its cognate ligand SCF (stem cell factor). The bivalent ligand crosslinks two receptor molecules. Furthermore, the two KIT molecules are homotypically bound to each other via domain 4 (D4) and domain 5 (D5). D1-D5: the five Ig-like domains that make up the ectodomain of the receptor. Adapted from Lemmon and Schlessinger, 2010.

5
1.2.2 Flt3, a RTK III family member important for hematopoiesis FMS-like tyrosine kinase 3 (Flt3) is a receptor that plays a critical role in the maintenance of hematopoietic homeostasis (Kikushige et al, 2008). It is expressed at high levels on
hematopoietic stem cells and on early precursors of the lymphoid and myeloid line, such as CMPs (common myeloid progenitors) and CLPs (common lymphoid progenitors) (Kikushige et al, 2008; Stirewalt and Radich, 2003). Flt3 belongs, along with other cytokine receptors
like KIT and CSF-1R, to the RTK III family (Grassot et al, 2006). Its cognate ligand, FL (Flt3 Ligand), can be either membrane-bound or secreted and is expressed by most tissues (Stirewalt and Radich, 2003). The response of Flt3 signaling depends on the cell type and on
signaling by other cytokines. The strongest proliferative effect is observed when there is a combination of FL, KIT and IL-3 (interleukin-3) signaling, so it seems that the cytokines act in synergy (Stirewalt and Radich, 2003). Rather than instructing lineage commitment, Flt3
signaling seems to promote survival of HSCs and progenitors (Kikushige et al, 2008). Besides its role in survival and proliferation of HSCs and early progenitor cells, Flt3 is of pivotal importance for the development of dendritic cells (DCs) (Geissmann et al, 2010; Metcalf,
2010; Seré et al, 2011). All DC committed precursors express Flt3, and FL is the key growth factor for the formation of the DC lineage (Seré et al, 2011). Flt3 knockout mice have irregularities in lymphoid tissue-resident dendritic cells, which also highlights the significance
of Flt3 signaling in DC development (Waskow et al, 2008).
1.2.3 Flt3 as a drugtarget in acute myeloid leukemia Flt3 mutations are among the most common genetic aberrations seen in acute myeloid leukemia (AML), observed in about one third of all patients (Stirewalt and Radich, 2003; Gu
et al, 2011). In addition, Flt3 is expressed on the surface of leukemic cells in 70-90% of all
Figuur 1.4: Mechanism of RTK III activation. (A) In the Inactive form of the receptor, the
juxtamembrane region binds to the C-terminal lobe of the kinase domain, which inhibits the
kinase activity. (B) Ligand binding causes receptor dimerization, which results in abolishing
of the autoinhibition by the JM domain. The now active intracellular tyrosine kinase domain
phosphorylates key regulatory tyrosine residues, which then function as a docking sites for
downstream signaling molecules (depicted in green). Adapted from Toffalini et al, 2010.

6
AML patients (Gu et al, 2011). Furthermore, Flt3 mutations and overexpression are often seen in other types of leukemia, such as acute lymphoblastic leukemia (ALL) and
myelodysplasia (Stirewalt and Radich, 2003). The most common Flt3 mutation observed is an internal tandem duplication (ITD) in the juxtamembrane (JM) domain, resulting in constitutive activation of the receptor, caused by the loss of autoinhibition exerted by the
JM domain on the tyrosine kinase domain (Stirewalt and Radich, 2003; Estey, 2012; Santos et al, 2010). The ITD mutation in Flt3 is typically associated with a poor prognosis, as the chance for survival is typically lower for patients who have a Flt3-ITD compared with patients
who express the wild type receptor (Estey, 2012). Besides the ITD mutation, also non synonymous point mutations (PM) can occur in AML. A distinction is made between passenger mutations, which are neutral and non-oncogenic, and driver mutations, which
affect receptor activation and are oncogenic (Fröhling et al, 2007). Most driver mutations are situated in the intracellular TK and JM domain. An exception is the Ser451Phe mutation in domain 5 of the ectodomain (Fröhling et al, 2007).
The oncogenic effect of constitutive Flt3 activation and Flt3 overexpression in leukemic blasts makes Flt3 a good drugtarget in the treatment of AML. Patients with the Flt3 ITD
mutation are usually treated with a combination of conventional chemotherapeutics (cytotoxic agents) and tyrosine kinase inhibitors (TKIs) such as midostaurin (which is a broad-acting TKI) and sorafenib (which is more Flt3-specific) (Estey, 2012). However, the most
common cause of failure in treatment of AML is resistance to the therapy (Estey, 2009). One can distinguish two sorts of resistance: primary resistance, which is inherent to the malignant clone, and secondary resistance, which emerges after an initial response to the
treatment (Kindler et al, 2010). Figure 1.5 gives a schematic overview of the different mechanisms of resistance against TKIs against Flt3. Primary resistance can be Flt3-dependant, whereby specific mutations in Flt3 make the AML patient insensitive to Flt3-
specific TKIs, or Flt3-independent, whereby Flt3-inhibition is bypassed with alternative survival pathways (Kindler et al, 2010). Secondary resistance arises in response to initial treatment, and has different possible causes, such as new resistance mutations and Flt3
overexpression (Kindler et al, 2010).
A very common mechanism of secondary resistance against TKIs in AML is overexpression of
FL (Flt3 Ligand) by leukemic cells in response of Flt3 inhibition and chemotherapy, resulting in autocrine stimulation of Flt3 (Levis, 2011). Plasma levels of FL are known to be elevated after treatment (Sato et al, 2011). Overexpression of FL decreases the cytotoxic effects of
different Flt3-specific TKIs (Kindler et al, 2010; Levis, 2011; Sato et al, 2011). Although ITD-mutated Flt3 is active in absence of ligand, recent evidence suggests that the ITD-mutated Flt3 is highly responsive to FL (Levis, 2010). Considering the problems of FL overexpression in
response to treatment with TKIs and the general lack of potency of Flt3-specific TKIs (Sato et al, 2011), it might be interesting to target the Flt3-FL interaction in addition to the intracellular tyrosine kinase activity. The receptor-ligand interaction can be targeted with
protein-based therapeutics, such as monoclonal antibodies (Piloto et al, 2006; Yanamoto et al, 2006). The major benefit of using antibodies to target the ectodomain of Flt3 is the fact that it recruits the immune system, besides inhibiting formation of the ligand-receptor
complex. The malignant cells that are marked with Flt3-binding antibodies can be killed by antibody-dependent cell-mediated cytotoxicity (ADCC) or by complement-dependent cytotoxicity (CDC). Alternatively, the interaction can be targeted by peptidomimetics, or by
7
small organic molecules. Detailed structural knowledge of the Flt3-FL complex is indispensable to develop interaction-targeting small molecule drugs by means of rational
design.
1.3 Current structural knowledge of RTK III receptors interacting with their cognate ligand
1.3.1 Flt3 ligand is a helical bundle cytokine FL (Flt3 Ligand) is a homodimeric cytokine consisting of short chain α-helical bundle subunits (figure 1.6) (Savvides et al, 2000). FL exists in membrane-bound and in secreted form. Its fold
is analogous to that of CSF-1 (colony stimulating factor 1), SCF (stem cell factor) and IL-34 (interleukin-34). As the name suggests, the predominant elements of secondary structure in α-helical bundle cytokines are the four α-helices (αA, αB, αC and αD). The dimer interface of
FL consists mainly of hydrophobic residues. Each subunit of FL buries approximately 1000 Ų of hydrophobic surface at the dimer interface (Savvides et al., 2000).
Figure 1.5: Schematic overview of resistance mechanisms against Flt3-specific tyrosine kinase inhibitors. One can distinguish two types of resistance: primary resistance, which is inherent to the malignant clone, and secondary resistance, which emerges after an initial response to the treatment. Adapted from Kindler et al, 2010.

8
Figure 1.6: Crystal structure of Flt3 Ligand (FL). Structure of FL in cartoon representation. The dimeric ligand is shown in its secreted form. Each of the two subunits (depicted in green en red) consist of four α-helices (αA, αB, αC and αD), and two small β-strands (β1 and β2) forming an antiparallel β-sheet. The position of the N-terminus (N) and C-terminus (C) of both subunits is indicated. PDB Entry 1ETE. Figure created with YASARA (Krieger et al, 2002).
FL, SCF, CSF-1 (also known as M-CSF, macrophage colony stimulating factor) and IL-34 are four hematopoietic cytokines that bind to receptors of the RTK III (receptor tyrosine kinase
III) family. The RTK III family, also known as the PDGFR-family (platelet-derived growth factor receptor), is related to the RTK V family. An important difference between RTK III and RTK V receptors at the level of the ectodomain organization is that RTK III receptors have five Ig-
like domains in their ectodomain, while the ectodomain of RTK V receptors consists of seven Ig-like domains. Immunoglobulin-like (Ig-like) domains consist of approximately 100 amino acids, forming a β-sandwich containing 7-9 β-strands, named A to G. The ligands of the RTK
III/V family can be subdivided in two fundamentally different folds. FL, CSF-1 and SCF are helical bundle cytokines, while PDGF (platelet derived growth factor) and VEGF (vascular endothelial growth factor) are so-called ‘cystine knots’, covalently linked dimers consisting of
two protomers that contain two pairs of antiparallel β-strands. Most cytokines have a helical bundle fold. Besides FL, CSF-1 and SCF that bind to RTK III receptors, other helical bundle cytokines include GH (growth hormone), EPO (erythropoietin) and IFN (interferon), which all
bind to type I or type II cytokine receptors.
Although ligands of the PDGFR receptor family can be partitioned in two fundamentally
different structural folds, they all have some common features. First, they have similar overall dimensions (~70 Å x 35 Å x 25 Å). Second, they are all dimeric ligands that have a two-fold axis of symmetry. Third, they all bind bivalently to their cognate receptor, with two
binding sites separated by circa 45 Å. Figure 1.7 shows a comparison between the complex formed by SCF (a helical bundle cytokine) bound to KIT (Yuzawa et al, 2008) and the complex formed by PDGF-B (a cystine knot cytokine) bound to PDGFRβD1-D3 (the three N-terminal
domains of platelet derived growth factor β) (Shim et al, 2010). Despite the fundamentally different cytokine fold, the ligand binds in a similar manner to the receptor, bridging two receptor arms at the level of D2 (the second Ig-like domain) and D3 (the third Ig-like
domain).

9
Figuur 1.7: RTK III ligands exhibit a common mode of receptor binding. (A) Detailed view of the KIT:SCF complex, showing the SCF dimer (red, cartoon representation) bound to D1 (domain 1), D2 (domain 2) and D3 (domain 3) of both KIT receptor arms (green, surface representation). PDB entry 2E9W. (B) Complex formed by PDGF-B (red, cartoon representation) bound to PDGFRβD1-D3 (green, surface representation). PDB entry 3MJG. Both figures created with YASARA (Krieger et al, 2002).
1.3.2 Structures of complexes homologous to Flt3:FL The first known structure of a RTK III ectodomain in complex with its cognate ligand, KIT in complex with SCF, was published in 2007 (Yuzawa et al, 2007). KIT is, just like Flt3 and CSF-
1R, a RTK III receptor that binds a helical bundle cytokine, in this case SCF. The crystal structure of the homodimeric receptor complex bound by SCF provides insights in the activation mechanism of RTK III receptors. The structure of the entire ectodomain of KIT (all
five Ig-like domains) in complex with SCF, the SCF:KIT 2:2 complex, was solved to a resolution of 3.5 Å (figure 1.8A). The receptor complex exhibits a long two-fold non-crystallographic axis of symmetry. Each subunit of the dimeric ligand binds to D1, D2 and D3 of one receptor
arm. SCF crosslinks the two receptor arms. The calculated buried surface area at the ligand-receptor interface is 2060 Ų. A comparison between the structure of the complex and the structure of the KIT ectodomain alone (figure 1.8B), highlights the reorientation of D4 and
D5 relative to the position of D1-D2-D3 during receptor dimerization. One could consider the first three Ig-like domains, D1-D2-D3, as a functional SCF-binding unit, while the two remaining domains, D4 and D5, are engaged in lateral homotypic interactions (Yuzawa et al,
2007).
CSF-1R is a quite remarkable RTK III family member given the fact that it can bind two
different cytokine ligands, CSF-1 and IL-34, despite the low level of sequence homology between both ligands (Lin et al, 2008). The first structure of the murine CSF-1R (also known as FMS), in complex with CSF-1 (also known as M-CSF, macrophage colony stimulating
factor) was published in 2008 (Chen et al, 2008). The authors reported a 2.4 Å crystal structure of the first three domains, D1-D2-D3 of CSF-1R in complex with CSF-1, in a 1:2 stoichiometry (figure 1.9A). The surface area buried in the interface between CSF-1 and CSF-
1R is 1740 Ų. The structure of this partial complex reveals some notable differences with the KIT-SCF complex (figure 1.9B). KIT engages D1, D2 and D3 in ligand binding, while CSF-1R only uses D2 and D3 to bind CSF-1. While D1 is orientated toward SCF in KIT, in CSF-1R it
points away from CSF-1. Furthermore, the orientation of D2 in CSF-1R is completely opposite to the orientation of D2 in KIT (Chen et al, 2008).

10
Figure 1.8: Crystal structure of the KIT ectodomain, in complex with SCF (A), and as an ectodomain monomer (B). The structure is displayed as a ribbon diagram. SCF is colored in magenta, D1 in blue, D2 in green, D3 in yellow, D4 in orange and D5 in pink. The arrow points to the large cavity in the center of the complex. Adapted from Yuzawa et al, 2007. PDB entry 2E9W (complex) and 2EC8 (ectodomain monomer).
Figure 1.9: Crystal structure of CSF-1RD1-D2-D3 in complex with CSF-1, and comparison with the KIT:SCF complex. (A) Cartoon diagram representing the crystal structure of CSF-1 in complex with the first three domains (D1, D2 and D3) of CSF-1R, in a 2:1 stoichiometry. (B) Comparison between the first three domains of CSF-1R bound to CSF-1 (left), and the first three domains of KIT in complex with SCF (right). PDB entry CSF-1R:CSF-1 3EJJ, PDB entry KIT:SCF 2E9W. Both figures created with YASARA (Krieger et al, 2002).
Based on the observation of the unexpected binary complex formed by CSF-1RD1-D3 and CSF-
1, the authors came to the hypothesis that the truncated CSF-1R, without D4 and D5, can only form a partial complex with CSF-1 (Chen et al, 2008). They supported this speculative

11
hypothesis with an ITC (isothermal titration calorimetry) experiment in which they titrated CSF-1RD1-D3 with CSF-1. Based on the obtained results, they proposed a 2:1 stochiometry.
Comparable ITC experiments, both on human and murine receptor constructs, were independently performed by some other groups (Elegheert et al, 2011; Ma et al, 2012) and seemed to contradict this findings.
Recent work on both human and murine CSF-1R has proved that formation and stability of a ternary complex is dependent on a stoichiometric excess of ligand (Elegheert et al, 2011).
The presence of a 2:2 ternary complex composed of two molecules of CSF-1RD1-D3 and the bivalent dimeric CSF-1 was demonstrated with different techniques, including SEC (size exclusion chromatography), ITC and SAXS (small-angle x-ray scattering) (Elegheert et al,
2011). Based on EM (electron microscopy) images of negatively stained hCSF-1RD1-D5:hCSF-1, a 3D molecular envelope of the human CSF-1R (hCSF-1R) ectodomain in complex with CSF-1R was reconstructed (figure 1.10). This model illustrates clearly that CSF-1 binds bivalently
to two receptor molecules at the level of D2 and D3, while D4 mediates homotypic interactions between the two receptor arms (Elegheert et al, 2011).
Figure 1.10: 3D molecular envelope of hCSF-1RD1-D5:hCSF-1 based on negatively stained EM images. The envelope is depicted in grey and is superimposed with computational models of the complex. Adapted from Elegheert et al, 2011.
CSF-1R binds IL-34, its more recently identified ‘second’ ligand (Lin et al, 2008), with an
affinity that is approximately tenfold higher than the affinity for CSF-1 (Ma et al, 2012). Recently, crystal structures of IL-34 in complex with CSF-1 were published, for both the human complex (Ma et al, 2012) and the murine complex (Liu et al, 2012). The recently
published crystal structure of the three N-terminal domains of hCSF-1R in complex with IL-34 (figure 1.11A), determined at a resolution of 3.0 Å, reveals a surprisingly similar complex as observed for CSF-1R bound to CSF-1 (Ma et al, 2012). IL-34 is, just as CSF-1, a dimeric helical
bundle cytokine. Furthermore, the stoichiometry of the crystallized complex is, just as for CSF-1 in complex with CSF-1R, 1:2 (one receptor arm that binds the dimeric ligand), although al biophysical experiments indicate a 2:2 complex in solution (Ma et al, 2012). A notable
difference is the more extended conformation of D2 and D3 in CSF-1R:IL-34 compared to CSF-1R:CSF-1, which was also observed for the murine complex (Liu et al, 2012). It is this interdomain plasticity between D2 and D3 that allows CSF-1R to bind two different ligands
with high affinity (Ma et al, 2012; Liu et al, 2012). The murine CSF-1R:IL-34 complex was crystallized as a ternary complex with a 2:2 stochiometry (figure 1.11B) (Liu et al, 2012).

12
Figure 1.11: Crystal structures of IL-34 in complex with CSF-1RD1-D3. (A) Cartoon representation of 2:1 complex consisting of hIL-34 dimer (blue) bound to one hCSF-1RD1-D3 receptor arm (yellow). Adapted from Ma et al, 2012. PDB entry 4DKD. (B) Cartoon representation of 2:2 complex consisting of mIL-34 dimer bound to two mCSF-1RD1-D3 receptor arms. Adapted from Liu et al, 2012. PDB entry 4EXP.
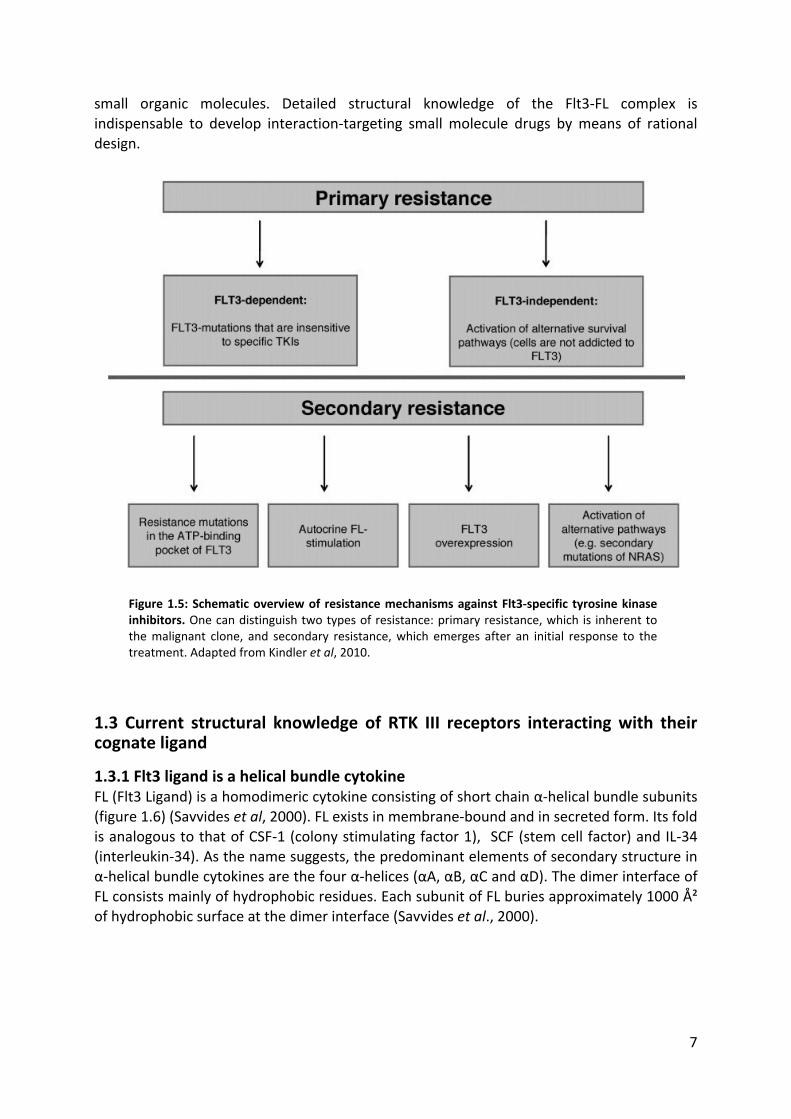
1.3.3 Flt3, a structural outlier within the RTK III family The complete structure of Flt3 ectodomain in complex with FL unveiled some very striking
features that make Flt3 a structural outlier within the RTK III family (Verstraete et al, 2011). Based on the observations made for KIT (Yuzawa et al, 2007) and CSF-1R (Chen et al, 2008; Elegheert et al, 2011; Ma et al, 2012), the structural paradigm for RTK III activation states
that the N-terminal Ig-like domains (especially D2 and D3) bind to the bivalent cytokine, which serves to crosslink the two receptor arms, while the membrane-proximal domains make homotypic contacts to stabilize the ternary complex. The crystal structure of Flt3D1-
D4:FL (the ectodomain without D5, in complex with FL), determined with a resolution of 4.30 Å, demonstrates that Flt3 differs from this proposed paradigm (figure 1.12). At a first glance, one could readily observe the rather compact binding epitope, which is solely contributed by
domain 3 (D3) of the receptor. Another striking feature is the absence of homotypic interactions at the level of D4. The overall architecture of the complex could be described as an ‘open horseshoe’ ring with dimension 100 x 75 x 110 Å. FL binds bivalently to Flt3, with
the membrane-distal tip of D3 engaged in the interaction. The two-fold symmetry only holds for the Flt3D2-D3:FL subcomplex. Domain 1 and domain 4 are asymmetrically oriented compared to their tandem modules in the complex (Verstraete et al, 2011).
Domain 3, the Ig-like domain that binds FL, is a member of the I-set Ig domains (figure 1.13), and is structurally homologous to D3 of KIT (Yuzawa et al, 2007) and CSF-1R (Chen et al,
2008). There are several variations to the Ig-like fold, all having a specific β-strand topology. Loops are named after the β-strands they connect. A common feature of all Ig-like domains is the presence of a disulfide bond between the B-strand and F-strand. The I-type Ig-like
domains consist of eight β-strands making up two β-sheets, ABED and A’FGC (Verstraete et al, 2011).
13
D3 is the only Ig-like domain of Flt3 that binds FL, while D2 is packed against the hydrophobic patch of the ABED-face of D3. Binding of FL is mainly contributed by the BC loop and D-strand of D3, which contact the N-terminal loop of the ligand. Furthermore, the
carboxy-terminal region of the αC-helix of FL is bound by the DE loop. The whole binding epitope is surprisingly compact, consisting of a single contact site of approximately 900 Ų buried surface area (Verstraete et al, 2011). Figure 1.14 gives a detailed view on the Flt3-FL
binding interface.
Figure 1.12: Crystal structure of the Flt3D1-D4:FL complex. The structure is represented as a ribbon diagram. The two-fold axis of symmetry (holding for Flt3D2-
D3:FL) is oriented along the vertical axis of the plane. Adapted from Verstraete et al, 2011.
Figure 1.13: I-type of immunoglobulin fold. Left panel: Stucture of I type Ig-like domain. Right: topology diagram of I type Ig-like domain. Adopted from Sun et al, 2004.

14
Another remarkable feature of Flt3 is the absence of homotypic interactions mediated by D4
of the receptor. The EF loop of D4, which mediates the homotypic interactions, differs drastically in Flt3 compared to homologous receptors, both in sequence and in structure. Most members of the RTK III/V family have a conserved sequence fingerprint in the EF loop
of domain 4 (RTK III) or domain 7 (RTK V), the so-called ‘tyrosine corner’ motif (figure 1.15). It has been shown that this motif in the EF loop is involved in homotypic interactions in KITD4 (Yuzawa et al, 2007), VEGFRD7 (Yang et al, 2010), and PDGF-RD4 (Yang et al, 2008). The motif
consists of a conserved arginine, an acidic residue (either glutamic acid or aspartic acid), a glycine and a tyrosine. Flt3D4 lacks both the arginine and the acidic residue. Figure 1.16 gives a close view on domain 4 of KIT and Flt3, highlighting the residues that are part of the EF-
loop. Besides, the two D4 domains are symmetrically oriented in KIT, while in Flt3 they are asymmetrically positioned. The linker region between domain 3 and domain 4 in Flt3 is similar to the linker between the two domains in KIT, suggesting a common role in both
receptors. The linker allows a certain level of flexibility by acting as a hinge. In KIT, this flexible hinge allows to reorient D4 in order to mediate homotypic interactions upon ligand binding. In Flt3 however, homotypic interactions are not observed (Verstraete et al, 2011).
Figure 1.14: Detailed view on the Flt3-FL binding interface. (A) Close-up view of the Flt3-FL interface. FL is colored in green, Flt3D3 in in gray, Flt3D2 in orange. Residues important for the interaction are shown as sticks protruding from spheres representing Cα. (B) Overview of the Flt3-FL interface. The Cα trace of Flt3D2-D4 is colored in red, while FL is shown in ribbon representation in green. Residues at the hydrophobic interface are shown as black sticks. Disulfide bonds in Flt3 are represented as yellow balls and sticks. Adopted from Verstraete et al, 2011.

15
Crystals of Flt3D1-D5:FL, the full ectodomain in complex with ligand, diffracted to a resolution of 7.8 Å, which was enough to elucidate the overall architecture of the complex (figure 1.17),
which resembles a hollow tennis racket with dimensions 140 x 75 x 110 Å (Verstraete et al, 2011). The asymmetry of D4 that was observed in Flt3D1-D4:FL is not present in the full ectodomain. However, D5 and D1 do not participate in the two-fold symmetry exhibited by
the rest of the complex. In mice, a functional splicevariant exists that lacks domain 5. This seems to indicate that the Ig-like domain closest to the membrane, domain 5, is unnecessary for the function of Flt3, at least in mice (Lavagna et al, 1995).
The role of domain 1 remains unclear. In the ligand-bound complex, D1 protrudes from the core of the complex, and is projected about halfway down the height of the complex. D1 is a
very atypical domain, because of its unusual large size and the presence of long flexible N-terminal segment that precedes the domain. Perhaps, D1 plays a role in the stabilization of the unbound receptor, or it could mediate intermolecular contacts with other proteins at the
cell surface (Verstraete et al, 2011).
Figure 1.15: Sequence alignment reveals the absence of a tyrosine corner in Flt3D4. The sequence motif in the EF of D4 (in RTK III) or D7 (in RTK V) loop is important for lateral homotypic interactions. Adopted from Verstraete et al, 2011.
Figure 1.16: Homotypic interactions between two D4’s are present in KIT, not in Flt3. (A) Closer view on the two KITD4 domains. The ‘tyrosine corner’ residues are represented as sticks. (B) Closer view on the Flt3D4 domains. The two conserved ‘tyrosine corner’ residues are represented as sticks. Figure created with Pymol (The PyMOL Molecular Graphics System, Version 1.5.0.4 Schrödinger, LLC)

16
Figure 1.17: Overall architecture of the Flt3 ectodomain in complex with FL. The structure is represented in cartoon representation. FL is colored in blue, while Flt3 is colored in red. The five Ig-like domains are indicated on one of the two receptor arms. Figure created with YASARA (Krieger et al, 2002).

17
Part 2: Aim
The crystal structure of the Flt3 ectodomain in complex with FL unveiled some very striking and surprising features that clearly distinguish Flt3 from other members of the RTK III family. The binding interface is surprisingly compact, covering only 900 Ų of buried surface area.
Furthermore, only domain 3 is engaged in the interaction with the ligand. In sharp contrast to the homologous receptors CSF-1R and KIT, Flt3 does not exhibit any homotypic interactions mediated by domain 4. Furthermore, the outward projection of domain 1,
which does not interact with the ligand or the rest of the complex, is very atypical. The crystal structure of the complex, which is in its own right very revealing, raises some remaining questions that are at present still unanswered. This thesis aims to address some
of these questions.
The resolution to which the Flt3D1-D4:FL complex was determined, 4.30 Å, was sufficient to
obtain a good general picture of the receptor-ligand complex. However, a higher resolution is necessary in order to acquire a more detailed view of the binding epitope. This detailed view could reveal the precise interactions between the ligand and the receptor, which is
valuable knowledge in the prospect of therapeutic targeting of the interaction. In order to obtain a higher resolution image of the interaction, it could be worthwhile to invest in Flt3 ectodomain constructs that lack domain 1 (D1). Given the fact that D1 exhibits significant
disorder and domain flexibility, it possibly hampers the formation of crystal contacts. Crystals of Flt3:FL complexes lacking D1 possibly diffract to a higher resolution because of better crystal packing. Therefore, a first goal of this thesis was to clone, express and purify
human Flt3D2-D3 (domain 2 and domain 3) and Flt3D2-D4 (domain 2, domain 3 and domain 4), and try to crystallize these receptor constructs in complex with Flt3 ligand (FL).
Flt3D1-D5:FL, the full ectodomain in complex with the ligand, diffracted to a resolution of 7.80 Å, which allows to observe the overall architecture of the complex. This overall architecture indicates that domain 5 (D5), just like D4, does not participate in homotypic interactions.
Domain 5 itself is an interesting target for crystallization. Its position close to the membrane makes it an attractive target for protein-based therapeutics such as monoclonal antibodies. A high-resolution structure of this domain could shed some light on its function, and could
provide some structural insights into the effect of the oncogenic Ser451Phe mutation. Therefore, the second goal of this thesis was to express and purify Flt3D5 towards X-ray crystallographic studies.
The third crystallographic target of this thesis is Flt3D1 (domain 1). D1 of Flt3 is unusually large, because it contains a long N-terminal segment (around 40 amino acids) which is
completely absent in homologous receptors. Secondary structure prediction software reveals that this segment most likely exhibits a β-fold, and might serve as an extension to the Ig-like fold of the rest of the domain. A high resolution crystal structure can give some
insights in the hitherto unknown function of Flt3D1.
Achieving the aforementioned goals could significantly contribute to our fundamental
knowledge about the structure and the function of the Flt3 receptor and the Flt3-FL interaction, and could be an important step forward in the development of therapeutics that antagonize this interaction.

18
Part 3: Results
3.1 Flt3 domain 1 (Flt3D1)
3.1.1 Purification of recombinant Flt3D1
Domain 1 of Flt3 was expressed by a stable HEK293S GnT-/- cell line that has stably integrated
a Flt3D1 construct cloned in the pcDNA4/TO/mu vector. Expression of Flt3D1 was induced with tetracycline (2 mg/ml) and in the presence of sodium butyrate (5 mM). A total of 2500 ml medium, containing the secreted Flt3D1 was loaded on a Talon Superflow column
(Clontech Laboratories, Inc.) for a first IMAC (immobilized metal affinity chromatography) purification step, taking advantage of the C-terminal polyhistidine-tag (His6-tag) of the construct. To check whether the IMAC purification was successful, a SDS-PAGE gel was
loaded with samples of the medium, the flow through, a washing step with binding buffer, a washing step with 5 mM imidazole and the eluted fraction (eluted with a 200 mM imidazole containing buffer) (figure 3.1).
Figure 3.1: SDS-PAGE evaluation of the IMAC purification of Flt3D1. The molecular weights of individual bands in the protein marker are given on the left. M: protein marker (Precision Plus Protein All Blue, Bio-rad). Medium: sample from medium prior to IMAC purification. FT: sample from flow through during loading of the medium. 0 mM imi.: sample from flow through obtained during washing step with binding buffer (300 mM NaCl, 50 mM NaH2PO4, pH 7.2) 5 mM imi.: sample from flow through obtained during washing step with buffer containing 5 mM imidazole. 200 mM imi.: Sample from fraction obtained by elution with buffer containing 200 mM imidazole. The band corresponding to Flt3D1 is indicated with an arrow.

19
Glycosylated Flt3D1 (indicated with an arrow) is visible in the eluted fraction, running at a molecular weight of around 20 kDa. The molecular weight of fully deglycosylated D1 is
around 16 kDa. Given the fact that D1 had 3 N-glycosylation sites, Flt3D1 runs at an expected height.
After an overnight deglycosylation with EndoHf, the sample was loaded on a HiLoad Superdex™ 75 column. Figure 3.2 show the elution profile of this purification step. Fractions of 1.5 ml were collected starting from the void volume (40 ml) to the column volume (120
ml). Deglycosylated Flt3D1 (indicated with an arrow) has an elution volume of approximately 66 ml. The small peak (indicated with an asterisk) that runs just after the void peak corresponds to EndoHf.
Figure 3.2: Gel filtration elution profile of deglycosylated Flt3D1. The protein sample, which was concentrated to a volume of 2 ml, was injected onto the superdex 75 column (0 ml point, not depicted on the profile), with 150 mM NaCl, 10 mM HEPES, pH 7.0 as running buffer. The peak corresponding to deglycosylated Flt3D1 is indicated with an arrow.
Samples from fractions corresponding to the three peaks visible on the elution profile were
loaded on SDS-PAGE gel for evaluation of the gel filtration purification (figure 3.3). A band corresponding to deglycosylated Flt3D1 is visible, although not very clear, in the right lane. It runs at a molecular weight of around 15 kDa. This is in accordance with its theoretical
molecular weight of 16 kDa. The enzyme used for deglycosylation, EndoHf, is visible at around 70 kDa. All fractions corresponding to Flt3D1 were pooled and subsequently concentrated using a Vivaspin® centrifugal concentrator (Sartorius). The total yield of
recombinant Flt3D1 was around 250 µg (100 µg per liter medium).

20
Figuur 3.3: SDS-PAGE evaluation of the gel filtration purification of Flt3D1. The molecular weights of individual bands in the protein marker are given on the left. M: protein marker (Precision Plus Protein All Blue, Bio-rad). The colored boxes around the lanes correspond to the colors of the lines on the elution profile which is shown below the gel, indicating the origin of the samples that were loaded on the gel. The white arrow points to the band corresponding to deglycosylated Flt3D1. The asterisk marks the band corresponding to Endo Hf.
3.1.2 Crystallization screens of deglycosylated Flt3D1 The deglycoFlt3D1 (deglycosylated domain 1) protein sample was concentrated to 5 mg/ml and subsequently used for an initial crystallization trial, using the Crystal Screen 1 + 2 and the PEG/ION 1 + 2 screen. Two representative results of the trial are shown in figure 3.4.
Variable outcomes were observed in different drops, including clear drops, amorphous precipitate and phase separation. No crystals were observed within one month after setting up the trial.

21
3.2 Flt3 domain 5 (Flt3D5)
3.2.1 Small-scale expression of Flt3D5
To test the expression level of a Flt3D5 construct (cloned into the pcDNA4/TO/mu vector, created by dr. Kenneth Verstraete), a small-scale expression test was set up in 6-well plates. Protein expression was evaluated with western blot analysis. Figure 3.5 shows the result.
Besides Flt3D5, two different Flt3 ligand (FL) constructs were tested, one carrying its native secretion signal (nFL), the other having a mu-secretion signal (muFL). The p19 subunit of interleukin-23 was used as a positive control. IL23-p19 is known to be expressed to around 2
mg/l. It seems that Flt3D5 expressed fairly good, to a level comparable to the positive control.
Figure 3.5: Western blot evaluation of Flt3D5 expression in HEK293T cells. A molecular weight scale is given on the left, based on the protein marker (Precision Plus Protein dual color, Bio-rad) that was cut off from the blot. IL23-p19: p19 subunit of interleukin-23, used as positive control. nFL: Flt3 ligand with native secretion signal. muFL: Flt3 ligand with mu secretion signal. D5: Flt3D5
Crystal Screen 1 Condition 16: 0.1 M HEPES sodium pH 7.5, 1.5 M Lithium sulfate monohydrate
Crystal Screen 2 Condition 27: 0.01 M Zinc sulfate heptahydrate, 0.1 M MES monohydrate pH 6.5, 25% v/v Polyethylene glycol monomethyl ether 550
Figure 3.4: Representative results of deglycoFlt3D1 crystallization screens. The left panel shows a drop in which phase separation has occurred. The right panel shows a drop containing fine amorphous precipitate. The precise composition of the screening solutions is given below the pictures of the drops.

22
3.2.2 Pilot expression and purification of Flt3D5 Flt3D5 was transiently expressed by HEK293T cells and secreted in a total of 1250 ml
conditioned DMEM/F12 medium. The medium was loaded on a Talon Superflow column for IMAC purification, after which the eluted fraction was concentrated to a volume of 2 ml and injected onto a Superdex 75 column. The resulting gel filtration chromatogram is given in
figure 3.6.
Figure 3.6: Gel filtration elution profile of glycosylated Flt3D5. The protein sample, which was concentrated to a volume of 2 ml, was injected onto the superdex 75 column (0 ml point, not depicted on the profile), with 150 mM NaCl, 10 mM HEPES, pH 7.0 as running buffer. The peak corresponding to glycosylated Flt3D5 is indicated with an arrow.
Glycosylated Flt3D5 has an elution volume of approximately 68 ml. Fractions of 1.5 ml were collected starting from the void volume (40 ml) to the column volume (120 ml). Samples
from selected fractions were loaded on SDS-PAGE to evaluate the purification. Fractions corresponding to Flt3D5 were pooled and concentrated. The estimated total yield of the pilot expression experiment was around 500 µg (400 µg/l).
3.2.3 Deglycosylation test Deglycosylation of aliquots of the Flt3D5 sample was performed with both PNGaseF and
endoglycosidase H (EndoH). The efficiency of overnight deglycosylation was evaluated on a SDS-PAGE gel. Besides the two enzymatically treated aliquots and the negative control, two samples containing glycosylated Flt3D5 were loaded, of which one had no β-mercaptoethanol
(BME) added to its Laemmli buffer. Samples of Flt3D5 that were run in reducing conditions (with BME) always gave rise to lower bands on gel, running below the expected height of domain 5. Given the fact that this lower bands are absent in non-reducing conditions
(without BME), they are presumably caused by partial reoxidation of reduced cysteines,

23
which gives rise to D5 species with a different (faster) migration time in the gel. Finally, a sample coming from a fraction of the rather large void peak of the gel filtration (figure 3.6)
was loaded on the gel. Deglycosylated Flt3D5 runs at a height of around 12 kDa, in accordance with its theoretical molecular weight, while glycosylated Flt3D5 runs at around 20 kDa. Enzymatic deglycosylation seems therefore efficient, as the band at 20 kDa disappears
completely and is interchanged for the lower band at 12 kDa. Endoglycosidase H is the best choice for enzymatic deglycosylation, because the protein is still in its native conformation, in contrast to PNGaseF digestion which requires prior denaturation. Both enzymes used for
deglycosylation are visible on the gel in their corresponding lanes, PNGaseA running at approximately 30 kDa and EndoH running at around 25 kDa (both indicated with an asterisk).
Figure 3.7: Enzymatic deglycosylation of Flt3D5. The molecular weights of individual bands in the protein marker are given on the left. M: protein marker (Precision Plus Protein All Blue, Bio-rad). D5: Flt3D5. ON: overnight. RT: room temperature. –BME: without β-mercaptoethanol. GF: gel filtration. The position of the main Flt3D5 species is indicated with an arrow, pointing to glycosylated domain 5 in lane 2, lane 5 and lane 6, and to deglycosylated domain 5 in lane 3 and lane 4. The asterisks mark the bands corresponding to respectively PNGaseF (lane 3) and EndoH (lane 4).
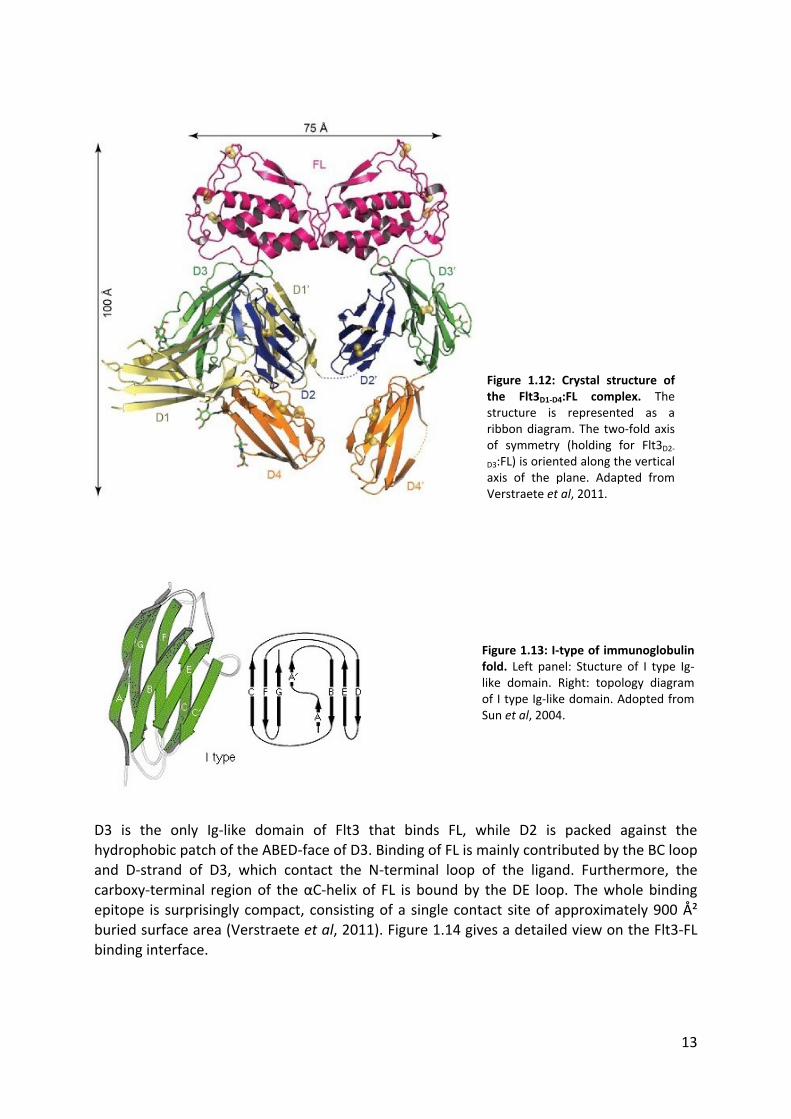
3.2.4 Crystallization screens of glycosylated Flt3D5
The glycoFlt3D5 (glycosylated Flt3D5) sample was concentrated to 5.7 mg/ml and used to set up some initial crystallization trials. Three 96-well plates were set up, using the Crystal
Screen 1 + 2 (Hampton Research), PEG/ION 1 + 2 (Hampton Research) and ProPlex 1 + 2
24
(Molecular Dimensions) screens. Representative results are given in figure 3.8. As a general observation, the large majority of the drops were clear, which indicates that glycoFlt3D5 is
very soluble. For future crystallization trials, the protein sample could either be further concentrated, or deglycosylated. N-glycans take up relatively much space in comparison to the rather small Ig-like domain. They are hydrophilic and require a large solvation shell,
which probably makes glycoFlt3D5 very soluble.
Crystal screen 1 Condition 2:o 0,4 M potassium sodium tartrate tetrahydrate
PEG/ION 1 Condition 27:
0,2 M sodium acetate trihydrate, 20% w/v PEG 3,350
PEG/ION 2 Condition 34: 2% v/v Tacsimate pH 7,0; 0,1 M HEPES pH 7,5; 20% w/v Polyethylene glycol 3,350
ProPlex 2 Condition 32: 0,8 M Na/K hydrogen phosphate, pH 7,5
Figure 3.8: Representative results of glycoFlt3D5 crystallization screens. The upper left panel and the lower right panel show clear drops. In the upper right panel, a drop is shown in which small non-crystalline objects can be observed. In the lower left panel, a drop containing wiry precipitation is shown. The precise composition of the screening solutions is given below the pictures of the drops.
3.2.5 Large-scale expression and purification of Flt3D5 Fourteen roller bottles were seeded with HEK293T cells, which transiently expressed and secreted Flt3D5 in a total of 3500 ml conditioned medium. The medium was loaded on a
Talon Superflow column for IMAC purification. A detail of the resulting chromatogram, showing the elution peak, is given in figure 3.9. To check whether the IMAC purification was successful, a SDS-PAGE gel was loaded with samples of the medium, the flow through, a
washing step with binding buffer, a washing step with 5 mM imidazole and the eluted fraction (containing 200 mM imidazole). This confirmed the presence of Flt3D5 in the eluted fraction.

25
The eluted fraction was subsequently desalted on a HiPrep™ 26/10 column and digested
overnight with EndoH. The deglycosylated sample was concentrated to a volume of 2 ml and injected onto a Superdex 75 column. The elution profile from this gel filtration purification step is given in figure 3.10, along with the elution profile of the previous gel filtration
purification of glycosylated Flt3D5 (described in section 3.2.2), which is represented as a dotted line. The main peak (indicated with an arrow on the figure) corresponds to deglycosylated Flt3D5 and runs at an elution volume of around 78 ml. Deglycosylation of
Flt3D5 thus leads to a shift of around 10 ml in elution volume, from 68 ml for glycoFlt3D5 to 78 ml for deglycoFlt3D5. However, the peak exhibits a shoulder on its left side (indicated with an asterisk) situated around an elution volume of 70 ml. Fractions of 1.5 ml were collected
starting from the void volume (40 ml) to the column volume (120 ml).
Samples from fractions corresponding to the peaks visible on the elution profile (including
the shoulder peak) were loaded on a non-reducing (without β-mercaptoethanol) SDS-PAGE gel for evaluation of the gel filtration purification (figure 3.11). In the lanes corresponding to fractions corresponding to the shoulder, higher running bands are visible between 20 kDa en
15 kDa, besides the band corresponding to deglycosylated domain 5 which runs around 12 kDa. Fractions coming from the right side of the peak consist purely of deglycosylated Flt3D5. This indicates that a part of the sample was resistant to overnight enzymatic deglycosylation.
Figure 3.9: Detail of the chromatogram resulting from the IMAC purification of Flt3D5, showing the elution peak. The medium was loaded on the Talon Superflow column and subsequently eluted with a 200 mM imidazole containing buffer.
-500
0
500
1000
1500
2000
2500
3030 3040 3050 3060 3070 3080 3090
Ab
sorb
ance
at
28
0n
m (
mA
U)
Elution volume (ml)

26
Figure 3.11: SDS-PAGE evaluation of the gel filtration purification of deglycosylated Flt3D5. The molecular weights of individual bands in the protein marker are given on the left. M: protein marker (Precision Plus Protein All Blue, Bio-rad). The colored boxes around the lanes correspond to the colors of the lines on the elution profile which is shown below the gel, indicating the origin of the samples that were loaded on the gel.
Figure 3.10: Gel filtration elution profile of deglycosylated Flt3D5. The protein sample, which was concentrated to a volume of 2 ml, was injected onto the superdex 75 column (0 ml point, not depicted on the profile), with 150 mM NaCl, 10 mM HEPES, pH 7.0 as running buffer. The elution profile of glycosylated Flt3D5 from the pilot expression experiment is shown as a dotted line. The main peak, corresponding to deglycoFlt3D5, is indicated with an arrow. The ‘shoulder’ peak on the left side of the main peak is indicated with an asterisk.
27
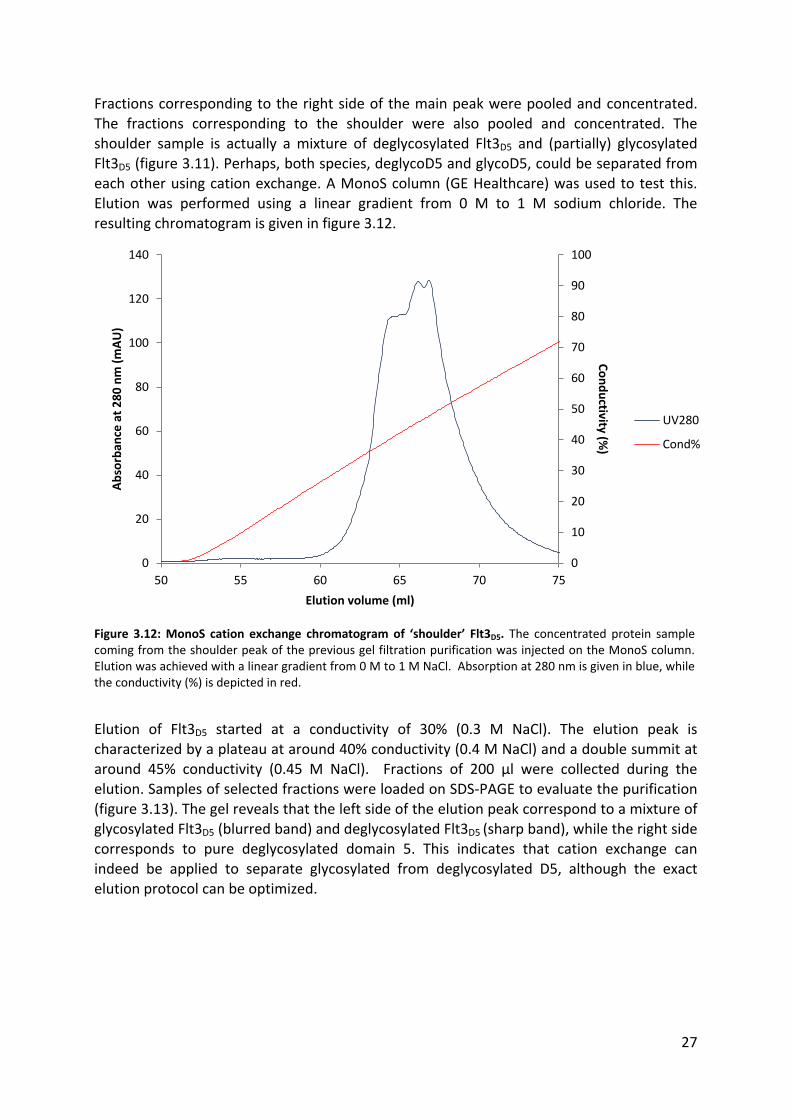
Fractions corresponding to the right side of the main peak were pooled and concentrated. The fractions corresponding to the shoulder were also pooled and concentrated. The
shoulder sample is actually a mixture of deglycosylated Flt3D5 and (partially) glycosylated Flt3D5 (figure 3.11). Perhaps, both species, deglycoD5 and glycoD5, could be separated from each other using cation exchange. A MonoS column (GE Healthcare) was used to test this.
Elution was performed using a linear gradient from 0 M to 1 M sodium chloride. The resulting chromatogram is given in figure 3.12.
Figure 3.12: MonoS cation exchange chromatogram of ‘shoulder’ Flt3D5. The concentrated protein sample coming from the shoulder peak of the previous gel filtration purification was injected on the MonoS column. Elution was achieved with a linear gradient from 0 M to 1 M NaCl. Absorption at 280 nm is given in blue, while the conductivity (%) is depicted in red.
Elution of Flt3D5 started at a conductivity of 30% (0.3 M NaCl). The elution peak is
characterized by a plateau at around 40% conductivity (0.4 M NaCl) and a double summit at around 45% conductivity (0.45 M NaCl). Fractions of 200 µl were collected during the elution. Samples of selected fractions were loaded on SDS-PAGE to evaluate the purification
(figure 3.13). The gel reveals that the left side of the elution peak correspond to a mixture of glycosylated Flt3D5 (blurred band) and deglycosylated Flt3D5 (sharp band), while the right side corresponds to pure deglycosylated domain 5. This indicates that cation exchange can
indeed be applied to separate glycosylated from deglycosylated D5, although the exact elution protocol can be optimized.
0
10
20
30
40
50
60
70
80
90
100
0
20
40
60
80
100
120
140
50 55 60 65 70 75
Co
nd
uctivity (%
)
Ab
sorb
ance
at
28
0 n
m (
mA
U)
Elution volume (ml)
UV280
Cond%

28
Figure 3.13: SDS-PAGE evaluation of MonoS cation exchange purification of ‘shoulder’ Flt3D5. The molecular weights of individual bands in the protein marker are given on the left. M: protein marker (Precision Plus Protein All Blue, Bio-rad). The colored boxes around the lanes correspond to the colors of the lines on the elution profile which is shown below the gel, indicating the origin of the samples that were loaded on the gel.
3.2.6 Crystallization screens of deglycosylated Flt3D5 Fractions originating from the right side of the main peak of the gel filtration purification (figure 3.10), corresponding to deglycosylated Flt3D5, were pooled and concentrated to 6 mg/ml. The total yield was around 900 µg (~260 µg/l). Two 96-well plates were set up for an
initial crystallization trial, using the Crystal Screen 1 + 2 and the PEG/ION 1 + 2 screening conditions. Two representative results are displayed in figure 3.14. No crystals were observed, but a variety of other outcomes were obtained, including phase separation and
small precipitates. The majority of drops was clear.
Accordingly, the remainder of the sample was further concentrated to 11 mg/ml. The
protein remained in solution, highlighting the fact that deglycosylated domain 5 is quite soluble and stable, even at high concentration. The concentrated sample was used for three more crystallization screens, the Crystallization Screen 1 + 2, the PEG/ION 1 + 2 screen and
the ProPlex (Molecular Dimensions) screen. No crystals were observed within a month after setting up the crystallization trial. Approximately one third of all drops exhibited precipitation, which points out that the concentration of the sample (11 mg/ml) is within the
range that should be optimal for crystallization.

29
Crystal Screen 1 Condition 4: 0,1 M TRIS hydrochloride pH 8,5; 2,0 M Ammonium sulfate
Crystal Screen 1 Condition 13: 0,2 M Sodium citrate tribasic dihydrate, 0,1 M TRIS hydrochloride pH 8,5; 30% v/v Polyethylene glycol 400
Figure 3.14: Representative results of deglycoFlt3D5 crystallization screens. The left panel shows a drop in which precipitation has occurred, while the right panel gives an example of phase separation. The precise composition of the screening solutions is given below the pictures of the drops.
3.3 Flt3 ectodomain constructs in complex with FL
3.3.1 Cloning of ectodomain constructs The ectodomain constructs Flt3D2-D3 (domain 2 and domain 3) and Flt3D2-D4 (domain 2, domain 3 and domain 4) were created via PCR cloning, with a subcloning step into pCR®2.1-TOPO®-vector. For every Flt3 ectodomain variant, two different constructs were created,
each with a different N-terminal starting point. All constructs contained a C-terminal His-tag. The ectodomain constructs were labeled as follows:
Construct A: Flt3D2-D3 N162-K347 Construct B: Flt3D2-D3 T167-K347 Construct C: Flt3D2-D4 N162-R436
Construct D: Flt3D2-D4 T167-R436
The final expression constructs cloned into the pcDNA™4/TO/mu vector were send to
Beckman Coulter Genomics for sequencing.
3.3.2 Small-scale expression test of Flt3D2-D3 and Flt3D2-D4 To test the expression level of the Flt3D2-D3 and Flt3D2-D4 ectodomain constructs in HEK293T cells, a small-scale expression test was set up in 6-well plates. Each construct (A, B, C and D)
was transfected alone or in combination with either nFL (FL with a native secretion signal) or muFL (Fl with a mu-secretion signal). The experiment was performed in duplicate. The expression level was evaluated with western blot analysis. Figure 3.15 shows the resulting
western blot for construct A (Flt3D2-D3 N162-K347). The experiment appears to have failed, because only the positive control (IL23-p19) is visible, while no signals are visible for the receptor construct or the ligand. A possible explanation is that only the right side of the SDS-
PAGE gel, containing the positive control (IL23-p19), was blotted on the nitrocellulose membrane.

30
Figure 3.15: Western blot evaluation of construct A expression in HEK293T cells. A molecular weight scale is given on the left, based on the protein marker (Precision Plus Protein dual color, Bio-rad) that was cut off from the blot. A+muFL: Construct A cotransfected with muFL. A+nFL: Construct A cotransfected with nFL. A: Only transfected with construct A. nFL: Only transfected with nFL. IL23-p19: p19 subunit of interleukin-23, used as positive control.
Figure 3.16 shows the western blot resulting from the small-scale expression test of
construct B (Flt3D2-D3 T167-K347). In the lanes corresponding to cotransfection of ligand and receptor construct, the ligand is clearly visible as 2 different bands, presumably corresponding to two different glycoforms. The receptor construct, which is expected to run
at around 25 kDa, is hardly visible in the lanes corresponding to the cotransfection experiments (B+muFL and B+nFL). The strong signal seen in lane 2 is most likely an aspecific stain. Nothing is visible in the lanes corresponding to transfection of construct B alone. nFL
was used as an extra positive control besides IL23-p19, and seems to be expressed to very high levels.
Figure 3.16: Western blot evaluation of construct B expression in HEK293T cells. A molecular weight scale is given on the left, based on the protein marker (Precision Plus Protein dual color, Bio-rad) that was cut off from the blot. B+muFL: Construct B cotransfected with muFL. B+nFL: Construct B cotransfected with nFL. B: Only transfected with construct B. nFL: Only transfected with nFL. IL23-p19: p19 subunit of interleukin-23, used as positive control.

31
Figure 3.17 shows the western blot resulting from the small-scale expression test of construct C (Flt3D2-D4 N162-R436). The receptor construct is clearly visible, running just above
40 kDa. The expected molecular weight of the construct in its deglycosylated form is around 33 kDa. The receptor is not only visible when cotransfected with the ligand, but interestingly also when transfected alone. However, cotransfection with ligand seems to result in slightly
higher expression of the receptor construct.
Figure 3.17: Western blot evaluation of construct C expression in HEK293T cells. A molecular weight scale is given on the left, based on the protein marker (Precision Plus Protein dual color, Bio-rad) that was cut off from the blot. IL23-p19: p19 subunit of interleukin-23, used as a positive control. muFL: only transfected with muFL. C: only transfected with construct C. C+nFL: Construct C cotransfected with nFL. C+muFL: Construct C cotransfected with muFL.
Figure 3.18 shows the western blot resulting from the small-scale expression test of construct D (Flt3D2-D4 T167-R436). The receptor construct is vaguely visible when transfected
alone, and more clearly visible when cotransfected with muFL, although in both cases, these observations cannot be made for the duplicate.
Figure 3.18: Western blot evaluation of construct D expression in HEK293T cells. A molecular weight scale is given on the left, based on the protein marker (Precision Plus Protein dual color, Bio-rad) that was cut off from the blot IL23-p19: p19 subunit of interleukin-23, used as a positive control. muFL: only transfected with muFL. D: only transfected with construct D. D+nFL: Construct D cotransfected with nFL. D+muFL: Construct D cotransfected with muFL.
Based on the result of the small-scale expression test, construct C seems to be the most promising ectodomain construct in terms of expression level. Construct C consists of domain 2, domain 3 and domain 4 of Flt3, and includes the sequence stretch between N162 and
T167, which is the linker between domain 1 and domain 2.

32
3.3.3 Small-scale coexpression test of Flt3D2-D4 and nFL Based on the result of the small-scale expression test of the different Flt3 ectodomain
constructs, construct C (Flt3D2-D4 N162-R436) was identified as the most promising construct in terms of expression level. Judging from the western blot analysis (figure 3.17), coexpression with ligand seems to be the strategy that yields the highest amount of
receptor. We chose to cotransfect the receptor construct with nFL (Flt3 ligand provided with its native secretion signal).
In order to determine the optimal cotransfection ratio, the ratio between receptor-encoding plasmid and ligand-encoding plasmid, a small-scale expression test was set up. HEK293T cells growing in six-well plates were transfected with different transfection mixes (2 µg/well),
ranging from 2 µg ligand-encoding plasmid and 0 µg receptor-encoding plasmid DNA to 0 µg ligand-encoding plasmid and 2 µg receptor-encoding plasmid. Table 3.1 shows the applied transfection mixes, along with the cotransfection ratio, while figure 3.19 gives the
accompanying western blot analysis resulting from the expression test.
Table 3.1: Transfection mixes applied to determine optimal cotransfection ratio.
lane on figure 3.19 1. 2 3. 4. 5. 6. 7. 8.
receptor-encoding plasmid
0 µg 1.0 µg 1.2 µg 1.4 µg 1.5 µg 1.6 µg 1.8 µg 2.0 µg
ligand-encoding plasmid
2.0 µg 1.0 µg 0.8 µg 0.6 µg 0.5 µg 0.4 µg 0.2 µg 0 µg
ratio 0:1 1:1 3:2 7:3 3:1 4:1 9:1 1:0
3.19: Western blot analysis of small-scale coexpression of Flt3D2-D4 and nFL in HEK293T cells. A molecular weight scale is given on the left, based on the protein marker (Precision Plus Protein dual color, Bio-rad) that was cut off from the blot. The numbers of the lanes, given above the blot, correspond to the transfection mixes enlisted in table 3.1.
The most intense signal for Flt3D2-D4, running at around 40 kDa, was observed in lane 6,
corresponding to a 4:1 ratio of receptor-encoding plasmid to ligand-encoding plasmid. In lane 8, corresponding to transfection with only receptor-encoding plasmid, no obvious signal could be observed, confirming that cotransfection with FL is the best strategy to obtain the
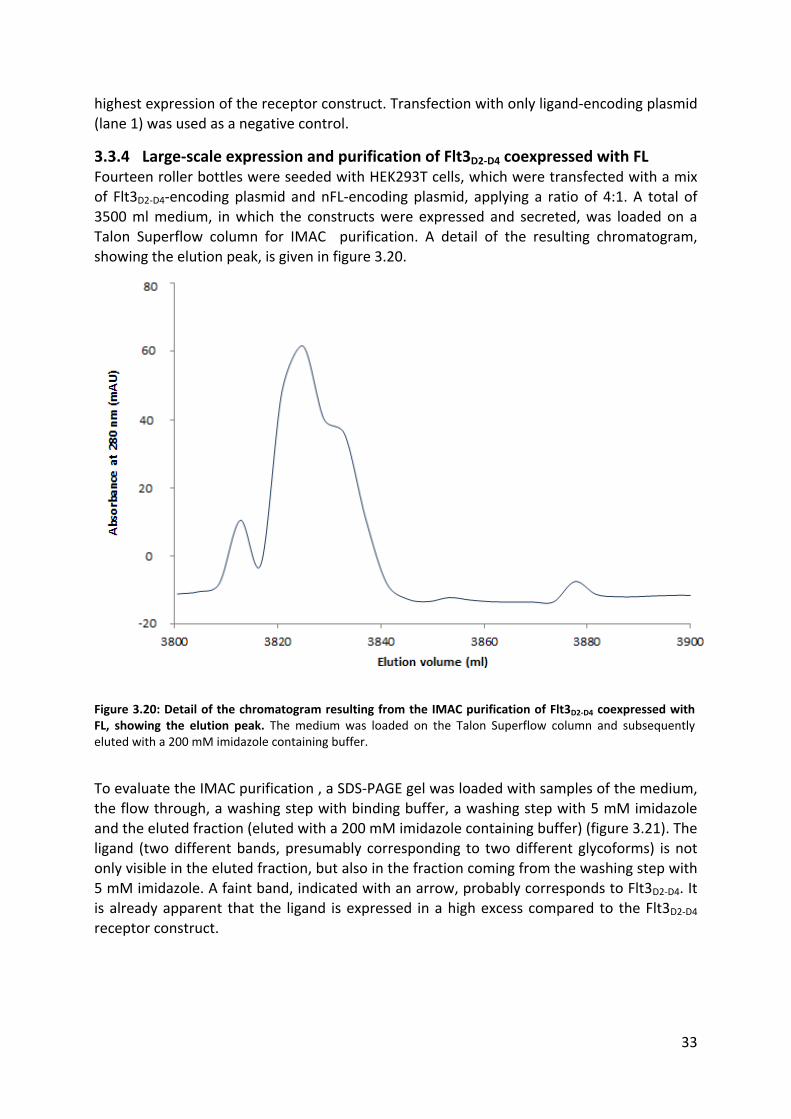
33
highest expression of the receptor construct. Transfection with only ligand-encoding plasmid (lane 1) was used as a negative control.
3.3.4 Large-scale expression and purification of Flt3D2-D4 coexpressed with FL Fourteen roller bottles were seeded with HEK293T cells, which were transfected with a mix of Flt3D2-D4-encoding plasmid and nFL-encoding plasmid, applying a ratio of 4:1. A total of 3500 ml medium, in which the constructs were expressed and secreted, was loaded on a
Talon Superflow column for IMAC purification. A detail of the resulting chromatogram, showing the elution peak, is given in figure 3.20.
Figure 3.20: Detail of the chromatogram resulting from the IMAC purification of Flt3D2-D4 coexpressed with FL, showing the elution peak. The medium was loaded on the Talon Superflow column and subsequently eluted with a 200 mM imidazole containing buffer.
To evaluate the IMAC purification , a SDS-PAGE gel was loaded with samples of the medium,
the flow through, a washing step with binding buffer, a washing step with 5 mM imidazole and the eluted fraction (eluted with a 200 mM imidazole containing buffer) (figure 3.21). The ligand (two different bands, presumably corresponding to two different glycoforms) is not
only visible in the eluted fraction, but also in the fraction coming from the washing step with 5 mM imidazole. A faint band, indicated with an arrow, probably corresponds to Flt3D2-D4. It is already apparent that the ligand is expressed in a high excess compared to the Flt3D2-D4
receptor construct.

34
Figure 3.21: SDS-PAGE evaluation of the IMAC purification of Flt3D2-D4 coexpressed with FL. The molecular weights of individual bands in the protein marker are given on the left. M: protein marker (Precision Plus Protein All Blue, Bio-rad). Medium: sample from medium prior to IMAC purification. FT: sample from flow through during loading of the medium. 0 mM imi.: sample from flow through obtained during washing step with binding buffer (300 mM NaCl, 50 mM NaH2PO4, pH 7.2) 5 mM imi.: sample from flow through obtained during washing step with buffer containing 5 mM imidazole. 200 mM imi.: Sample from fraction obtained by elution with buffer containing 200 mM imidazole. The blurred band which possibly correspond to Flt3D2-D4 is indicated with an arrow.
Following the IMAC purification, the eluted fraction was concentrated to a volume of 2 ml
and subjected to gel filtration. Figure 3.22 shows the resulting elution profile.

35
Figure 3.22: Gel filtration elution profile of Flt3D2-D4 coexpressed with FL. The protein sample, which was concentrated to a volume of 2 ml, was injected onto the superdex 200 column (0 ml point, not depicted on the profile), with 150 mM NaCl, 10 mM HEPES, pH 7.0 as running buffer.
The elution profile is characterized by the presence of two separate peaks. One large peak at an elution volume of around 87 ml, and a considerably smaller peak at an elution volume of
approximately 68 ml. Fractions of 1.5 ml were collected starting from the void volume (40 ml) to the column volume (120 ml).
Samples from fractions corresponding to the peaks visible on the elution profile were loaded on a SDS-PAGE gel, in order to identify the protein constructs corresponding to the peaks visible on the chromatogram (figure 3.23). In the fractions coming from the large peak, only
Flt3 ligand (two different bands) is visible, with a more intense signal in the fractions coming from the top of the peak. In the fractions coming from the small peak running at lower elution volume, both ligand and receptor are visible. Bands corresponding to the Flt3D2-D4
construct are a bit diffuse and run in between 50 and 40 kDa (indicated with a black arrow). The signals of respectively the receptor and the ligand have a comparable intensity, suggesting that both are present in equal amounts in a presumably ternary complex. This
suggests that the small peak visible on the elution profile is presumably the complex formed by Flt3D2-D4 bound to FL.
0
20
40
60
80
100
120
140
160
60 65 70 75 80 85 90 95
Ab
sorb
ance
at
28
0 n
m (
mA
U)
Elution volume (ml)

36
Figuur 3.23: SDS-PAGE evaluation of the gel filtration purification of Flt3D2-D4 coexpressed with FL. The molecular weights of individual bands in the protein marker are given on the left. M: protein marker (Precision Plus Protein All Blue, Bio-rad). The colored boxes around the lanes correspond to the colors of the lines on the elution profile which is shown below the gel, indicating the origin of the samples that were loaded on the gel. The black arrow points to the height at which Flt3D2-D4 is visible.
3.3.5 Crystallization screens of Flt3D2-D4:FL complex The fractions corresponding to the Flt3D2-D4:FL complex were pooled and concentrated to 4 mg/ml. The total yield of the complex was around 100 µg (~30 µg/l). The sample was used to
set up one 96-well plate for an initial crystallization trial, using the PEG/ION 1 screen in the upper half of the plate and the ProPlex 1 screen in the lower half of the plate. As illustrated with figure 3.24, which shows representative results of the crystallization trial, most drops
exhibited immediate precipitation, although in some drops, phase separation appeared after a while. The fact that the protein precipitates in the majority of conditions probably indicates that the concentration of the sample is too high, although the sample itself could
be concentrated to 4 mg/ml without any problems. An additional screen was set up, using the reservoir solutions of the PEG/ION 1 screen 3/5 diluted with deionized water. Precipitation was still observed in the majority of drops, although to a lesser extent (less

37
severe and less immediate) than in the non-diluted screen. No crystals were observed within one month after setting up the crystallization trials.
PEG/ION 1 Condition 9:
0,2 M Ammonium chloride, 20% w/v Polyethylene glycol 3,350
PEG/ION 1 Condition 48:
0,2 M Ammonium citrate dibasic, 20% w/v Polyethylene glycol 3,350
ProPlex 1 Condition 28: 0,2 M lithium sulfate, 0,1 M MES, pH 6,0; 20% w/v PEG 4000
ProPlex 1 Condition 31: 0,1 M sodium nitrate, pH 5,6; 20% w/v PEG 4000, 20% v/v 2-propanol
Figure 3.24: Representative results of Flt3D2-D4:FL crystallization screens. Most drops exhibited immediate precipitation, such as seen in the upper left panel, the upper right panel and the lower right panel. In some drops, such as the one shown in the lower left panel, phase separation could be observed. The precise composition of the screening solutions is given below the pictures of the drops.

38
Part 4: Summary and Discussion
4.1 Some general considerations Significant and important steps towards reaching the goals of this thesis have been made.
Every Flt3 ectodomain construct that was considered as a target for crystallization from beforehand finally made it to crystallization trials. This required considerably more effort for some constructs compared to others, as for example Flt3D2-D4 had to be cloned first, while
Flt3D5 and Flt3D1 expression constructs were readily available. Arguably the main bottleneck in the process of structure determination via X-ray crystallography is the production of high-quality crystals that diffract to a high resolution. Protein crystallization is to a large extent
based on screening as much different conditions as possible, by sampling different combinations of parameters such as precipitant types, buffer composition and pH. The goal is to find conditions that are favorable for nucleation and crystal growth. Although quite
some trials were set up for all the crystallographic targets of this master thesis, no crystals were obtained within the time frame of this thesis. Subsequent steps to increase the chance on crystallization can be undertaken in the near future, as well as assessing the purity and
monodispersity of the protein samples.
4.2 Flt3 domain 1 (Flt3D1)
4.2.1 Expression, purification and deglycosylation of Flt3D1
Domain 1 of Flt3 was expressed by a stable HEK293S GnT-/- cell line that has stably integrated a Flt3D1 construct cloned in the pcDNA4/TO/mu vector. The cell line, which was previously made in our group and stored at -80°C, had to be thawed first, and subsequently seeded in a
falcon containing fresh DMEM/F12 medium. After splitting the cells to fifty 175 cm²-falcons, the cells were allowed to grow to a cell density of around 90% confluency, after which expression of Flt3D1 was induced with tetracycline and sodium butyrate. The protein
construct was secreted in a total of 2500 ml medium.
The Flt3D1 construct, which is provided with a C-terminal his-tag, was successfully purified
from the medium using immobilized metal affinity chromatography (IMAC) on a Talon® Superflow column (Clontech Laboratories, Inc.). The protein sample was deglycosylated with endoglycosidase H and subsequently subjected to a second purification step using gel
filtration on a HiLoad Superdex™ 75 column (GE Healthcare). Flt3D1 was visible on a SDS-PAGE gel as a band running at a height of around 15 kDa, although the band itself was not clearly distinguishable from a vague smear above it. Perhaps, an extra ion exchange
chromatography step is recommended as a final polishing step, in order to purify the sample to a level which possibly allows crystallization.
The yield of Flt3D1 was estimated to be around 100 µg per liter medium. Although this is a rather poor yield, it still allows to set up some crystallization screens. The Mosquito® Crystal robot (TPP LabTech) allows to set up high throughput crystallization screens without
consuming too much of the protein sample.

39
4.2.2 Crystallization screens of deglycosylated Flt3D1
A total of two 96-well plates was set up, using the commercially available Crystal Screen 1 +
2 and PEG/ION screen 1 + 2 (Hampton Research), starting from a protein concentration of 5 mg/ml. Variable outcomes were observed in different drops, including clear drops, amorphous precipitate and phase separation. No crystals were observed within the time
frame of this master thesis. In addition, no conditions were observed that could be considered as a starting point for optimization screening, such as microcrystalline showers or clusters.
4.2.3 Future prospects regarding Flt3D1 In the prospect of new crystallization trials, it could be recommended to test whether the protein sample containing Flt3D1 is monodisperse. The monodispersity or homogeneity of a protein sample is often indicative for the crystallization behavior of that sample. In that
respect, dynamic light scattering (DLS), is a very convenient diagnostic tool. This technique allows to determine the size distribution, the stability and the aggregation state of macromolecules in solution, in addition to the influence of the buffer on this parameters
(Borgstahl, 2007). This is very useful information in the context of crystallization screening, as purity and stability are a prerequisite for crystallization. It could for example be that the buffer of the sample, the running buffer used for gel filtration (150 mM NaCl, 10 mM HEPES,
pH 7.0), has a negative effect on the crystallizability of the protein.
If the monodispersity and stability of the FltD1 sample is established, different steps could be
undertaken to increase the chance on crystallization. One could for example attempt to do perform reductive methylation of lysine residues present on the surface of the protein, which has been shown to higher the chance on crystallization in a certain number of cases
(Walter et al, 2006). Another often applied approach is limited proteolysis, which allows remove the more flexible parts in the protein that possibly hinder the formation of crystal contacts. The C-terminal polyhistidine-tag (His6-tag) could be removed with
carboxypeptidase A. Nucleation, the emergence of nuclei that serve as anchor points for crystal growth, can be induced with seeding experiments. Different things can be used for seeding, including fibers, hairs and even crystals of unrelated proteins (D’Arcy et al, 2003). In
that respect, anisotropically diffracting crystals of glycosylated Flt3D1 (previously obtained by dr. Kenneth Verstraete), could be used as a seed for the crystallization of deglycosylated Flt3D1.
4.3 Flt3 domain 5 (Flt3D5)
4.3.1 Expression, purification and deglycosylation of Flt3D5 Domain 5 of Flt3 was transiently expressed by HEK293T cells. A small-scale expression
already indicated a high expression level of the Flt3D5 construct cloned in the pcDNA4/TO/mu vector. A pilot expression of the domain, in a total of 1250 ml, followed by IMAC and gel filtration purification, resulted in a yield of around 400 µg/l glycosylated Flt3D5.
A test was performed to examine the feasibility of enzymatic deglycosylation with EndoH. The remainder of the material purified from the pilot expression was used for some initial crystallization trials.

40
The expression was subsequently scaled up to fourteen roller bottles, resulting in a total of 3500 ml conditioned medium. After IMAC purification, the Flt3D5 sample was desalted on a
HiPrep™ 26/10 column (Amersham biosciences) and deglycosylated with Endo Hf, after which gel filtration was performed. The elution profile of this gel filtration step indicated that a fraction of the sample was resistant to overnight deglycosylation. An attempt to
separate glycosylated Flt3D5 from deglycosylated Flt3D5 using high-resolution cation exchange on a MonoS column (GE Healthcare) appeared to be successful, although the exact elution protocol needs to be optimized, for example by applying a stepwise gradient. The
yield of deglycosylated Flt3D5 was around 260 µg/l.
4.3.2 Crystallization screens of glycosylated and deglycosylated Flt3D5
The glycosylated Flt3D5 sample resulting from the pilot expression was concentrated to 5.7 mg/ml and used to set up three initial crystallization trials, using the Crystal Screen 1 + 2
(Hampton Research), PEG/ION 1 + 2 (Hampton Research) and ProPlex 1 + 2 (Molecular Dimensions) screens. The large majority of the resulting drops were clear, indicating that the concentration of the protein sample was not high enough to permit crystallization or
precipitation. This indicates that glycosylated Flt3D5 is highly soluble.
The deglycosylated Flt3D5 sample was used for several crystallization trials, starting from a
protein concentration of respectively 6 mg/ml (Crystal Screen 1 + 2, PEG/ION 1 + 2) and 11 mg/ml (Crystal Screen 1 + 2, PEG/ION 1 + 2, ProPlex 1 + 2). No crystals were observed within the time frame of this master thesis. Approximately one third of all drops exhibited
precipitation, which points out that the concentration of the sample (11 mg/ml) is within the range that should be optimal for crystallization.
4.3.3 Future prospects regarding Flt3D5
In accordance to what is proposed for Flt3D1, the monodispersity and stability of the Flt3D5
sample could be assessed with DLS. In addition, some techniques could be applied to increase the chance on crystallization, such as limited proteolysis, carboxypeptidase A digestion and lysine methylation.
4.4 Flt3 ectodomain constructs in complex with FL
4.4.1 Cloning, expression and purification of Flt3D2-D4
Four Flt3 ectodomain constructs were successfully cloned into the pcDNA™4/TO/mu vector. Expression of this constructs was tested in HEK293T cells. Each construct (A, B, C and D) was
transfected alone or in combination with either nFL (FL with a native secretion signal) or muFL (Fl with a mu-secretion signal). The Flt3D2-D3 constructs were barely expressed, in contrast to one other construct, Flt3D2-D4 N162-R436 showed promising expression,
especially when coexpressed with Flt3 ligand. Consequently, this construct was used for large-scale coexpression with FL in HEK293T cells, using an optimized transfection ratio of receptor-encoding DNA and ligand-encoding DNA. The recombinant proteins (receptor
construct and ligand) were subsequently purified from 3500 ml medium by IMAC purification followed by gel filtration on a HiLoad Superdex™ 200 column (GE Healthcare). The elution profile of the gel filtration was characterized by the presence of two peaks; a large peak at
an elution volume of around 87 ml and a considerably smaller peak at an elution volume of approximately 68 ml. SDS-PAGE analysis revealed that the big peak corresponds to the

41
ligand, which is present in excess, while the small peak corresponds to a complex formed by Flt3D2-D4 and FL, although the presence of Flt3D2-D4 needs to be confirmed by for example
peptide mass fingerprinting. The presence of the complex indicates that Flt3D2-D4 is stable and able to form a complex with FL, in the absence of domain 1. The stoichiometry of the complex needs to be determined with for example native PAGE. The yield of the Flt3D2-D4:FL
complex, 30 µg/l, was very limiting.
Flt3 ligand (FL) was present in large excess to the complex, indicating that HEK293T cells can
be used for large-scale transient expression of FL. FL produced in HEK293T cells has the advantage that it is properly glycosylated, which is not the case for FL produced in E. coli.
4.4.2 Crystallization screens of glycosylated Flt3D2-D4 in complex with FL The sample containing the Flt3D2-D4 complex was concentrated to 4 mg/ml and used for a
crystallization screen, using the PEG/ION 1 and ProPlex 1 screens. Most drops displayed immediate precipitation, indicating that the concentration of the sample was too high, although the complex could be concentrated to 4 mg/ml without the visible occurrence of
aggregation or precipitation in the sample itself. An additional screen was set up, using the reservoir solutions of the PEG/ION 1 screen 3/5 diluted with deionized water. Precipitation was still observed in the majority of drops, although to a lesser extent.
4.4.3 Future prospects regarding Flt3D2-D4 The result of gel filtration showed that Flt3D2-D4 is able to form a complex with FL, in the absence of domain 1. This indicates that this construct is a valuable tool in the prospect of obtaining a high-resolution view of the interaction between receptor and ligand. However,
the yield of the complex obtained after transient coexpression with FL in HEK293T cells is very limiting. Therefore, it would be worthwhile to invest in a stable HEK293S GnT-/- cell line that has been stably transfected with the Flt3D2-D4 construct. This cell line could still be used
for coexpression with FL, by transfecting the cells with a ligand-encoding construct, or could be used to express Flt3D2-D4 on its own. If Flt3D2-D4 could be expressed to a reasonable amount on its own, it could be used for binding studies. An ITC experiment in which Flt3D2-D4
is titrated with FL would allow to measure the effect of omitting domain 1 on the stability of the complex and the affinity of the receptor-ligand interaction.
In the prospect of crystallization, deglycosylation of the complex could be attempted, as well as limited proteolysis and caboxypeptidase A digestion. The stability of the complex in solution could be tested with dynamic light scattering, which furthermore allows to assess
the monodispersity of the sample.

42
Part 5: Nederlandstalige samenvatting
Hematopoëse, de vorming van nieuwe bloedcellen, is een sterk gereguleerd proces dat
onder controle staat van cytokines. Deze signaalmoleculen veroorzaken, na binding met hun receptor, een karakteristieke cellulaire respons zoals proliferatie, overleving, differentiatie of maturatie van de doelwitcel. Tot de belangrijkste hematopoëtische cytokines behoren stam
cel factor (SCF), kolonie-stimulerende factor-1 (CSF-1), interleukine-34 (IL-34) en Flt3 ligand (FL). Deze hematopoëtische cytokines zijn de cognate liganden voor type III receptor tyrosine kinasen (RTK III). RTK III leden hebben een kenmerkende modulaire opbouw, waarbij het
extracellulaire gedeelte, bestaande uit vijf immunoglobuline-achtige domeinen, instaat voor ligandbinding en het intracellulaire gedeelte een intrinsieke tyrosine kinase activiteit vertoont dat van belang is voor signaaltransductie. Bij RTK III leden interageert het bivalente
cytokine met twee receptormoleculen, wat leidt tot dimerisatie van de receptor en transactivering van het cytoplasmatische tyrosine kinase domein.
FMS-gerelateerd tyrosine kinase 3 (Flt3) is een receptor tyrosine kinase die geactiveerd
wordt op hematopoëtische stamcellen en vroege lymfoïde en myeloïde progenitorcellen. Naast haar functie in de proliferatie en vroege differentiatie van hematopoëtische progenitorcellen is Flt3 van cruciaal belang in de ontwikkeling van dendritische cellen.
Mutaties in het Flt3 gen behoren tot de meest voorkomende genetische aberraties in acute myeloïde leukemie (AML). Deze mutaties veroorzaken constitutieve activering van de receptor. De Flt3 receptor is een belangrijk doelwit voor specifieke geneesmiddelen tegen
AML. FL (Flt3 ligand) is, net als CSF-1 en SCF, een homodimeer cytokine bestaande uit twee korte keten α-helicale bundel subeenheden. De structuur van het humane FLT3-ectodomein in complex met FL werd bepaald door dr. Kenneth Verstraete in het kader van zijn
doctoraatsstudie. Deze structuur bracht een aantal opvallende eigenschappen aan het licht die Flt3 duidelijk onderscheiden van andere leden van de RTK III familie. Zo is het bindingsoppervlak tussen het ligand en de receptor opvallend compact en is enkel domain 3
van Flt3 betrokken in de interactie. In scherp contrast met homologe receptoren zoals KIT (de receptor voor SCF) en CSF-1R (de receptor voor CSF-1 en IL-34) vertoont Flt3 geen homotypische interacties gemedieerd door domein 4, en lijkt domein 1 geen contact te
maken met de rest van het complex.
Flt3D1-D4:FL, de eerste vier domeinen van Flt3 in complex met FL, werd in eerdere studies
bepaald bij een resolutie van 4.3 Å. Hoewel deze resolutie volstaat om een vrij goed algemeen beeld van het complex te verkrijgen, is een hogere resolutie noodzakelijk om een
gedetailleerder zicht te krijgen op de bindingsepitoop en de daarin betrokken residuen, hetgeen bruikbare informatie is in het vooruitzicht van de ontwikkeling van specifieke geneesmiddelen die de interactie tussen Flt3 en FL inhiberen. Omwille van het feit dat
domein 1 (D1) een hoge mate van flexibiliteit vertoont vermindert het wellicht de diffractiekwaliteit van de kristallen. Om een gedetailleerd zicht op de interactie tussen FL en Flt3 te verkrijgen bij hoge resolutie kan het interessant zijn om te investeren in Flt3
ectodomeinconstructen zonder D1. Daarom werden er in het kader van deze thesis nieuwe Flt3 ectodomeinconstructen gekloneerd: Flt3D2-D3 (domein 2 en domein 3) en Flt3D2-D4
(domein 2, domein 3 en domein 4).
43
De Flt3 ectodomeinconstructen werden succesvol gekloneerd in de pcDNA4/TO/mu vector. Het expressiepotentieel van deze constructen werd getest in HEK293T cellen. Eén construct,
Flt3D2-D4 N162-R436, vertoonde een veelbelovende expressie, in het bijzonder wanneer dit construct gecoëxpresseerd werd met het Flt3 ligand (FL). Dit construct werd gebruikt voor grootschalige coëxpressie met FL in HEK293T cellen. Omwille van hun N-terminale
secretiesignaal werden de recombinante eiwitten gesecreteerd in het medium van de HEK293T cellen. De eiwitten werden vervolgens gezuiverd uit een totaal van 3500 ml geconditioneerd medium doormiddel van geïmmobiliseerd metaalaffiniteitschromatografie
(IMAC) gevolgd door gelfiltratie op een superdex 200 kolom. Het elutieprofiel van de gelfiltratie bevatte twee pieken. De grootste piek was waarneembaar bij een elutievolume van 87 ml en kwam overeen met het Flt3 ligand, terwijl een andere, merkbaar kleinere piek
bij een elutievolume van 68 ml overeenkwam met een complex gevormd door Flt3D2-D4 en FL. Dit is een indicatie dat Flt3D2-D4, in afwezigheid van D1, stabiel is en in staat is om FL te binden. De totale opbrengst van het complex na expressie en zuivering, 30 µg/l, is echter
bijzonder laag. Het complex werd geconcentreerd tot 4 mg/ml en vervolgens gebruikt voor kristallisatietesten, gebruikmakend van de commercieel beschikbare PEG/ION 1 en ProPlex screens. Het eiwitcomplex precipiteerde in de meerderheid van de geteste condities, wat er
op wijst dat de concentratie van het complex in het eiwitstaal te hoog was om kristalvorming toe te laten.
Een eerdere structurele karakterisatie van het volledige ectodomein in complex met het ligand, Flt3D1-D5:FL, laat toe om de algemene architectuur van het complex te bestuderen. Deze studies lijken er op te wijzen dat domein 5, net als domein 4, geen homotypische
interacties aangaat. Domein 5 (Flt3D5) op zich is een interessant doelwit voor kristallografische studies. Zijn positie tegen het membraan maakt het een interessant target voor biotechnologische geneesmiddelen zoals monoklonale antilichamen. Een structuur van
domein 5 bepaald bij hoge resolutie kan inzichten bieden in de functie van het domein en laat toe om het structurele effect van de oncogene Ser451Phe mutatie na te gaan.
Domein 5 van Flt3, gekloneerd in de pcDNA4/TO/mu vector, werd transiënt geëxpresseerd in HEK293T cellen. Een pilootexpressie resulterend in een totaal van 1250 ml geconditioneerd medium leverde genoeg materiaal op voor een eerste kristallisatietest.
Vervolgens werd de expressie opgeschaald naar 3500 ml geconditioneerd medium. Na een IMAC zuivering werd het staal ontzout en gedeglycosyleerd met endoglycosidase Hf, waarna gelfiltratie werd uitgevoerd. Uit het elutieprofiel blijkt dat een deel van het eiwitstaal
resistent was tegen overnacht enzymatische deglycosylatie. Een poging om geglycosyleerd Flt3D5 te scheiden van gedeglycosyleerd Flt3D5 doormiddel van kationuitwisselingschromatografie was succesvol. De totale opbrengst van gedeglycosyleerd
Flt3D5 werd geschat op 260 µg/l.
Kristallisatietesten met geglycosyleerd Flt3D5 geconcentreerd tot 5.7 mg/ml wijzen erop dat
het domein zeer oplosbaar is, aangezien de meeste resulterende druppels helder waren. Kristallisatietesten met gedeglycoysleerd Flt3D5 bij een concentratie van 11 mg/ml gaven aanleiding tot precipitatie in ongeveer 30% van de geteste condities, wat er op wijst dat de
concentratie van het eiwitstaal min of meer optimaal was voor kristallisatie. Geen van de geteste condities, zowel voor geglycosyleerd Flt3D5 als voor gedeglycosyleerd Flt3D5, leverde echter kristallen op.

44
Een derde kristallografisch doelwit van deze thesis is Flt3D1 (domein 1). D1 van Flt3 is ongebruikelijk groot in vergelijking tot andere immunoglobuline-achtige domeinen en bevat
een lang N-terminaal segment dat volledig afwezig is in homologe receptoren. Een kristalstructuur bepaalt bij hoge resolutie kan inzichten bieden in de functie van het domein, hetgeen tot op heden onopgehelderd is.
Flt3D1 werd geëxpresseerd door een stabiele HEK293S GnT-/- cellijn die stabiel getransfecteerd is met een Flt3D1 construct. Het eiwitconstruct werd gesecreteerd in 2500
ml geconditioneerd medium en vervolgens gezuiverd door middel van geïmmobiliseerd metaalaffiniteitschromatografie, waarna het werd gedeglycosyleerd met endoglycosidase Hf en onderworpen aan gelfiltratie. De opbrengst was ongeveer 100 µg per liter medium,
hetgeen voldoende was voor het opzetten van een aantal kristallisatietesten. Geen van deze testen leverde echter kristallen op. Bovendien werden geen condities geïdentificeerd die kunnen beschouwd worden als een goed startpunt voor optimalisatie.
Hoewel een behoorlijk aantal kristallisatietesten werd opgezet gedurende deze masterproef, werd geen enkel bruikbaar eiwitkristal bekomen binnen het beperkte tijdskader van deze
thesis. In de nabije toekomst kunnen stappen worden ondernomen om de kans op kristallisatie van de eiwitconstructen te verhogen. Ook is het aangewezen om de monodispersiteit van de eiwitstalen, een belangrijke voorwaarde waaraan een
eiwitoplossing moet voldoen om te kunnen uitkristalliseren, te evalueren.

45
Part 6: Material and Methods
6.1 Cloning of Flt3 ectodomain constructs The ectodomain constructs Flt3D2-D3 (domain 2 and domain 3) and Flt3D2-D4 (domain 2,
domain 3 and domain 4) were created via PCR cloning. The sequence stretch between N162 and T167 functions as a flexible linker between domain 1 and domain 2. For every Flt3 ectodomain variant, two different constructs were created, each with a different N-terminal
starting point. The boundary between domain 1 and domain 2 may, on the basis of sequence alignment with homologous receptors, either be position N162 or position T167. The end of the shorter constructs (Flt3D2-D3) is K347, while the end of the longer constructs (Flt3D2-D4) is
R436. The four constructs were labeled as follows:
Construct A: Flt3D2-D3 N162-K347
Construct B: Flt3D2-D3 T167-K347 Construct C: Flt3D2-D4 N162-R436 Construct D: Flt3D2-D4 T167-R436
cDNA of the full length ectodomain of Flt3 was used as a template for the PCR reaction. The 5’ end of the forward primers contained an AgeI restriction site, while the 5’ end of the
reverse primers contained a KpnI restriction site, to enable cloning in the multiple cloning site (MCS) of the expression vector. The Easy-A polymerase (Agilent) that was used for amplification creates 3’ overhanging A’s, which results in amplicons suitable for subcloning
in TOPO-vectors. The PCR products were loaded on agarose gel and subsequently extracted using the innuPREP DOUBLEpure Kit (MiniElute™ protocol, Analytic Jena). Next, the extracted fragments were ligated into the pCR®2.1-TOPO®-vector (Invitrogen). The vectors
were subsequently transformed in electrocompetent TOP10 cells via electroporation, followed by plating on selective LB-agar plates (containing carbenicillin, the vector contains a carbenicillin resistance gene). Following alkaline extraction of DNA according to Birnboim
and Doly (Birnboim and Doly, 1979), single colonies were screened for the presence of the insert. Positive clones were subsequently selected for inoculation of selective liquid LB medium. The resulting cultures were harvested and the plasmids were purified using the
QIAGEN® Plasmid Midi kit (Invitrogen).
Next, the pCR®2.1-TOPO®-vector was digested with KpnI and AgeI, and loaded on a
preparative gel. The insert was then extracted and ligated into the expression vector, pcDNA™4/TO/mu. This vector is an in house version of the pcDNA™4/TO (Invitrogen), which allows tetracycline-regulated expression in mammalian cells that express the tetracycline
repressor. In addition, a zeocine selection marker allows for selection of transfectants that have integrated the plasmid into their genome. The pcDNA™4/TO/mu vector contains the same MCS as the pHLsec vector (Aricescu et al, 2006). The insert can be cloned between a N-
terminal mu-secretion signal and a C-terminal His6-tag. Figure 5.1 shows the pcDNA™4/TO/mu vector, while figure 5.2 gives a detailed view of the MCS. The purified expression vectors (after selection of positive clones and subsequent QIAGEN purification)
were sent to Beckman Coulter Genomics for sequencing.

46
6.2 Small-scale expression test of Flt3 ectodomain constructs in HEK293T cells In order to assess the expression potential of the Flt3 ectodomain constructs, a small-scale expression test was set up. Therefore, five 6-well plates were seeded with HEK293T cells
growing in DMEM/F12 containing antibiotics (penicillin and streptomycin) and FCS (foetal calf serum). When the cells were more than 90% confluent, they were transfected with a DNA-polyethyleneimine (PEI, 25kDa, branched) mixture (Demeneix and Behr, 2005). The
medium of the cells was replaced with serum-free medium containing 5 µM kifunensine. Every well was transfected with a mixture of 2 µg DNA and 3 µg PEI. The optimal DNA:PEI
Figure 5.1: pcDNA™4/TO/mu vector.
Figure 5.2: MCS of the pcDNA™4/TO/mu vector. The insert is cloned between a N-terminal mu-secretion signal (blue) and a C-terminal His6-tag (orange). The AgeI restriction site (ACCGGT) is colored in pink, the KpnI site (GGTACC) in purple.

47
ratio is between 1:1.5 and 1:2, but given the fact that PEI is toxic to the cells, a 1:1.5 ratio is preferred (Aricescu et al, 2006). Each construct (A, B, C and D) was transfected alone or in
combination with either nFL (FL with a native secretion signal) or muFL (Fl with a mu-secretion signal). In addition, the expression potential of a Flt3D5 construct (previously cloned by dr. Kenneth Verstraete) was tested. The experiment was performed in duplicate.
Three days post-transfection, the medium was transferred to 2 ml eppendorfs and centrifuged for fifteen minutes at maximum speed (20 000 x g). Then, 30 µl of the supernatant was mixed with Laemmli buffer (Laemmli, 1970), containing 5% β-
mercaptoethanol. The samples were subsequently heated for five minutes at 95°C, after which they were loaded on a SDS-PAGE gel. The proteins were blotted overnight on a nitrocellulose membrane using a voltage of 40V. The membrane was blocked in 5% non-fat
dry milk-PBS buffer and incubated with antibody (anti-HIS C-terminal HRP-antibody, Invitrogen). A 1:1 mixture of peroxidase substrate and enhancer solution (SuperSignal® West Femto, Thermo Scientific) was pipetted on the membrane, after which the signal was
detected and visualized on a photographic film. To optimize coexpression of receptor construct C (Flt3D2-D4) with nFL, a small expression test was performed using different cotransfection ratios, ranging from 1:1 to 9:1 receptor DNA:ligand DNA. The experiment was
carried out in a similar manner as described above.
6.3 Large scale expression of Flt3 ectodomain constructs in mammalian cells
6.3.1 Pilot expression of Flt3D5 in HEK293T cells Based on the promising results of the small-scale expression test, a pilot expression of Flt3 Flt3D5 was set up. We chose for HEK293T cells as a platform for transient protein expression (Aricescu et al, 2006). Twenty-five 175 cm²-falcons were seeded with HEK293T cells growing
in DMEM/F12 containing 10% FCS and antibiotics (106 units/l penicillin and 1 g/l streptomycin). When the cells were more than 90% confluent, the medium was replaced with fresh serum-free medium containing 5 µM kifunensine, after which the cells were
transfected with 50 µg DNA and 75 µg PEI per falcon. Kifunensine is a powerful inhibitor of the enzyme α-mannosidase I. Inhibition of α-mannosidase I, which catalyzes an early step in the N-glycan processing that takes place in the Golgi apparatus, results in relatively
homogeneous N-glycans that are sensitive to endoglycosidase H (Endo H) digest (Chang et al, 2007). The heterogeneity of fully processed glycoproteins and the high flexibility of N-glycans are known to be possible impeding factors for protein crystallization. Endo H
digestion leaves one N-acetylglucosamine (GlcNAc) residue attached to the asparagine residue in the glycosylation site. This first GlcNAc residue often makes contacts with hydrophobic residues in proximity of the glycosylation site, and is thereby important for
stabilization of hydrophobic patches on the protein surface (Petrescu et al, 2004). Endo H digestion on proteins expressed in kifunensine-treated HEK293T cells thus results in homogenous deglycosylated proteins that still carry one GlcNAc residue important for
stability. Three days post-transfection, the medium, containing the protein of interest (Flt3D5) was collected and stored at -20°C.

48
6.3.2 Tetracycline-induced expression of Flt3D1 in HEK293S GnTI-/- cells Another option for Flt3 ectodomain expression is the use of a stable cell line (Verstraete et
al, 2011). For Flt3D1, a tetracycline inducible HEK293S cell line was used that was stably transfected with the pcDNA4/TO expression construct. The cell line we used is deficient in N-acetylglycosaminyltransferase I (GnTI-/-), and is thereby unable to synthesize complex N-
glycans (Reeves et al, 2002). Glycoproteins expressed in HEK293S GnTI-/- cells are relatively homogeneous and carry N-glycans of the Man5GlcNAc2 type. Furthermore, the cell line expresses the tetracycline repressor, because it is stably transfected with the pcDNA6-TR
vector. Because of the fact that the construct in the pcDNA4/TO vector is under control of the tetracycline operator (TO), tetracycline had to be added to induce expression of the construct. The HEK293S GnTI-/- Flt3D1 cell line (previously made in our group and stored at -
80°C with DMSO as cryoprotectant) was thawed and grown in DMEM/F12 medium containing FCS and antibiotics (penicillin and streptomycin) in a 175 cm²-falcon. Every week, the medium of the cells was refreshed. When the cell density was sufficiently high (as good
as confluent), the cells were split and seeded in fifty 175 cm²-falcons (50 ml medium per falcon, total amount of 1250ml). When the seeded cells were more than 90% confluent, the medium was replaced with serum-free medium and expression was induced with
tetracycline (2 µg/ml) and 5mM sodium butyrate. Sodium butyrate inhibits histone deacetylation (Candido et al, 1978), thereby relaxing the chromatin structure and increasing the levels of gene transcription. Five days post-induction, the medium was collected and
stored at -20°C.
6.3.3 Upscaled expression of Flt3D5 in roller bottles The pilot expression of Flt3D5 (1250 ml) gave satisfying results, which made us decide to scale up the expression in fourteen roller bottles (250 ml medium per bottle, total amount of 3500
ml). Therefore, fourteen 175 cm²-falcons were seeded with HEK293T cells growing in DMEM/F12 (including 10% FCS and antibiotics). When the cells were more than 90% confluent, they were split and seeded into fourteen roller bottles. Before the bottles were
placed in the rotation rack at 37°C, they were flushed with 5% CO2. At 90% confluency, the medium was replaced with serum-free medium containing kifunensine and the cells were transfected with 300 µg DNA and 450 µg PEI per bottle. The bottles were then placed in the
rotation rack without prior flushing. Four days post-transfection, the medium was collected and stored at -20°C.
6.3.4 Coexpression of Flt3D234 and nFL There are two options for the expression of the Flt3D234:FL complex. The first option is to express the ectodomain construct (Flt3D234) in HEK239T cells and the ligand (FL) in E. coli.
Because Flt3 ligand is then expressed in inclusion bodies, in vitro refolding is necessary (Verstraete et al, 2009). The complex can then be reconstituted by mixing ligand and receptor. We decided to coexpress the ectodomain construct and the ligand in HEK293T
cells, instead of expressing them separately. Fourteen roller bottles were seeded with HEK293T cells growing in DMEM/F12 including antibiotics and supplemented with FCS. At approximately 90% confluency, the medium was replaced with serum-free medium. The
cells were transfected with 300 µg DNA and 450 µg PEI per bottle. A small-scale expression test revealed that the optimal transfection ratio is approximately 4:1, meaning that a

49
fourfold excess of receptor encoding plasmid compared to ligand encoding plasmid gave the highest expression of Flt3D234. We applied the same ratio in our transfection mixes. Four days
post-transfection, the medium was collected and stored at -20°C.
6.4 Purification, concentration and deglycosylation of Flt3 ectodomain constructs
6.4.1 Immobilized metal affinity chromatography The first chromatographic purification step for every recombinant protein construct (Flt3D5, Flt3D1 and Flt3D2-D4) was IMAC (immobilized metal affinity chromatography) on a Talon®
Superflow column (Clontech Laboratories, Inc.). This column allows to separate the recombinant ectodomain constructs, provided with a C-terminal polyhistidine-tag, from other proteins present in the medium. The matrix of a Talon Superflow column consists of
sepharose beads to which a chelator molecule is bound. The tetradentate chelator binds a Co2+ ion. The imidazole groups present in the side chains of the His6-tag are engaged in a coordinative bond with the cobalt ion, which causes retention of the recombinant His-
tagged proteins on the column. The protein can subsequently be eluted using an buffer that contains a high concentration of imidazole.
Prior to purification, the medium, containing the protein of interest, was defrosted and subsequently centrifuged at a speed of 6000 x g to remove cellular debris. Thereafter, the medium was filtered through a 0.22 bottle-top filter. The Talon® Superflow, connected to an
ÄKTA Purifier (GE Healthcare) system, was equilibrated with binding buffer (300 mM NaCl, 50 mM NaH2PO4, pH 7.2) prior to loading of the medium. After loading, the column was washed with a buffer containing 5 mM imidazole. Next, the protein was eluted with a 200
mM imidazole containing buffer (300 mM NaCl, 50 mM NaH2PO4, pH 7.2, 200 mM imidazole). The column was put on 0.02% sodium azide for long term storage. To check whether the IMAC purification was successful, a SDS-PAGE gel was loaded with samples of
the flow through, the washing step and the eluted fraction.
6.4.2 Desalting In order to remove the imidazole that is present in the protein sample after IMAC purification, which could possibly hinder efficient enzymatic deglycosylation, a desalting step
was performed. The column used for desalting was a HiPrep™ 26/10 (Amersham biosciences) column. This column is packed with a sephadex G-25 gel. Proteins migrate faster through the matrix than salt ions and small molecules, which elute later. Protein
elution is characterized by a large absorption peak at 280 nm, while elution of salts and other small molecule components is characterized by a raise in conductivity.
The column, which was coupled to an ÄKTA Purifier, was first washed with deionized water, after which the column was equilibrated with running buffer (150 mM NaCl, 10 mM HEPES, pH 7.0). Afterwards, the Flt3D5 protein sample was loaded on the column via the P960
sample pump. The eluted protein was collected and the column was put on 0.02% sodium azide for long term storage.

50
6.4.3 Concentrating the protein samples Prior to gel filtration, enzymatic deglycosylation and crystallization screening, the protein
sample needed to be concentrated to a desired lower volume or higher concentration. This was done by using a Vivaspin® centrifugal concentrator (Sartorius). Vivaspin concentration is based on a selective filter, which has a defined molecular weight cut off (MWCO). During
centrifugation, water and components smaller than the cut off value migrate through the filter into the lower part of the concentrator, while the protein of interest remains in the upper part of the concentrator. Depending on the duration of centrifugation, the speed of
centrifugation and the initial concentration of the sample, concentrating the sample proceeds rapidly or slowly. For Flt3D5 and Flt3D1, a Vivaspin concentrator with a MWCO of 5 kDa was chosen, while the Flt3D2-D4:FL complex was concentrated with a MWCO 10 kDa
concentrator. The concentration of the protein samples was measured with a NanoDrop spectrophotometer (Thermo Scientific).
6.4.4 Enzymatic deglycosylation To assess the efficiency of enzymatic deglycosylation of Flt3D5, a small-scale deglycosylation
experiment was set up. Therefore, one aliquot (5 µl) of the protein sample was digested with PNGaseF after denaturation at 95°C in the presence of the detergents SDS and NP-40. Another aliquot of 5 µl was digested with Endoglycosidase H (EndoH). All digestions were
performed overnight at room temperature. As a negative control, an aliquot was left overnight without addition of any deglycosylating enzyme. The deglycosylation was evaluated on SDS-PAGE gel.
For enzymatic deglycosylation of Flt3D5 and Flt3D1 samples resulting from large-scale expression, protein samples obtained after IMAC purification were desalted and
concentrated to a volume of around 2 ml. 30 µl of endoglycosidase H (Endo H) was added and the samples were left overnight at room temperature.
6.4.5 Gel filtration Gel filtration, also known as size exclusion chromatography (SEC), results in a separation of
proteins according to their apparent molecular weight. The column matrix consists of gel beads with small pores. Big proteins cannot enter this pores and move along the gel beads, which makes them migrate faster through the column. Smaller proteins can enter the pores
of the beads and follow a considerably longer migration route, causing them to elute later than the bigger proteins. This principle allows to separate proteins according to their size. Different types of gel filtration columns exist, each having a characteristic separation range.
A HiLoad Superdex™ 75 (GE Healthcare) column was used for the purification of Flt3D1 and Flt3D5, while a HiLoad Superdex™ 200 column was used for the purification of the Flt3D2-D4:FL complex.
The column, which was coupled to an ÄKTA Purifier, was first equilibrated with running buffer (150 mM NaCl, 10 mM HEPES, pH 7.0). Next, the protein sample was injected into the
injection loop, after which the sample was loaded on the column. Fractions of 1.5 ml were collected starting from the void volume (40 ml) to the column volume (120 ml). Selected samples of some fractions were loaded on SDS-PAGE gel to evaluate the purification.

51
6.4.6 Cation exchange The gel filtration elution profile of deglycosylated Flt3D5 contained a small shoulder peak. A
sample of the fraction collected from that shoulder peak was loaded on SDS-PAGE gel to assess the composition. Seemingly, the fraction was a mixture of fully deglycosylated Flt3D5 and deglycosylation resistant Flt3D5. Perhaps, both species, deglycoD5 and glycoD5, could be
separated from each other using cation exchange. A MonoS column (GE Healthcare) was used to test this. The column matrix contains beads to which negatively charged sulfonic acid groups are bound. The protein is dissolved in a low pH buffer (20 mM MES pH 6.0), so
that it is positively charged and binds to the negatively charged sulfonic acid groups of the column. The protein can be subsequently eluted using a linear increasing gradient of salt. The MonoS column, coupled to an ÄKTA purifier, was first equilibrated with a 20 mM MES
pH 6.0 buffer. Next, the proteins sample was injected into the sample loop, after which the protein was loaded on the column. Given the fact that Flt3D5 has an pI (isoelectric point) of 8.6, the protein carries a net positive charge and binds to the negatively charged matrix. The
protein was eluted using a linear gradient from 0 to 1 M NaCl and collected in fractions of 200 µl. Selected samples of some fractions were loaded on SDS-PAGE gel to evaluate the purification.
6.5 Crystallization screens Crystallization of the protein of interest is arguably the main bottleneck in the process
leading to structure determination with X-ray crystallography (Chayen, 2004). Crystallization is a phase transition process that is dependent on a number of parameters such as temperature, precipitant concentration, buffer composition and pH. The ultimate goal of
crystallization is to obtain crystals that can be used for X-ray diffraction experiments (Chayen and Saridakis, 2008).
The aim of initial crystallization screening is to find certain conditions that give rise to crystallization of the protein of interest (so-called ‘hits’). Next, optimization screens, in which for example the precipitant concentration and pH of the condition that give rise to the hit is
varied in a two-dimensional grid screen, can be performed in order to obtain crystals that are probably usable for structure determination via X-ray crystallography. In certain cases however, protein crystals obtained during the initial screening are already usable for
structure determination purposes. For initial screening of the Flt3 ectodomain constructs, we made use of commercially available sparse matrix screens. The Mosquito® Crystal robot (TPP LabTech) allows to set up high throughput crystallization screens in a very short time
frame consuming limited amounts of protein sample. The screens were performed in a 96-well plate format using the sitting drop vapor diffusion method. First, 96 different screening solutions were pipetted into the reservoir wells of the 96-well plates using a multichannel
pipette. Next, the Mosquito robot pipets 100 nl of protein sample onto every position of the plate and mixes the drop with 100 nl of screening solution. On every 96-well plate, two entire screens can be tested (each consisting of 48 different conditions). The performed
initial crystallization screens for each of the Flt3 ectodomain constructs were as follows (the starting concentration of the protein sample is given between brackets):
Glycosylated Flt3D5 (5.7 mg/ml) o Crystal screen 1 + 2 (Hampton Research) o PEG/ION 1 + 2 (Hampton Research)

52
o ProPlex 1 + 2 (Molecular Dimensions) Deglycosylated Flt3D5 (6 mg/ml)
o Crystal screen 1 + 2 o PEG/ION 1 + 2
Deglycosylated Flt3D5 (11 mg/ml)
o Crystal screen 1 + 2 o PEG/ION 1 + 2 o ProPlex 1 + 2
Deglycosylated Flt3D1 (5 mg/ml) o Crystal screen 1 + 2 o PEG/ION 1 + 2
Glycosylated Flt3D2-D4:nFL (4 mg/ml) o PEG/ION 1 o ProPlex 1
o 3/5 diluted PEG/ION 1
After setting up the crystallization screens, the 96-well plates were placed in a rack at room
temperature. The plates were regularly inspected the first week (every 2 days) with a microscope in order to find protein crystals or promising conditions. If nothing of interest appeared after one week, the plates were placed at 4°C and again regularly inspected.

53
Part 7: References Aricescu AR, Lu W, Jones EY (2006) A time- and cost-efficient system for high-level protein production in
mammalian cells. Acta crystallographica Section D, Biological crystallography 62: 1243-1250
Birnboim HC, Doly J (1979) A rapid alkaline extraction procedure for screening recombinant plasmid DNA.
Nucleic acids research 7: 1513-1523
Borgstahl GE (2007) How to use dynamic light scattering to improve the likelihood of growing macromolecular
crystals. Methods in molecular biology 363: 109-129
Candido EP, Reeves R, Davie JR (1978) Sodium butyrate inhibits histone deacetylation in cultured cells. Cell 14:
105-113
Chan PM, Ilangumaran S, La Rose J, Chakrabartty A, Rottapel R (2003) Autoinhibition of the kit receptor
tyrosine kinase by the cytosolic juxtamembrane region. Molecular and cellular biology 23: 3067-3078
Chang VT, Crispin M, Aricescu AR, Harvey DJ, Nettleship JE, Fennelly JA, Yu C, Boles KS, Evans EJ, Stuart DI,
Dwek RA, Jones EY, Owens RJ, Davis SJ (2007) Glycoprotein structural genomics: solving the glycosylation
problem. Structure 15: 267-273
Chayen NE (2004) Turning protein crystallisation from an art into a science. Current opinion in structural
biology 14: 577-583
Chayen NE, Saridakis E (2008) Protein crystallization: from purified protein to diffraction-quality crystal. Nature
methods 5: 147-153
Chen X, Liu H, Focia PJ, Shim AH, He X (2008) Structure of macrophage colony stimulating factor bound to FMS:
diverse signaling assemblies of class III receptor tyrosine kinases. Proceedings of the National Academy of
Sciences of the United States of America 105: 18267-18272
D'Arcy A, Mac Sweeney A, Haber A (2003) Using natural seeding material to generate nucleation in protein
crystallization experiments. Acta crystallographica Section D, Biological crystallography 59: 1343-1346
Deschler B, Lubbert M (2006) Acute myeloid leukemia: epidemiology and etiology. Cancer 107: 2099-2107
Doulatov S, Notta F, Laurenti E, Dick JE (2012) Hematopoiesis: a human perspective. Cell stem cell 10: 120-136
Elegheert J, Desfosses A, Shkumatov AV, Wu X, Bracke N, Verstraete K, Van Craenenbroeck K, Brooks BR,
Svergun DI, Vergauwen B, Gutsche I, Savvides SN (2011) Extracellular complexes of the hematopoietic human
and mouse CSF-1 receptor are driven by common assembly principles. Structure 19: 1762-1772
Estey EH (2009) Treatment of acute myeloid leukemia. Haematologica 94: 10-16
Estey EH (2012) Acute myeloid leukemia: 2012 update on diagnosis, risk stratification, and management.
American journal of hematology 87: 89-99
Frohling S, Scholl C, Levine RL, Loriaux M, Boggon TJ, Bernard OA, Berger R, Dohner H, Dohner K, Ebert BL,
Teckie S, Golub TR, Jiang J, Schittenhelm MM, Lee BH, Griffin JD, Stone RM, Heinrich MC, Deininger MW,
Druker BJ, Gilliland DG (2007) Identification of driver and passenger mutations of FLT3 by high-throughput DNA
sequence analysis and functional assessment of candidate alleles. Cancer cell 12: 501-513
Geissmann F, Manz MG, Jung S, Sieweke MH, Merad M, Ley K (2010) Development of monocytes,
macrophages, and dendritic cells. Science 327: 656-661

54
Graddis TJ, Brasel K, Friend D, Srinivasan S, Wee S, Lyman SD, March CJ, McGrew JT (1998) Structure-function
analysis of FLT3 ligand-FLT3 receptor interactions using a rapid functional screen. The Journal of biological
chemistry 273: 17626-17633
Grassot J, Gouy M, Perriere G, Mouchiroud G (2006) Origin and molecular evolution of receptor tyrosine
kinases with immunoglobulin-like domains. Molecular biology and evolution 23: 1232-1241
Griffith J, Black J, Faerman C, Swenson L, Wynn M, Lu F, Lippke J, Saxena K (2004) The structural basis for
autoinhibition of FLT3 by the juxtamembrane domain. Molecular cell 13: 169-178
Gu TL, Nardone J, Wang Y, Loriaux M, Villen J, Beausoleil S, Tucker M, Kornhauser J, Ren J, MacNeill J, Gygi SP,
Druker BJ, Heinrich MC, Rush J, Polakiewicz RD (2011) Survey of activated FLT3 signaling in leukemia. PloS one
6: e19169
Hope KJ, Jin L, Dick JE (2004) Acute myeloid leukemia originates from a hierarchy of leukemic stem cell classes
that differ in self-renewal capacity. Nature immunology 5: 738-743
Hubbard SR, Miller WT (2007) Receptor tyrosine kinases: mechanisms of activation and signaling. Current
opinion in cell biology 19: 117-123
Hubbard SR, Till JH (2000) Protein tyrosine kinase structure and function. Annual review of biochemistry 69:
373-398
Kikushige Y, Yoshimoto G, Miyamoto T, Iino T, Mori Y, Iwasaki H, Niiro H, Takenaka K, Nagafuji K, Harada M,
Ishikawa F, Akashi K (2008) Human Flt3 is expressed at the hematopoietic stem cell and the
granulocyte/macrophage progenitor stages to maintain cell survival. Journal of immunology 180: 7358-7367
Kindler T, Lipka DB, Fischer T (2010) FLT3 as a therapeutic target in AML: still challenging after all these years.
Blood 116: 5089-5102
Krieger E, Koraimann G, Vriend G (2002) Increasing the precision of comparative models with YASARA NOVA--a
self-parameterizing force field. Proteins 47: 393-402
Laemmli UK (1970) Cleavage of structural proteins during the assembly of the head of bacteriophage T4.
Nature 227: 680-685
Lavagna C, Marchetto S, Birnbaum D, Rosnet O (1995) Identification and characterization of a functional murine
FLT3 isoform produced by exon skipping. The Journal of biological chemistry 270: 3165-3171
Lemmon MA, Schlessinger J (2010) Cell signaling by receptor tyrosine kinases. Cell 141: 1117-1134
Levis M (2011) FLT3/ITD AML and the law of unintended consequences. Blood 117: 6987-6990
Lin H, Lee E, Hestir K, Leo C, Huang M, Bosch E, Halenbeck R, Wu G, Zhou A, Behrens D, Hollenbaugh D,
Linnemann T, Qin M, Wong J, Chu K, Doberstein SK, Williams LT (2008) Discovery of a cytokine and its receptor
by functional screening of the extracellular proteome. Science 320: 807-811
Liu H, Leo C, Chen X, Wong BR, Williams LT, Lin H, He X (2012) The mechanism of shared but distinct CSF-1R
signaling by the non-homologous cytokines IL-34 and CSF-1. Biochimica et biophysica acta
Ma X, Lin WY, Chen Y, Stawicki S, Mukhyala K, Wu Y, Martin F, Bazan JF, Starovasnik MA (2012) Structural Basis
for the Dual Recognition of Helical Cytokines IL-34 and CSF-1 by CSF-1R. Structure 20: 676-687
Metcalf D (2008) Hematopoietic cytokines. Blood 111: 485-491

55
Passegue E, Jamieson CH, Ailles LE, Weissman IL (2003) Normal and leukemic hematopoiesis: are leukemias a
stem cell disorder or a reacquisition of stem cell characteristics? Proceedings of the National Academy of
Sciences of the United States of America 100 Suppl 1: 11842-11849
Petrescu AJ, Milac AL, Petrescu SM, Dwek RA, Wormald MR (2004) Statistical analysis of the protein
environment of N-glycosylation sites: implications for occupancy, structure, and folding. Glycobiology 14: 103-
114
Pietras EM, Warr MR, Passegue E (2011) Cell cycle regulation in hematopoietic stem cells. The Journal of cell
biology 195: 709-720
Piloto O, Nguyen B, Huso D, Kim KT, Li Y, Witte L, Hicklin DJ, Brown P, Small D (2006) IMC-EB10, an anti-FLT3
monoclonal antibody, prolongs survival and reduces nonobese diabetic/severe combined immunodeficient
engraftment of some acute lymphoblastic leukemia cell lines and primary leukemic samples. Cancer research
66: 4843-4851
Reeves PJ, Callewaert N, Contreras R, Khorana HG (2002) Structure and function in rhodopsin: high-level
expression of rhodopsin with restricted and homogeneous N-glycosylation by a tetracycline-inducible N-
acetylglucosaminyltransferase I-negative HEK293S stable mammalian cell line. Proceedings of the National
Academy of Sciences of the United States of America 99: 13419-13424
Robb L (2007) Cytokine receptors and hematopoietic differentiation. Oncogene 26: 6715-6723
Santos FP, Jones D, Qiao W, Cortes JE, Ravandi F, Estey EE, Verma D, Kantarjian H, Borthakur G (2010)
Prognostic value of FLT3 mutations among different cytogenetic subgroups in acute myeloid leukemia. Cancer
Sato T, Yang X, Knapper S, White P, Smith BD, Galkin S, Small D, Burnett A, Levis M (2011) FLT3 ligand impedes
the efficacy of FLT3 inhibitors in vitro and in vivo. Blood 117: 3286-3293
Savvides SN, Boone T, Andrew Karplus P (2000) Flt3 ligand structure and unexpected commonalities of helical
bundles and cystine knots. Nature structural biology 7: 486-491
Sere KM, Lin Q, Felker P, Rehage N, Klisch T, Ortseifer I, Hieronymus T, Rose-John S, Zenke M (2011) Dendritic
cell lineage commitment is instructed by distinct cytokine signals. European journal of cell biology
Shim AH, Liu H, Focia PJ, Chen X, Lin PC, He X (2010) Structures of a platelet-derived growth factor/propeptide
complex and a platelet-derived growth factor/receptor complex. Proceedings of the National Academy of
Sciences of the United States of America 107: 11307-11312
Socolovsky M, Lodish HF, Daley GQ (1998) Control of hematopoietic differentiation: lack of specificity in
signaling by cytokine receptors. Proceedings of the National Academy of Sciences of the United States of
America 95: 6573-6575
Stirewalt DL, Radich JP (2003) The role of FLT3 in haematopoietic malignancies. Nature reviews Cancer 3: 650-
665
Sun PD, Foster CE, Boyington JC (2004) Overview of protein structural and functional folds. Current protocols in
protein science / editorial board, John E Coligan [et al] Chapter 17: Unit 17 11
Toffalini F, Demoulin JB (2010) New insights into the mechanisms of hematopoietic cell transformation by
activated receptor tyrosine kinases. Blood 116: 2429-2437
Verstraete K (2011) Structural insights into the extracellular assembly of the hematopoietic Flt3 Ligand-
Receptor complex. Departement of Biochemistry and Microbiology, Ghent University,

56
Verstraete K, Koch S, Ertugrul S, Vandenberghe I, Aerts M, Vandriessche G, Thiede C, Savvides SN (2009)
Efficient production of bioactive recombinant human Flt3 ligand in E. coli. The protein journal 28: 57-65
Verstraete K, Remmerie B, Elegheert J, Lintermans B, Haegeman G, Vanhoenacker P, Van Craenenbroeck K,
Savvides SN (2011) Inducible production of recombinant human Flt3 ectodomain variants in mammalian cells
and preliminary crystallographic analysis of Flt3 ligand-receptor complexes. Acta crystallographica Section F,
Structural biology and crystallization communications 67: 325-331
Verstraete K, Vandriessche G, Januar M, Elegheert J, Shkumatov AV, Desfosses A, Van Craenenbroeck K,
Svergun DI, Gutsche I, Vergauwen B, Savvides SN (2011) Structural insights into the extracellular assembly of
the hematopoietic Flt3 signaling complex. Blood 118: 60-68
Walter TS, Meier C, Assenberg R, Au KF, Ren J, Verma A, Nettleship JE, Owens RJ, Stuart DI, Grimes JM (2006)
Lysine methylation as a routine rescue strategy for protein crystallization. Structure 14: 1617-1622
Warr MR, Pietras EM, Passegue E (2011) Mechanisms controlling hematopoietic stem cell functions during
normal hematopoiesis and hematological malignancies. Wiley interdisciplinary reviews Systems biology and
medicine 3: 681-701
Waskow C, Liu K, Darrasse-Jeze G, Guermonprez P, Ginhoux F, Merad M, Shengelia T, Yao K, Nussenzweig M
(2008) The receptor tyrosine kinase Flt3 is required for dendritic cell development in peripheral lymphoid
tissues. Nature immunology 9: 676-683
Yamamoto Y, Tsuzuki S, Akahori Y, Ukai Y, Sumitomo M, Murayama Y, Yamamoto K, Inaguma Y, Tokuda M, Abe
A, Akatsuka Y, Emi N, Kurosawa Y (2012) Isolation of human mAbs that directly modulate FMS-related tyrosine
kinase 3 signaling. Cancer science 103: 350-359
Yang Y, Xie P, Opatowsky Y, Schlessinger J (2010) Direct contacts between extracellular membrane-proximal
domains are required for VEGF receptor activation and cell signaling. Proceedings of the National Academy of
Sciences of the United States of America 107: 1906-1911
Yang Y, Yuzawa S, Schlessinger J (2008) Contacts between membrane proximal regions of the PDGF receptor
ectodomain are required for receptor activation but not for receptor dimerization. Proceedings of the National
Academy of Sciences of the United States of America 105: 7681-7686
Yuzawa S, Opatowsky Y, Zhang Z, Mandiyan V, Lax I, Schlessinger J (2007) Structural basis for activation of the
receptor tyrosine kinase KIT by stem cell factor. Cell 130: 323-334

57
Part 8: Protocols and buffers (appendix 1) 8.1 Cloning of expression constructs in pcDNA™4/TO/mu vector
8.1.1 PCR amplification
PCR Mastermix (1 reaction, 50 µl)
template DNA 20 ng (2 µl of 10 ng/µl solution)
10x PCR Buffer (Easy-A™, Agilent) 5 µl
dNTPs 0.5 µl (50mM stock solution)
Primers 5 µl (forward and reverse, 10 µM stock solution))
DNA polymerase (Easy-A™, Agilent) 0.5 µl
Water Add up to 50µl
Total 50 µl
PCR Cycle Program
Phase Temperature (°C) Duration
1. Initial denaturation 95°C 2 min
2. Denaturation 95°C 40 s
3. Annealing 57°C 30 s
4. Polymerization 72°C 1 min
5. Back to step 2 (30 cyles in total, then step 6)
6. Final polymerization 72°C 7 min
8.1.2 Analytical agarose gel electrophoresis
1. Pour the gel (1% agarose, including Gel Red), insert the comb.
2. Add 10 µl loading buffer to 50 µl sample.
3. Remove the comb. Put the solid gel in the electrophoresis tank containing TBE buffer.
4. Load the gel. 5 µl marker, 8 µL sample.
5. Run at 140 V, approximately 15 min.
6. Visualize the DNA bands under a UV lamp.
8.1.3 Preparative agarose gel electrophoresis
1. Pour the gel (1% agarose, including Gel Red), insert the comb.
2. Add 150 µl loading buffer to 150 µl sample.
3. Remove the comb. Put the solid gel in the electrophoresis tank containing TBE buffer.
4. Load the gel. 5 µl marker (in small lane), 150 µl sample (big lanes).

58
5. Run at 140 V, approximately 30 min.
6. Visualize the DNA bands under a UV lamp. Cut the bands of interest out of the gel.
8.1.4 DNA extraction Mini Elute™ (Analytic Jena)
1. Excise the DNA fragment from the agarose gel with a sharp scalpel.
2. Transfer the gel slice into a 1.5 ml or 2.0 ml reaction tube and add 650 µl Gel Solubilizer.
3. Incubate for 10 min at 50°C until the agarose gel slice is completely dissolved.
4. Add 50 µl Binding Optimizer and mix the suspension by pipetting up and down or vortexing.
5. Apply the sample onto the Spin Filter located in a 2.0 ml Receiver Tube. Close the cap and centrifuge at 10 000 x g (~12 000 rpm) for 1 min. Discard the filtrate and re-use the Receiver Tube. Place the Spin Filter back into the 2.0 ml Receiver Tube.
6. Open the Spin Filter and add 700 µl Washing Solution LS, close the cap and centrifuge at 10 000 x g (~12 000 rpm) for 1 min. Discard the filtrate and re-use the Receiver Tube. Place
the Spin Filter back into the 2.0 ml Receiver Tube.
7. Repeat point 6 completely.
8. Centrifuge at max. speed for 2 min to remove all traces of ethanol. Discard the 2.0 ml Receiver Tube.
9. Place the Spin Filter into a 1.5 ml Elution Tube. Carefully open the cap of the Spin Filter and add 30-50 µl Elution Buffer. Incubate at room temperature for 1 min. Centrifuge at 6000
x g (~8000 rpm) for 1 min. A second elution step will increase the yield of extracted DNA.
8.1.5 Ligation in pCR®2.1-TOPO®-vector (Invitrogen)
Ligation Mix (1 reaction, 5 µl)
DNA insert (PCR product) 1 µl
Salt Solution 1 µl
pCR®2.1-TOPO®-vector 1 µl
Water 2 µl
Total 5 µl
1. Make the ligation mix.
2. Incubate on ice for 5 min.
3. Desalt the mixture using Spin Filter

59
8.1.6 Electroporation of TOP10 cells
1. Pour 600 µl SOC medium in a 10 ml tube.
2. Take the TOP10™ cells (Invitrogen) out of the freezer.
3. Add about 1.5 µl DNA solution to the cell suspension and stir softly with your pipette.
4. Transfer the cell suspension to an electroporation cuvette. Electroporate the cells with a
short 2.5 kV pulse.
5. Transfer the cell suspension from the cuvette into the SOC medium and incubate for 30
minutes at 37°C in a shaker.
6. Plate the cells on LB-agar (containing an antibiotic for selection) and incubate overnight at
37°C.
8.1.7 Alkaline extraction of DNA for screening purposes (method of Birnboim and Doly, 1979)
1. Pour 3 ml LB medium (including an antibiotic for selection) in a ‘Birnboim’ glass tube (15 tubes in total per construct).
2. Pick the colonies and plate them on a masterplate. Afterwards, shoot the pipette tip in the glass tube. The tube and the position on the masterplate (inoculated with the same colony)
are equally numbered. Grow overnight.
3. Transfer 1 ml of broth culture in a 1.5 ml eppendorf (for every sample, x 15). Spin down
your cells (30s, 14 000 x g, 4°C).
4. Resuspend the pellet in 100 µl cold P1 (50 mM Tris-HCl, 10 mM EDTA, 100 µg/ml RNAse A,
pH 8.0). Vortex.
5. Add 100 µl P2 (200 mM NaOH, 1% SDS). Mix by inverting 5 times. Incubate at room
temperature for 5 minutes.
6. Add 100 µl chilled P3 (5M potassium acetate, 17 M Acetic acid). Centrifuge for 5 minutes
at 14 000 x g, 4°C.
7. Tranfer the supernatant to a new eppendorf. Add 300 µl
phenol/chloroform/isoamylalcohol (25:24:1). Invert a few times. Centrifuge at 14 000 x g, 4°C for 2 minutes.
8. Transfer the upper phase (watery phase, contains plasmid DNA) into a new eppendorf.
9. Precipitate the plasmid DNA with 2 volumes of 100% ethanol. Mix and incubate for 2
minutes at room temperature. Spin the DNA precipitate down (14 000 x g, 4°C, 5 min). Remove the supernatant promptly.
10. Wash the pellet with 100 µl 70 % ethanol. Spin down (14 000 x g, 4°C, 2 min). Remove the supernatant and let the pellets dry for ~10 minutes.
11. Redissolve the pellets in a suitable mix of restriction enzymes. Identify the transformed clones via agarose gel electrophoresis.

60
8.1.8 Plasmid purification using QIAGEN® Plasmid Midi kit (“Midi Prep”)
1. Pick a single colony from a freshly streaked selective plate and inoculate a starter culture of 2-5 ml LB medium containing the appropriate selective antibiotic. Incubate for
approximately 8 hours at 37°C with vigorous shaking.
2. Dilute the starter culture 1/500 into selective LB medium. For high-copy plasmids,
inoculate 25 ml medium with 25 µl of starter culture. Grow at 37°C for 12-16 h with vigorous shaking.
3. Harvest the bacterial cells by centrifugation at 6000 x g for 15 min at 4°C.
4. Resuspend the bacterial pellet in 4 ml buffer P1 (50 mM Tris-HCl, 10 mM EDTA, 100 µg/ml
RNAse A, pH 8.0).
5. Add 4 ml buffer P2 (200 mM NaOH, 1% SDS), mix thoroughly by vigoursly inverting the
sealed tube 4-6 times, and incubate at room temperature (15-25°C) for 5 min.
6. Add 4 ml or chilled buffer P3 (5M potassium acetate, 17 M Acetic acid), mix immediately
and thoroughly by vigorously inverting 4-6 times, and incubate on ice for 15 min.
7. Centrifuge at >20 000 x g for 30 min at 4°C. Remove supernatant containing plasmid DNA
promptly.
8. Centrifuge the supernatant again at >20 000 x g for 15 min at 4°C. Remove supernatant
containing plasmid DNA promptly.
9. Equilibrate a QIAGEN-tip 100 by applying 4 ml Buffer QBT, and allow the column to empty
by gravity flow.
10. Apply the supernatant from step 8 to the QIAGEN-tip and allow it to enter the resin by
gravity flow.
11. Wash the QIAGEN-tip with 2 x 10 ml Buffer QC.
12. Elute DNA with 5 ml Buffer QF.
13. Precipitate DNA by adding 3.5 ml room-temperature isopropanol to the eluted DNA. Mix and centrifuge immediately at >15 000 x g for 30 min at 4°C. Carefully decant the supernatant.
14. Wash DNA pellet with 2 ml of room-temperature 70% ethanol, and centrifuge at >15 000 x g for 10 min. Carefully decant the supernatant without disturbing the pellet.
15. Air-dry the pellet for 5-10 min, and redissolve the DNA in a suitable volume of buffer.

61
8.1.9 Preparative restriction digest of TOPO-vector
Restriction mix
TOPO-vector (including insert) 7 µg
AgeI 2 µl
KpnI 2 µl
NEB 1 5 µl
10x BSA 5 µl
Water Add up to 50 µl
Total 50 µl
1. Digest for at least 4h at 37°C.
2. Load on preparative agarose gel.
3. Extract insert DNA out of the gel.
8.1.10 Ligation in expression vector
Ligation Mix (1 reaction, 20 µl)
2x Ligation Buffer 10 µl
Vector DNA 1 µl
Insert DNA 5 µl
T4 DNA ligase 1 µl
Water 3 µl
Total 20 µl
1. Make ligation mix.
2. Let the ligation reaction proceed for 5 minutes at room temperature.
3. Desalt the mixture using Spin Filters.
8.2 Small-scale expression test in HEK293T cells
8.2.1 Seeding HEK293T cells in 6-well plates
1. Remove medium from 175 cm²-falcon.
2. Add 10 ml of EDTA/Trypsin solution. Incubate for 5 min. Make sure that all cells are released from the surface by tapping on the falcon.
3. Add 10 ml of fresh DMEM/F12 medium (incl. FCS and penicillin/streptomycin).
4. Spin the cells down (5 min, 700 x g, 37°C).
5. Resuspend the cells in fresh medium.
6. Add 3 ml cell suspension per well. Incubate the 6-well plates in the CO2-incubator (5% CO2, 37°C).

62
8.2.2 Transfection of 6-well plates
1. Remove medium from the wells.
2. Add 2 ml fresh, serum-free medium (including penicillin/streptomycin and kifunensine) to every well.
3. Make the transfection mixtures, containing 500 µl serum-free medium (including penicillin/streptomycin and kifunensine), 5 µg DNA and 7.5 µg PEI (polyethyleneimine).
Vortex the mixtures and incubate for a few minutes.
4. Add 200 µl of transfection mixture per well (2 µg of DNA per well).
5. Incubate the 6-well plates in the CO2-incubator (5% CO2, 37°C).
8.2.3 SDS-PAGE gel
Recipe for 4 gels
Resolving gel (15%) Stacking gel (6%)
Acrylamide (30%) 10 ml Acrylamide (30%) 3 ml
Running Buffer 10 ml Stacking Buffer 1.5 ml
SDS (20%) 100 µl SDS (20%) 75 µl
APS 200 µl APS 150 µl
TEMED 10 µl TEMED 7.5 µl
Water 10.5 ml
8.2.4 Western blot with chemiluminescent detection of His-tagged protein of interest
1. After three days of incubation after transfection, transfer the medium from the plates in 2 ml eppendorfs.
2. Centrifuge the samples at maximum speed for about 15 min.
3. Mix 60 µl of medium with 30 µl Laemmli-buffer, including 5% β-mercaptoethanol (Laemmli, 1970). Heat the samples for 5 min at 95°C.
4. Load the samples on SDS-PAGE gel. Run the gel at 140 V for about 1 h.
5. Soak six Whatman™ blotting papers and one nitrocellulose membrane (Hybond ECL™, GE)
in protein transfer buffer (PTB).
Protein Tranfer Buffer (1 l)
Tris (Trizma) pH 8.3 3.03 g
Glycine 14.4 g
Methanol 200 ml
Water Add up to 1 l
6. Put the gel between 3 Whatman papers and the nitrocellulose membrane. Make sure
there are no air bubbles between the membrane and the gel. Put 3 Whatman papers at the other side of the membrane. Put the whole thing in the cassette, with the gel on the black side (negative pole), and the nitrocellulose membrane on the red side (positive pole). Blot
overnight at 40V.

63
7. Wash the nitrocellulose membrane with PBS buffer.
PBS Buffer pH 7.4 (1 l)
NaCl 8 g
KCl 0.2 g
Na2HPO4 1.44 g
KH2PO4 0.24 g
Water Add up to 1 l
8. Block the membrane in 5% non-fat dry milk-PBS buffer during 3 hours (on a shaker).
9. Rinse the membrane with PBST (PBS with 0.1% Tween). Wash the membrane on the
shaker during 3 x 5 min with PBST.
10. Incubate with primary antibody (anti-HIS C-terminal HRP-antibody, Invitrogen), dissolved
in 6 ml 5% non-fat dry milk-PBST buffer during at least 1 h on the shaker.
11. Rinse the membrane with PBST. Wash the membrane on the shaker with PBST during 6 x
5 min.
12. Put the membrane on plastic foil in a light-tight cassette (in a dark room) and pipette 1
ml of a 1:1 mixture of enhancer and peroxide solution (SuperSignal® West Femto, Thermo Scientific) on the membrane. Incubate for 5 minutes.
13. Put plastic foil on top of the membrane. Make sure they are no air bubbles between the membrane and the foil.
14. Turn out the bright light and turn on the red light. Take a photographic film and put it on top of the plastic-covered membrane. Close the light-tight cassette for a certain period of time, depending on the expected signal strength.
15. Open up the cassette and put the film consecutively in developer, fixation and washing solution.
8.3 Large-scale expression in HEK293T and HEK293S cells
8.3.1 Plasmid purification using QIAGEN® EndoFree Plasmid Giga kit (“Giga Prep”)
1. Pick a single colony from a freshly streaked selective plate and inoculate a starter culture of 5-10 ml LB medium containing the appropriate selective antibiotic. Incubate for approx. 8h at 37°C with vigorous shaking (approx. 300 rpm).
2. Dilute the starter culture 1/500 to 1/1000 into selective LB medium. Inoculate 4 liters medium with 5 ml of starter culture. Grow at 37°C for 12-16 h with vigorous shaking.
3. Harvest the bacterial cells by centrifugation at 6000 x g for 15 min at 4°C.
4. Screw the QIAfilter Giga-Cartridge onto a 45 mm-neck glass bottle and connect it to a vacuum source.
5. Resuspend the bacterial pellet in 125 ml of buffer P1.
6. Add 125 ml of buffer P2, mix thoroughly by vigorously inverting 4-6 times, and incubate at
room temperature for 5 min.

64
7. Add 125 ml chilled buffer P3 and mix thoroughly by vigorously inverting 4-6 times. Mix well until white, fluffy material has formed and the lysate is no longer viscous. Proceed
directly to step 8. Do not incubate on ice.
8. Pour the lysate into the QIAfilter Giga cartridge and incubate at room temperature for 10
min.
9. Switch on the vacuum source. After all liquid has been pulled through, switch off the
vacuum source. Leave the QIAfilter Cartridge attached.
10. Add 50 ml Buffer FWB2 to the QIAfilter Cartridge and gently stir the precipitate using a
sterile spatula. Switch on the vacuum source until the liquid has been pulled through completely.
11. Add 30 ml Buffer ER to the filtered lysate, mix by inverting the bottle approximately 10 times, and incubate on ice for 30 min.
12. Equilibrate a QIAGEN-tip 10000 by applying 75 ml buffer QBT, and allow the column to empty by gravity flow.
13. Apply the filtered lysate from step 11 onto the QIAGEN-tip and allow it to enter the resin by gravity flow.
14. Wash the QIAGEN-tip with a total of 600 ml Buffer QC.
15. Elute DNA with 100 ml Buffer QN.
16. Precipitate DNA by adding 70 ml room-temperature isopropanol to the eluted DNA. Mix and centrifuge immediately at >15 000 x g for 30 min at 4°C. Carefully decant the
supernatant.
17. Wash DNA pellet with 10 ml of endotoxin-free room-temperature 70% ethanol and
centrifuge at >15 000 x g for 10 min. Carefully decant the supernatant without disturbing the pellet.
18. Air-dry the pellet for 10-20 min, and redissolve the DNA in a suitable volume of endotoxin-free Buffer TE.
8.3.2 Cell culture splitting (HEK293T and HEK293S cells)
1. Preheat an appropriate amount of DMEM/F12 medium at 37°C. Thaw FCS and penicillin/streptomycin mixture.
2. Add 100 ml FCS per 900 ml medium. Add 2 ml of the antibiotic mixture per liter medium.
3. Remove medium from 175 cm²-falcon.
4. Add 10 ml of EDTA/Trypsin solution. Incubate for 5 min. Make sure that all cells are
released from the surface by tapping on the falcon.
5. Add 10 ml of fresh DMEM/F12 medium (incl. FCS and penicillin/streptomycin).
6. Spin the cells down (5 min, 700 x g, 37°C).
7. Resuspend the cells in fresh medium.

65
8. Seed the harvested cells into a certain number of 175 cm²-falcons or roller bottles, according to the dilution factor you want to apply. The falcons or roller bottles are already
prefilled with a suitable amount of fresh medium.
9. Incubate the 175 cm²-falcons in the CO2-incubator (5% CO2, 37°C) or flush the roller
bottles with 5% CO2, after which you put them in the rotation rack in the incubation room.
8.3.3 Transfection of HEK293T cells growing in 175 cm2-falcons
1. Add 1 mg DNA and 1.5 mg PEI to 1L of serum-free medium (including penicillin/streptomycin and kifunensine). Mix and incubate for 5 minutes.
2. Remove medium from the falcons.
2. Add 50 ml DNA-PEI containing medium to each falcon (50 µg DNA/falcon).
3. Incubate the 175 cm²-falcons in the CO2-incubator (5% CO2, 37°C).
4. Collect the medium (containing the secreted protein of interest) 3 to 4 days post-transfection and store it at -20°C.
8.3.4 Transfection HEK293T cells growing in roller bottles
1. Remove medium from the bottles.
2. Add approximately 200 ml of fresh serum-free medium (including penicillin/streptomycin).
3. Make the transfection mixtures, containing 50 ml serum-free medium (including penicillin/streptomycin and kifunensine), 300 µg DNA and 450 µg PEI (polyethyleneimine). Vortex the mixtures and incubate for a few minutes.
4. Pour the transfection mixture into the roller bottle (300 µg DNA/roller bottle).
5. Put the roller bottles in the rotation rack in the incubation room at 37°C.
6. Collect the medium (containing the secreted protein of interest) 3 to 4 days post-
transfection and store it at -20°C.
8.3.5 Induction of recombinant protein production in stable HEK293S GnTI-/- TetR cell line
1. Add tetracycline (final concentration of 2 mg/l) to fresh serum-free medium (including
penicillin/streptomycin).
2. Add sodium butyrate (final concentration of 5 mM) to the medium.
3. Remove the old medium from the 175 cm2-falcons and replace it with the fresh medium.
4. Incubate the 175 cm²-falcons in the CO2-incubator (5% CO2, 37°C).
5. Collect the medium (containing the secreted protein of interest) 5 days post-induction and
store it at -20°C.

66
8.4 Purification, concentrating and deglycosylation of recombinant Flt3 ectodomain constructs
8.4.1 Immobilized metal affinity chromatography (IMAC)
The IMAC purification step is performed with a Talon® column (Clontech Laboratories, Inc.) coupled to an Äkta Purifier (GE healthcare).
1. Wash and equilibrate the column with binding buffer (300 mM NaCl, 50 mM NaH2PO4, pH 7.2).
2. Blank the UV detector.
3. Start to load your sample (thawed medium containing the protein of interest) via the A1
pump. Make sure the pressure over the column is never higher than 1 MPa by applying a pressure alarm and restricting the flow speed. Collect a sample from the flow through.
4. Perform a wash step with a buffer containing 5 mM imidazole. Collect a sample from the flow through.
5. Elute the protein of interest with the elution buffer (300 mM NaCl, 50 mM NaH2PO4, pH 7.2, 200 mM imidazole). Collect the eluted protein in a falcon.
6. Wash the column with binding buffer.
7. Put the column on azide (0.02 % w/v in water).
8. Check the result of purification on SDS-PAGE gel by loading the flow through, a fraction obtained during the wash step and a sample of your eluted protein.
8.4.2 Desalting using a HiPrep 26/10 column (Amersham Biosciences)
The column is coupled to an Äkta Purifier (GE healthcare)
1. Wash the column with deionized water. Equilibrate the column with running buffer (150
mM NaCl, 10 mM HEPES, pH 7.0).
2. Load the protein sample using the P960 sample pump.
3. Collect the fraction containing the protein (first peak on the chromatogram).
4. Wash the column with running buffer and put it on 0.02% azide.
8.4.3 Concentration of the protein sample using a Vivaspin® centrifugal concentrator (Sartorius
Stedim)
1. Put the protein sample in a Vivaspin concentrator with an appropriate molecular weight cut off (MWCO).
2. Centrifuge your sample until the volume of the protein solution has dropped to the desired level.
8.4.4 Deglycosylation of the protein with Endoglycosidase H
1. Add 30 µl of EndoH to the protein sample and digest it overnight at room temperature.

67
8.4.5 Gel filtration
The SEC purification step is performed with a HiLoad Superdex™ 75 column (GE Healthcare)
for the smaller protein constructs (Flt3D1 and Flt3D5) and a HiLoad Superdex™ 200 column (GE Healthcare) for the complex (Flt3D2-D4:FL). The column is coupled to an Äkta Purifier (GE healthcare).
1. Equilibrate the column with running buffer (150 mM NaCl, 10 mM HEPES, pH 7.0). Make sure the pressure over the column is never higher than 0.3 MPa by applying a pressure alarm
and restricting the flow speed to 1 ml/min.
2. Inject the concentrated protein sample into the sample loop using a syringe.
3. Set the injection valve into the ‘load’ position.
4. Collect fractions of 1.5 ml starting at an elution volume of 40 ml (void volume) until 120 ml (column volume).
5. Put the column on 0.02% azide.
6. Check the purification on SDS-PAGE gel by loading a sample of the flow through and
samples of selected fractions.
8.4.6 Cation Exchange
The cation exchange purification step was performed with a MonoS® ion exchange column, coupled to an Äkta Purifier.
1. Equilibrate the column with buffer A (20 mM MES pH 6.0). Make sure the pressure over the column is never higher than 5 MPa by applying a pressure alarm and restricting the flow
rate to 1.5 ml/min.
2. Inject the protein sample into the sample loop using a syringe.
3. Set the injection valve into the ‘load’ position.
4. Apply a linear gradient of buffer B (20 mM MES pH 6.0, 1 M NaCl).
5. Collect 200 µl fractions starting at a conductivity of 0% (0% buffer B) to 100% (100% buffer
B, 1 M NaCl).
6. Wash the column with deionized water and put it on azide for long term storage.
8.5 Crystallization screens
8.5.1 Setting up a HTP sitting-drop vapor diffusion crystallization screen
1. Concentrate the protein sample using a Vivaspin® centrifugal concentrator.
2. Measure the protein concentration using a NanoDrop spectrophotometer (Thermo Scientific). If the concentration is not high enough yet, continue with concentrating the
sample.
3. Centrifuge the sample at maximum speed for more than 30 minutes.
4. Pipet (with a multichannel pipette) 45 ml of the screening solutions into the reservoir wells of the 96-well plate used for crystallization (1 condition/well). One 96-well plate is enough to perform 2 screens (each screen consists of 48 different screening conditions).

68
5. Take the protein sample out of the centrifuge and set up the crystallization screen (sitting drop vapor diffusion) using the Mosquito® Crystal robot (TTP Labtech). The robot pipets 100
nl of protein solution on the plate and mixes it with 100 nl of screening solution in a ‘sitting-drop’ format. When the robot has finished, the well plate contains 96 ‘sitting-drops’ of 200 nl and 96 reservoir wells containing the 96 different reservoir solutions.
6. Seal the plate tightly with a plastic film and leave it on a rack at room temperature.
7. Inspect the plate regularly (for example every 2 days) with a microscope the first week after setting up the trial in order to find protein crystals or promising conditions. If nothing appears after a week, put the plate at 4°C and check the plate again on a regular basis.
8.5.2 Izit staining
1. Use a small loop to pick up a minute amount of Izit Dye. Add the small amount of dye into the 200 nl drop.
2. Evaluate the drop at least a few hours after the staining procedure. If the crystals have a deep blue appearance, they are probably protein crystals.

69
Part 9: Additional information about Flt3 ectodomain constructs (appendix 2)
Flt3D1
ETGNQDLPVIKCVLINHKNNDSSVGKSSSYPMVSESPEDLGCALRPQSSGTVYEAAAVEVDVSASITLQVLVDAP
GNISCLWVFKHSSLNCQPHFDLQNRGVVSMVILKMTETQAGEYLLFIQSEATNYTILFTVSIRGTKHHHHHH
Sequence of Flt3D1 with C-terminal His-tag. N-glycosylation (identified with NetNGlyc) sites are marked in yellow.
Multiple sequence alignment of hFlt3D1 (human Flt3D1) with mFlt3D1 (mouse Flt3D1) and domain 1 of homologous receptors KIT and FMS (CSF-1R). Adapted from Verstraete et al, 2011.
Protein parameters of Flt3D1 obtained via ProtParam
Number of amino acids 147
Molecular weight 16118.2 Da
Theoretical pI 5.94
Extinction coefficient at 280 nm 11710 M-1 cm-1
Absorbance (0.1%) at 280 nm 0.727
Schematic overview of Flt3D1. N-glycosylation sites are indicated with blue diamonds. Disulfide bridges are indicated as black lines bridging two cysteine residues. Adapted from Verstraete et al, 2011.

70
Flt3D5
ETGRKPQVLAEASASQASCFSDGYPLPSWTWKKCSDKSPNCTEEITEGVWNRKANRKVFGQWVSSSTLNMSEAIK
GFLVK CCAYNSLGTSCETILLNSPGTKHHHHHH
Sequence of Flt3D5 with C-terminal His-tag. N-glycosylation sites (identified with NetNGlyc) are marked in yellow.
Multiple sequence alignment of hFlt3D5 (human Flt3D5) with mFlt3D5 (mouse Flt3D5) and domain 5 of homologous receptors KIT and FMS (CSF-1R). Adapted from Verstraete et al, 2011.
Protein parameters of Flt3D5 obtained via ProtParam
Number of amino acids 108
Molecular weight 11966.4 Da
Theoretical pI 8.60
Extinction coefficient at 280 nm 25355 M-1 cm-1
Absorbance (0.1%) at 280 nm 2.119
Schematic overview of Flt3D5. N-glycosylation sites are indicated with blue diamonds. Putative disulfide bridges are indicated as dashed black lines bridging two cysteine residues. Adapted from Verstraete et al, 2011.

71
Flt3D2-D4
ETGNTLLYTLRRPYFRKMENQDALVCISESVPEPIVEWVLCDSQGESCKEESPAVVKKEEKVLHELFGTD
IRCCARNELGRECTRLFTIDLNQTPQTTLPQLFLKVGEPLWIRCKAVHVNHGFGLTWELENKALEEGNYF
EMSTYSTNRTMIRILFAFVSSVARNDTGYYTCSSSKHPSQSALVTIVEKGFINATNSSEDYEIDQYEEFC
FSVRFKAYPQIRCTWTFSRKSFPCEQKGLDNGYSISKFCNHKHQPGEYIFHAENDDAQFTKMFTLNIRTK
HHHHHH
Sequence of Flt3D2-D4 with C-terminal His-tag. N-glycosylation sites (predicted with NetNGlyc) are marked in yellow.
Multiple sequence alignment of hFlt3D5 (human Flt3D5) with mFlt3D5 (mouse Flt3D5) and domain 5 of homologous receptors KIT and FMS (CSF-1R). Adopted from Verstraete et al, 2011.

72
Protein parameters of Flt3D2-D4 obtained via ProtParam
Number of amino acids 286
Molecular weight 33195.4 Da
Theoretical pI 6.25
Extinction coefficient at 280 nm 39140 M-1 cm-1
Absorbance (0.1%) at 280 nm 1.156
Schematic overview of Flt3D2-D4. N-glycosylation sites are indicated with blue diamonds. Disulfide bridges are indicated as dashed black lines bridging two cysteine residues. Adapted from Verstraete et al, 2011.