STRUCTURAL STABILITY EVALUATION STUDY ......STRUCTURAL STABILITY EVALUATION STUDY APPLYING A WIND...
10
STRUCTURAL STABILITY EVALUATION STUDY APPLYING A WIND TUNNEL TEST AND MONITORING OF BAYON MAIN TOWER, ANGKOR THOM, CAMBODIA SHUNSUKE YAMADA 1 , MASATO ARAYA 2 , AKIHITO YOSHIDA 3 & TAKESHI OHISHI 4 1 Yasuda Women’s University, Japan 2 Waseda University, Japan 3 Tokyo Polytechnic University, Japan 4 Tokyo University, Japan ABSTRACT The Bayon Temple of Angkor Thom in Cambodia was built in the 12th century. It is composed of many masonry towers, and they were constructed by dry masonry. The main tower of it is about 40 meters high from the ground. The shape of the upper area of the main tower is now complicated because of its partial collapse in the past. It also risks further collapse due to strong winds. To assess the influence of the wind pressure on the monument with the complicated shape, we conducted a wind tunnel test using 3D laser scanning data and a 3D printer. Then, using the wind tunnel test, the wind pressure caused by the complicated shape’s surface of the tower was estimated. In addition, we verified the simple calculation method of the horizontal capacity load of dry masonry using a laboratory horizontal loading test. Based on the wind tunnel test and the laboratory loading test of dry masonry, we assess the structural stability of the Bayon main tower. Keywords: dry masonry, wind tunnel test, Angkor monument. 1 INTRODUCTION Some historical monuments in the world face the risk of collapse caused by strong winds. The Angkor monument in Cambodia is one of them, and immediate counter-measures to prevent any further collapse of the tower are required. The Bayon Temple of Angkor Thom was built in the 12th century [1]. It is composed of many masonry towers, and they were constructed by dry masonry without any bonding. The main tower of it measures about 40 meters high from the ground. The shape of the central tower is now complicated asymmetry because of the partial collapse of the stones in the past, and there is a risk of further collapse due to strong winds. The historical view of the tower displayed in Fig. 1 shows the partial collapse of the top area. For the countermeasures to stabilize the tower to the strong winds, it is important to evaluate the effect of the wind force accurately. But, in general, it is difficult to conduct a wind tunnel test of huge, complicated historical monuments such as the Bayon Temple. This is mainly because of the difficulty in manufacturing a wind tunnel model of complicated monuments. In the case of the Bayon Temple, 3D laser scanning data has been obtained by the Ikeuchi and Oishi Laboratory of the University of Tokyo, in order to preserve data as digital archives and utilize for the restoration works [2]. So, in our study, we proposed the method to manufacture the wind tunnel model using 3D scanning data and a 3D printer [3]. The proposed method can be a general method of use for large, complicated historical monuments. Next, we discuss the verification of the simple calculation method of horizontal capacity load of dry masonry compared. Based on the verification, we assess the structural stability of the Bayon main tower against strong winds. www.witpress.com, ISSN 1746-4498 (on-line) WIT Transactions on The Built Environment, Vol 171, © 2017 WIT Press doi:10.2495/STR170251 Structural Studies, Repairs and Maintenance of Heritage Architecture XV 287
Transcript of STRUCTURAL STABILITY EVALUATION STUDY ......STRUCTURAL STABILITY EVALUATION STUDY APPLYING A WIND...

STRUCTURAL STABILITY EVALUATION STUDY APPLYING A WIND TUNNEL TEST AND MONITORING
OF BAYON MAIN TOWER, ANGKOR THOM, CAMBODIA SHUNSUKE YAMADA1, MASATO ARAYA2, AKIHITO YOSHIDA3 & TAKESHI OHISHI4
1Yasuda Women’s University, Japan 2Waseda University, Japan
3Tokyo Polytechnic University, Japan 4Tokyo University, Japan
ABSTRACT The Bayon Temple of Angkor Thom in Cambodia was built in the 12th century. It is composed of many masonry towers, and they were constructed by dry masonry. The main tower of it is about 40 meters high from the ground. The shape of the upper area of the main tower is now complicated because of its partial collapse in the past. It also risks further collapse due to strong winds. To assess the influence of the wind pressure on the monument with the complicated shape, we conducted a wind tunnel test using 3D laser scanning data and a 3D printer. Then, using the wind tunnel test, the wind pressure caused by the complicated shape’s surface of the tower was estimated. In addition, we verified the simple calculation method of the horizontal capacity load of dry masonry using a laboratory horizontal loading test. Based on the wind tunnel test and the laboratory loading test of dry masonry, we assess the structural stability of the Bayon main tower. Keywords: dry masonry, wind tunnel test, Angkor monument.
1 INTRODUCTION Some historical monuments in the world face the risk of collapse caused by strong winds. The Angkor monument in Cambodia is one of them, and immediate counter-measures to prevent any further collapse of the tower are required. The Bayon Temple of Angkor Thom was built in the 12th century [1]. It is composed of many masonry towers, and they were constructed by dry masonry without any bonding. The main tower of it measures about 40 meters high from the ground. The shape of the central tower is now complicated asymmetry because of the partial collapse of the stones in the past, and there is a risk of further collapse due to strong winds. The historical view of the tower displayed in Fig. 1 shows the partial collapse of the top area. For the countermeasures to stabilize the tower to the strong winds, it is important to evaluate the effect of the wind force accurately. But, in general, it is difficult to conduct a wind tunnel test of huge, complicated historical monuments such as the Bayon Temple. This is mainly because of the difficulty in manufacturing a wind tunnel model of complicated monuments. In the case of the Bayon Temple, 3D laser scanning data has been obtained by the Ikeuchi and Oishi Laboratory of the University of Tokyo, in order to preserve data as digital archives and utilize for the restoration works [2]. So, in our study, we proposed the method to manufacture the wind tunnel model using 3D scanning data and a 3D printer [3]. The proposed method can be a general method of use for large, complicated historical monuments. Next, we discuss the verification of the simple calculation method of horizontal capacity load of dry masonry compared. Based on the verification, we assess the structural stability of the Bayon main tower against strong winds.
www.witpress.com, ISSN 1746-4498 (on-line) WIT Transactions on The Built Environment, Vol 171,© 2017 WIT Press
doi:10.2495/STR170251
Structural Studies, Repairs and Maintenance of Heritage Architecture XV 287

(a) (b)
Figure 1: (a) View of the Bayon main tower in the 1930s before restoration by EFEO; (b) present state of the Bayon main tower.
2 NEW METHOD OF MANUFACTURING THE WIND TUNNEL MODEL
2.1 Process of manufacturing the model
This section discusses the outline of the process of manufacturing the wind tunnel model. In manufacturing the model using a 3D printer and 3D scanning data, a new algorithm and method was needed. This was because 3D scanning data is composed of triangular plane element data without the thickness. So, we proposed the process of manufacturing the model as follows: 1. using the algorithm (see section 2.2), the modelling data with proper thickness as the wind tunnel model is set; 2. the holes for the wind pressure sensors in the modelling data are added; 3. the model is output by the 3D printer; 4. pipes and vinyl tubes for the wind pressure sensors are attached to the model by hand.
2.2 Algorithm for the model data with uniform thickness
To set the copper pipes connected with wind pressure sensors in the model, thickness of the model data should have the uniform thickness which is equal to the length of the pipes. An algorithm for the uniform thickness was proposed and applied. As shown in Fig. 2, first, 3D scanning data is cut in plane at each height, and a closed curve is obtained by the algorithm. Next, we calculate the inner nodes which provide the reference point for uniform thickness. Thus, it is necessary that the above closed curve is moved to inward. The distance of the moving is the same as the thickness. After repeating the above process in all two adjacent lines, the outer line and inner line are obtained. And, by filling the area surrounded by the outer line and inner line, the closed section with the uniform thickness is obtained. Finally, the above algorithm is computationally repeated and built up in each height, and a 3D model data with uniform thickness (as shown in Fig. 3) is obtained.
www.witpress.com, ISSN 1746-4498 (on-line) WIT Transactions on The Built Environment, Vol 171,© 2017 WIT Press
288 Structural Studies, Repairs and Maintenance of Heritage Architecture XV
Scanning data Cut image at a certain height Piled data Model data for output
Figure 2: Outline of algorithm for the model data with uniform thickness.
2.3 Output of wind tunnel model with sensor holes by 3D printer
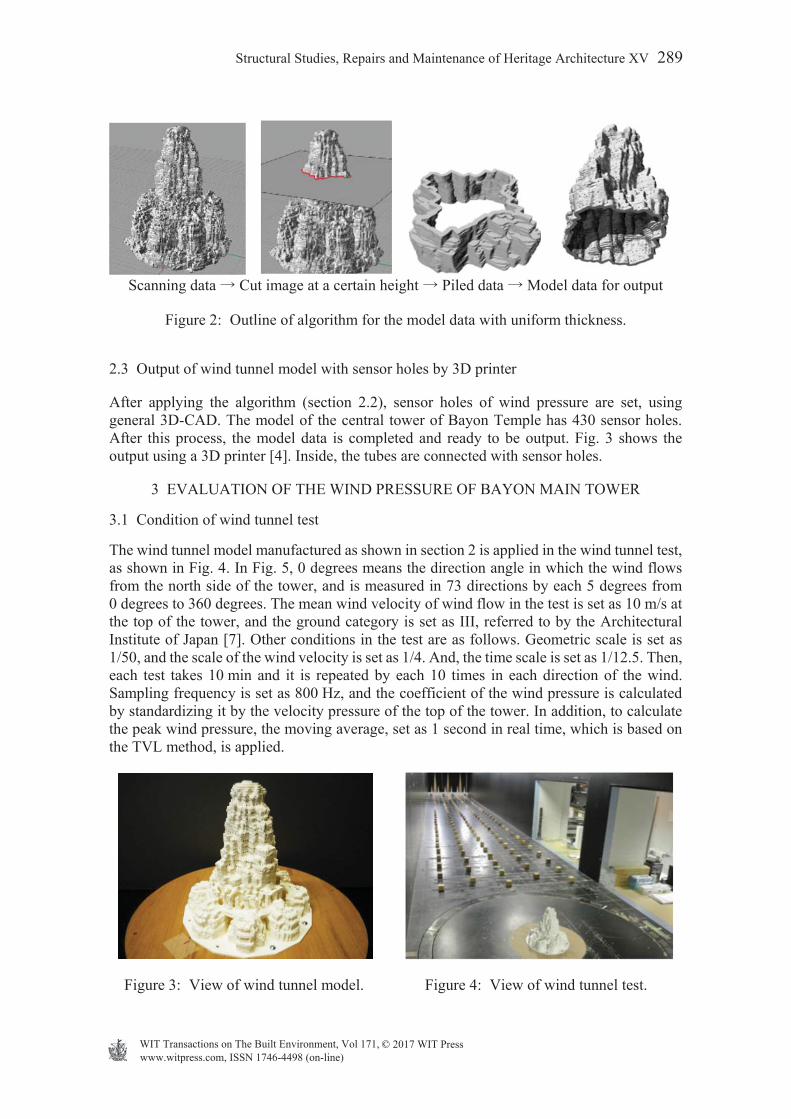
After applying the algorithm (section 2.2), sensor holes of wind pressure are set, using general 3D-CAD. The model of the central tower of Bayon Temple has 430 sensor holes. After this process, the model data is completed and ready to be output. Fig. 3 shows the output using a 3D printer [4]. Inside, the tubes are connected with sensor holes.
3 EVALUATION OF THE WIND PRESSURE OF BAYON MAIN TOWER
3.1 Condition of wind tunnel test
The wind tunnel model manufactured as shown in section 2 is applied in the wind tunnel test, as shown in Fig. 4. In Fig. 5, 0 degrees means the direction angle in which the wind flows from the north side of the tower, and is measured in 73 directions by each 5 degrees from 0 degrees to 360 degrees. The mean wind velocity of wind flow in the test is set as 10 m/s at the top of the tower, and the ground category is set as III, referred to by the Architectural Institute of Japan [7]. Other conditions in the test are as follows. Geometric scale is set as 1/50, and the scale of the wind velocity is set as 1/4. And, the time scale is set as 1/12.5. Then, each test takes 10 min and it is repeated by each 10 times in each direction of the wind. Sampling frequency is set as 800 Hz, and the coefficient of the wind pressure is calculated by standardizing it by the velocity pressure of the top of the tower. In addition, to calculate the peak wind pressure, the moving average, set as 1 second in real time, which is based on the TVL method, is applied.
Figure 3: View of wind tunnel model. Figure 4: View of wind tunnel test.
www.witpress.com, ISSN 1746-4498 (on-line) WIT Transactions on The Built Environment, Vol 171,© 2017 WIT Press
Structural Studies, Repairs and Maintenance of Heritage Architecture XV 289
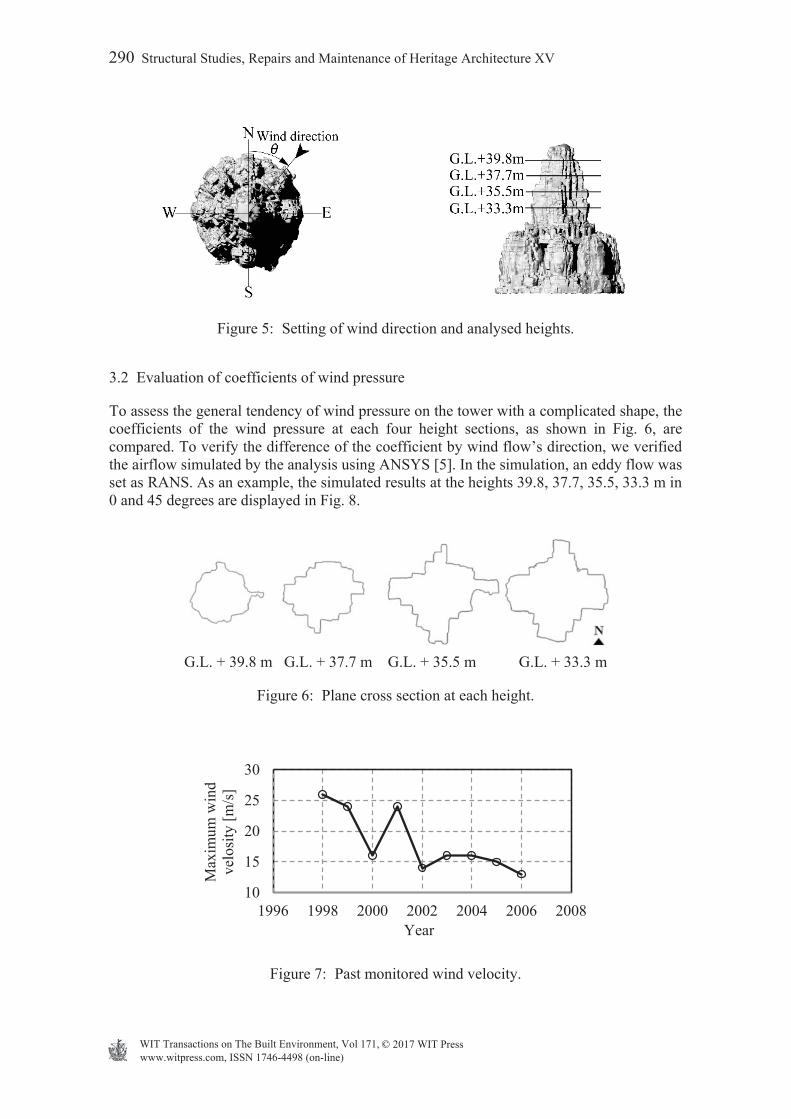
Figure 5: Setting of wind direction and analysed heights.
3.2 Evaluation of coefficients of wind pressure
To assess the general tendency of wind pressure on the tower with a complicated shape, the coefficients of the wind pressure at each four height sections, as shown in Fig. 6, are compared. To verify the difference of the coefficient by wind flow’s direction, we verified the airflow simulated by the analysis using ANSYS [5]. In the simulation, an eddy flow was set as RANS. As an example, the simulated results at the heights 39.8, 37.7, 35.5, 33.3 m in 0 and 45 degrees are displayed in Fig. 8.
G.L. + 39.8 m G.L. + 37.7 m G.L. + 35.5 m G.L. + 33.3 m
Figure 6: Plane cross section at each height.
Figure 7: Past monitored wind velocity.
10
15
20
25
30
1996 1998 2000 2002 2004 2006 2008
Max
imum
win
d ve
losi
ty [m
/s]
Year
www.witpress.com, ISSN 1746-4498 (on-line) WIT Transactions on The Built Environment, Vol 171,© 2017 WIT Press
290 Structural Studies, Repairs and Maintenance of Heritage Architecture XV

Figure 8: Analysed wind flow of each height (wind direction is 0 degrees and 45 degrees).
In Figs 10 and 11, the peak coefficient of wind pressure in each wind direction is compared. In the case where wind flows from the North (= 0 degrees), the minimum of the mean coefficient of the wind pressure is –0.46 at the West side. In this case, it is assumed that this negative pressure was caused by the current departed from the surface at the corner. However, at the backside of where the current occurs, the wind flows parallel to the surface. So, the absolute value of the negative pressure was relatively small. Whereas, in the case where the wind flows from the Northeast (= 45 degrees), the minimum of the mean coefficient of the wind pressure is –0.78 at the North side. It is assumed that the separated flow was caused by the salient masonry. Next, the positive and negative pressures recorded at each height are compared with the case that assumes the shape of the plan is circle or rectangle, based on Okuma et al. [9]. In this comparison, the wind speed is set as 40 m/s at the top of the tower based on the monitored data near Bayon Temple in the past, as shown in Fig. 7. As Fig. 9 shows, the positive wind pressure recorded by the test is almost the same as that of the assumed circle or rectangle. Whereas, the negative wind pressure recorded by the test is about 30% smaller than that of the assumed circle or rectangle. It is assumed that the rough shape of the tower decreases the wind pressure.
Figure 9: Comparison of wind pressure of the circular plan, the rectangular plan and test results.
www.witpress.com, ISSN 1746-4498 (on-line) WIT Transactions on The Built Environment, Vol 171,© 2017 WIT Press
Structural Studies, Repairs and Maintenance of Heritage Architecture XV 291

Figure 10: Peak coefficient of positive wind pressure (kN/m2) (vertical axis) vs wind direction (degree) (horizontal axis).
Figure 11: Peak coefficient of negative wind pressure (kN/m2) (vertical axis) vs wind direction (degree) (horizontal axis).
4 EVALUATION OF HORIZONTAL CAPACITY LOAD OF DRY MASONRY Using a laboratory horizontal loading test of dry masonry (see Fig. 12), we verify the simple calculation formula of horizontal capacity load of dry masonry. There are two modes of collapse: rotation and slide mode. The equilibrium of rotation force is written as formula (1) and the equilibrium of sliding force is written as formula (2). Regards the capacity load of the masonry, the minimum load of rotation force and sliding force in each stone is set as the capacity load. In this test, each edge of the stone cube is 200 mm in length; note, we consider the case of the existence of cracks in stones. So, as shown in Fig. 12, the stone of no. 0 is cut in three ways, as 0-, 15- and 25-degree angles. Regards the loading, we strained in each height of stone and we determined the load-displacement curve. In Fig. 13, we show the typical rotation collapse mode and sliding collapse mode. And, in Fig. 15 we compare the calculation formula’s result and test result. Also, we conducted a parametric study of the stone’s density and the coefficient of static friction. From the above verification, capacity load in rotation collapse mode is almost correct, but in sliding collapse mode it is not correct as per the test results. Concerning the above effect, we need further verification.
www.witpress.com, ISSN 1746-4498 (on-line) WIT Transactions on The Built Environment, Vol 171,© 2017 WIT Press
292 Structural Studies, Repairs and Maintenance of Heritage Architecture XV
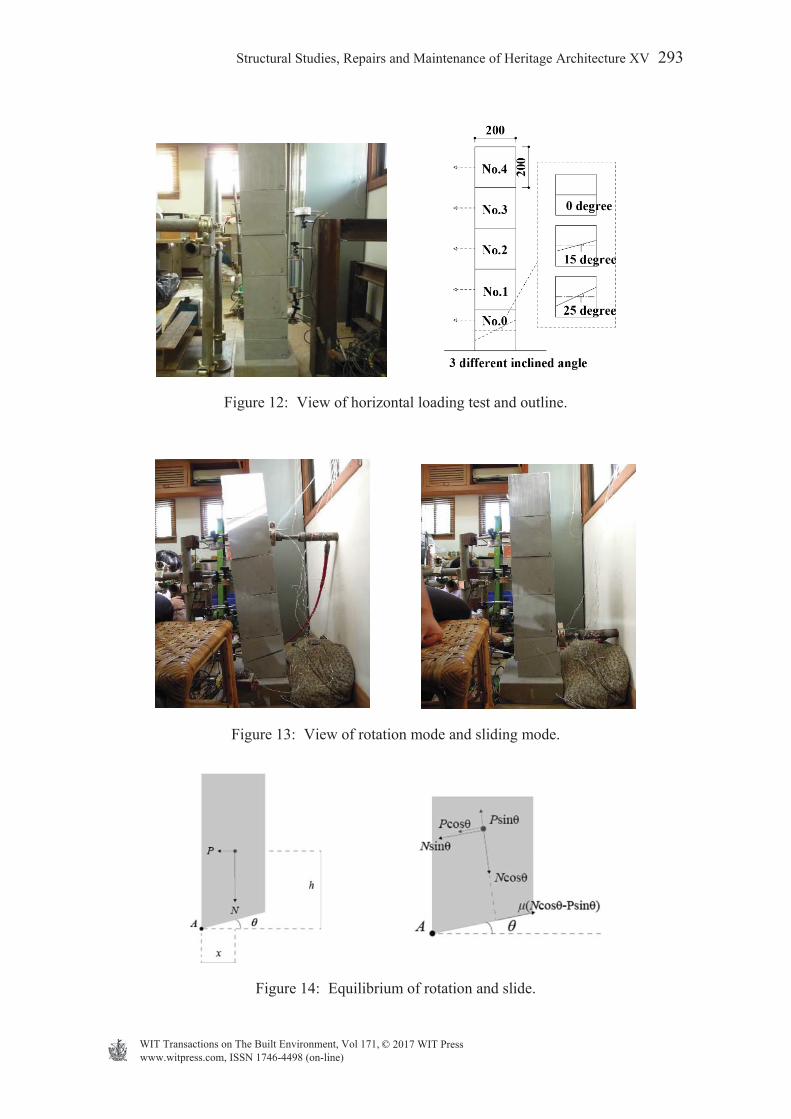
Figure 12: View of horizontal loading test and outline.
Figure 13: View of rotation mode and sliding mode.
Figure 14: Equilibrium of rotation and slide.
www.witpress.com, ISSN 1746-4498 (on-line) WIT Transactions on The Built Environment, Vol 171,© 2017 WIT Press
Structural Studies, Repairs and Maintenance of Heritage Architecture XV 293

Rotation: . (1)
Sliding . (2) P: Horizontal load (capacity load) (N); N: weight of stone masonry (N); x: horizontal distance between centroid and centre of rotation (m); h: vertical distance between centroid and centre of rotation (m); : coefficient of static friction; : inclined angle (rad).
5 EVALUATION OF STRUCTURAL STABILITY OF BAYON MAIN TOWER Based on the results of the wind tunnel test and laboratory loading test of dry masonry, we assess the structural stability of the top area of the Bayon main tower. The shape figure of masonry is calculated using data from the 3D scanning and fine pictures. In the calculation of capacity load, formulas (1) and (2) are applied. In section 4, the sliding capacity load does not correlate well with the test result. But, in case of the top area of the Bayon main tower, the rotation collapse mode is a dominant factor. So, the above calculation formula can be applied. The wind pressure is determined using formula (3). In this formula, the coefficient of negative wind pressure ‘C’ is uniformly set as 3. Using the result of the wind tunnel test, the maximum coefficient of wind pressure ‘C’ is assessed as about 2. So, in this assessment, the safety factor is included as about 1.5.
. (3)
P: Wind pressure (kN/m2); : air density (= 1.22) (kgf/m3); V: wind velocity (m/sec); C: coefficient of wind pressure (= 3).
Figure 15: Horizontal capacity load and height of loading compared in different parameters ; d: density).
2
21 VCP
hNxP1
cossin)sincos(
2NP
www.witpress.com, ISSN 1746-4498 (on-line) WIT Transactions on The Built Environment, Vol 171,© 2017 WIT Press
294 Structural Studies, Repairs and Maintenance of Heritage Architecture XV

As noted in section 3, the design wind speed is set as 40 m/sec. The wind pressure of that wind speed is set as 40 m/sec and is calculated as 2.9 kN/m2 using formula (3). In response to the above wind pressure, we assessed the safety level of the masonry. In the assessment, the friction force between the vertical faces of masonry and the concrete bonding and iron clamp’s effect by EFEO are not considered (see Fig. 17). And, from the figure of masonry, complicated interlocking and fine 3D shape are not considered. Under the above calculated assumption, the result of the assessment of structural stability is shown in Fig. 16. The result is as follows. The capacity load of black-coloured masonry is less than that of wind speed is 40 m/sec and the area should be reinforced. And, grey-coloured masonry is higher than that of wind speed is 40 m/sec. For white-coloured masonry, it is decided that the calculation is not necessary because it is well adjoined with masonry and has enough stability. In the reinforcement construction, the detailed assessment considering the stone’s condition and masonry method at the site after setting the scaffold should be necessary.
Figure 16: Analysed results of local wind velocity capacity of Bayon main tower.
www.witpress.com, ISSN 1746-4498 (on-line) WIT Transactions on The Built Environment, Vol 171,© 2017 WIT Press
Structural Studies, Repairs and Maintenance of Heritage Architecture XV 295

Figure 17: View of top area and past reinforcement.
6 CONCLUSION Applying the method to manufacture a wind tunnel model using a 3D printer, the wind tunnel test of the Bayon main tower was conducted. Looking at the test results, the wind pressure on the Bayon main tower was assessed. The positive wind pressure by the test is almost the same as with that of the assumed circle or rectangle. Whereas, the negative wind pressure by the test is about 30% smaller than that of the assumed circle or rectangle. It is assumed that the rough shape of the tower decreases the wind pressure. Next, the simple calculation method of horizontal capacity load of dry masonry was verified by the laboratory horizontal loading test. Based on the verification, the structural stability of the Bayon main tower when subjected to strong winds was assessed.
ACKNOWLEDGEMENT A part of this research was supported by KAKENHI (grant numbers 25303022 and 16H05636.).
REFERENCES [1] Nakagawa, T. (Supervisor) et al., The Master Plan for the Conservation and Restoration
of the Bayon Complex, JASA, 2005. [2] Bayon Archive Project, Ikeuchi and Oishi Lab., Tokyo University, http://www.cvl.iis.u
-tokyo.ac.jp/research/bayon/ [3] Honda, Y., Yamada, S., Yoshida, A., Ohishi, T., Araya, M. & Tamura, Y., New
manufacturing method of wind pressure model for complicated-shape architectural heritage applying 3D scanning data and 3D printer. Journal of Wind Engineering, 41(1), pp. 24–27, Japan Association for Wind Engineering, 2016.
[4] Fortus 400 mc-L, Stratasys, http://www.stratasys.com/3d-printers/production-series/fortus-360-400mc
[5] ANSYS Japan, https://ansys.jp/ [6] Wind tunnel, Tokyo Polytechnic University, http://www.wind.arch.t-kougei.ac.jp/syste
m/contents/code/facility_01 [7] Architectural Institute of Japan, Recommendations for Loads on Buildings, 2004. [8] Building Center of Japan, Guide Book for Wind Tunnel Test, 2008. [9] Okuma, T. et al., Wind Resistant Design, Kajima Publishing, 1996.
www.witpress.com, ISSN 1746-4498 (on-line) WIT Transactions on The Built Environment, Vol 171,© 2017 WIT Press
296 Structural Studies, Repairs and Maintenance of Heritage Architecture XV