Structural mechanism and kinetics of in vitro gastric ... · 101 treatment resulted in the...
43
Accepted Manuscript Structural mechanism and kinetics of in vitro gastric digestion are affected by process-induced changes in bovine milk Ana-Isabel Mulet-Cabero, Alan R. Mackie, Peter J. Wilde, Mark Fenelon, André Brodkorb PII: S0268-005X(17)31213-4 DOI: 10.1016/j.foodhyd.2018.03.035 Reference: FOOHYD 4346 To appear in: Food Hydrocolloids Received Date: 14 July 2017 Revised Date: 20 March 2018 Accepted Date: 20 March 2018 Please cite this article as: Mulet-Cabero, A.-I., Mackie, A.R., Wilde, P.J., Fenelon, M., Brodkorb, André., Structural mechanism and kinetics of in vitro gastric digestion are affected by process-induced changes in bovine milk, Food Hydrocolloids (2018), doi: 10.1016/j.foodhyd.2018.03.035. This is a PDF file of an unedited manuscript that has been accepted for publication. As a service to our customers we are providing this early version of the manuscript. The manuscript will undergo copyediting, typesetting, and review of the resulting proof before it is published in its final form. Please note that during the production process errors may be discovered which could affect the content, and all legal disclaimers that apply to the journal pertain.
Transcript of Structural mechanism and kinetics of in vitro gastric ... · 101 treatment resulted in the...

Accepted Manuscript
Structural mechanism and kinetics of in vitro gastric digestion are affected byprocess-induced changes in bovine milk
Ana-Isabel Mulet-Cabero, Alan R. Mackie, Peter J. Wilde, Mark Fenelon, AndréBrodkorb
PII: S0268-005X(17)31213-4
DOI: 10.1016/j.foodhyd.2018.03.035
Reference: FOOHYD 4346
To appear in: Food Hydrocolloids
Received Date: 14 July 2017
Revised Date: 20 March 2018
Accepted Date: 20 March 2018
Please cite this article as: Mulet-Cabero, A.-I., Mackie, A.R., Wilde, P.J., Fenelon, M., Brodkorb, André.,Structural mechanism and kinetics of in vitro gastric digestion are affected by process-induced changesin bovine milk, Food Hydrocolloids (2018), doi: 10.1016/j.foodhyd.2018.03.035.
This is a PDF file of an unedited manuscript that has been accepted for publication. As a service toour customers we are providing this early version of the manuscript. The manuscript will undergocopyediting, typesetting, and review of the resulting proof before it is published in its final form. Pleasenote that during the production process errors may be discovered which could affect the content, and alllegal disclaimers that apply to the journal pertain.
MANUSCRIP
T
ACCEPTED
ACCEPTED MANUSCRIPT

MANUSCRIP
T
ACCEPTED
ACCEPTED MANUSCRIPT
1
Title: Structural mechanism and kinetics of in vitro gastric digestion are affected by process-1
induced changes in bovine milk 2
3
Author names and affiliations: Ana-Isabel Mulet-Caberoa,b, Alan R. Mackiec , Peter J. Wildea 4
, Mark Fenelonb , André Brodkorbb* 5
a Quadram Institute Bioscience, Norwich Research Park, Norwich, Norfolk, NR4 7UA, UK 6
b Teagasc Food Research Centre, Moorepark, Fermoy, Co. Cork, Ireland 7
c School of Food Science and Nutrition, University of Leeds, LS2 9JT, UK 8
9
*Corresponding author: André Brodkorb 10
Tel.: +353-25-42-431 11
E-mail address: [email protected] 12
13
14
15
16
17
18
19
20
21

MANUSCRIP
T
ACCEPTED
ACCEPTED MANUSCRIPT
2
Abstract 22
Bovine milk is commonly exposed to industrial processing, which can alter the structure, 23
biochemical composition, physico-chemical properties and sensory quality. While many of 24
these changes have been studied extensively, little is known about their effect on digestive 25
behaviour. In this study, heat treatments of pasteurisation at 72 °C for 15 s or Ultra-High-26
Temperature (UHT) treatment at 140 °C for 3 s and homogenisation at pilot-plant scale were 27
applied to whole milk. The gastric behaviour was investigated using a recently developed 28
semi-dynamic adult in vitro model. The emptied digesta were analysed to assess the nutrient 29
delivery kinetics, changes in microstructure and protein digestion. 30
All samples showed protein aggregation and coagulum formation within the first 15 min of 31
gastric digestion at which time the pH ranged from 5.5 to 6. Homogenised samples creamed 32
regardless of heat treatment, whereas all non-homogenised samples exhibited sedimentation. 33
The consistency of the coagulum of the heated samples was more fragmented compared to 34
those of the non-heated samples. Rheological analysis showed that the higher the temperature 35
of the heat treatment, the softer the obtained coagulum and the higher the protein hydrolysis 36
at the end of digestion. The study also confirmed that gastric emptying of caseins from milk 37
is delayed due to coagulation in the stomach, while β-lactoglobulin was emptied throughout 38
the gastric phase, except for UHT-treated milk. The gastric behaviour also had an impact on 39
the lipid and protein content of the emptied chyme. The homogenised samples seemed to 40
release more nutrients at the end of gastric digestion. 41
42
Keywords 43
Milk; Homogenisation; Heat treatment; Gastric behaviour; Nutrient delivery; Protein 44
digestion 45

MANUSCRIP
T
ACCEPTED
ACCEPTED MANUSCRIPT
3
1. Introduction 46
Bovine milk is conventionally heat treated and homogenised to improve consumer 47
acceptance and ensure microbial stability, and the shelf life. These dairy processes cause 48
changes in the physical structure, which has been widely characterised. Homogenisation 49
results in size reduction of the native fat globule, initially surrounded by the milk fat globule 50
membrane (MFGM), from an average size of 3-5 µm to below 1 µm (Keenan et al., 1983; 51
Michalski & Januel, 2006). Moreover, homogenisation disrupts the MFGM drastically 52
changing the interface composition, which mainly consists of adsorbed milk protein, and 53
organisation of the droplet (Lopez, 2005; Sharma & Dalgleish, 1993). The most common heat 54
treatments applied to milk are pasteurisation that consists of heating to a minimum of 72 oC 55
for ≥ 15 s and ultra-high temperature (UHT) sterilization involving heating at 135-150 oC 56
during a few seconds. These heat processes cause the denaturation of whey protein, in 57
particular β-lactoglobulin (β-Lg) (Douglas et al., 1981), which can be bound to κ-casein on 58
the new formed droplet surface (Sharma & Dalgleish, 1993). 59
The structure of food at different length scales has been shown to impact nutrient digestion 60
and absorption. However, there has been little research performed on the impact of these 61
process-induced changes on milk digestion. In some cases conflicting results have been 62
obtained mainly due to the different digestion models applied. The gastric compartment is a 63
key site to regulate nutrient digestion and differences in intestinal absorption kinetics of dairy 64
products have been associated with changes in gastric emptying rates (Gaudichon et al., 65
1994). The first steps of hydrolysis and breakdown of food are in the gastric compartment 66
mainly due to the presence of pepsin and gastric lipase and acid. Digested products are 67
progressively emptied through the pylorus and released into the small intestine, which has 68
important implications for postprandial responses. 69

MANUSCRIP
T
ACCEPTED
ACCEPTED MANUSCRIPT
4
Studies of the in vivo digestion of processed milk are very rare. Lacroix et al. (2008) found, 70
in healthy humans, that UHT-treated milk consumption induced a significantly higher and 71
faster transfer of dietary nitrogen into serum amino acids and proteins but also to body urea 72
compared to pasteurised and microfiltrated milk. It was suggested that this modulation of the 73
digestive kinetics was due to the possible formation of a softer coagulum in the stomach and 74
a higher enzyme accessibility in the case of UHT-treated milk. These results have been 75
supported by Bach et al. (2017), who showed that urinary nitrogen secretion was greater for 76
UHT-milk compared to raw and pasteurised milk using young dairy calves as a model. In 77
addition, Miranda and Pelissier (1987) found that heat treated milk (UHT and autoclaving) 78
increased gastric emptying rate and casein hydrolysis in rats. This contrasts to other work 79
where a higher mean retention time in the stomach of heated skim milk (90 oC, 10 min) was 80
observed compared to a non-heated system observed in mini-pigs (Barbé et al., 2013). It is 81
broadly reported that heat treatment, using temperatures above 90 oC, facilitates protein 82
digestion, which has been observed for β-Lg (Wada & Lönnerdal, 2014). However, opposing 83
observations have been made for caseins. Heated skim milk (90 oC, 10 min) promoted 84
hydrolysis resistance of casein fraction compared to unheated skim milk during gastric 85
digestion using an in vitro adult dynamic model (Sánchez-Rivera et al., 2015) and in vitro 86
infant static model (Dupont et al., 2010), which could affect the kinetics of protein digestion 87
in a mini-pig model (Barbé et al., 2013). This was reportedly related to chemical 88
modifications of the protein during heating, i.e. lactosylation, glycosylation as well as casein-89
whey interactions, resulting in different peptides generated during digestion. In contrast, 90
using a static digestion model, Tunick et al. (2016) found a rapid digestion of caseins in the 91
gastric phase of both processed (heated at pasteurisation and UHT conditions and 92
homogenised) and non-processed samples. Moreover, homogenisation was observed to 93
increase β-Lg hydrolysis compared to pasteurised milk (Islam et al., 2017). Despite the 94

MANUSCRIP
T
ACCEPTED
ACCEPTED MANUSCRIPT
5
differences in enzymatic digestion of the major milk proteins, Wada and Lönnerdal (2014) 95
reported no significant differences in the overall in vitro digestion kinetics among the heat 96
treatments (pasteurisation, UHT and in-can sterilisation). A sophisticated in vitro model, the 97
Human Gastric Simulator (Kong & Singh, 2010), was used to investigate the effect of milk 98
treatment on the gastric behaviour (Ye et al., 2016). They showed the formation of coagula of 99
different structures led to different protein digestion behaviour. The homogenisation and heat 100
treatment resulted in the formation of a crumbly structure compared to the tight clot obtained 101
in raw milk. This was similar to what was proposed to occur in vivo and highlights the 102
limitations of the static in vitro digestion models. However, the heating conditions used, 90 103
oC for 20 min, are less representative of the typical conditions of industrial milk processing. 104
In addition, gastric conditions may induce different gastric colloidal behaviours, which could 105
affect postprandial responses by different nutrient delivery. Mackie et al. (2013) showed that 106
homogenised droplets stabilised by milk proteins caused creaming in the human stomach, as 107
monitored by MRI, and decreased fullness due to the delayed lipid emptying, in contrast to 108
the early delivery of nutrients from a mixture of cheese and yogurt, which sustained fullness. 109
In this study, the recently developed semi-dynamic gastric model was used, which replicates 110
some gastric behaviour seen in the human stomach (Mulet-Cabero et al., 2017). The model 111
can simulate the main dynamics of the stomach including gradual acidification, gastric fluid 112
and enzyme secretion and emptying. The most commonly used milk processes, 113
homogenisation and the heat treatments of pasteurisation and UHT, were used and compared 114
to raw milk in order to assess the influence in gastric behaviour, protein coagulation, nutrient 115
delivery and protein digestion. 116
117
2. Materials and methods 118

MANUSCRIP
T
ACCEPTED
ACCEPTED MANUSCRIPT
6
2.1. Materials 119
Fresh whole bovine milk was collected from a bulk tank of the Moorepark Dairy Unit, 120
Teagasc Animal and Grassland Research and Innovation Center, Moorepark, Fermoy, Co. 121
Cork, Ireland. The milk was from Friesian cows that were fed a total mixed ration diet 122
consisted of grass silage, maize silage and concentrates. Bulk milk samples were collected 123
post-morning milking. The sampling was conducted between November 2016 and February 124
2017. 125
The raw milk was collected on different days for each process performed. The processes were 126
conducted at pilot-plant scale using industrially relevant conditions. Homogenisation was 127
applied at 40 oC using a 2-stage valve-type homogeniser (Gaulin Labor Homogenizer, type 128
Lab 60; APV Gaulin GmbH, Lubeck, Germany). The pressures used were 15 and 5 MPa for 129
first and second stage, respectively. The sample is referred as Homo in the text. 130
Pasteurisation and ultra-high temperature (UHT) treatments were carried out using a 131
MicroThermics tubular heat exchanger (MicroThermics, NC, USA). The conditions were a 132
final heat temperature at 72 oC with a holding time of 15 s for pasteurisation and 140 oC with 133
a holding time of 3 s for UHT treatment (pre-heating temperature of 91 oC). The samples are 134
referred as Past and UHT respectively in the text. These heat treatments were also carried out 135
with a subsequently homogenisation using an in-line-two stage valve homogeniser, Model 136
NS 2006IT (Niro Soavi, Parma, Italy) employing first-stage pressure of 15 MPa and a 137
second-stage pressure of 5 MPa. The samples are referred as Past+Homo and UHT+Homo 138
respectively in the text. The samples were stored at 4 oC after preparation. The Raw, Homo, 139
Past and UHT were studied within 1 day and Past/UHT+Homo were used within 2 days. 140
Milk fat, protein, lactose and total solids values were obtained using a Milkoscan FT 6000 141
(FOSS, Denmark) with a tolerance of ± 0.06 %. The nutrient composition of milk was 142

MANUSCRIP
T
ACCEPTED
ACCEPTED MANUSCRIPT
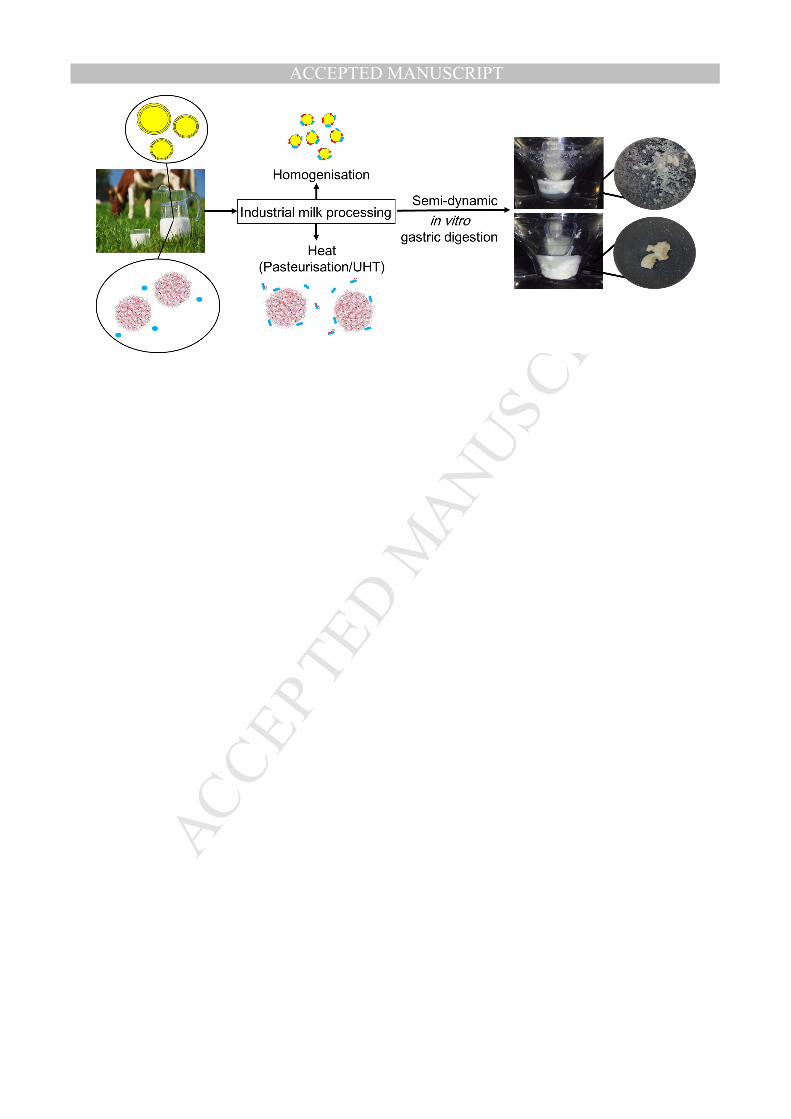
7
measured before each sample (see Table S.1 Supplementary Material) and the caloric content 143
was calculated using the Atwater factors. This ranged from 0.78 to 0.68 kcal/mL. 144
Pepsin from porcine gastric mucosa (Sigma Chemical Co., USA) had an enzymatic activity 145
of 3,875 units/mg protein, calculated by measuring the TCA-soluble products using 146
haemoglobin as substrate as described by Minekus et al. (2014). All other chemicals were 147
purchased from Sigma-Aldrich unless specified otherwise. 148
149
2.2. Methods 150
2.2.1. Semi-dynamic gastric digestion model 151
After collection of the raw milk and the respective milk processes, the samples went through 152
a simulated digestion. This was performed using two independent samples on different days. 153
Therefore, the simulated digestion experiments were conducted independently, and 154
subsequent analyses were performed from these independent samples. 155
The simulation of the oral and gastric phase was done using a semi-dynamic adult digestion 156
model previously described in Mulet-Cabero et al. (2017) with some modifications. An 157
example of the parameters used is shown in Table S.2 Supplementary Material. 158
The oral phase was applied before the gastric digestion, in which 20 g of milk sample was 159
mixed with oral mixture using a rotator (SB3 Model, Stuart, Bibby Scientific, UK) at 30 rpm 160
for 2 min. The total oral mixture consists of Simulated Salivary Fluid (SSF), prepared 161
accordingly to Minekus et al. (2014). The volume of the added SSF corresponded to the total 162
solid content of the milk sample, which was measured for each individual milk. For example, 163
a SSF volume of 2.8 mL is required for the digestion of a 20 mL (containing 2.8 g total 164
solids). The SSF addition varied slightly between samples, ranging from 2.52 to 2.82 mL due 165

MANUSCRIP
T
ACCEPTED
ACCEPTED MANUSCRIPT
8
to the difference of the total solid concentration in the analysed milk samples during the 166
period of study. The resulting mixture was then put through the gastric digestion. 167
The sample was placed into a 70 mL glass v-form vessel thermoregulated at 37 °C after the 168
addition of 10 % of the total volume of gastric mixture, simulating the residue in the stomach 169
during the fasted state. The gastric mixture contained 80 % simulated gastric fluid (SGF, 170
prepared according the protocol described in Minekus et al. (2014) at pH 7), 7.7 % Milli-Q® 171
water, 8.8 % 1.5 M HCl and 0.05 % 0.3 M CaCl2(H2O)2. Two solutions were added at a 172
constant rate: (1) the remaining gastric mixture was added using a pH-stat dosing device (800 173
Dosino, Metrohm, Switzerland) and (2) 0.8 mL pepsin solution (made with Milli-Q® water) 174
was added using a syringe pump (New Era Pump Systems, Inc., NY, USA). A 3D action 175
shaker (Mini-gyro rocker, SSM3 Model, Stuart, Barloworld Scientific limited, UK) at 35 rpm 176
was used for agitation. 177
After 25 min of gastric digestion, the sample was mixed using a 50 mL plastic syringe (BD 178
Plastipak, Ireland), the aperture of which had an inner diameter of 6.80 mm with a plastic 179
tube attached (6 mm inner diameter). This mixing was required to make the sampling more 180
accurate. Nevertheless, the colloidal behaviour during digestion seemed not to be impaired by 181
the initial mixing. Gastric emptying (GE) was simulated by taking 5 samples, referred to as 182
GE points in the text. The average time of those were 36 min (GE1), 72 min (GE2), 109 min 183
(GE3), 145 min (GE4) and 182 min (GE5). Samples were taken from the bottom of the vessel 184
using a serological pipette with a tip internal diameter of 2 mm because it approximates the 185
upper limit of particle size that has been seen to pass through the pyloric opening into the 186
duodenum (Thomas, 2006). It is important to note that there was some residue left in the last 187
GE point that could not be taken using a pipette; this was taken using a spatula and included 188
in the last point. An aliquot of these GE samples was used for microscopic and particle size 189
analysis. Otherwise, the sample was mixed using a homogeniser (T10 basic Ultra-Turrax®, 190
MANUSCRIP
T
ACCEPTED
ACCEPTED MANUSCRIPT
9
IKA®, Germany) at approximately 30,000 rpm for 30 s to obtain a homogenous sample for 191
the remaining analysis. The pH of each GE samples was measured using a pH meter and a 192
sufficient volume of 2 M NaOH was added to the samples to increase the pH above 7, 193
inhibiting pepsin activity. Finally, samples were snap-frozen in liquid nitrogen and stored at -194
80 °C until subsequent treatment. 195
The simulation of the emptying was based on caloric density. A linear GE rate of 2 196
kcal/min/500 mL, which is considered the average caloric content that is emptied in vivo in a 197
regulated manner by the antrum for an average food volume of 500 mL (Hunt & Stubbs, 198
1975) was used and scaled it down for this reduced-volume system. This implied that the 199
volume and time of each emptying point (Table S.3 Supplementary Material) differed due to 200
the slight variations in the caloric content of the milk samples during the period of the study. 201
202
2.2.2. Confocal Laser Scanning Microscopy (CLSM) 203
The microstructure of the initial and digested samples was observed using a Leica TCS SP5 204
microscope (Leica Microsystems, Baden-Württemberg, Germany). All the images were taken 205
using a 63 x oil-immersion objective and simultaneous dual-channel imaging, He–Ne laser 206
(excitation wavelength at 633 nm) and an Argon laser (excitation wavelength at 488 nm). A 207
mixture of two dyes was used, which consisted of 1:1 0.1 % Fast green FCF solution (in 208
water) to detect protein and 0.1 % Nile red solution (in propanediol) to detect the lipid phase. 209
500 µl of initial/digested sample was gently mixed with 50 µl of mixed dye. 210
211
2.2.3. Particle size distribution 212

MANUSCRIP
T
ACCEPTED
ACCEPTED MANUSCRIPT
10
The particle size distribution and average lipid droplet size of initial and digested samples 213
were determined using a laser-light diffraction unit (Mastersizer, Malvern Instruments Ltd, 214
Worcestershire, UK) equipped with a 300 RF lens. The optical parameters chosen were a 215
particle and dispersant (water) refractive index of 1.456 and 1.330, respectively. The 216
absorbance value of the fat globules was 0.001. A volume of initial and digested samples was 217
added in order to reach a laser obscuration range of 5-10 %. A volume of the initial and GE5 218
samples (0.2 mL) was dispersed in 10 mL of 0.02 M sodium dodecyl sulphate (SDS) to 219
dissociate clusters of proteins (as described in van Aken et al. (2011)). The size distribution 220
was obtained using polydisperse analysis, while droplet size measurements were recorded as 221
surface area weighted (d3,2) and volume weighted (d4,3) means, where d3,2 is defined as ∑nidi3/ 222
nidi2 and d4,3 is defined as ∑nidi
4/ nidi3 , where ni is the number of particles with diameter di. 223
Each measurement was carried out in triplicate. 224
225
2.2.4. Protein content analysis 226
The protein content of the initial milk and emptied digesta was determined by the Dumas 227
method using a LECO FP628 Protein analyser (LECO Corp., St. Joseph, MI, USA). A 228
conversion factor of 6.38 was used to obtain the protein content from the nitrogen content. 229
The protein content was reported as a percentage of g protein per g meal. Each measurement 230
was carried out in duplicate. 231
232
2.2.5. Lipid content analysis 233
The lipid content of the initial milk and emptied digesta was measured using a CEM Smart 234
Trac System-5 and a CEM Smart Trac Rapid Fat Analyzer (CEM Corp., Matthews, N.C., 235
U.S.A.). Approximately 2 g of sample (previously warmed up to 40 oC to disperse the lipid) 236
MANUSCRIP
T
ACCEPTED
ACCEPTED MANUSCRIPT
11
was placed on a glass fiber sample pad and dried in the Smart Trac System by microwave 237
drying. Immediately after drying, samples were placed in the Smart Trac Rapid Fat Analyzer 238
to determine total lipid content by nuclear magnetic resonance. The lipid content was 239
reported as a percentage of g lipid per g meal. Each measurement was carried out in 240
duplicate. 241
242
2.2.6. Protein analysis 243
2.2.6.1. Quantification of protein hydrolysis 244
The samples were treated before protein hydrolysis analysis. This involved the addition of 245
trichloroacetic acid (3.12 % final concentration) to digested sample to cause the precipitation 246
of insoluble protein that could interfere in the further analysis. Then, the samples were 247
centrifuge at 10,000 g for 30 min at room temperature and the supernatant was filtered using 248
a syringe filter of PVDF 0.22 µm membrane (Millex-GV, Millipore, Cork, Ireland) 249
The levels of free NH2 groups were determined using the standardised o-phthaldialdehyde 250
(OPA) spectrophotometric assay in micro-titre plates. OPA reagent consisted of 3.81 g 251
sodium tetraborate dissolved in approximately 80 mL water. Once dissolved, 0.088 g 252
dithiothreitol and 0.1 g sodium dodecyl sulphate were added. Then, 0.080 g OPA dissolved in 253
2-4 mL ethanol was placed in the solution that was finally made up to 100 mL with Milli-Q® 254
water. 255
Different concentrations of standard L-leucine solution (made with phosphate buffer solution) 256
ranged from 0 to 10 mM were used to obtain a calibration curve. 10 µl of standard/sample 257
was placed into each well and mixed with 200 µl of OPA reagent. The reaction was allowed 258
to proceed for 15 min, then the absorbance was measured at 340 nm using a multi-mode 259

MANUSCRIP
T
ACCEPTED
ACCEPTED MANUSCRIPT
12
microplate reader (Synergy HT, BioTek Instruments, Inc.). Each measurement was carried 260
out in duplicate. 261
262
2.2.6.2. Identification of proteins during digestion 263
Sodium Dodecyl Sulphate-Polyacrylamide Gel Electrophoresis (SDS-PAGE) was performed 264
on the initial and digested samples normalised to a total protein concentration of 0.1 %. 265
NuPAGE Novex bis-Tris 12-well precast gels (Invitrogen, Life Technologies Corp., CA, 266
USA), 4-12 % polyacrylamide, were used according to the manufacturer’s instructions. The 267
amount of protein loaded in each well was 6.5 µg. A fixing solution (50% methanol and 10% 268
acetic acid in v/v) was applied to the gels for 2 hrs before staining with Coomassie Blue. 269
Mark 12™ Unstained Standard (Invitrogen, Life Technologies Corp., CA, USA) was used as 270
a molecular weight marker. 271
272
2.2.7. Rheological analysis 273
The consistency of the coagulum that persisted at the end of digestion, after about 182 min 274
(GE5 point) was analysed by small deformation rheology. The coagulum was separated from 275
the serum using a 70 µm Nylon strainer (BD Falcon). The mass of the sample and, the 276
separated coagulum and serum was recorded. The coagulum was gently placed in a rheometer 277
(AR 2000 EX Rheometer, TA Instruments, Crawley, UK). The rheometer geometry consisted 278
of a 40 mm diameter parallel steel plate using a shear strain of 0.5 and a frequency of 1 Hz 279
for 30 min at 37 oC. The complex modulus (G*) was calculated as follows G*=stress*/strain. 280
281
2.2.8. Statistical Analysis 282
MANUSCRIP
T
ACCEPTED
ACCEPTED MANUSCRIPT
13
The results were expressed as means ± standard deviation of two replicates. For each 283
replicate, raw milk was collected, analysed (composition) and processed independently, i.e. 284
one milk per day. To identify differences in normally distributed results of the repeated 285
measure within groups during gastric digestion, one-way ANOVA was applied. Where 286
overall significant interaction was observed (P < 0.05), the means of individual milk 287
treatments were compared using Tukey’s post hoc test. Statistical analyses were performed 288
using GraphPad Prism software (Prism 5 for Windows, Version 5.04). 289
3. Results 290
3.1. Gastric pH profile 291
The simulation of the gastric phase was performed by a semi-dynamic model that can 292
simulate the main biochemical dynamics of the human stomach. These are gradual enzyme 293
and acid secretion and progressive gastric emptying. The changes in pH during gastric 294
digestion are shown in Fig. 1. The gastric model had a low initial pH of about 1 simulating 295
the fasting conditions. The pH increased rapidly, up to values of about 6, after the addition of 296
sample from the oral phase. Subsequently, there was a progressive decrease reaching pH 297
values below 1.4 after 3 hours due to the continuous gastric fluid secretion containing acid as 298
well as the reduction of buffering capacity of the digested food by gastric emptying. All 299
samples showed a similar pH behaviour to the predefined profile observed in in vivo studies 300
(Malagelada et al., 1976). The mean pH of the samples did not show any statistically 301
significant differences except in the initial (p = 0.034) and GE1 (p = 0.041) points. The mean 302
pH between Raw and UHT+Homo in GE1 were significantly different using the Tukey’s 303
multiple comparison post-hoc test. 304
305
3.2. Gastric behaviour 306

MANUSCRIP
T
ACCEPTED
ACCEPTED MANUSCRIPT
14
Using the semi-dynamic model, a range of different structures and behaviours during gastric 307
digestion were obtained (Fig. 2). Protein coagulation was visible for all the samples within 308
the first 10 min of digestion and the formation of larger aggregates was observed a few 309
minutes later, at which time the pH ranged from 5.5 to 6. Subsequently, there was the 310
formation of a more compact coagulum with clear serum within the following 15 min. 311
Differences in coagulum consistency were observed throughout the gastric phase as 312
illustrated in Fig. 2. There were remarkable differences, in particular, between the firm 313
coagulum of Raw (Fig. 2A) and the fragmented structure of UHT+Homo (Fig. 2I). In the 314
absence of pepsin, we observed later aggregation and coagulum formation. Protein 315
coagulation was visually observed after 75 min at which time the pH was around 5, with the 316
exception of the UHT-treated samples in which the aggregation was first seen at 35min. 317
Fig. 3 shows the gastric behaviour of the milk samples in the model stomach at about 36 min 318
(Fig. 3A, B, C, G, H, I) and 182 min (Fig. 3D, E, F, J, K, L) of gastric digestion. The 319
homogenised samples showed creaming, having an opaque layer on the top, (Fig. 3J, K, L) 320
whereas the non-homogenised samples resulted in sedimentation (Fig. 3D, E, F). In the 321
homogenised samples, phase separation was initially observed when aggregates could form a 322
layer at the top, with a cloudy layer in the middle part and clearer layer in the bottom at about 323
109 min. This was different in the absence of pepsin since there was no phase separation and 324
the coagulum of all the samples remained of the bottom of the vessel. 325
The consistency of the milk coagulum was further studied by small deformation rheology 326
analysing the coagulum remaining in GE5. Table 1 shows the values of the complex modulus 327
(G*) obtained after 15 min of measurement. The non-heated samples, Raw and Homo, 328
generated the highest levels of G* accounting for 4,555 and 4,113 Pa, respectively. The 329
pasteurised samples (Past and Past+Homo) presented an intermediate situation accounting for 330
2,934 and 1,569 Pa. The lowest G* values were found in UHT and UHT+Homo representing 331

MANUSCRIP
T
ACCEPTED
ACCEPTED MANUSCRIPT
15
for 501 and 206 Pa, respectively. The same behaviour was observed during the rheological 332
analysis, which was performed for 30 min. 333
It is important to note that some alteration of the structure could have been induced while 334
transferring the sample to the rheometer in order to perform the analysis. 335
336
3.3. Microstructure of the emptied samples 337
The coagulation, observed within the first 15 min of digestion, was reflected in the 338
microstructures of the emptied samples (Fig. 4). There were differences in the structure of the 339
protein matrix in the first stages of gastric digestion. The non-heated samples, in particular 340
Raw, seemed to form a more compact and dense network (Fig. 4D) in accordance with the 341
visual observation. This differs from the heated samples, in particular UHT (Fig. 4F), in 342
which the structure of the protein coagulum was open with more pores. This can be linked 343
with the particulate and soft macrostructure observed. Moreover, in the GE1 point of the non-344
homogenised samples (Fig. 4D, E, F), the native fat droplets appeared to be in the aqueous 345
phase showing some coalescence. In contrast, the fat droplets seemed to be easily entrapped 346
in protein network of the homogenised samples (Fig. 4M, N, O), in which fine particles could 347
be seen distributed within the coagulum particles, in particular UHT+Homo (Fig. 4O). The 348
effect of homogenisation on the structure at the end of gastric digestion (182 min) was 349
significant. All the homogenised samples presented a great number of small aggregates (Fig. 350
4P, Q, R) compared to the large particles of non-homogenised samples (Fig. 4G, H, I). 351
The changes in the droplet size were followed during digestion (Table 1). Initially, the 352
volume mean particle diameter, d4,3, of non-homogenised samples was about 2.5 µm whereas 353
that of homogenised samples was about 0.4 µm, showing the significant size reduction due to 354
homogenisation treatment. The particle size of the milk samples, with the addition of SDS, 355

MANUSCRIP
T
ACCEPTED
ACCEPTED MANUSCRIPT
16
increased to a different extent at the end of digestion. The digestion of the raw milk resulted 356
in an increase from the initial size of 2.96 µm to 8.26 µm after 182 min of digestion but the 357
particle size of UHT+Homo increased from 0.41 to 0.97 µm. 358
359
3.4. Nutrient delivery 360
The protein (Fig. 5A) and lipid (Fig. 5B) delivery was low in the first GE points and then 361
there was an increase in the last point, GE5. The content in GE5 ranged from 3.42 to 9.45 % 362
and from 7.21 to 16.14 % for protein and lipid, respectively. The means of protein and lipid 363
content were significantly different in both GE1 and GE5 due to differences between Raw 364
and UHT+Homo. The profile of the protein content showed a more constant and higher levels 365
in the first GE points in comparison to those in lipid profile. In the case of lipid content 366
profile, in GE5, the homogenised samples seemed to have higher levels with exception of 367
UHT+Homo. 368
369
3.5. Protein digestion 370
Fig. 6 shows the levels of free NH2 groups of the milk samples before digestion and in the 371
different GE points. The means of the initial samples were significantly different (p=0.0008) 372
due to the samples in which UHT treatment was applied. The low values obtained in these 373
samples may be due to the Maillard reaction products, which might be favoured by the high 374
heating of UHT treatment (Morgan et al., 1999). The proteolysis showed a similar profile in 375
all samples. There was an increase in the three first GE points, after which it levelled off 376
showing no increase in the GE4 point. After that, the level of proteolysis decreased in GE5. 377
Levels of proteolysis among samples differed greatly in GE1 and GE5. In GE1, Raw and 378
UHT+Homo were statistically different accounting for 921.07 and 354.31 mM NH2/g, 379

MANUSCRIP
T
ACCEPTED
ACCEPTED MANUSCRIPT
17
respectively. Conversely, in GE5, UHT+Homo showed the highest level of proteolysis (1,736 380
mM NH2/g) being statistically different from Raw and Homo (897 and 1,065 mM NH2/g, 381
respectively). 382
The protein composition during the gastric phase was also studied by SDS-PAGE and shown 383
in Fig. 7. The bands corresponding to the samples before digestion (I) did not differ due to 384
processing. Moreover, there were no differences between homogenised and non-385
homogenised samples. The non-heated samples, Raw and Homo, had similar patterns than 386
those of pasteurised samples (Past and Past+Homo). The caseins were detectable in the first 387
emptying points, in particular GE1 and GE2 points, but they were almost not observed in 388
GE3 and GE4 points. In the last emptying point (GE5) intact caseins could again be observed 389
together with a wide range of peptides. β-Lg, in contrast, was present during gastric digestion 390
even though the band weakened in the last GE points. Also, α-La was present in the three first 391
GE points, after which it was not detected anymore. Many small molecular weight peptides 392
were present during digestion and could be seen from GE1 onwards. This behaviour differed 393
from that observed in the UHT-treated samples (UHT and UHT+Homo). In those samples, 394
both caseins and whey proteins could only be observed in the two first GE points. 395
396
4. Discussion 397
4.1.Influence of the milk processing on gastric behaviour. 398
By using a physiologically relevant gastric model (Mulet-Cabero et al., 2017), we have been 399
able to show that homogenised samples showed significantly more creaming compared to 400
non-homogenised samples where sedimentation was observed, regardless the heat treatment 401
(Fig. 3). Homogenisation caused the disruption of the native MFGM, reduced the droplet size 402
and promoted adsorption of milk proteins onto the droplet surface (Lopez, 2005; Sharma & 403
MANUSCRIP
T
ACCEPTED
ACCEPTED MANUSCRIPT
18
Dalgleish, 1993). This change of the droplet interfacial composition might be one of the main 404
reasons for the distinct gastric behaviour. The milk proteins on the droplet surface, especially 405
the denatured and aggregated proteins in the heated UHT+Homo sample, may be more 406
susceptible to be hydrolysed by pepsin leading to the destabilisation of the droplets by 407
flocculation and some coalescence, and ultimately leading to the phase separation observed. 408
The non-homogenised samples, in contrast, still possessed the native MFGM, which could 409
provide more stability during gastric digestion. These structural changes were certainly due to 410
the proteolytic action of pepsin since there was no phase separation in the homogenised 411
samples when pepsin was absent. Further investigation was undertaken in order to gain 412
insight into the mechanism of the different gastric behaviour observed. The lipid/protein ratio 413
in both coagulum and serum in the first GE point was determined (Fig. S.1 Supplementary 414
Material). The non-homogenised samples had significantly higher lipid/protein ratio in the 415
serum compared to the homogenised samples. Moreover, the microstructure imaging showed 416
that most of the droplets in the non-homogenised samples tended to be in the serum (Fig. 4D-417
F) compared to those of the homogenised samples (Fig. 4M-O). This might be due to easier 418
incorporation of the smaller droplets into the coagulum and also the possible interactions of 419
the droplet surface coated by milk protein with the protein network. Therefore, a higher 420
inclusion of droplets into the protein matrix could lead to a lower density of the coagulum 421
resulting in the phase separation whereas the higher lipid content in the serum seen in the 422
non-homogenised samples could lead to a dense coagulum that sedimented. Hence, the 423
different colloidal behaviour of the samples was driven by both droplet destabilisation and 424
aggregate density. 425
Heat treatment was shown to be the main driver for the differences in coagulum consistency. 426
Both pasteurisation (72 oC for 15 s) and UHT (140 oC for 3 s) treatments were used, and 427
compared to the non-heated raw milk. It is well established that heating above 70 oC induces 428

MANUSCRIP
T
ACCEPTED
ACCEPTED MANUSCRIPT
19
the denaturation of whey proteins, in particular β-Lg. The extent of whey protein denaturation 429
in UHT milk is much higher than that in pasteurised milk (Douglas et al., 1981). The 430
denatured whey proteins have been reported to interact with κ-casein, forming complexes 431
both at casein micelle surface and in serum phase, the prevalence of which depends on the pH 432
of heated milk (Anema et al., 2011). Therefore, the level of protein association is higher in 433
UHT-treated compared to that of pasteurised milk. This could have impaired casein 434
coagulation and led to the more fragmented structures obtained in heated milk samples, in 435
particular UHT (Fig. 2). This different consistency persisted throughout digestion and the 436
rheological analysis (Table 1) confirmed that the heat treatment was the main cause of the 437
consistency of coagulum. 438
The initial protein aggregation to form the coagulum and the gastric behaviour was induced 439
by pepsin action. The protein aggregation was visually observed within the first 10 min, at 440
which time the pH was above 5.5. In contrast, when pepsin was not included, the protein 441
aggregation was observed after 75 min at which the pH was around 5. It has been reported 442
that the pH for coagulation of unheated and heated milk is about 5 and 5.3 respectively 443
(Donato et al., 2007). There was a more rapid decrease of pH when pepsin was present in raw 444
milk digestion caused by the rapid formation of the coagulum whereas the pH profile of the 445
heated sample was similar in the absence of pepsin (data not shown), which is in accordance 446
to Ye et al. (2016). Pepsin has been reported to favour the hydrolysis of κ-caseins among the 447
other caseins at pH 6.0 (Tam & Whitaker, 1972). The coagulation is caused by the 448
destabilisation of casein micelles since pepsin cleavages the Phe-105-Met-106 bond in κ-449
casein, which is the same than that for chymosin (Drøhse & Foltmann, 1989) that is used for 450
cheese making. Hence, it seems possible to draw parallels to the effects of heat-induced 451
changes on the functional properties, which has been widely reported for the rennet 452
coagulation. Kethireddipalli et al. (2010) showed that the poor rennet clotting of heat-treated 453
MANUSCRIP
T
ACCEPTED
ACCEPTED MANUSCRIPT
20
milk resulting in weak curds was due to the interactive effect of the following: (i) 454
modification of the surface of casein micelles with bound denatured whey proteins; (ii) 455
formation of soluble complexes between denatured whey proteins and κ-casein; (iii) 456
reduction of calcium concentration in the serum. In the present study, milk was heated at its 457
natural pH (6.67). It was shown that about 30 % of whey proteins can bind to the micelle 458
surface when milk, at the mentioned pH, was heated at 90 oC (Kethireddipalli et al., 2010). 459
This impairs the micelle aggregation by steric effects, which in combination with the protein 460
complexation and alteration of the ionic equilibrium in the serum might explain the different 461
consistency of the coagulum obtained in the present study. 462
It is important to note that in this study the heat treatment was followed by the 463
homogenisation. The impact of the order of these processes is still subject of past and current 464
research projects (Michalski & Januel, 2006). 465
The comparison of the obtained gastric behaviour with other studies is difficult because the in 466
vivo studies using similar samples did not show the structural changes in the stomach even 467
though they suggested similar behaviours in terms of the consistency of coagulum. Moreover, 468
most in vitro studies use a static model, which does not allow to assess the structural changes. 469
Nevertheless, the results in terms of coagulation behaviour, timing and consistency, were in 470
agreement with the findings reported by Ye et al. (2016) using a dynamic model, the Human 471
Gastric Simulator. 472
473
4.2. Effect of gastric behaviour on nutrient delivery and protein digestion 474
The gastric behaviour caused by the milk processing affected the nutrients emptied and 475
protein digestion kinetics. The sampling simulating the emptying was influenced by the 476
consistency of the coagulum. Mostly serum liquid was emptied in the first GE points for the 477

MANUSCRIP
T
ACCEPTED
ACCEPTED MANUSCRIPT
21
samples having a firmer coagulum, in particular Raw (Fig. 2A) accounting for the lowest 478
content of nutrients delivered in the GE1 (Fig. 5). In contrast, the very soft coagulum 479
obtained from UHT+Homo (Fig. 2F) allowed more of the coagulum to be emptied. Hence, 480
the delivery of both lipid and protein in GE1 was the highest for UHT+Homo (Fig. 5). It was 481
found that the release of lipid (Fig. 5A) was influenced by the phase separation obtained in 482
the homogenised samples. The lipid content in GE5 point was generally higher in the 483
homogenised samples, as the cream layer remained in the in vitro stomach until the last GE 484
point. One exception for that was UHT+Homo due to the high nutrient content at early stage. 485
Similar results could be seen in the protein profile (Fig. 5B) even though the differences were 486
more subtle. This might be due to the more constant delivery of protein throughout digestion, 487
which might be attributed to the emptying of serum containing mainly whey proteins. 488
The proteolysis levels might be linked to the consistency of the coagulum, which was mainly 489
affected by heat treatment. The softness of the coagulum (Table 1) and the greater number of 490
smaller particles (Fig.2) from the heat treated samples, in particular in the UHT+Homo could 491
facilitate pepsin diffusion within the structure leading to the higher proteolysis obtained at the 492
end of digestion (Fig. 6). In contrast the lowest level of proteolysis was found in raw milk, in 493
which the hardness of the coagulum and larger particles hampered the pepsin accessibility. 494
The UHT treatment resulted in an enhancement of both caseins and whey protein digestion 495
(Fig. 7). For the UHT samples, almost no detectable intact caseins or whey proteins were 496
found after 73 min, corresponding to the GE2 point. This finding is in agreement with the 497
protein composition of the heated homogenised milk shown in Ye et al. (2016). The UHT 498
treatment has been reported to greatly denature β-Lg, which exposes the peptide bonds to 499
pepsin. The temperature of the pasteurisation process was not sufficient to induce any 500
important changes in the protein digestion; the SDS-PAGE profile did not differ from that 501
obtained of the non-heated samples similarly to the observations of Wada and Lönnerdal 502
MANUSCRIP
T
ACCEPTED
ACCEPTED MANUSCRIPT
22
(2014) during in vitro gastric digestion. Also, β-lg remained largely intact during gastric 503
digestion, which was already reported in humans with the ingestion of purified caseins and β-504
Lg (Mahe et al., 1996). The degradation of α-La was observed after about 109 min (GE3) at 505
which the pH was under 4, which is in agreement with its pepsin hydrolysis susceptibility by 506
the change of protein conformation at that pH. 507
508
4.3. Physiological relevance 509
The study has shown that the processing of milk resulted in different coagulation and 510
colloidal behaviour in gastric conditions influencing the nutrient digestion kinetics. This may 511
influence nutrient bioavailability and absorption in the intestine, and subsequently the 512
metabolic responses. 513
The gastric behaviour found in the stomach has been seen to influence satiety responses, 514
which are linked partly to the release of gut hormones such as cholecystokinin (CCK). The 515
clinical study performed by Mackie et al. (2013) showed the sedimentation of a semi-solid 516
matrix (cheese and yogurt) caused a lower GE rate and prolonged fullness response, in 517
contrast to the isocaloric comparison in a liquid matrix that creamed and increased hunger. 518
This was explained by the patterns of digestion obtained in vitro (Mulet-Cabero et al., 2017). 519
The liquid system showed a delayed nutrient release due to the formation of the cream layer 520
during gastric digestion whereas the sedimentation in semi-solid system led to the early 521
emptying of high nutrient content. In the present study, we found creaming and sedimentation 522
in the homogenised and non-homogenised samples respectively. Therefore, one might expect 523
that non-homogenised samples may induce more fullness compared to the homogenised 524
samples. However, according to the nutrient delivery results obtained in this study, 525

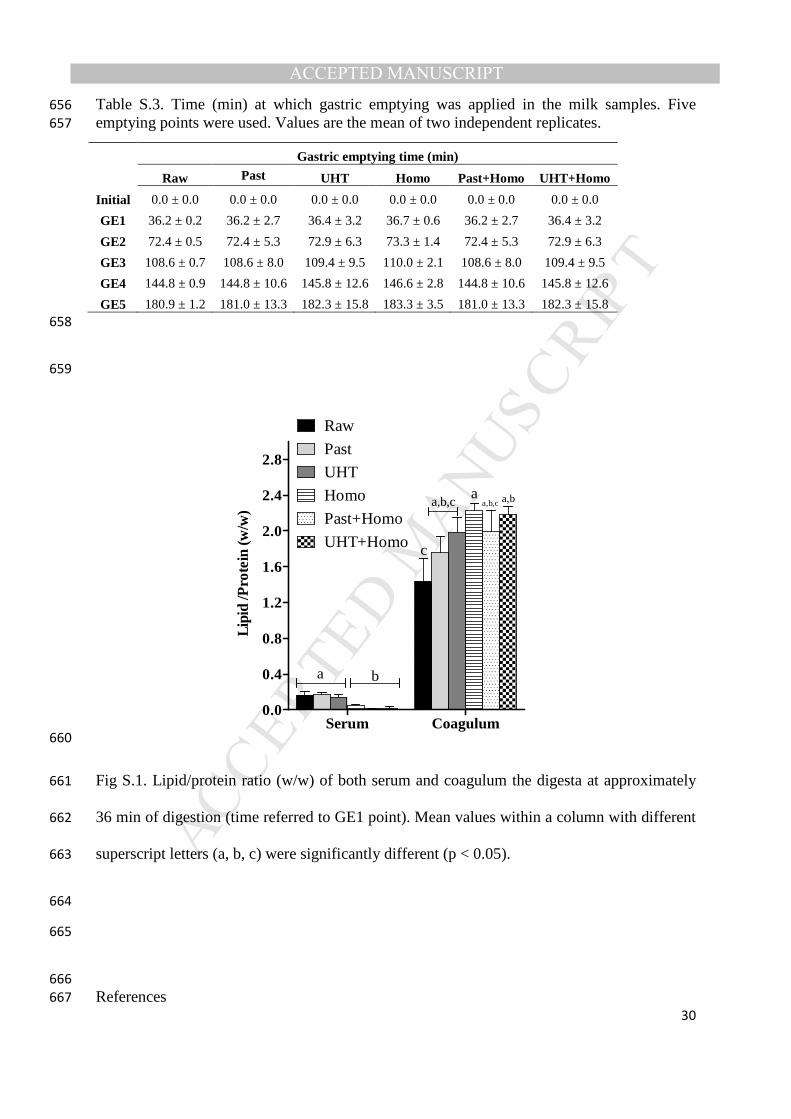
MANUSCRIP
T
ACCEPTED
ACCEPTED MANUSCRIPT
23
UHT+Homo showed early release of both protein and lipid, which may promote the release 526
of CCK and thus increase satiety. 527
The heat treatment of milk has been reported to affect protein postprandial kinetics. Lacroix 528
et al. (2008) showed that the UHT treatment enhanced the rate of digestion of milk protein 529
causing a higher transfer of dietary nitrogen into serum amino acids and protein, but 530
pasteurisation treatment did not alter the outcome. In the present study, in agreement with the 531
in vivo data, the UHT treated samples had a higher protein release in the early stages of 532
digestion, in particular UHT+Homo. Also, these samples showed higher digestion of both 533
caseins and whey proteins. This may lead to a different postprandial release of peptides 534
(Boutrou et al., 2013), which may favour certain population groups, for instance elderly and 535
athletes may benefit form a higher postprandial nitrogen absorption rate. 536
The metabolic responses relate to the nutrients delivered as a result of gastric emptying, 537
which is linked with the different structural changes occurring in the stomach. In the present 538
study, we used a convenient linear GE rate of 2 kcal/min, which is considered the average 539
caloric content that is emptied in a regulated manner by the antrum (Hunt & Stubbs, 1975). 540
However, this is a simplistic approach since the GE rate differs in response to the behaviour 541
developed during gastric conditions as was shown by Mackie et al. (2013). According to the 542
structural changes observed in the differently processed milk presented in this study, we 543
expect that the GE rate in humans could differ between the samples. 544
545
5. Conclusions 546
In this study, it was shown that processed-induced changes in milk affect gastric digestion in 547
vitro, which may impact nutrient metabolism in vivo. This study showed for the first time 548
clear evidence of different milk behaviour, sedimentation vs. creaming. Homogenisation was 549
MANUSCRIP
T
ACCEPTED
ACCEPTED MANUSCRIPT
24
the main driver for the gastric phase separation, which was caused by the different droplet 550
surface and coagulum density. The different consistency of the coagulum was a consequence 551
of the heat treatment. The non-heated samples, especially Raw, formed a firm coagulum 552
whereas the heated samples had a fragmented coagulum particularly observed in 553
UHT+Homo. This stems from the formation of complexes between milk proteins, which 554
weakens the protein network. These structural changes occurring during the gastric phase 555
resulted in different nutrient emptying, with significant differences between Raw and 556
UHT+Homo, and higher digestion of milk proteins in the UHT-treated samples due to the 557
drastic heat treatment. This study provides valuable information for understanding the gastric 558
emptying of milk in relation to its processing and can be applied to manipulate the nutrient 559
release rate of the dairy matrices addressed to specific population groups. 560
561
Acknowledgements 562
This work has funded by the Irish Dairy Levy Research Trust (project number MDDT6261). 563
Ana-Isabel Mulet-Cabero was funded under Teagasc Walsh Fellowship scheme and BBSRC 564
in the UK (grant BB/J004545/1). 565
566
Abbreviations 567
GE, gastric emptying; UHT, Ultra High Temperature; SSF, simulated salivary fluid; SGF, 568
simulated gastric fluid; OPA, o-phthaldialdehyde; β-Lg, β-Lactoglobulin; MW, molecular 569
weight; TCA, trichloroacetic acid; SDS-PAGE, Sodium Dodecyl Sulphate-Polyacrylamide 570
Gel Electrophoresis 571
572

MANUSCRIP
T
ACCEPTED
ACCEPTED MANUSCRIPT
25
Figure Captions 573
574
Fig. 1. Change in pH of milk samples during gastric digestion in semi-dynamic model 575
corresponding to each gastric emptying (GE) point. The time represents an approximation of 576
the actual values displayed in Table S.1 Supplementary Material. The pH values are referred 577
to the basal stage (before gastric digestion), initial (milk sample including oral phase and 578
basal volumes) and the different GE samples (GE1-GE5). Each data point is the average of 2 579
independent determinations. Significance difference in pH between milk samples in each GE 580
point was determined by one-way ANOVA, p<0.05 (*). 581
582
Fig. 2. Images of the milk samples at approximately 36 and 182 min of gastric digestion, 583
corresponding to the first and last gastric emptying points (displayed in a petri dish). Raw 584
milk (A, D), pasteurised milk (B, E), UHT milk (C, F), homogenised milk (G, J), 585
pasteurised+homogenised milk (H, K) and UHT+homogenised milk (I, L). 586
587
Fig. 3. Images of the milk samples at approximately 36 and 182 min, corresponding to the 588
first and last gastric emptying points (displayed in the gastric model). Raw milk (A, D), 589
pasteurised milk (B, E), UHT milk (C, F), homogenised milk (G, J), 590
pasteurised+homogenised milk (H, K) and UHT+homogenised milk (I, L). 591
592
Fig. 4. Examples of confocal microscopy images of the milk samples before digestion and, at 593
about 36 min (GE1) and 182 min (GE5) of gastric digestion. Raw milk (A, D, G), pasteurised 594
milk (B, E, H), UHT milk (C, F, I), homogenised milk (J, M, P), pasteurised+homogenised 595

MANUSCRIP
T
ACCEPTED
ACCEPTED MANUSCRIPT
26
milk (K, N, Q), UHT+homogenised milk (L, O, R). Red shows the lipid and green shows the 596
protein. The scale bar corresponds to 75 µm. 597
598
Fig. 5. The nutrient content (w/w, %) in terms of protein (A) and lipid (B) of initial (before 599
digestion) and the gastric emptying points (GE1-GE5). Each data point is the average and 600
error bars represent standard deviation of two independent replicates. The values were 601
corrected by the different gastric dilution in each point. Mean values within a column with 602
different superscript letters (a, b, c) were significantly different (p < 0.05). 603
604
Fig. 6. Concentration of free amine groups per mass of total protein in sample; initial (before 605
digestion) and gastric emptying points (GE1-GE5). Each data point is the average and error 606
bars represent standard deviation of two independent replicates. The values were corrected by 607
the different gastric dilution in each point. Mean values within a column with different 608
superscript letters (a, b, c) were significantly different (p < 0.05). 609
610
Fig. 7. SDS-PAGE (under reducing conditions) of the milk samples, initial (I) referred to 611
before digestion and the gastric emptying points (GE1-GE5), and a molecular weight (MW) 612
marker. The samples are labelled in the figure accordingly. The protein content in each 613
sample was 0.1%. 614
615
616
617
618
619

MANUSCRIP
T
ACCEPTED
ACCEPTED MANUSCRIPT
27
Table 1. Volume-weighted mean diameter (d4,3) of the initial samples (before digestion), with 620
and without SDS addition, and the last gastric emptying (GE) point, GE5, including SDS. 621
The values represent the mean and standard deviation of two independent replicates. Values 622
of the complex module, G*, at 15 min of shear of the milk coagulum collected at GE5 time 623
(after about 182 min). Means within the same column and having the same superscript lower 624
case letter and means within the same superscript uppercase letter are not significantly 625
different by Tukey’s t-test at p < 0.05. 626
627
628
629
630
631
632
633
634
635
636
637
638
639
640
d4,3 (µm) Initial Initial+SDS GE5+SDS G* (Pa) Raw 2.48±0.48aA 2.96±0.08aA 8.26±5.44aA 4,555±236a Past 2.49±0.61aA 3.62±0.65aA 6.92±2.26aA 2,934±1426a UHT 2.49±0.15aA 3.82±0.02aA,B 4.28±0.57aB 501±186b Homo 0.42±0.02bA 0.37±0.01bA 0.42±0.03aA 4,113±501a Past+Homo 0.34±0.01bA 0.87±0.77bA 2.99±2.23aA 1,569±730b UHT+Homo 0.35±0.06bA 0.41±0.08bA 0.97±0.70aA 206±45b

MANUSCRIP
T
ACCEPTED
ACCEPTED MANUSCRIPT
28
Supplementary Material 641
642
Table S.1. Nutritional composition of the milk samples. Values are the mean of two 643
independent replicates. 644
% Lipid % Protein % Lactose % Total solids
Raw 4.67±0.26 3.44±0.41 4.72±0.09 13.53±0.67
Past 4.55±0.43 3.32±0.25 4.71±0.10 13.24±0.59
UHT 4.49±0.53 3.43±0.42 4.71±0.05 13.35±1.03
Homo 4.74±0.28 3.76±0.09 4.66±0.02 13.82±0.25
Past+Homo 4.55±0.43 3.32±0.25 4.71±0.10 13.24±0.59
UHT+Homo 4.49±0.53 3.43±0.42 4.71±0.05 13.35±1.03
645
646
647
648
Table S.2. Example of the parameters used in the semi-dynamic gastric model. In this 649
example, the nutrient composition was the following 4.94 % fat, 3.82 % protein, 4.64 % 650
lactose. The sample had 14 % of total solids. The energy content was 0.78 kcal/mL calculated 651
using the Atwater factors of 9 kcal/g for fat and 4 kcal/g for protein and carbohydrates. The 652
gastric emptying was scaled down from the considered in vivo emptying average of 2 653
kcal/min in a 500 mL meal (Hunt & Stubbs, 1975) . Then, the gastric half time (t1/2) was 654
considered to be the same. The density was set at 1 g/cm3.655

MANUSCRIP
T
ACCEPTED
ACCEPTED MANUSCRIPT
29
A. Milk sample (example)
Food volume (g) 20
Energy content (kcal/mL) 0.78
Total solids (g) 2.8
B. Gastric emptying and total digestion time
in vitro in vivo
Food volume (mL) 20.00 500.00
Gastric volume (Oral +basal) at t=0 (mL) 25.08 550.00
Energy content of food (kcal) 15.66 391.43
Energy emptying rate (kcal/min) 0.08 2.00 Volume emptying rate (mL/min) (Emptied in 5 steps of 9.12 mL every 39.1 min)
0.13 2.81
t1/2 (min) 97.86 97.86
Total digestion time (min) 195.71
C. Digestion
Oral Phase Gastric phase
Compound
Volume (mL)
% Total
gastric (mL) Total
gastric (%) Basal (mL)
Gastric mixture (mL). Rate 0.1 mL/min
Pepsin solution (mL). Rate 0.004 mL/min
SSF electrolyte 2.24 79.89 0 0 0 0 0
0.3M M CaCl2(H2O)2 0.014 0.50 0.0114 0.05 0.00114 0.01026 0
Milli-Q ® Water 0.55 19.61 1.75 7.68 0.18 1.58 0
SGF electrolyte 0 0 18.24 80.00 1.82 16.42 0
1.5M HCl 0 0 2 8.77 0.20 1.80 0
Pepsin solution (2,000 U/mL final) 0 0 0.8 3.51 0 0 0.8
Total 2.80 100 22.8 100 2.20 19.80 0.8
MANUSCRIP
T
ACCEPTED
ACCEPTED MANUSCRIPT
30
Table S.3. Time (min) at which gastric emptying was applied in the milk samples. Five 656
emptying points were used. Values are the mean of two independent replicates. 657
Gastric emptying time (min)
Raw Past UHT Homo Past+Homo UHT+Homo
Initial 0.0 ± 0.0 0.0 ± 0.0 0.0 ± 0.0 0.0 ± 0.0 0.0 ± 0.0 0.0 ± 0.0
GE1 36.2 ± 0.2 36.2 ± 2.7 36.4 ± 3.2 36.7 ± 0.6 36.2 ± 2.7 36.4 ± 3.2
GE2 72.4 ± 0.5 72.4 ± 5.3 72.9 ± 6.3 73.3 ± 1.4 72.4 ± 5.3 72.9 ± 6.3
GE3 108.6 ± 0.7 108.6 ± 8.0 109.4 ± 9.5 110.0 ± 2.1 108.6 ± 8.0 109.4 ± 9.5
GE4 144.8 ± 0.9 144.8 ± 10.6 145.8 ± 12.6 146.6 ± 2.8 144.8 ± 10.6 145.8 ± 12.6
GE5 180.9 ± 1.2 181.0 ± 13.3 182.3 ± 15.8 183.3 ± 3.5 181.0 ± 13.3 182.3 ± 15.8 658
659
Lipi
d /P
rote
in (
w/w
)
Serum Coagulum0.0
0.4
0.8
1.2
1.6
2.0
2.4
2.8
Raw
Past
UHT
Homo
Past+Homo
UHT+Homo
a b
a a,b
c
a,b,c a,b,c
660
Fig S.1. Lipid/protein ratio (w/w) of both serum and coagulum the digesta at approximately 661
36 min of digestion (time referred to GE1 point). Mean values within a column with different 662
superscript letters (a, b, c) were significantly different (p < 0.05). 663
664
665
666
References 667
MANUSCRIP
T
ACCEPTED
ACCEPTED MANUSCRIPT
31
668
Anema, S. G., Lee, S. K., & Klostermeyer, H. (2011). Rennet-Induced Aggregation of Heated 669
pH-Adjusted Skim Milk. Journal of Agricultural and Food Chemistry, 59(15), 8413-670
8422. 671
Bach, A., Aris, A., Vidal, M., Fàbregas, F., & Terré, M. (2017). Influence of milk processing 672
temperature on growth performance, nitrogen retention, and hindgut's inflammatory 673
status and bacterial populations in a calf model. Journal of Dairy Research, 84(3), 674
355-359. 675
Barbé, F., Ménard, O., Le Gouar, Y., Buffière, C., Famelart, M.-H., Laroche, B., Le 676
Feunteun, S., Dupont, D., & Rémond, D. (2013). The heat treatment and the gelation 677
are strong determinants of the kinetics of milk proteins digestion and of the peripheral 678
availability of amino acids. Food Chemistry, 136(3), 1203-1212. 679
Boutrou, R., Gaudichon, C., Dupont, D., Jardin, J., Airinei, G., Marsset-Baglieri, A., 680
Benamouzig, R., Tomé, D., & Leonil, J. (2013). Sequential release of milk protein–681
derived bioactive peptides in the jejunum in healthy humans. The American journal of 682
clinical nutrition, 97(6), 1314-1323. 683
Donato, L., Alexander, M., & Dalgleish, D. G. (2007). Acid Gelation in Heated and Unheated 684
Milks: Interactions between Serum Protein Complexes and the Surfaces of Casein 685
Micelles. Journal of Agricultural and Food Chemistry, 55(10), 4160-4168. 686
Douglas, F., Greenberg, R., Farrell, H., & Edmondson, L. (1981). Effects of ultra-high-687
temperature pasteurization on milk proteins. Journal of Agricultural and Food 688
Chemistry, 29(1), 11-15. 689
Drøhse, H. B., & Foltmann, B. (1989). Specificity of milk-clotting enzymes towards bovine 690
κ-casein. Biochimica et Biophysica Acta (BBA)-Protein Structure and Molecular 691
Enzymology, 995(3), 221-224. 692
Dupont, D., Mandalari, G., Mollé, D., Jardin, J., Rolet‐Répécaud, O., Duboz, G., Léonil, J., 693
Mills, C. E., & Mackie, A. R. (2010). Food processing increases casein resistance to 694
simulated infant digestion. Molecular Nutrition & Food Research, 54(11), 1677-1689. 695
Gaudichon, C., Roos, N., Mahé, S., Sick, H., Bouley, C., & Tomé, D. (1994). Gastric 696
emptying regulates the kinetics of nitrogen absorpti. The Journal of nutrition, 697
124(10), 1970. 698
Hunt, J., & Stubbs, D. (1975). The volume and energy content of meals as determinants of 699
gastric emptying. The Journal of physiology, 245(1), 209. 700
Islam, M. A., Devle, H., Comi, I., Ulleberg, E. K., Rukke, E.-O., Vegarud, G. E., & Ekeberg, 701
D. (2017). Ex vivo digestion of raw, pasteurised and homogenised milk - Effects on 702
lipolysis and proteolysis. International Dairy Journal. 703
Keenan, T. W., Moon, T.-W., & Dylewski, D. P. (1983). Lipid Globules Retain Globule 704
Membrane Material After Homogenization. Journal of Dairy Science, 66(2), 196-203. 705
Kethireddipalli, P., Hill, A. R., & Dalgleish, D. G. (2010). Protein interactions in heat-treated 706
milk and effect on rennet coagulation. International Dairy Journal, 20(12), 838-843. 707
Kong, F., & Singh, R. P. (2010). A Human Gastric Simulator (HGS) to Study Food Digestion 708
in Human Stomach. Journal of Food Science, 75(9), E627-E635. 709
Lacroix, M., Bon, C., Bos, C., Léonil, J., Benamouzig, R., Luengo, C., Fauquant, J., Tomé, 710
D., & Gaudichon, C. (2008). Ultra High Temperature Treatment, but Not 711
Pasteurization, Affects the Postprandial Kinetics of Milk Proteins in Humans. The 712
Journal of nutrition, 138(12), 2342-2347. 713
Lopez, C. (2005). Focus on the supramolecular structure of milk fat in dairy products. 714
Reproduction Nutrition Development, 45(4), 497-511. 715

MANUSCRIP
T
ACCEPTED
ACCEPTED MANUSCRIPT
32
Mackie, A., Rafiee, H., Malcolm, P., Salt, L., & van Aken, G. (2013). Specific food 716
structures supress appetite through reduced gastric emptying rate. Am J Physiol 717
Gastrointest Liver Physiol, 304(11), G1038-1043. 718
Mahe, S., Roos, N., Benamouzig, R., Davin, L., Luengo, C., Gagnon, L., Gausserges, N., 719
Rautureau, J., & Tome, D. (1996). Gastrojejunal kinetics and the digestion of N-15 720
beta-lactoglobulin and casein in humans: The influence of the nature and quantity of 721
the protein. American Journal of Clinical Nutrition, 63(4), 546-552. 722
Malagelada, J.-R., Longstreth, G. F., Summerskill, W. H. J., & Go, V. L. W. (1976). 723
Measurement of Gastric Functions During Digestion of Ordinary Solid Meals in Man. 724
Gastroenterology, 70(2), 203-210. 725
Michalski, M.-C., & Januel, C. (2006). Does homogenization affect the human health 726
properties of cow's milk? Trends in Food Science & Technology, 17(8), 423-437. 727
Minekus, M., Alminger, M., Alvito, P., Ballance, S., Bohn, T., Bourlieu, C., Carriere, F., 728
Boutrou, R., Corredig, M., Dupont, D., Dufour, C., Egger, L., Golding, M., Karakaya, 729
S., Kirkhus, B., Le Feunteun, S., Lesmes, U., Macierzanka, A., Mackie, A., Marze, S., 730
McClements, D. J., Menard, O., Recio, I., Santos, C. N., Singh, R. P., Vegarud, G. E., 731
Wickham, M. S. J., Weitschies, W., & Brodkorb, A. (2014). A standardised static in 732
vitro digestion method suitable for food - an international consensus. Food & 733
function, 5(6), 1113-1124. 734
Miranda, G., & Pelissier, J.-P. (1987). Influence of heat treatment of bovine skim-milk on in 735
vivo digestion in rat stomach. Lait, 67(3), 365-377. 736
Morgan, F., Léonil, J., Mollé, D., & Bouhallab, S. (1999). Modification of Bovine β-737
Lactoglobulin by Glycation in a Powdered State or in an Aqueous Solution: Effect on 738
Association Behavior and Protein Conformation. Journal of Agricultural and Food 739
Chemistry, 47(1), 83-91. 740
Mulet-Cabero, A.-I., Rigby, N. M., Brodkorb, A., & Mackie, A. R. (2017). Dairy food 741
structures influence the rates of nutrient digestion through different in vitro gastric 742
behaviour. Food Hydrocolloids, 67, 63-73. 743
Sánchez-Rivera, L., Ménard, O., Recio, I., & Dupont, D. (2015). Peptide mapping during 744
dynamic gastric digestion of heated and unheated skimmed milk powder. Food 745
Research International, 77, Part 2, 132-139. 746
Sharma, S. K., & Dalgleish, D. G. (1993). Interactions between milk serum proteins and 747
synthetic fat globule membrane during heating of homogenized whole milk. Journal 748
of Agricultural and Food Chemistry, 41(9), 1407-1412. 749
Tam, J. J., & Whitaker, J. R. (1972). Rates and Extents of Hydrolysis of Several Caseins by 750
Pepsin, Rennin, Endothia parasitica Protease and Mucor pusillus Protease1. Journal 751
of Dairy Science, 55(11), 1523-1531. 752
Thomas, A. (2006). GastroGut motility, sphincters and reflex control. Anaesthesia & 753
Intensive Care Medicine, 7(2), 57-58. 754
Tunick, M. H., Ren, D. X., Van Hekken, D. L., Bonnaillie, L., Paul, M., Kwoczak, R., & 755
Tomasula, P. M. (2016). Effect of heat and homogenization on in vitro digestion of 756
milk. Journal of Dairy Science, 99(6), 4124-4139. 757
van Aken, G. A., Bomhof, E., Zoet, F. D., Verbeek, M., & Oosterveld, A. (2011). Differences 758
in in vitro gastric behaviour between homogenized milk and emulsions stabilised by 759
Tween 80, whey protein, or whey protein and caseinate. Food Hydrocolloids, 25(4), 760
781-788. 761
Wada, Y., & Lönnerdal, B. (2014). Effects of Different Industrial Heating Processes of Milk 762
on Site-Specific Protein Modifications and Their Relationship to in Vitro and in Vivo 763
Digestibility. Journal of Agricultural and Food Chemistry, 62(18), 4175-4185. 764

MANUSCRIP
T
ACCEPTED
ACCEPTED MANUSCRIPT
33
Ye, A., Cui, J., Dalgleish, D., & Singh, H. (2016). Effect of homogenization and heat 765
treatment on the behavior of protein and fat globules during gastric digestion of milk. 766
Journal of Dairy Science. 767
Ye, A., Cui, J., Dalgleish, D., & Singh, H. (2016). Formation of a structured clot during the 768
gastric digestion of milk: Impact on the rate of protein hydrolysis. Food 769
Hydrocolloids, 52, 478-486. 770
771

MANUSCRIP
T
ACCEPTED
ACCEPTED MANUSCRIPT

MANUSCRIP
T
ACCEPTED
ACCEPTED MANUSCRIPT

MANUSCRIP
T
ACCEPTED
ACCEPTED MANUSCRIPT

MANUSCRIP
T
ACCEPTED
ACCEPTED MANUSCRIPT

MANUSCRIP
T
ACCEPTED
ACCEPTED MANUSCRIPT

MANUSCRIP
T
ACCEPTED
ACCEPTED MANUSCRIPT

MANUSCRIP
T
ACCEPTED
ACCEPTED MANUSCRIPT

MANUSCRIP
T
ACCEPTED
ACCEPTED MANUSCRIPT
• Gastric digestion of milk was studied by a semi-dynamic model including emptying
• Milk homogenisation caused phase separation during in vitro gastric digestion
• Coagulation during in vitro gastric digestion was influenced by heat treatment
• The rate of nutrient emptying was affected by the gastric structural changes
• UHT treatment but not pasteurisation accelerated protein digestion in gastric phase