Structural Health Evaluation of Concrete Road Bridges – · PDF fileStructural Health...
17
Structural Health Evaluation of Concrete Road Bridges – an NDT Approach Amit GOEL * , Anant GUPTA ** , Rahul VERMA ** and Akshay Mihir DAS ** * Assistant Professor, JUIT (JUIT, Waknaghat, Solan, HP, India, 173234/[email protected]) ** Undergraduate Student, JUIT (JUIT, Waknaghat, Solan, HP, India, 173234/[email protected], [email protected],[email protected]) Abstract. For a good construction, safe operation and timely maintenance of any bridge structure, a comprehensive structural evaluation becomes necessary. For this purpose, any kind of destructive testing is highly undesirable. Non-destructive testing and evaluation (NDT&E) methods provide an ideal means for a quick testing and a comprehensive evaluation of different parameters related to the strength, durability and overall structural integrity of concrete bridges. Some of these parameters are the elastic modulus/ in-situ compressive strength, uniformity and homogeneity of concrete, presence of cracks, voids and other imperfections, identification of reinforcement profile, cover and diameter, etc. This paper presents the NDT&E of Indian Railways Road bridges. The various NDT&E methods utilized are presented, and the findings are mutually compared to highlight the effectiveness of a particular method in a specific situation or for a specific purpose. Introduction Structural condition evaluation of reinforced cement concrete structures may be performed generally for the estimation of its remaining service life, and choice of the rehabilitation measure to be adopted, if required. Ideally, such testing should be done without damaging the concrete. The tests available for condition evaluation of concrete, range from the completely non-destructive (where there is no damage to the concrete), to those where the concrete surface is slightly damaged, to destructive tests (where the surface has to be repaired after the test). Non-destructive testing and evaluation (NDT&E) technology provides ideal means to evaluate various structural condition parameters of a structure without affecting its functionality and serviceability. Different NDT&E methods employ different physical phenomenon such as, wave propagation (seismic, ultrasonic, electromagnetic, infra-red, acoustic), vibration, deflection, impulse rebound, electrical resistivity, electrical/thermal conductance, etc. to detect and identify any anomalies or deterioration in the test medium, which is otherwise not directly visible or identifiable. All these methods, in general, are based on measuring the response of the test medium to the applied stimulus, and using this information to characterize the medium’s geometrical and/or engineering properties [1,2,3]. Reinforced concrete structures like road over/under bridges, undergo a loss in structural integrity over time. This may be caused by inferior quality of construction or deterioration arising mainly from physical (overloading, fatigue, shrinkage, creep, honeycombing, abrasion, cavitation, frost action, etc.) and chemical (alkali–silica reaction, Civil Structural Health Monitoring Workshop (CSHM-4) - Lecture 14 Licence: http://creativecommons.org/licenses/by-nd/3.0
Transcript of Structural Health Evaluation of Concrete Road Bridges – · PDF fileStructural Health...

Structural Health Evaluation of Concrete
Road Bridges – an NDT Approach
Amit GOEL*, Anant GUPTA
**, Rahul VERMA
** and Akshay Mihir DAS
**
*Assistant Professor, JUIT (JUIT, Waknaghat, Solan, HP, India,
173234/[email protected]) **
Undergraduate Student, JUIT (JUIT, Waknaghat, Solan, HP, India,
173234/[email protected], [email protected],[email protected])
Abstract. For a good construction, safe operation and timely maintenance of any
bridge structure, a comprehensive structural evaluation becomes necessary. For this
purpose, any kind of destructive testing is highly undesirable. Non-destructive
testing and evaluation (NDT&E) methods provide an ideal means for a quick testing
and a comprehensive evaluation of different parameters related to the strength,
durability and overall structural integrity of concrete bridges. Some of these
parameters are the elastic modulus/ in-situ compressive strength, uniformity and
homogeneity of concrete, presence of cracks, voids and other imperfections,
identification of reinforcement profile, cover and diameter, etc. This paper presents
the NDT&E of Indian Railways Road bridges. The various NDT&E methods
utilized are presented, and the findings are mutually compared to highlight the
effectiveness of a particular method in a specific situation or for a specific purpose.
Introduction
Structural condition evaluation of reinforced cement concrete structures may be performed
generally for the estimation of its remaining service life, and choice of the rehabilitation
measure to be adopted, if required. Ideally, such testing should be done without damaging
the concrete. The tests available for condition evaluation of concrete, range from the
completely non-destructive (where there is no damage to the concrete), to those where the
concrete surface is slightly damaged, to destructive tests (where the surface has to be
repaired after the test).
Non-destructive testing and evaluation (NDT&E) technology provides ideal means
to evaluate various structural condition parameters of a structure without affecting its
functionality and serviceability. Different NDT&E methods employ different physical
phenomenon such as, wave propagation (seismic, ultrasonic, electromagnetic, infra-red,
acoustic), vibration, deflection, impulse rebound, electrical resistivity, electrical/thermal
conductance, etc. to detect and identify any anomalies or deterioration in the test medium,
which is otherwise not directly visible or identifiable. All these methods, in general, are
based on measuring the response of the test medium to the applied stimulus, and using this
information to characterize the medium’s geometrical and/or engineering properties [1,2,3].
Reinforced concrete structures like road over/under bridges, undergo a loss in
structural integrity over time. This may be caused by inferior quality of construction or
deterioration arising mainly from physical (overloading, fatigue, shrinkage, creep,
honeycombing, abrasion, cavitation, frost action, etc.) and chemical (alkali–silica reaction,
Civil Structural Health Monitoring Workshop (CSHM-4) - Lecture 14
Licence: http://creativecommons.org/licenses/by-nd/3.0

corrosion, carbonation, crystallization, salt chloride attack, expansion, leaching, acid action,
weathering, etc.) processes. A number of non-destructive testing (NDT) equipment are
available for the in-situ testing and subsequent assessment of various structural integrity
parameters of a reinforced concrete structure. The range of properties that can be assessed
using these tests include density, elastic modulus, strength, quality, surface hardness,
surface absorption, location of reinforcement, its size and distance from the surface,
corrosion, voids, delamination, cracks, etc [4,5].
Thus, a comprehensive structural evaluation of a concrete structure requires the use
of a number of different non-destructive testing and evaluation (NDT&E) methods. To
overcome the limitations of individual methods, a complementary approach can be adopted
whereby; different NDT&E methods are used at the same location to complement each
other in structural condition evaluation of the concrete member. The integration of such an
approach in structure management system should be able to provide information that helps
in assessment of the present structural condition, effectiveness of the maintenance measures
applied earlier, deterioration models, and the prognosis of further deterioration [2,3,4,6].
Further, a number of different NDT&E methods may be available for assessment of
a single condition parameter. Hence, it is desirable to have the ability to take informed
decisions regarding the choice of a particular method, which will be best suited for the
given test conditions (related to location, geometry and state of the structural component
being tested, etc.). This ability can be developed if the test data from each of the employed
methods is analyzed, and a relative comparison of effectiveness of these methods in
parameter estimation is made.
In this study, various non-destructive testing and evaluation methods are used to
estimate each of the various strength parameters of structural components of four concrete
road bridges, located at Railway Colony, Manak Nagar, Lucknow, India. To complement
the NDT&E, ground truth information is obtained by extracting core samples from the test
locations. The test data set from each of the employed methods is analyzed, and a relative
comparison of effectiveness of these methods in parameter estimation is made. This
comparison is based on various related aspects like accuracy and reliability, overall cost of
equipment and operation, comprehensiveness of the method to give detailed and varied
information, time and resources required, ease of operation of the equipment, and ease of
data analysis. Based on this comparison, the study provides suggestions to enable one to
take informed decisions regarding the choice of methods for estimation of relevant strength
parameters of concrete structural members.
2. Methods and equipment
In this section, various methods employed for NDT&E of concrete components of road bridges
have been described, along with their respective principles of working. The standard codes of
practice for these methods are also mentioned. The field techniques of conducting in-situ tests, and
the methodology employed have also been discussed.
The following equipment have been used in this study to determine the various parameters
related to the strength, durability and overall structural integrity of the super structure of the
concrete road bridge [1,6].
For in-situ compressive strength estimation of concrete:
-Analog Rebound Hammer, Digital Rebound Hammer, Cut And Pull Out Test, Core
Cutter, Penetration Resistance Test (Windsor Probe), Ultrasonic Pulse Velocity
meter.
For quality estimation of concrete:
-Permeability meter, Ultrasonic Pulse Velocity (UPV) meter
For examining the condition of reinforcement:
-Corrosion Analyzer (Half Cell Potentiometer), Resistivity meter
For identification of profile of reinforcement and measurement of cover:
-Profometer
For visual inspection and crack detection:
-Video Boroscope, Crack Detection Microscope
2.1 Estimation of compressive strength
Compressive Strength of a material is its ability to sustain axial compressive stress. A
variety of NDT&E methods are available to evaluate the compressive strength of a concrete
structural component. This section presents the compressive strength related NDT&E
methods and corresponding equipment that are used in this study. The underlying principle
for each method, working of equipment, etc. are discussed in details.
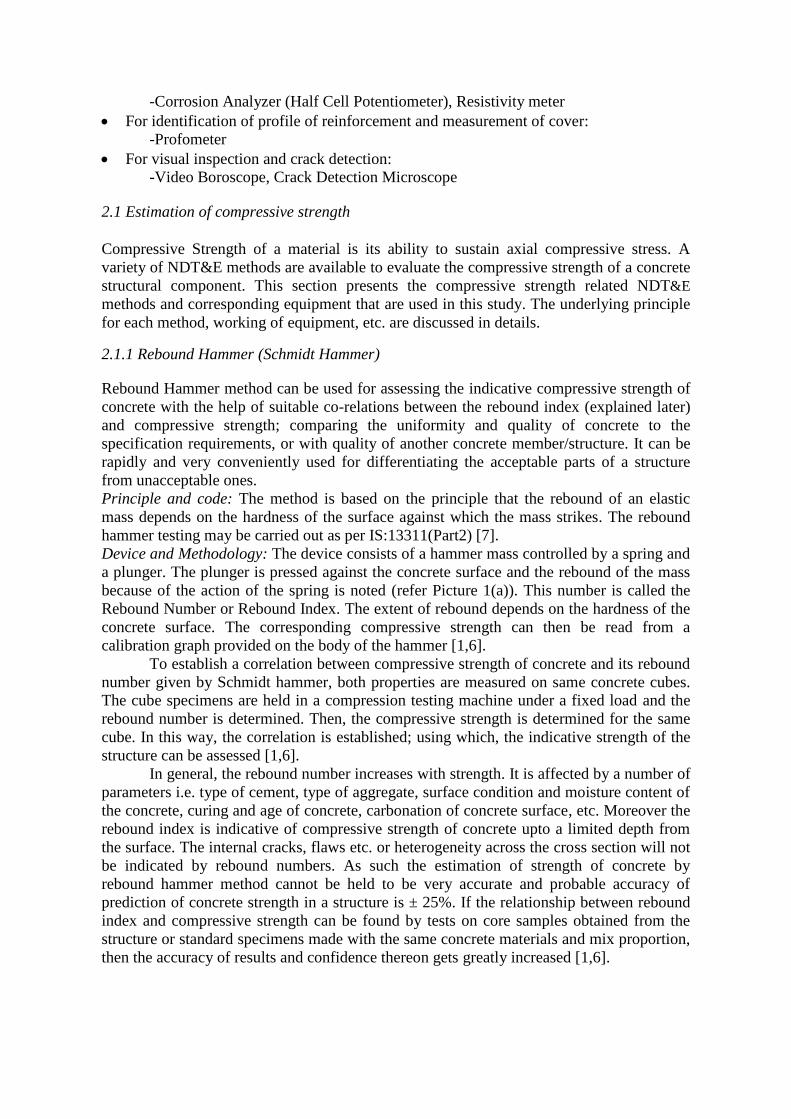
2.1.1 Rebound Hammer (Schmidt Hammer)
Rebound Hammer method can be used for assessing the indicative compressive strength of
concrete with the help of suitable co-relations between the rebound index (explained later)
and compressive strength; comparing the uniformity and quality of concrete to the
specification requirements, or with quality of another concrete member/structure. It can be
rapidly and very conveniently used for differentiating the acceptable parts of a structure
from unacceptable ones.
Principle and code: The method is based on the principle that the rebound of an elastic
mass depends on the hardness of the surface against which the mass strikes. The rebound
hammer testing may be carried out as per IS:13311(Part2) [7].
Device and Methodology: The device consists of a hammer mass controlled by a spring and
a plunger. The plunger is pressed against the concrete surface and the rebound of the mass
because of the action of the spring is noted (refer Picture 1(a)). This number is called the
Rebound Number or Rebound Index. The extent of rebound depends on the hardness of the
concrete surface. The corresponding compressive strength can then be read from a
calibration graph provided on the body of the hammer [1,6].
To establish a correlation between compressive strength of concrete and its rebound
number given by Schmidt hammer, both properties are measured on same concrete cubes.
The cube specimens are held in a compression testing machine under a fixed load and the
rebound number is determined. Then, the compressive strength is determined for the same
cube. In this way, the correlation is established; using which, the indicative strength of the
structure can be assessed [1,6].
In general, the rebound number increases with strength. It is affected by a number of
parameters i.e. type of cement, type of aggregate, surface condition and moisture content of
the concrete, curing and age of concrete, carbonation of concrete surface, etc. Moreover the
rebound index is indicative of compressive strength of concrete upto a limited depth from
the surface. The internal cracks, flaws etc. or heterogeneity across the cross section will not
be indicated by rebound numbers. As such the estimation of strength of concrete by
rebound hammer method cannot be held to be very accurate and probable accuracy of
prediction of concrete strength in a structure is ± 25%. If the relationship between rebound
index and compressive strength can be found by tests on core samples obtained from the
structure or standard specimens made with the same concrete materials and mix proportion,
then the accuracy of results and confidence thereon gets greatly increased [1,6].

2.1.2 Digital Rebound Hammer
The digital rebound hammer is an improvement over the Schmidt Hammer. It has a
microprocessor based transducer which converts the rebound of the hammer to electric
signals and displays it on the screen in the selected stress units. The device is capable of
storing multiple readings. It can directly displays the mean of the readings and can be
connected to a computer for data transfer and analysis in the field itself [1,6].
2.1.3 Cut and Pull Out Test
Cut And Pull Out (CAPO) test is a pull out test used to determine the compressive strength
of concrete. The test is considered superior to the rebound hammer and the penetration
resistance test, because large volume and greater depth of concrete are involved in the test.
Principle and code: A pull out test measures the force or load required to pull out an
embedded insert in the concrete mass. The test subjects concrete to slowly applied load and
measures actual strength property of the concrete. The ultimate pull out load is then used to
estimate the compressive strength based on previously established relationships. This test
may be conducted as per ASTM C900-01 [8] and BS 1881-207 [9].
Device and Methodology: The CAPO test measures the force required to pull an embedded
metal insert with an enlarged head from a concrete structure. The pull out strength is
proportional to (and equal to10-30%) the compressive strength of concrete and is of the
same order of magnitude as the direct shear strength of concrete [1,6].
Picture 1: (a) Digital rebound hammer test in progress, (b) Cut And Pull Out test in progress
The pullout test can be of two types: Pre-planned, where the metal inserts are cast
along with concrete and post-planned, whereby the Insert is fixed by under cutting and
subsequent expanding procedure in the hardened concrete of existing structures. The CAPO
test is of the latter type. While selecting the location for conducting a CAPO test, it should
be ensured that reinforcing bars are not within the failure region. The surface at the test
location should be flat. An 18 mm hole is cored perpendicular to the surface. A slot is
routed in the hole to a diameter of 25 mm and at a depth of 25 mm. A split ring is expanded
in the recess and pulled out using a loading ram reacting against a 55 mm diameter counter
pressure ring (refer Picture 1(b)). The concrete in the strut between the expanded ring and
the counter pressure ring is in compression. Hence ultimate pullout force is related directly
to compressive strength. When the insert is pulled out a conical frustum of concrete comes
along with it. The ultimate pullout load measured by the device is converted to an
equivalent compressive strength by means of previously established relationships [1,6].
a b
A good number of correlation studies have reported that compressive strength is
linear function of pull out strength [1,6].
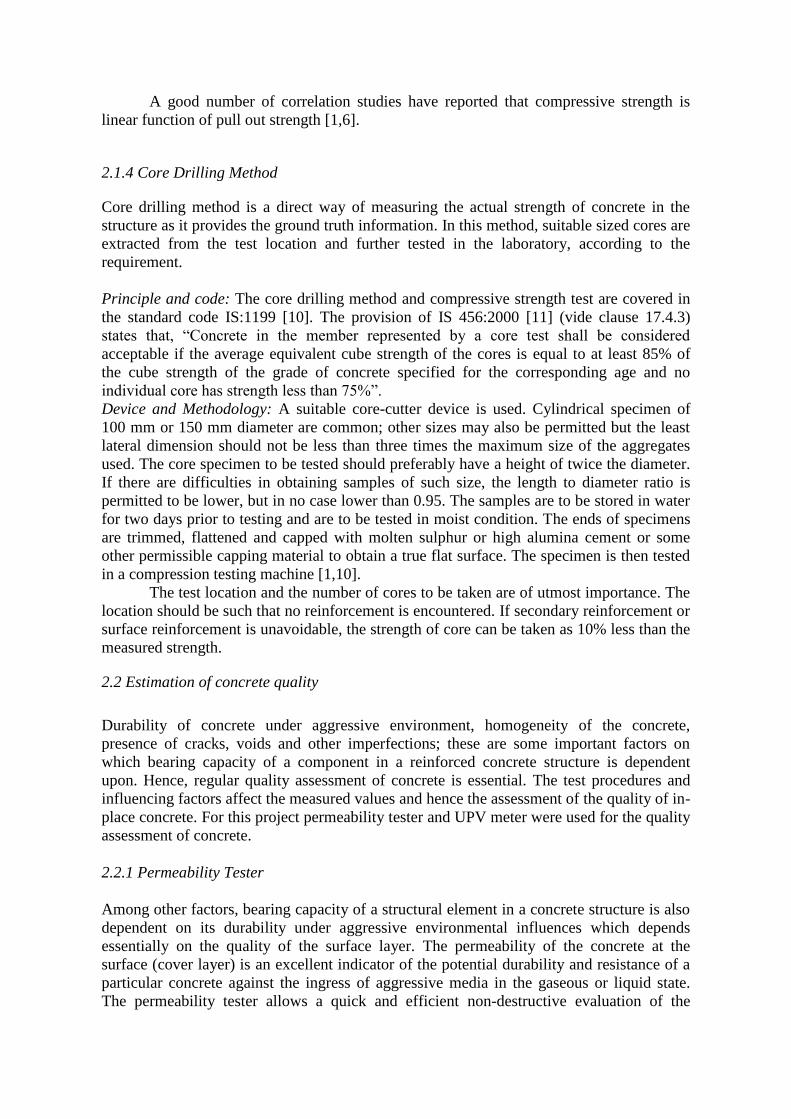
2.1.4 Core Drilling Method
Core drilling method is a direct way of measuring the actual strength of concrete in the
structure as it provides the ground truth information. In this method, suitable sized cores are
extracted from the test location and further tested in the laboratory, according to the
requirement.
Principle and code: The core drilling method and compressive strength test are covered in
the standard code IS:1199 [10]. The provision of IS 456:2000 [11] (vide clause 17.4.3)
states that, “Concrete in the member represented by a core test shall be considered
acceptable if the average equivalent cube strength of the cores is equal to at least 85% of
the cube strength of the grade of concrete specified for the corresponding age and no
individual core has strength less than 75%”.
Device and Methodology: A suitable core-cutter device is used. Cylindrical specimen of
100 mm or 150 mm diameter are common; other sizes may also be permitted but the least
lateral dimension should not be less than three times the maximum size of the aggregates
used. The core specimen to be tested should preferably have a height of twice the diameter.
If there are difficulties in obtaining samples of such size, the length to diameter ratio is
permitted to be lower, but in no case lower than 0.95. The samples are to be stored in water
for two days prior to testing and are to be tested in moist condition. The ends of specimens
are trimmed, flattened and capped with molten sulphur or high alumina cement or some
other permissible capping material to obtain a true flat surface. The specimen is then tested
in a compression testing machine [1,10].
The test location and the number of cores to be taken are of utmost importance. The
location should be such that no reinforcement is encountered. If secondary reinforcement or
surface reinforcement is unavoidable, the strength of core can be taken as 10% less than the
measured strength.
2.2 Estimation of concrete quality
Durability of concrete under aggressive environment, homogeneity of the concrete,
presence of cracks, voids and other imperfections; these are some important factors on
which bearing capacity of a component in a reinforced concrete structure is dependent
upon. Hence, regular quality assessment of concrete is essential. The test procedures and
influencing factors affect the measured values and hence the assessment of the quality of in-
place concrete. For this project permeability tester and UPV meter were used for the quality
assessment of concrete.
2.2.1 Permeability Tester
Among other factors, bearing capacity of a structural element in a concrete structure is also
dependent on its durability under aggressive environmental influences which depends
essentially on the quality of the surface layer. The permeability of the concrete at the
surface (cover layer) is an excellent indicator of the potential durability and resistance of a
particular concrete against the ingress of aggressive media in the gaseous or liquid state.
The permeability tester allows a quick and efficient non-destructive evaluation of the
quality of the concrete, with respect to its durability, by measuring the air permeability of
cover concrete.
Principle and code: The rate at which fluid flows through the concrete is a measure of its
permeability. The relevant codes of practice for this test are: ASTM C1202 [12] and BS
1881 [9].
Device and Methodology: The components of the device are: display unit, control unit,
vacuum cell, and vacuum pump. The method involves a two chamber vacuum cell and a
pressure regulator, which ensure that an air flow at right angles to the surface is directed
towards the inner chamber. This permits the calculation of the permeability coefficient (k)
on the basis of a simple theoretical model. The test requires a dry surface without any
cracks and it should be ensured that the inner chamber is not located above any
reinforcement bar. Pressure loss is calibrated on a timely basis. After a large change in
temperature and/or pressure, 3 to 6 measurements of electrical resistance of the concrete
and its mean value is taken for the measurement of coefficient of permeability. The unit
measures the pressure increase as a function of time according to a specific sequence. The
associated data is automatically collected by the display unit and the permeability
coefficient and the depth of penetration of the vacuum are calculated. The measurement
takes 2-12 minutes, depending on the permeability of the concrete. In the case of dry
concrete, the quality class of the concrete cover can be read from a table using the k value.
In the case of moist concrete, k is combined with the electrical concrete resistance (ρ) and
the quality class is determined from a monogram [1,6].
However, there are some limitations to this test. The determination of k and ρ
cannot be carried out on wet surfaces as the moisture entering the unit could damage the
membrane in the pressure regulator. In order to obtain an exact idea of the quality of the
cover concrete of a structure or of a finished component, several readings are necessary.
The quality classification of the cover concrete provided are generally for young concrete
and may not be applicable for old concrete. The corrections applied for the effect of
moisture content on the permeability, by the measurement of the electrical resistance,
generally leads to satisfactory results in the case of young concrete. For old concrete,
further investigations are required. Care should be taken to generate sufficient vacuum. If
the concrete cover is too permeable, the unit may not be able to reach the desired vacuum
[1,6].
2.2.2 Ultrasonic Pulse Velocity Meter (UPV)
The UPV method is used to establish the quality of the concrete used, value of dynamic
elastic constant of the concrete, homogeneity of the concrete, and presence of cracks, voids
and other imperfections. This test is useful for quality control during new constructions, and
also for periodic evaluation of a concrete member, to measure the changes occurring with
time on the properties of the concrete, and taking any remedial measure, against
deterioration, if necessary.
Principle and code: The UPV test is conducted as per IS: 1331-1992-Part1 [13]. The
inherent principle of assessing the quality of concrete is that relatively higher velocities are
obtained when the quality of concrete is good, in terms of density, homogeneity and
uniformity, rather than when quality of concrete is poor. Presence of a crack, void or flaw
inside the concrete, which comes in the way of transmission of the pulses, attenuates the
pulse strength and it passes around the discontinuity, thereby making the path length longer,
consequently, lower velocities are obtained [1,13,14].

Device and Methodology: UPV uses an ultrasonic pulse which is induced into the concrete
from an electroacoustic transducer, and undergoes multiple reflections at the boundaries of
different material phases within the concrete, developing a complex system of stress waves
which includes longitudinal (compressional), shear (transverse) and surface (Rayleigh)
waves. The receiving transducer detects the onset of the longitudinal waves, which are the
fastest. The velocity of the pulse depends on the elastic properties of the concrete.
Generally, a frequency of around 50 kHz is used for evaluation of concrete. The equipment
components used are: electrical pulse generator, display unit, transducers, amplifiers,
measuring range, and electronic timing device. The transducers can be mounted on the
surface of the concrete member under test, in the following ways: (a) direct (on opposite
faces), (b) semi-direct (two adjacent faces), and (c) indirect (both transducers on one face
only). The accuracy of velocity determination is governed by the accuracy of the path
length measurement. In direct transmission arrangement, the transfer of energy between
transducers is maximized. A minimum path length of 150 mm is recommended for the
direct transmission method involving one unmolded surface. The direct transmission
arrangement was used for this study [1,6,13,14]. Adequate acoustical coupling (e.g.
petroleum jelly, grease, liquid soap and kaolin glycerol paste) between the concrete and the
face of each transducer is used.
The ultrasonic pulse velocity of concrete is mainly related to the density and
modulus of elasticity of concrete, which in turn depends upon the material and mix
proportions used. They also depend on the method of placing, compaction and curing of
concrete, and the quality of concrete, in terms of uniformity, incidence or absence of
internal flaws, cracks and segregation, etc.
2.3 Assessment of reinforcement
For effective inspection and monitoring of concrete bridges, the condition assessment of
reinforcement is an important step. Even for deciding appropriate repair strategy for a
distressed concrete bridge, the determination of corrosion status of reinforcing bars is a
must. Most of the NDT&E methods used for corrosion assessment are based on
electrochemical process. For this project half cell potentiometer and resistivity meter were
employed for condition assessment of reinforcement.
2.3.1 Half Cell Potentiometer Test/Corrosion Analyzer
Electrochemical Half-cell Potentiometer test provides a quantitative assessment of
reinforcement corrosion over a wide area without the need of major removal of the concrete
cover. The method detects the likelihood of corrosion of steel but cannot indicate the rate of
corrosion. Distinction can be made between corroded and non-corroded locations by
making measurements over the whole surface.
Principle and code: It is covered by ASTM C876–91 [15].Corrosion analyzer is based on
electro-chemical process to detect corrosion in the reinforcement bars of structure. During
active corrosion, the steel-concrete system in the reinforced concrete element represents
short-circuited galvanic cell, with the corroding area of the reinforcement bar acting as the
anode, the passive surface as the cathode and concrete as electrolyte. The excess electrons
generated during corrosion flow through the concrete between anodic and cathodic sites,
generating current which is accompanied by an electric potential field surrounding the
corroding bar. The equipotential lines intersect the surface of the concrete and the potential
at any point can be measured using the half potential method.
Device and Methodology: Before starting the test, the test surface is made wet (this should
be done at least 45 minutes prior to conducting the test). To measure half-cell potentials, an
electrical connection is made, through a small drilled hole) to the steel reinforcement in the
concrete member to be tested. This is connected to a high impedance digital millivolt meter,
often backed up with a data logging device. The other connection to the millivolt meter is
taken to a copper/copper sulfate or silver/silver chloride half-cell, which has a porous
connection at one end which can be touched to the concrete surface. This will then register
the corrosion potential of the steel reinforcement nearest to the point of contact. By
measuring results on a regular grid and plotting results as an equipotential contour map,
areas of corroding steel may readily be seen [1,6].
2.3.2 Resistivity Test
This test is used to measure the electrical resistance of the cover concrete. This test is used
to assess the probability or likelihood of corrosion of the reinforcement bar.
Principle and code: It is covered by ASTM C1202–12 [12]. Once the reinforcement bar
loses its passivity, the corrosion rate depends on the availability of oxygen for the cathodic
reaction. It also depends on the concrete, which controls the ease with which ion migrates
through the concrete between anodic and cathodic site. Electrical resistance, in turn,
depends on the microstructure of the paste and the moisture content of the concrete. The
combination of resistance measurement by resistivity meter and potential measurement by
corrosion analyzing instrument give very reliable information about the corrosion condition
of the rebar. The resistivity increases as the capillary pore space in the paste is reduced, so
higher resistivity also indicates the good quality of concrete.
Device and Methodology: The test configuration includes four equally spaced electrodes
are electrically connected to the concrete surface (refer Figure 2). The outer electrodes are
connected to a source of alternating current, and the two inner electrodes are connected to
voltmeter. Before starting the test, the test surface is made wet (this should be done at least
45 minutes prior to conducting the test). One of the equipment available for measurement
of resistivity is Resistivity Meter. It consists of a set of four probes fitted with super
conductive foam tips to ensure full contact on irregular surfaces. Once the probes are kept
in contact with the concrete surface, the electronic display will indicate the resistivity
directly on the screen [1,6]. The equipment used for this test is a portable, battery operated,
four probe device which measures concrete resistivity. The corrosion of steel in concrete is
an electrochemical process, which generates a flow of current and can dissolve metals. The
lower the electrical resistance, the more readily the corrosion current flows through the
concrete and greater is the probability of corrosion. The resistivity is numerically equal to
the electrical resistance of a unit cube of a material and has units of resistance (in ohms)
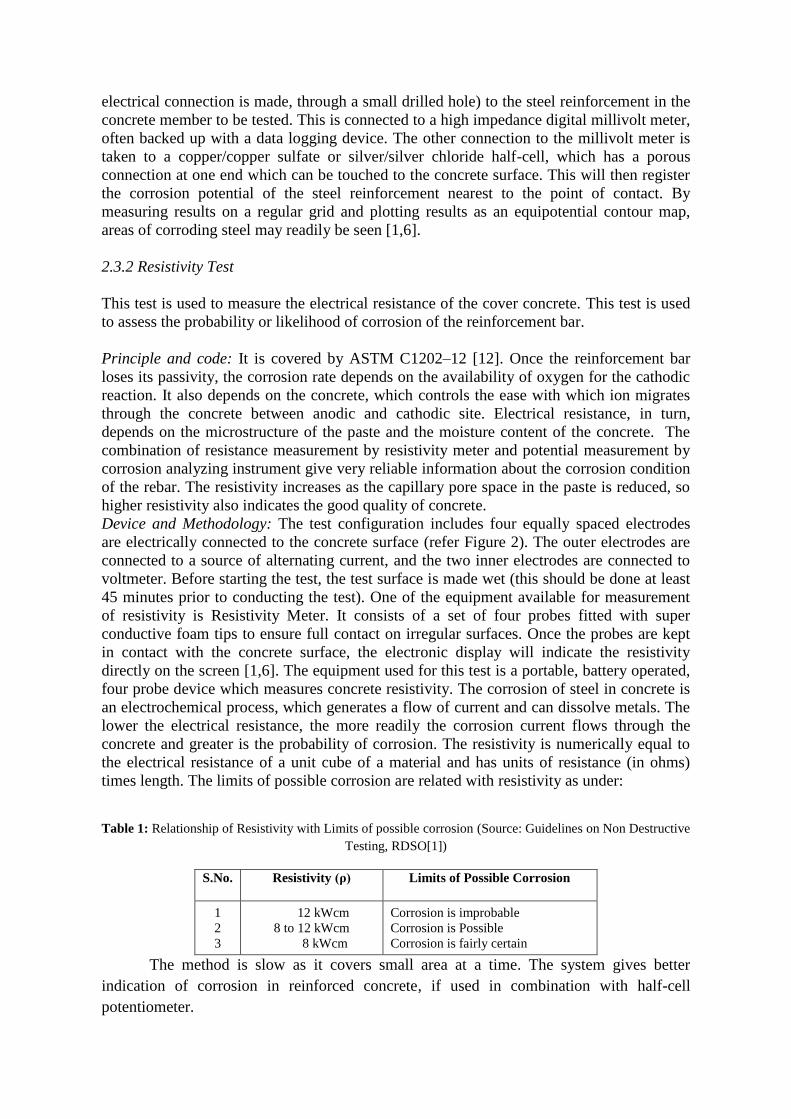
times length. The limits of possible corrosion are related with resistivity as under:
Table 1: Relationship of Resistivity with Limits of possible corrosion (Source: Guidelines on Non Destructive
Testing, RDSO[1])
S.No. Resistivity (ρ) Limits of Possible Corrosion
1
2
3
12 kWcm
8 to 12 kWcm
8 kWcm
Corrosion is improbable
Corrosion is Possible
Corrosion is fairly certain
The method is slow as it covers small area at a time. The system gives better
indication of corrosion in reinforced concrete, if used in combination with half-cell
potentiometer.

2.4 Identification of reinforcement profile and measurement of cover
In any reinforced concrete structure, an adequate cover is essential to prevent corrosion of
the reinforcement. For old structures, the reinforcement details may not be available due to
which the strength determination and hence the finalization of the strengthening scheme
becomes difficult. Sometimes, the bridges are to be checked from strength point of view to
permit higher axle load, and in absence of reinforcement details, it becomes very difficult to
take an informed decision. Also, during extraction of cores, layout of the reinforcement grid
is required. For these reasons, identification of reinforcement profile and measurement of
cover becomes indispensable.
2.4.1Profometer
It is used for detecting location and size of the reinforcement, and the concrete cover. This
instrument is also known as rebar locator.
Principle and code: The method is based on measurement of the change in electromagnetic
field caused by the steel embedded in the concrete. It is covered by BS 4408:1969-Part1
[16].
Device and Methodology: The device is a portable and handy instrument, normally used to
locate the reinforcement, with an electronic display. To ensure satisfactory working of
profometer and to get accurate results, it should be calibrated before starting the operations
and at the end of the test. To check the calibration accuracy, the size and cover of the
reinforcement of the test block is measured at different locations on test block and the
recorded data should match with the standard values prescribed on the test block. Path
measuring device and spot probes are together used for path measurements and scanning of
reinforcement bars. These are connected with profometer and are moved on the concrete
surface for scanning the reinforcement bars and measuring the spacing. Diameter and depth
probes are used in conjunction with the profometer to measure the diameter of rebar and its
concrete cover respectively [1,6].
For carrying out this test, proper access to the test section is essential. Before actual
scanning, marking is done with chalk on the concrete surface by dividing it into panels of
equal areas. The method is very fast and gives quite accurate results if the reinforcement is
not heavily congested. The equipment is light and a single person can perform the test.
2.5 Crack detection
Crack detection microscope and video boroscope are used for visual inspection and
determining the location and/or width of cracks and other anomalies visible from the
surface.
2.5.1 Crack Detection Microscope
It is a device designed for measuring the crack width in concrete or other materials. The
microscope is connected to an adjustable light source. The image is focused by turning the
knob at the side of the microscope and the eye piece graticule can be rotated through 3600
to align with the direction of the crack under examination. The 4 mm range of measurement

has least count of 0.02 mm. Current codes of practice state that the measured maximum
crack widths should not exceed certain values; e.g., 0.3 mm as per BS 8110: Part 2 [17], for
most types of environment. One has to place the scale of the microscope on the crack and
read the number of divisions and multiply it by the least count of the microscope to get the
crack width in millimeters [1,6].
The crack detection microscope is very easy to use. It can measure the width of fine
cracks (<1 mm). However, it can measure visible cracks only. Also, it cannot adequately
measure the depth of cracks.
2.5.2 Video Boroscope
A boroscope is used to look inside inaccessible or small voids. For example, if cable ducts
are not injected, it is possible to inspect the strands by means of an endoscope through a
contact drilling (here a drilled hole from the surface to the cable duct). The boroscope
equipment includes a lighting source and a fiber optic cable to transfer the light to the
boroscope. A system of lenses enables the boroscope to be used as a monocular. A camera
can also be mounted on the boroscope for photo documentation [1,6]. Generally, the
method is appropriate and may also be used for visual inspections of structural components
such as expansion joints, honeycombs and cracks/slots.
3. Results and Discussion
This section presents the results of the tests conducted for various components of the
concrete road bridges, located at four different test sites at Lucknow, India; namely, Site 1,
Site 2, Site 3 and Site 4, respectively. The tests were conducted at two different times,
firstly, in October 2011 (average ambient temperature range 19-32 °C), and secondly, in
April 2012 (average ambient temperature range 20-38 °C). Inferences are drawn from the
test results, which is helped by the experience of the authors as well as that of the NDT&E
engineers of the Research Design & Standards Organization (RDSO), Lucknow, Indian
Railways, in conducting these tests, and using the results in making informed decisions
regarding structural condition evaluation of concrete members of road bridges (over/under
of railway).
3.1 Estimation of Compressive Strength of concrete bridge components
Generally concrete cubes are cast and crushed in a compression testing machine to
determine their average compressive strength. Thus, performing tests on a concrete cube by
a chosen NDT&E method, and subsequently crushing it in a compression testing machine
(CTM), is a nearly accurate way of comparing the various NDT&E methods/equipment
available for compressive strength determination. As most of the non-destructive tests
cannot be performed on a 150 mm x 150 mm surface of the cube, so only rebound hammer
is used for direct comparison with compressive strength determined using CTM on the
same cubes. Figure 1 gives the comparison of CTM values with those got from digital and
analog rebound hammers (R-hammers). Thus, for comparing compressive strength values
estimated from other NDT&E methods to those got from the CTM, they can first be
compared to R-hammer values (since they are convenient and feasible to use almost
everywhere), and then Figure 1 can be used.
The indicative compressive strengths of concrete, obtained by using different NDT
equipment, at different site locations, are given in Tables 2 to 5. In Table 2, the average
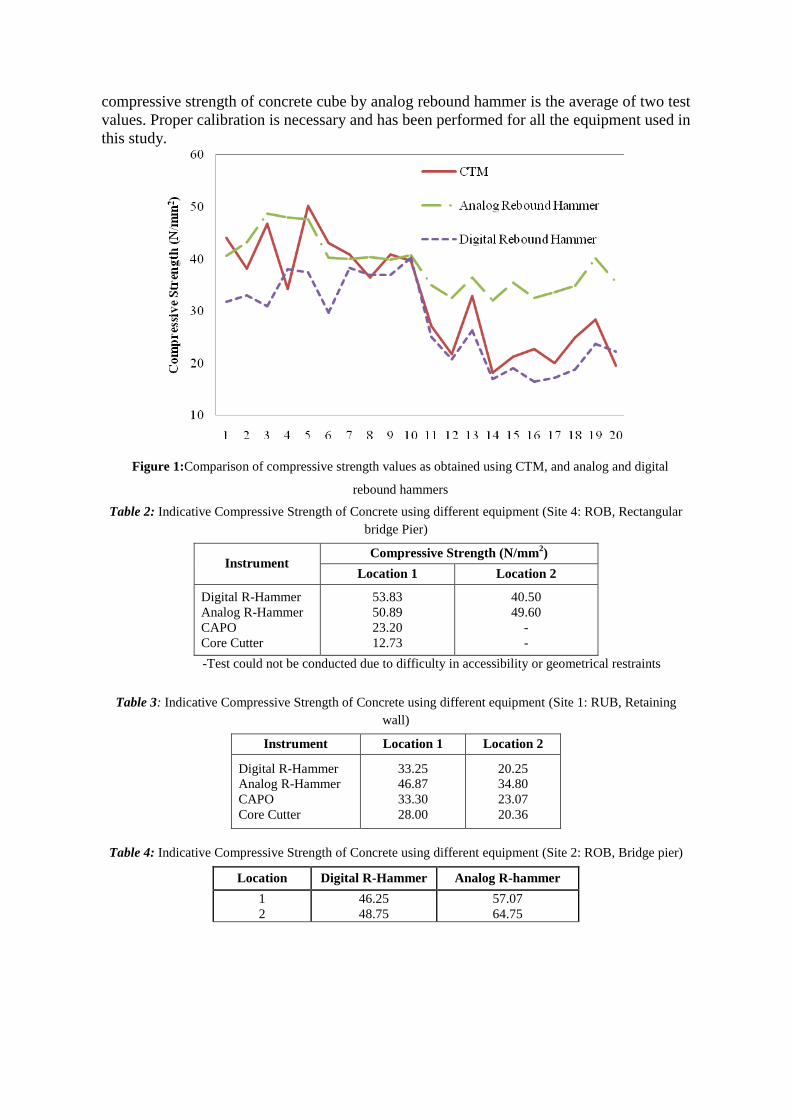
compressive strength of concrete cube by analog rebound hammer is the average of two test
values. Proper calibration is necessary and has been performed for all the equipment used in
this study.
Table 2: Indicative Compressive Strength of Concrete using different equipment (Site 4: ROB, Rectangular
bridge Pier)
Instrument Compressive Strength (N/mm
2)
Location 1 Location 2
Digital R-Hammer
Analog R-Hammer
CAPO
Core Cutter
53.83
50.89
23.20
12.73
40.50
49.60
-
-
-Test could not be conducted due to difficulty in accessibility or geometrical restraints
Table 3: Indicative Compressive Strength of Concrete using different equipment (Site 1: RUB, Retaining
wall)
Instrument Location 1 Location 2
Digital R-Hammer
Analog R-Hammer
CAPO
Core Cutter
33.25
46.87
33.30
28.00
20.25
34.80
23.07
20.36
Table 4: Indicative Compressive Strength of Concrete using different equipment (Site 2: ROB, Bridge pier)
Location Digital R-Hammer Analog R-hammer
1
2
46.25
48.75
57.07
64.75
Figure 1:Comparison of compressive strength values as obtained using CTM, and analog and digital
rebound hammers
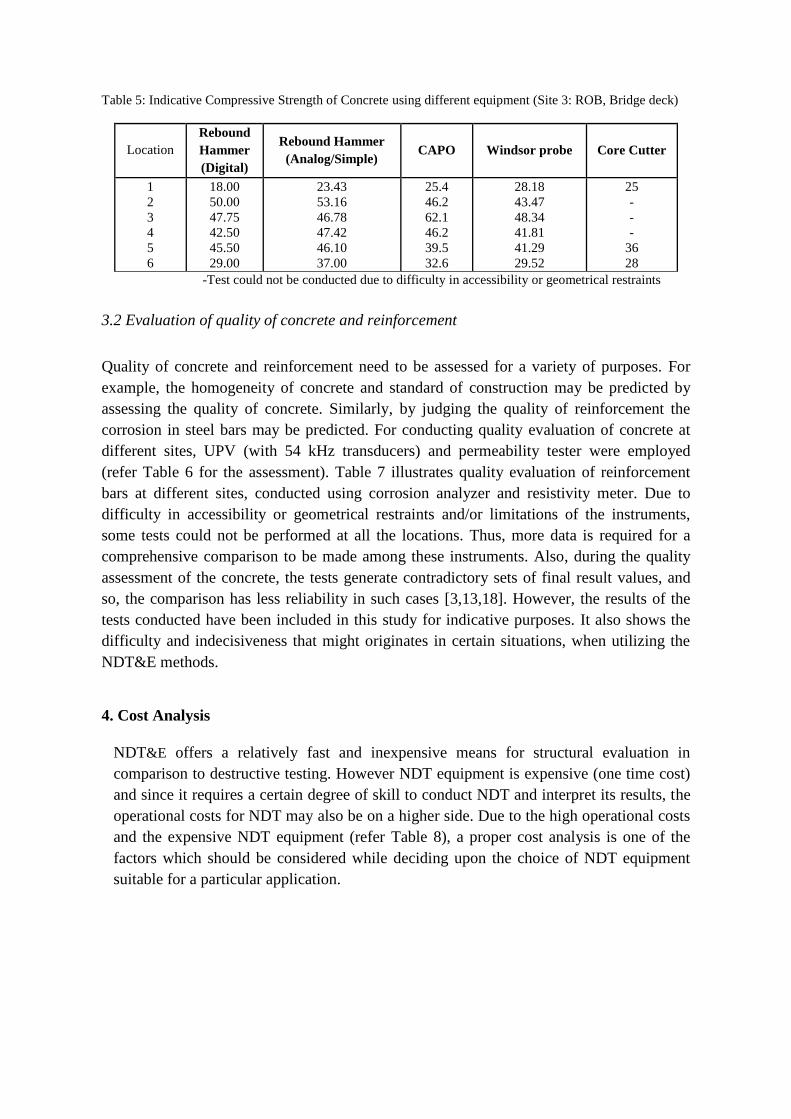
Table 5: Indicative Compressive Strength of Concrete using different equipment (Site 3: ROB, Bridge deck)
Location
Rebound
Hammer
(Digital)
Rebound Hammer
(Analog/Simple) CAPO Windsor probe Core Cutter
1
2
3
4
5
6
18.00
50.00
47.75
42.50
45.50
29.00
23.43
53.16
46.78
47.42
46.10
37.00
25.4
46.2
62.1
46.2
39.5
32.6
28.18
43.47
48.34
41.81
41.29
29.52
25
-
-
-
36
28
-Test could not be conducted due to difficulty in accessibility or geometrical restraints
3.2 Evaluation of quality of concrete and reinforcement
Quality of concrete and reinforcement need to be assessed for a variety of purposes. For
example, the homogeneity of concrete and standard of construction may be predicted by
assessing the quality of concrete. Similarly, by judging the quality of reinforcement the
corrosion in steel bars may be predicted. For conducting quality evaluation of concrete at
different sites, UPV (with 54 kHz transducers) and permeability tester were employed
(refer Table 6 for the assessment). Table 7 illustrates quality evaluation of reinforcement
bars at different sites, conducted using corrosion analyzer and resistivity meter. Due to
difficulty in accessibility or geometrical restraints and/or limitations of the instruments,
some tests could not be performed at all the locations. Thus, more data is required for a
comprehensive comparison to be made among these instruments. Also, during the quality
assessment of the concrete, the tests generate contradictory sets of final result values, and
so, the comparison has less reliability in such cases [3,13,18]. However, the results of the
tests conducted have been included in this study for indicative purposes. It also shows the
difficulty and indecisiveness that might originates in certain situations, when utilizing the
NDT&E methods.
4. Cost Analysis
NDT&E offers a relatively fast and inexpensive means for structural evaluation in
comparison to destructive testing. However NDT equipment is expensive (one time cost)
and since it requires a certain degree of skill to conduct NDT and interpret its results, the
operational costs for NDT may also be on a higher side. Due to the high operational costs
and the expensive NDT equipment (refer Table 8), a proper cost analysis is one of the
factors which should be considered while deciding upon the choice of NDT equipment
suitable for a particular application.

Table 6: Quality evaluation of concrete at different locations using UPV and permeability tester
Site/ Location
Quality assessment of concrete
UPV* Permeability Tester
Site 1: (RUB, Retaining Wall)
Site 2 (ROB, Bridge pier)
Site 3: Location 1
Site 3: Location 2
Site 3: Location 3
Site 3: Location 4
Site 3: Location 5
Site 3: Location 6
Site 4: (ROB 2, Rect. Bridge Pier)
Good
Excellent
-
-
Excellent
Excellent
-
-
Good
Bad
-
Bad
Bad
-
-
Bad
Bad
Very Bad
-Test could not be conducted due to difficulty in accessibility or geometrical restraints
* Excellent for P-wave velocity > 4500m/sec, Good for P-wave velocity 3500- 4500m/sec
Table 7: Quality evaluation of reinforcement at different locations using Corrosion Analyzer and Resistivity
Meter
Site/ Location
Quality assessment of reinforcement
Corrosion Analyzer Resistivity Meter
Site 1
Site 2
Site 3
Site 4
Corrosion is unlikely
-
Corrosion is unlikely
-
Corrosion is improbable
-
-
-
-Test could not be conducted due to difficulty in accessibility or geometrical restraints
Table 8: Approximate initial and operational costs of various test equipment
Equipment Cost of
equipment*(Indian
Rupees)
Approximate Operational
Cost*(Indian Rupees)
Relative
Overall
Cost
For Compressive Strength:
Rebound Hammer
Cut And Pull Out
Core Cutter
Compression Testing Machine
1,27,000
9,71,538
4,37,620
1,10,000
91,000(for 10 locations)
1,09,000(for 6 locations)
41,000(for 3 cores)
13,000(for 3 cubes)
Low
High
Medium
Low
For Quality Estimation:
Ultrasonic Pulse Velocity Meter
Permeability Meter
4,07,632
8,14,694
1,01,000 (for 10 locations)
85,000 (for 5 locations)
Low
High
For Reinforcement Profile and Concrete Cover:
Profometer 2,77,131 72,000 (for 10 locations) Not
applicable
For Visual Inspection:
Video Boroscope 14,23,858 1,06,000 (for 10 locations) High
*The costs of equipment have been obtained for year 2011; Operational costs are for year 2011,in accordance
with the information provided by RDSO.

4.1 Comparison of various methods
For the purpose of comparison amongst different NDT&E methods, various subjective
characteristics of these methods need to be considered. Since the purpose of conducting
any test is to obtain as accurate and reliable results as possible, this can be taken as the
basic and most important parameter. Cost and versatility are other parameters that need to
be accounted for in the comparison, from economic considerations. Also, time and the
resources required for a particular method, the ease with which the test equipment can be
operated, and the ease of data analysis are other important characteristics to be considered
[3,18,19,20]. The subjective comparative assessment of each of these characteristics for
the different methods utilized in this study is given in Table 9.
In order to quantify the aforementioned characteristics of different NDT&E
methods, suitable weightage (in the range of a value of 1 to 10 to represent unfavorable to
favourable condition, respectively) is assigned to each of these, according to its
comparative assessment (refer Table 10). Further, depending on the perceived
engineering importance of the characteristic, an importance factor is also allotted to it
(refer Table 10). The weightage and importance factors allotted are based on experience
gained by the authors while handling the NDT instruments on the field, as well as the
engineering judgement of the NDT&E engineers of the RDSO. Making use of these
assigned weightage and importance factors, the relative importance of each of the
NDT&E method can be determined quantitatively using Eq. 1, and further used for the
quantitative comparison of NDT&E methods (refer Table 11).
Table 9: Comparative assessment of NDT equipment used
Equipment
Comparative Assessment
Accuracy
&
Reliability
Cost Versatility Ease of
Operation
Ease of
Analysis
Time &
Resources
required
For Compressive Strength:
Rebound -
Hammer
CAPO
Core-cutter
Windsor-
Probe
Medium
High
High
High
Low
High
Medium
High
Low
Low
Medium
Low
Easy
Difficult
Difficult
Difficult
Easy
Moderate
Moderate
Moderate
Low
High
High
High
For Quality Assessment Of Concrete:
UPV
Permeability-
tester
High
Medium
Low
High
High
Low
Difficult
Difficult
Difficult
Difficult
Low
Moderate
For Visual Inspection:
Video-
Boroscope
Crack-
Detection-
microscope
High
Medium
High
Low
Medium
Low
Difficult
Easy
Difficult
Easy
High
Low
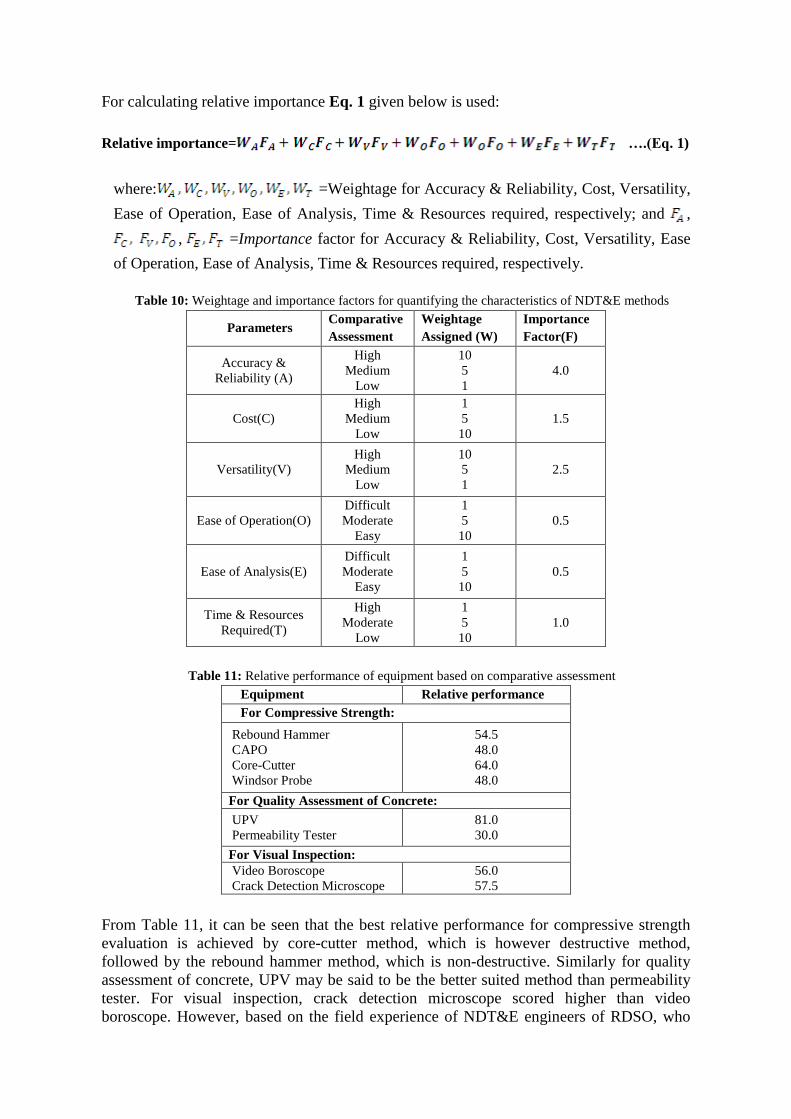
For calculating relative importance Eq. 1 given below is used:
Relative importance= ….(Eq. 1)
where: =Weightage for Accuracy & Reliability, Cost, Versatility,
Ease of Operation, Ease of Analysis, Time & Resources required, respectively; and ,
, =Importance factor for Accuracy & Reliability, Cost, Versatility, Ease
of Operation, Ease of Analysis, Time & Resources required, respectively.
Table 10: Weightage and importance factors for quantifying the characteristics of NDT&E methods
Parameters Comparative
Assessment
Weightage
Assigned (W)
Importance
Factor(F)
Accuracy &
Reliability (A)
High
Medium
Low
10
5
1
4.0
Cost(C)
High
Medium
Low
1
5
10
1.5
Versatility(V)
High
Medium
Low
10
5
1
2.5
Ease of Operation(O)
Difficult
Moderate
Easy
1
5
10
0.5
Ease of Analysis(E)
Difficult
Moderate
Easy
1
5
10
0.5
Time & Resources
Required(T)
High
Moderate
Low
1
5
10
1.0
Table 11: Relative performance of equipment based on comparative assessment
Equipment Relative performance
For Compressive Strength:
Rebound Hammer
CAPO
Core-Cutter
Windsor Probe
54.5
48.0
64.0
48.0
For Quality Assessment of Concrete:
UPV
Permeability Tester
81.0
30.0
For Visual Inspection:
Video Boroscope
Crack Detection Microscope
56.0
57.5
From Table 11, it can be seen that the best relative performance for compressive strength
evaluation is achieved by core-cutter method, which is however destructive method,
followed by the rebound hammer method, which is non-destructive. Similarly for quality
assessment of concrete, UPV may be said to be the better suited method than permeability
tester. For visual inspection, crack detection microscope scored higher than video
boroscope. However, based on the field experience of NDT&E engineers of RDSO, who

regularly perform NDT&E for concrete bridge members, the video boroscope may be a
better option for visual inspection, considering the ease of use and time taken, etc.
Based on experience of the authors in conducting field tests using various NDT&E
methods, some guidelines are suggested for effective testing that minimizes the test
constraints. These are: (a) Equipment like permeability tester and core cutter need constant
supply of electricity, which is one of the principal requirements. If such tests are to be
performed, then electric supply (like a portable generator) should be arranged prior to the
commencement of the testing; (b) For condition assessment of the reinforcement, authors
used corrosion analyzer and resistivity meter during the field tests. For both the tests, it is
essential that the surface, on which the tests are being conducted, should be moist, to
complete the circuit necessary for a valid measurement. This was done by using wet gunny
sacks. Due to high test temperature, at some of the sites, the surface was not moist enough.
So at those sites, tests could not be performed. Hence, the tests may be performed during
early morning or late evening hours, so that the change in temperature during the period of
testing, and overall rise in the temperature value is low. This suggestion is also valid for the
tests where the test data can be affected by temperature, for example UPV testing. Further, a life cycle cost analysis can be performed for various non-destructive
testing and evaluation methods so that more informed decision can be made while selecting
a particular method. More test data is required for a comprehensive comparison of various
NDT&E methods. Effect of temperature should also be included in the test results and
comparisons, for which test data is required at a range of test temperatures.
4. Conclusion
In this study, various non-destructive condition evaluation methods have been studied and
they have been used in the field testing of reinforced cement concrete bridge members.
Based on the data collected by the authors by performing numerous tests on four different
sites, comparison have been made among various NDT equipments available for
determining a particular parameter. Some of the NDT&E methods provided assessment of
concrete deterioration at relatively high speeds of data collection. Whereas, some methods
worked at lower testing speeds but gave high accuracy in results. Also based on these
comparisons, suggestions have been made to help future NDT&E users in selecting the
most appropriate equipment for the given test site and purpose of testing.
For in-situ compressive strength evaluation under field conditions, for an indicative
assessment, the appropriate method to be used may be the rebound hammer method, due to
its simplicity in operation and data interpretation. Also, the time and resources required for
performing rebound hammer tests are less in comparison to other equipment. However, for
core cutter method, the results are based on crushing of concrete cores, which are extracted
from the site, in the laboratory environment, using the compression testing machine. For
quality assessment of concrete, ultrasonic pulse velocity may be the best suited method due
its relative simplicity in operation, low resources required and higher versatility and
accuracy. For visual inspection, based on the field experience (of authors and NDT&E
engineers of RDSO), the better suited method is video boroscope.
Acknowledgement
The authors gratefully acknowledge the Research Design & Standards Organization
(RDSO), Lucknow, Indian Railways, for providing us with the laboratory space and all the
NDT equipment necessary for the testing involved in this study. The help provided by the
NDT&E engineers from RDSO, with their deep insight in the field testing and evaluation

procedures, as well as sharing their extensive field experience, is highly appreciated. The
authors are also thankful to the Jaypee University of Information Technology, Solan, India,
for providing this unique opportunity and all the necessary support and help for successful
completion of this study.
References
[1] RDSO,“Guidelines on Non-Destructive Testing of Bridges”, Indian Railways, 2009. [2] Gucunski, N., Romero, F., Kruschwitz, S., Feldmann, R., Abu-Hawash, A., and Dunn, M. “Multiple
Complementary Nondestructive Evaluation Technologies for Condition Assessment of Concrete
Bridge Decks” Transportation Research Record: Journal of the Transportation Research Board, No.
2201, Washington, D.C., 2010.
[3] Goel, A. and Das, A., “Non-destructive testing of asphalt pavements for structural condition
evaluation - A state of the art”, Nondestructive Testing and Evaluation, Taylor and Francis, U.K.,
Vol. 23(2), 2008.
[4] Kevin L.R., Terry J.W., and Klaiber, F.W. “Review of Nondestructive Evaluation Techniques of Civil
Infrastructure”, Paper No. 12858, Journal of Performance of Constructed Facilities, Vol. 11, No.4,
November, 1997.
[5] Shetty, M.S. Concrete technology - Theory and practice. S. Chand & Company Ltd. New Delhi,
India, 2005.
[6] International Atomic Energy Agency; “Guidebook on non-destructive testing of concrete structures”,
Training Course Series No. 17, Industrial Applications and Chemistry Section, 2002.
[7] IS: 13311-1992-Part2; “Non-Destructive Testing of Concrete - Methods of Test, Part 2 – Rebound
Hammer”, Bureau of Indian Standards, New Delhi, India, 1992.
[8] ASTM C900-01, “Standard Test Method for Pullout Strength of Hardened Concrete”; ASTM, USA,
“http://www.astm.org/Standards/C900.htm”, (last visited May, 2012).
[9] BS 1881-207:1992, “Testing concrete-Recommendations for the assessment of concrete strength by
near-to-surface tests”, BSI, British Standards Institution, UK, 1992.
[10] IS: 1199-1959; “Methods of Sampling and Analysis of Concrete”, Bureau of Indian Standards, New
Delhi, India, 1959.
[11] IS 456: 2000; “Plain and Reinforced Concrete - Code of Practice”, clause 17.4.3, Bureau of Indian
Standards, New Delhi, India, 2000.
[12] ASTM C1202 – 12,” Standard Test Method for Electrical Indication of Concrete's Ability to Resist
Chloride Ion Penetration”, ASTM, USA, “http://www.astm.org/Standards/C1202.htm”, (last visited
August, 2012).
[13] IS: 13311-1992-Part1; “Non-Destructive Testing of Concrete - Methods of Test, Part 1 - Ultrasonic
Pulse Velocity”, Bureau of Indian Standards, New Delhi, India, 1992.
[14] BS 1881-203:1986; “Testing concrete - Recommendations for measurement of velocity of ultrasonic
pulses in concrete”, BSI, British Standards Institution, UK, 1986.
[15] ASTM C876 – 09, “Standard Test Method for Corrosion Potentials of Uncoated Reinforcing Steel in
Concrete”, ASTM, USA, “http://www.astm.org/Standards/C876.htm”, (last visited August, 2012).
[16] BS 4408:1969-Part1, “Recommendations for non-destructive methods of test for concrete - metric
units- Electromagnetic cover measuring devices”, British Standards Institution, UK, 1969.
[17] BS 8110:1985; “RC Crack Width Calculation, Part-2”, British Standards Institution, UK, 1985.
[18] Breysse, D., Larget, M., Sbartai, Zoubir M., Lataste, Jean-Fr., and Balayssac, Jean-P.“Quality of
NDT measurements and accuracy of concrete physical properties”, Non-Destructive Testing in Civil
Engineering conference, Nantes, 2009.
[19] Veshosky, D., Beidleman, Carl R., Buetow, Gerald W., and Demir, M., “Comparative Analysis of
Bridge Superstructure Deterioration”, PaperNo. 6204, Journal of Structural Engineering, Vol. 120,
No.7, July, 1994.
[20] Breysse, D., Soutsos, M., Felicetti, R., Krause, M., Lataste, Jean-F., and Moczko, A. “How to
improve the quality of concrete assessment by combining several NDT measurements”, Non-
Destructive Testing in Civil Engineering conference, Nantes, 2009.