Structural Genomics aims in identifying as many new folds as possible.
91
Macromolecular Crystallography and Structural Genomics – Recent Trends Prof. D. Velmurugan Department of Crystallography and Biophysics University of Madras Guindy Campus, Chennai – 25.
-
Upload
brendan-powers -
Category
Documents
-
view
30 -
download
0
description
Macromolecular Crystallography and Structural Genomics – Recent Trends Prof. D. Velmurugan Department of Crystallography and Biophysics University of Madras Guindy Campus, Chennai – 25. Structural Genomics aims in identifying as many new folds as possible. - PowerPoint PPT Presentation
Transcript of Structural Genomics aims in identifying as many new folds as possible.

Macromolecular Crystallography and
Structural Genomics – Recent Trends
Prof. D. Velmurugan
Department of Crystallography and BiophysicsUniversity of Madras
Guindy Campus, Chennai – 25.

• Structural Genomics aims in identifying as many new folds as possible.
• This eventually requires faster ways of determining the three dimensional structures as there are many sequences before us for which structural information is not yet available.
• Although Molecular Replacement technique is still used in Crystallography for solving homologous structures, this method fails if there is not sufficient percentage of homology.
• The Multiwavelength Anomalous Diffraction (MAD) techniques have taken over the conventional Multiple Isomorphous Replacement (MIR) technique.

• With the advent of high energy synchrotron sources and powerful detectors for the diffracted intensities, developments in methodologies of macromolecular structure determination, there is a steep increase in the number of macromolecular structures determined and on an average eight new structures are deposited in the PDB every day and the total entries in the PDB is now around 29,000.
• Instead of using the three wavelength strategies in MAD experiments, the use of single wavelength anomalous diffraction using Sulphur anomalous scattering is recently proposed. This will reduce the data collection time to 1/3rd.
• Also, the judicious use of the radiation damage during redundant data measurements in second generation synchrotron source and also during regular data collection in the third generation synchrotron source has been pointed out recently (RIP & RIPAS).
Protein Structure Determination
• X-ray crystallography
• NMR spectroscopy
• Neutron diffraction
• Electron microscopy
• Atomic force microscopy

As the number of available amino acid sequences exceeds far in number than the
number of available three-dimensional structures, high-throughput is essential in
every aspect of X-ray crystallography.


Procedure
Protein Crystal


The 14 Bravais lattices
1: Triclinic 2: Monoclinic
(Blue numbers correspond o the crystal system)
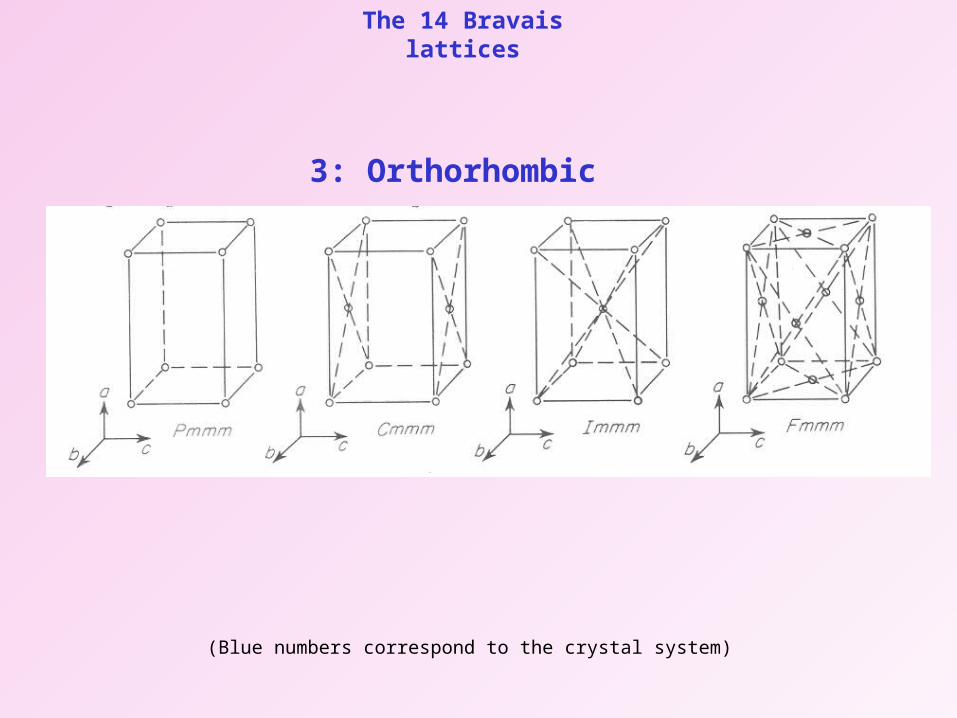
The 14 Bravais lattices
3: Orthorhombic
(Blue numbers correspond to the crystal system)

The 14 Bravais lattices
4: Rhombohedral 5: Tetragonal 6: Hexagonal
(Blue numbers correspond to the crystal system)

The 14 Bravais lattices
7: Cubic
(Blue numbers correspond to the crystal system)


Synchrotron radiationMore intense X-rays at shorter wavelengths mean higher resolution & much quicker data collection


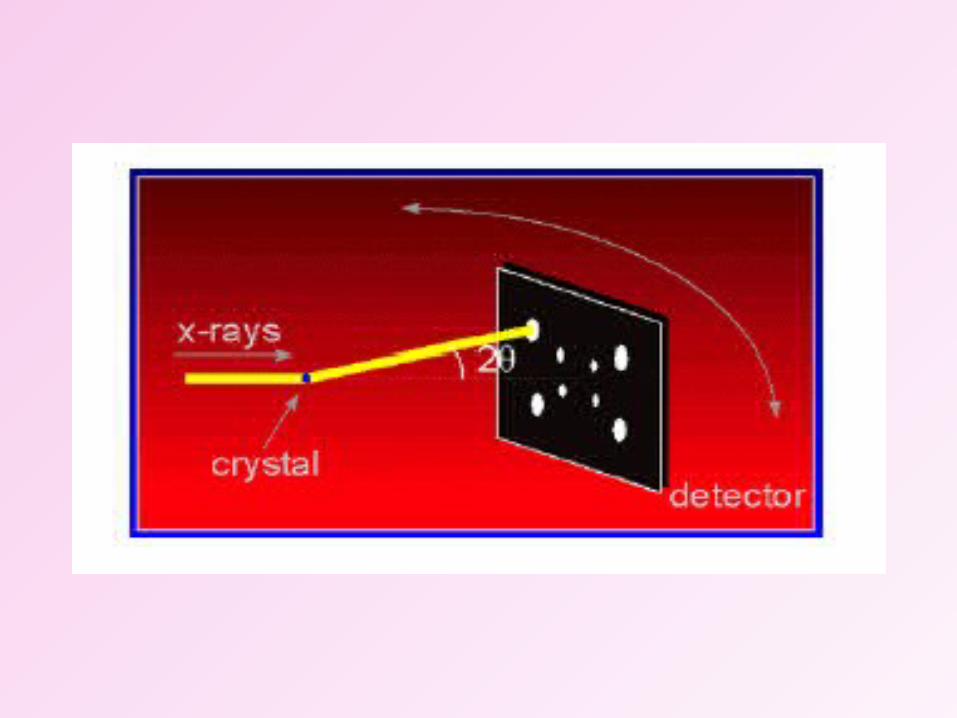
Diffraction Apparatus

Diffraction Principles
n= 2dsin

The diffraction experimentThe diffraction experiment

The structure factor magnitude F(hk/) is represented by the length of a vector in the complex plane.
The phase angle a(hk/) is given by the angle. measured counterclockwise, between the positive real axis and the vector F.
The amplitudes of the waves scattered by an atom to that of an single electron – atomic scattering factor
The amplitude of the waves scattered by all the atoms in a unit cell to that of a single electron (The vector (amplitude and phase) representing the overall
scattering from a particular set of Bragg planes) | Fhkl | – structure factor
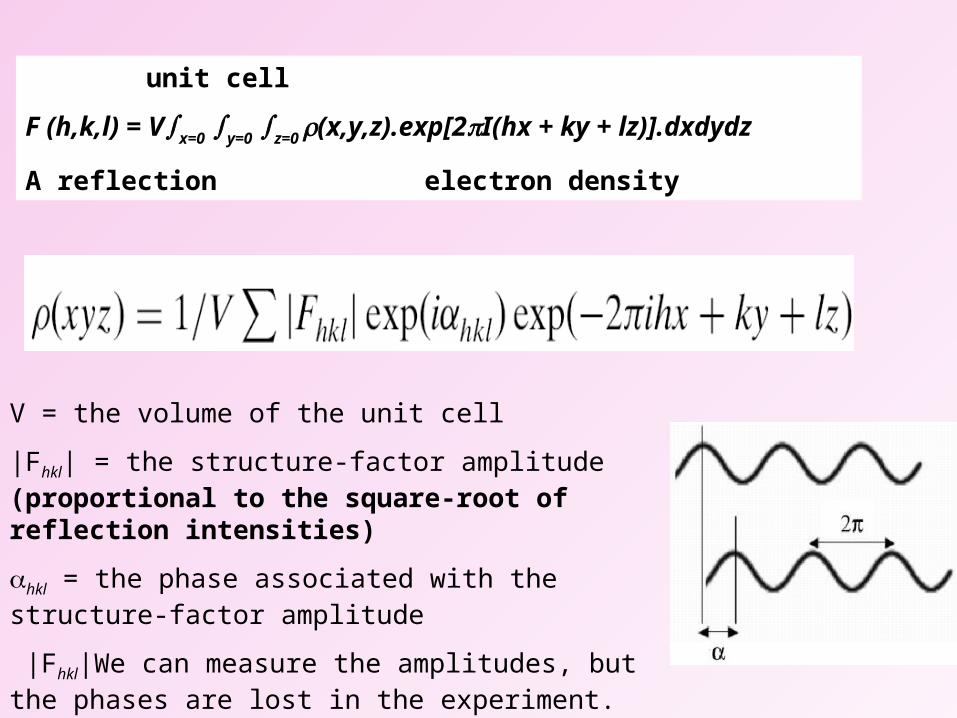
V = the volume of the unit cell
|Fhkl| = the structure-factor amplitude (proportional to the square-root of reflection intensities)
hkl = the phase associated with the structure-factor amplitude
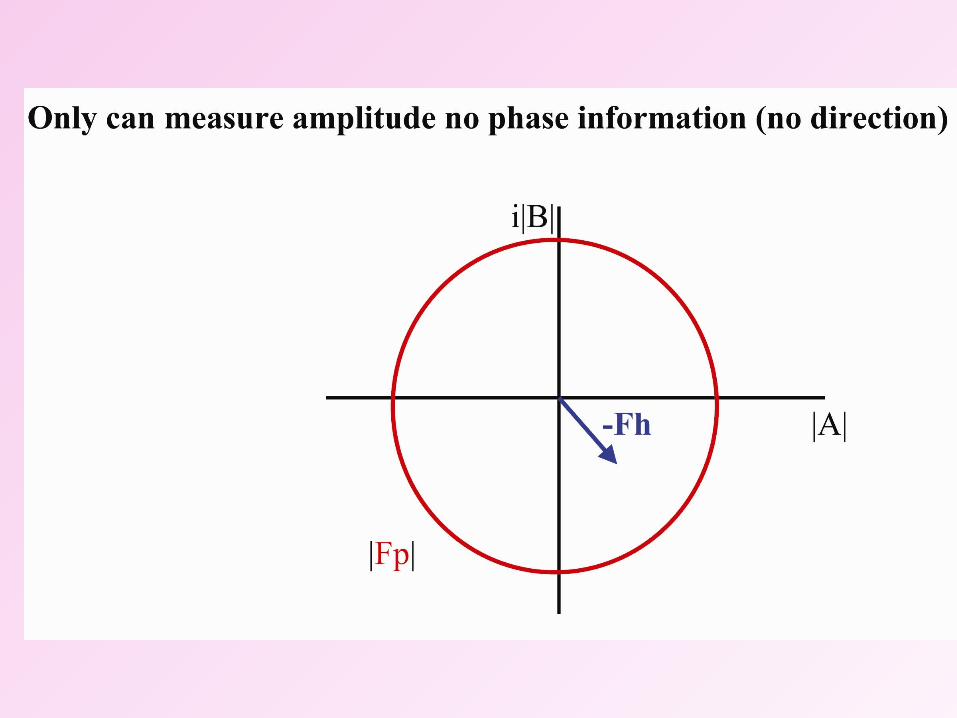
|Fhkl|We can measure the amplitudes, but the phases are lost in the experiment.
This is the phase problem.
unit cell
F (h,k,l) = Vx=0 y=0 z=0 (x,y,z).exp[2I(hx + ky + lz)].dxdydz
A reflection electron density
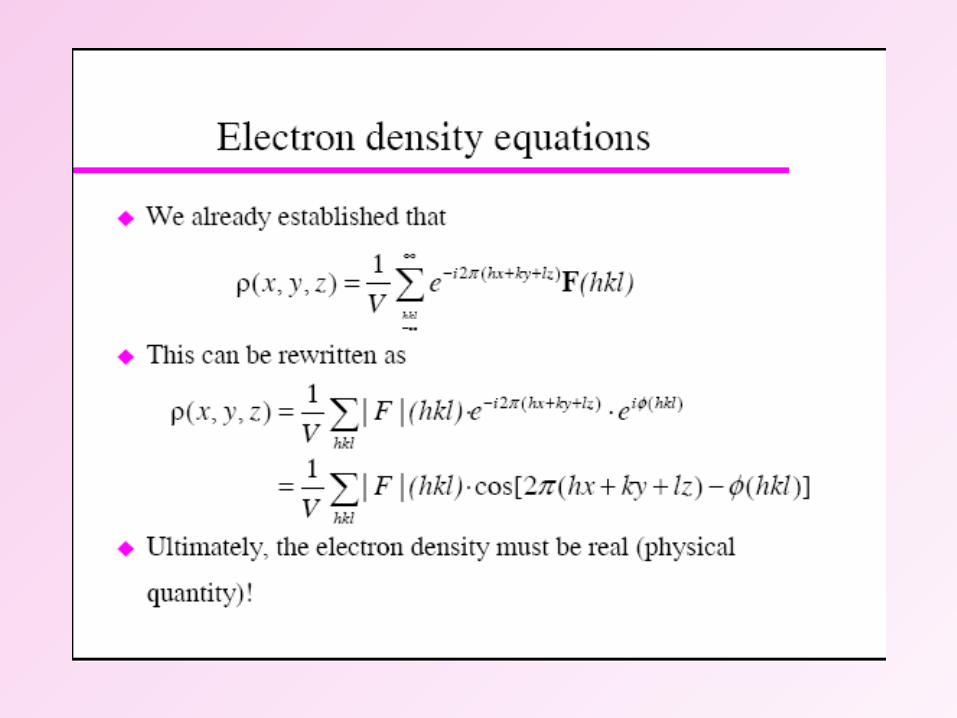

Fourier Transform requires both structure factors and phases
Σ Σ Σ π αρ
Unknown
Electron density calculation


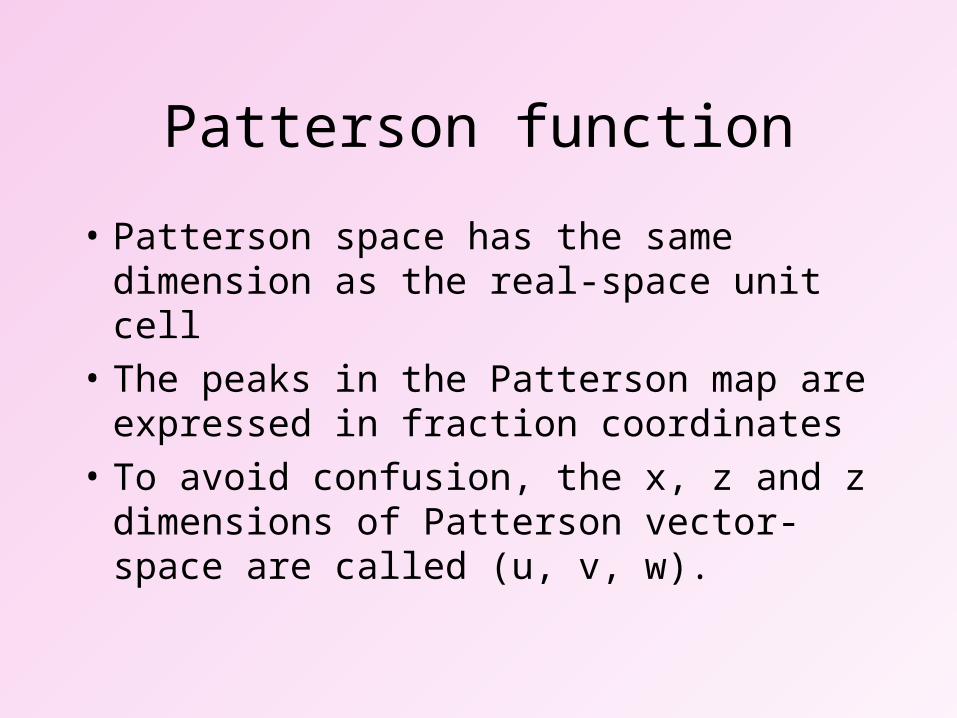
Patterson function
• Patterson space has the same dimension as the real-space unit cell
• The peaks in the Patterson map are expressed in fraction coordinates
• To avoid confusion, the x, z and z dimensions of Patterson vector-space are called (u, v, w).

What does Patterson function represent?
• It represents a density map of the vectors between scattering atoms in the cell
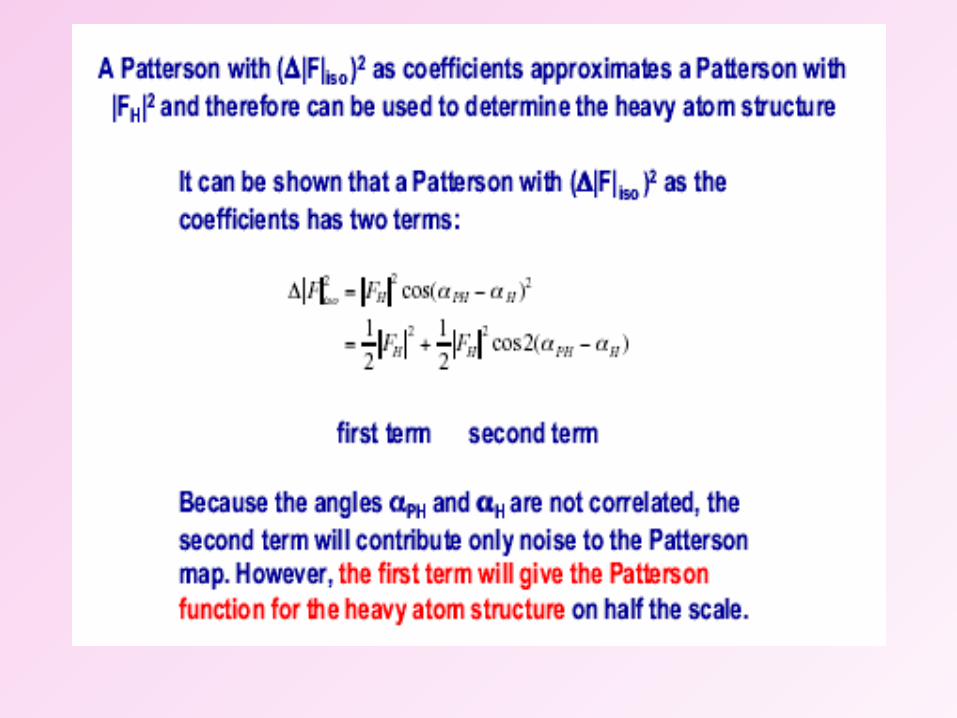
• Patterson density is proportional to the squared term of scattering atoms, therefore, the electron rich, i.e., heavy atoms, contribute more to the patterson map than the light atoms.
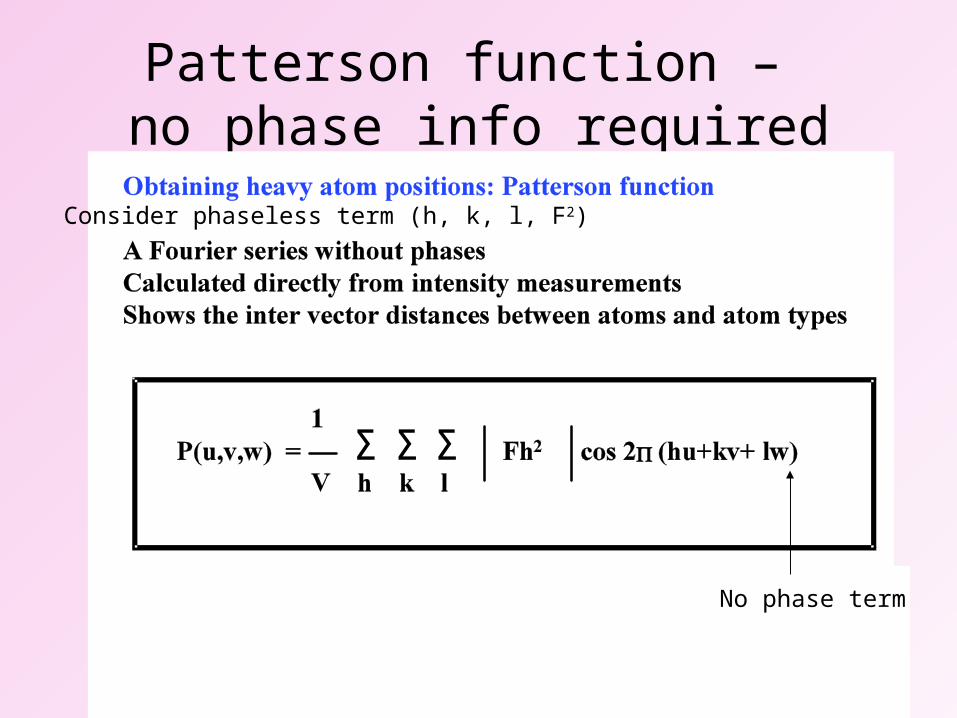
Patterson function – no phase info required
Σ Σ Σ
Consider phaseless term (h, k, l, F2)
No phase term

Patterson mapF
ourie
rtr
ansf
orm
atio
n
Reciprocal space
Direct space
Densityand
position
r = hkl F (S) exp (-2i{r.S})
F (S) = cell r exp (2i{r.S}) d3r
Amplitudesand
phases
Fourier
transformation
Intensities
Pu = hkl I (S) exp (-2i{u.S})
Pattersonmap
I(S)=F*(S).F(S)=|F(S)|2
P(u) = cell rr+u d3r

Patterson map symmetry
r = hkl F (S) exp (-2i{r.S})
Pu = hkl I (S) exp (-2i{u.S})
P(u) = cell rr+u d3r
P21
x, y, z-x, y+1/2, -z
Patterson map with symmetry
Harker vectors
u, v, w2x, 1/2, 2z


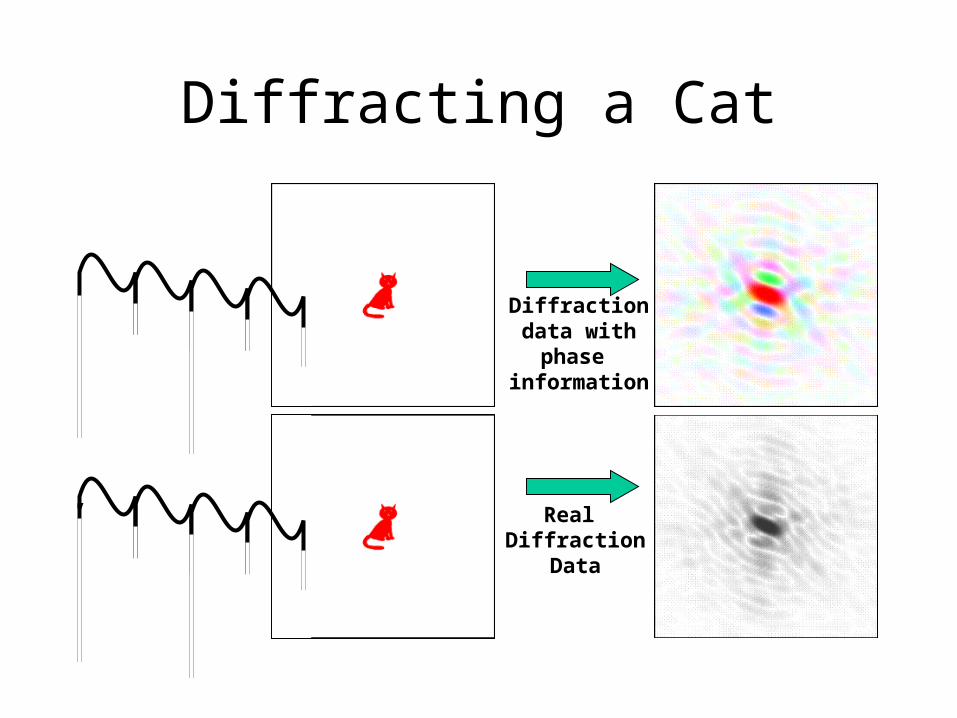
Diffracting a Cat
Diffractiondata with
phase information
Real Diffraction
Data
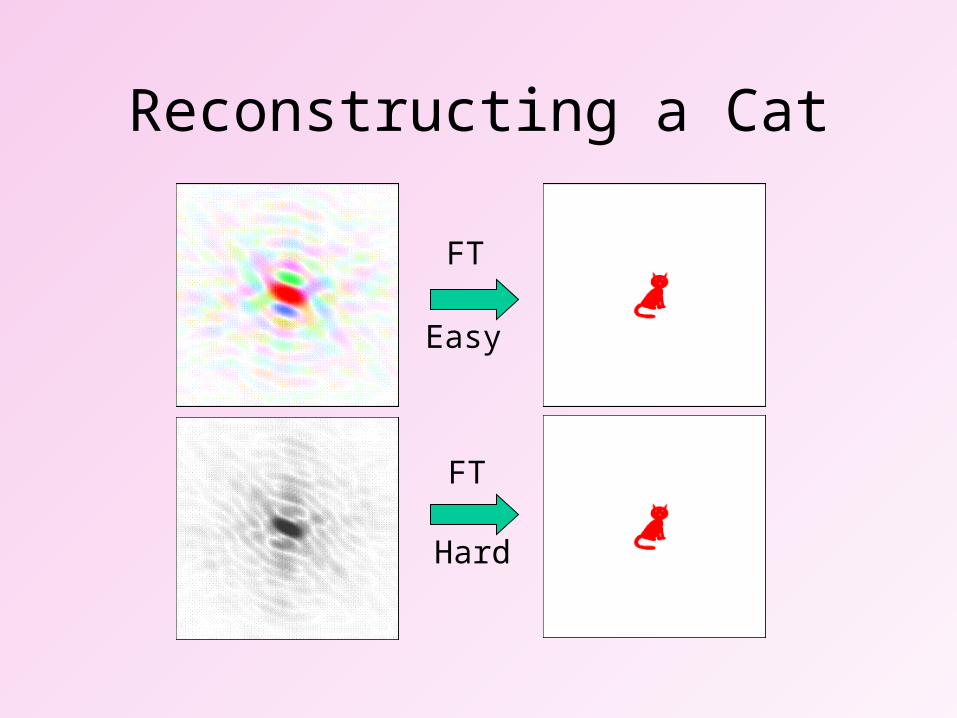
Reconstructing a Cat
FT
FT
Easy
Hard

The importance of phasesThe importance of phases

Phasing MethodsPhasing Methodsall assume some prior knowledge of the electron
density or structure
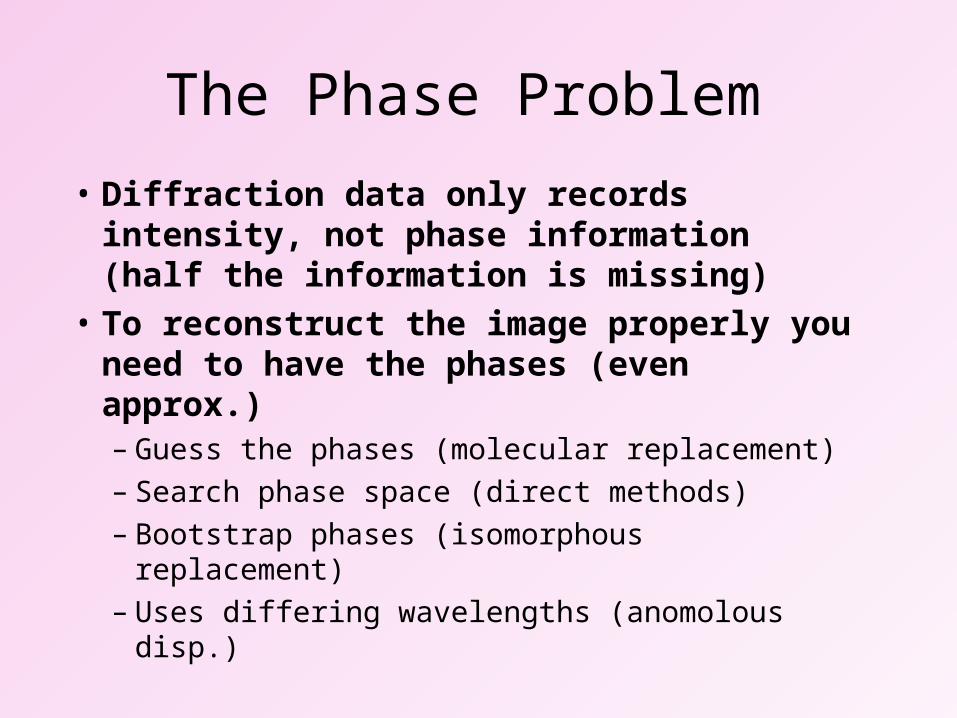
The Phase Problem
• Diffraction data only records intensity, not phase information (half the information is missing)
• To reconstruct the image properly you need to have the phases (even approx.)– Guess the phases (molecular replacement)– Search phase space (direct methods)– Bootstrap phases (isomorphous replacement)– Uses differing wavelengths (anomolous disp.)

Acronyms for phasing techniquesAcronyms for phasing techniques
• MR
• SIR
• MIR
• SIRAS
• MIRAS
• MAD
• SAD
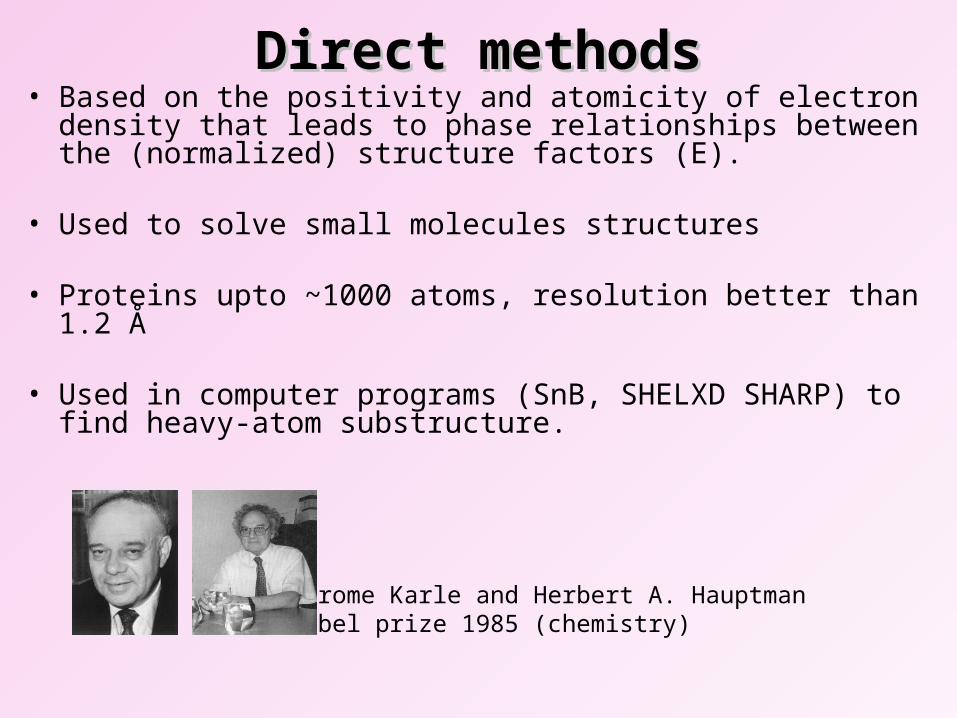
Direct methodsDirect methods• Based on the positivity and atomicity of electron density that leads
to phase relationships between the (normalized) structure factors (E).
• Used to solve small molecules structures
• Proteins upto ~1000 atoms, resolution better than 1.2 Å
• Used in computer programs (SnB, SHELXD SHARP) to find heavy-atom substructure.
Jerome Karle and Herbert A. HauptmanNobel prize 1985 (chemistry)
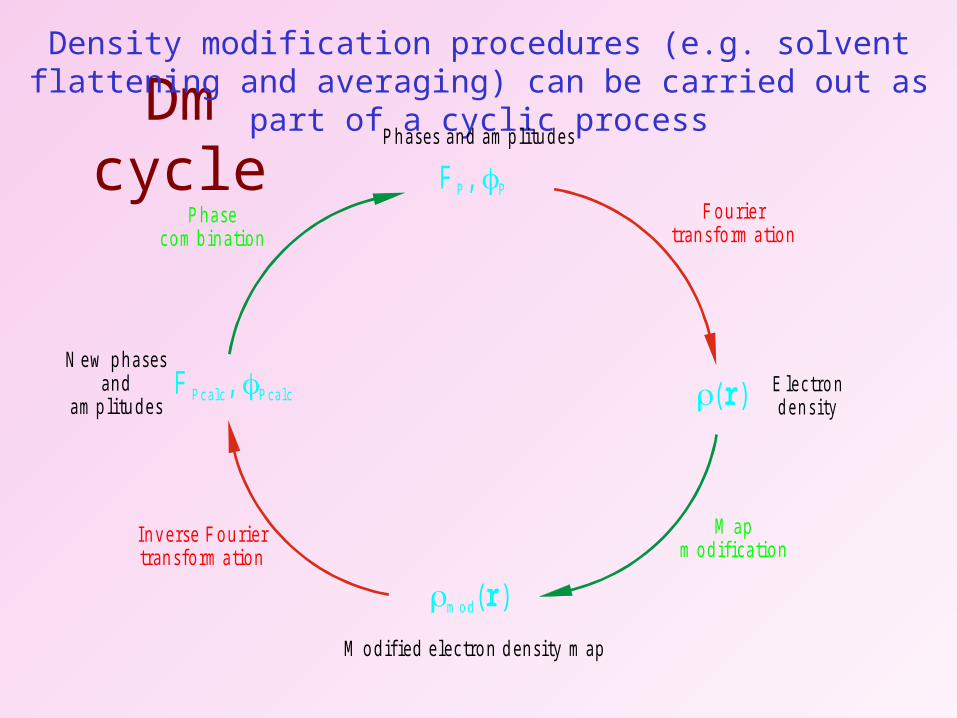
Dm cycle
( )r E le c tro nd e n s i ty
F ou rie rtran sfo rm a tion
Density modification procedures (e.g. solvent flattening and averaging) can be carried out as part of a cyclic process
F , P P
P hases and am p litu des
m o d( )r
M o dif ied e lectron d ensity m ap
F , P c a lc P c a lcN ew p hases
andam p litu des
M apm odifica tion
In ve rse F ou riertran sfo rm a tion
P hasecom bina tion
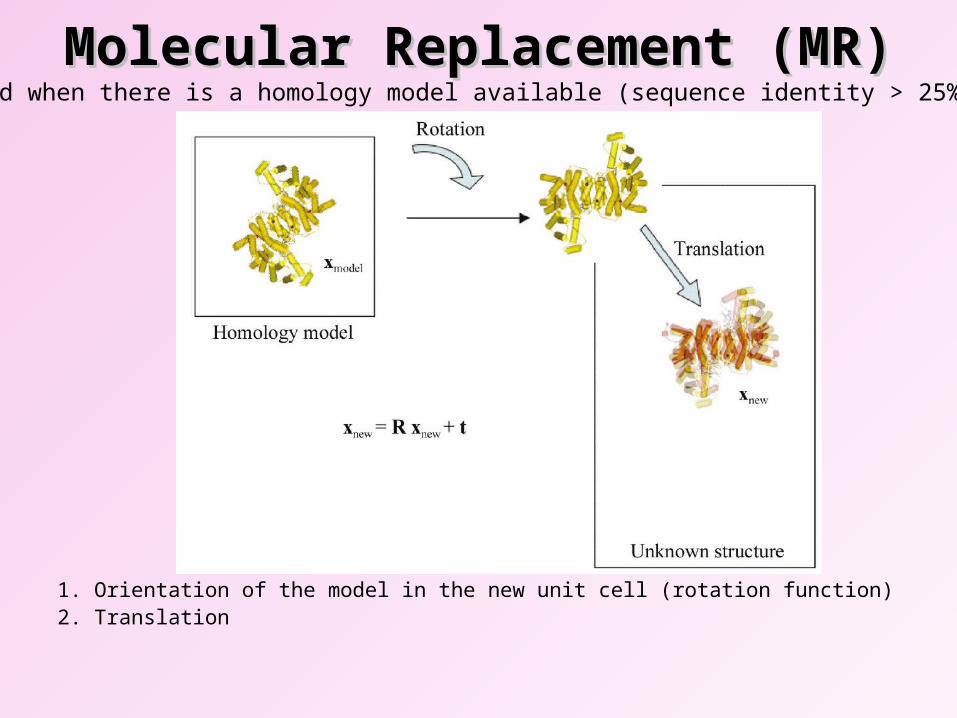
Molecular Replacement (MR)Molecular Replacement (MR)
1. Orientation of the model in the new unit cell (rotation function)2. Translation
Used when there is a homology model available (sequence identity > 25%).
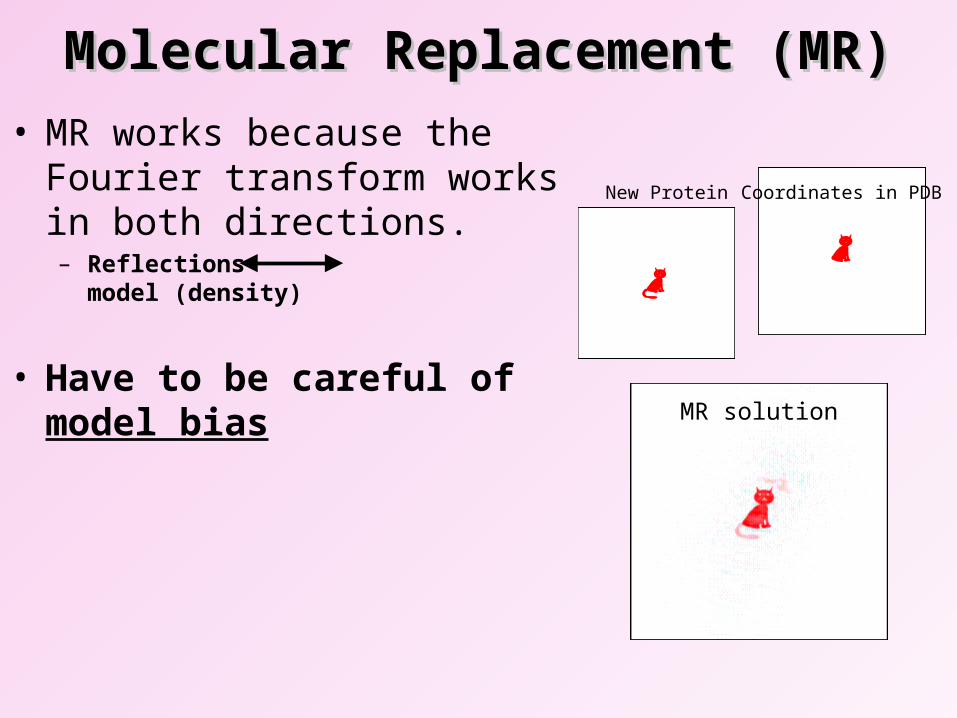
Molecular Replacement (MR)Molecular Replacement (MR)
• MR works because the Fourier transform works in both directions. – Reflections model (density)
• Have to be careful of model bias
New Protein Coordinates in PDB
MR solution

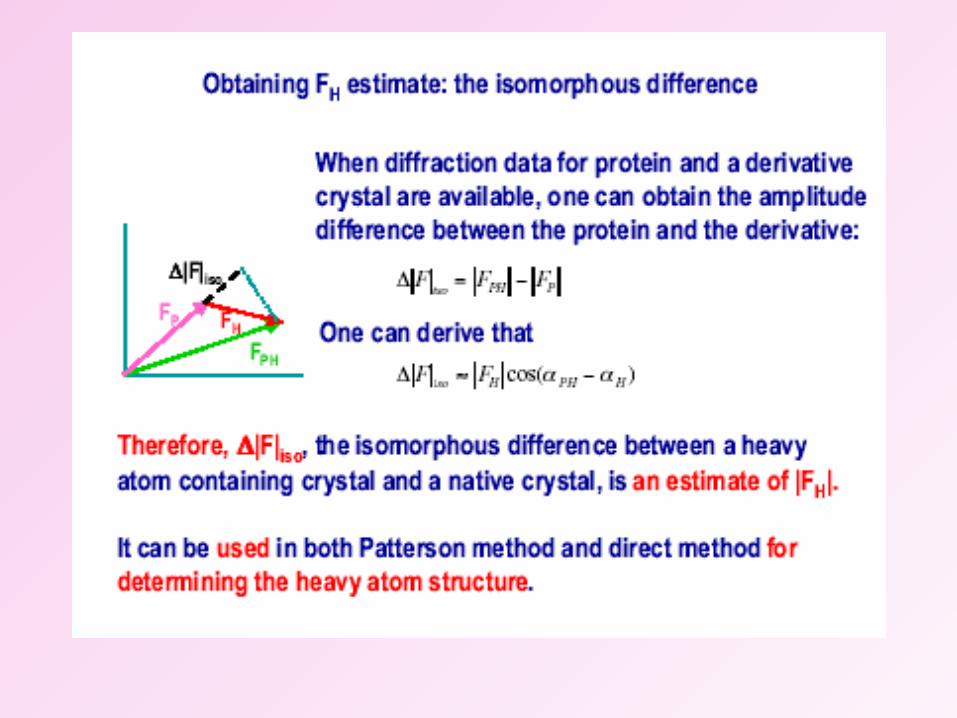
Isomorphous replacement
• Why isomorphous replacement, making heavy atom derivatives?– Phase determination
• Calculating FH
FH= FPH-FP
If HA position is known, FH can be calculated from ρ(xH, yH, zH) by inverse FT
• HA position determination – Patterson function

HA shifts FP by FH
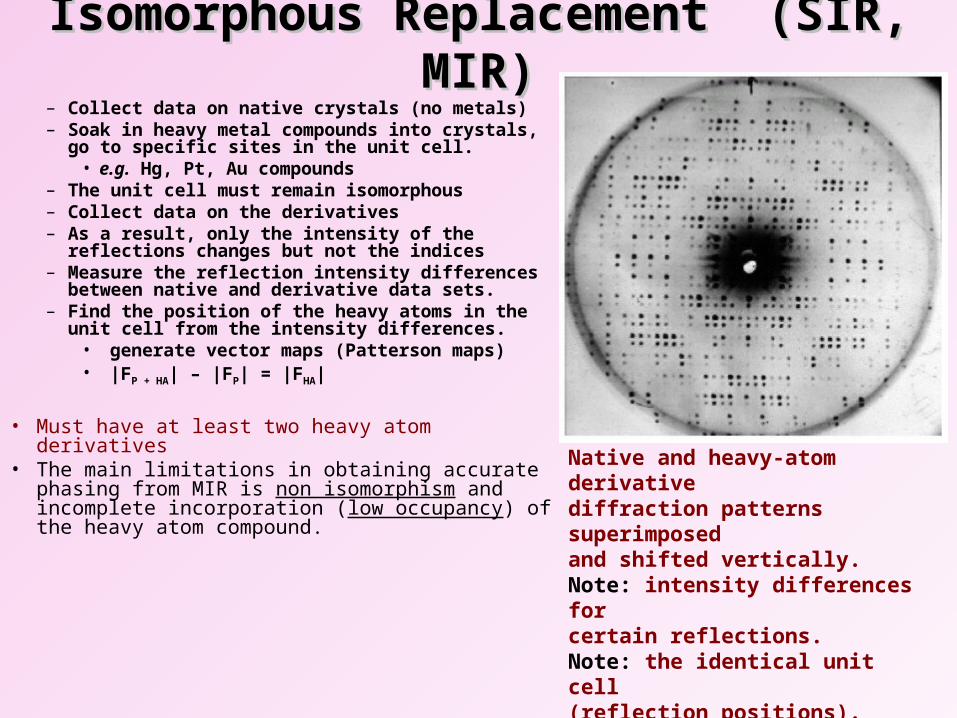
Isomorphous Replacement (SIR, MIR)Isomorphous Replacement (SIR, MIR)– Collect data on native crystals (no metals) – Soak in heavy metal compounds into crystals, go
to specific sites in the unit cell.• e.g. Hg, Pt, Au compounds
– The unit cell must remain isomorphous– Collect data on the derivatives– As a result, only the intensity of the reflections
changes but not the indices– Measure the reflection intensity differences
between native and derivative data sets.– Find the position of the heavy atoms in the unit
cell from the intensity differences.• generate vector maps (Patterson maps)• |FP + HA| – |FP| = |FHA|
• Must have at least two heavy atom derivatives• The main limitations in obtaining accurate phasing
from MIR is non isomorphism and incomplete incorporation (low occupancy) of the heavy atom compound.
Native and heavy-atom derivativediffraction patterns superimposed and shifted vertically.Note: intensity differences for certain reflections.Note: the identical unit cell (reflection positions). This suggests isomorphism.

Isomorphic HA derivatives only changes the intensity of the diffraction but not the
indices of the reflectionsNative crystal HA derivative crystal
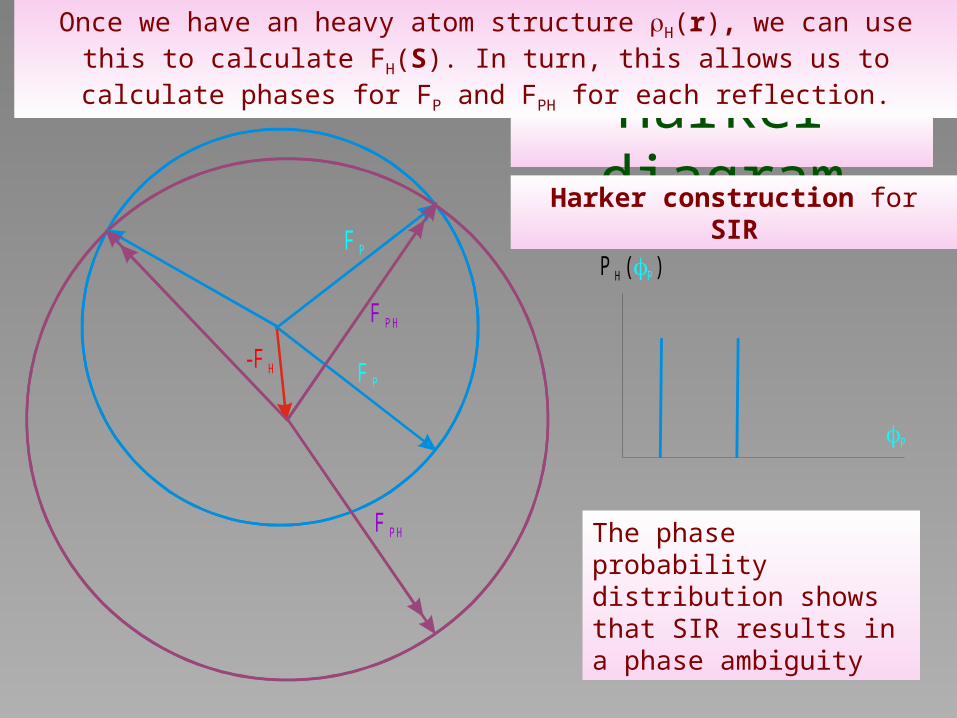
Harker diagram
F P
F PH
P ( )H P
P
Once we have an heavy atom structure H(r), we can use this to calculate FH(S). In turn, this allows us to calculate phases for FP and FPH for each
reflection.
Harker construction for SIR
The phase probability distribution shows that SIR results in a phase ambiguity
-F H
F P
F PH


MIR
P ( ) = ( ) . ( ) P P PP H P H 2
P
P H ( )P
P- F H 2
F P H 2
We can use a second derivative to resolve the phase ambiguity
Harker construction formultiple isomorphous replacement (MIR)
-F H
F P
F PH
P H 2( )P
P


A n o m a lo u s d e riv a t iv e
F ( )PH 0
F ( )PH S
F (- )PH S
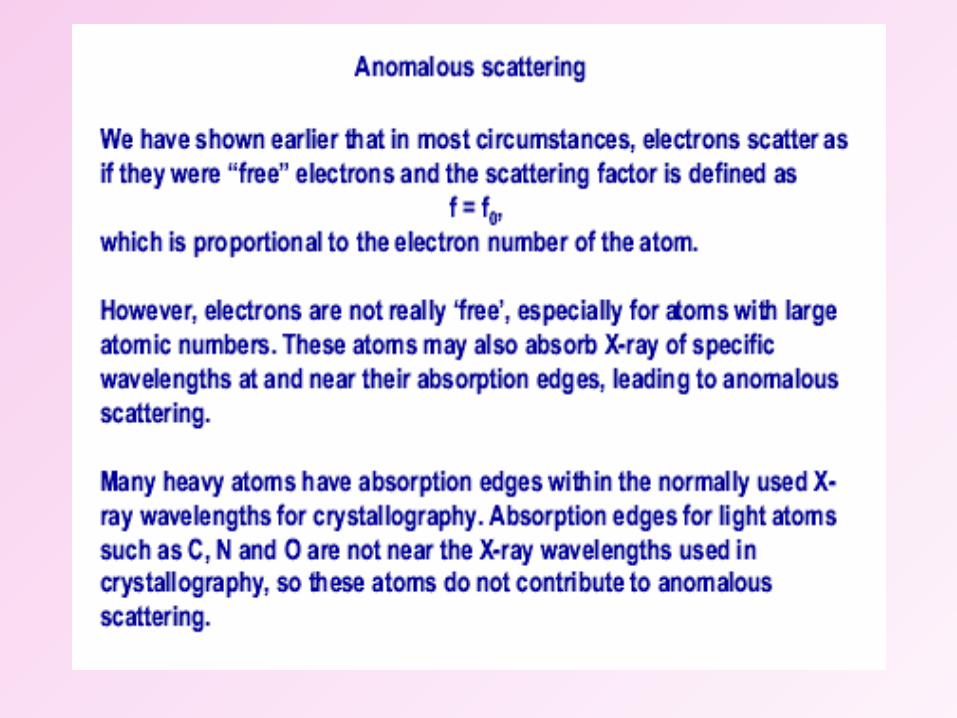
ASAnomalous scattering leads to a breakdown of Friedel‘s law

F +
P
- F *
H ''
F *P H
-F +H ''
F +
P H
Anomalous scattering data can also be used to solve the phase ambiguity
P +( )P
P
P ( )P
P
P ( ) = ( ) . ( ) P P PP + P
P
Note that the anomalous differences are very small; thus very accurate data are necessary
- F +H '

T h e t r ia n g le fo rm e d b y , a n d fa ils to c lo se
F P F PH F H
O f c o u rse , th e re a re e r ro rs in th e d a ta , d e te rm in a tio n o f h e a v y a to m p o s itio n s e tc .
F H
F P
F PH
P H
P
B lo w a n d C r ic k d e v e lo p e d a m o d e l in w h ic h a ll e r ro rs a rea ss o c ia te d w ith | | obsF PH
T h e 'la c k o f c lo s u re e r ro r ' is a fu n c tio n o f th e c a lc u la te d p h a s e a n g le
P
= | | | |o b s c a lcF FP H P H
T h e p h a se p ro b a b ili ty P ( ) i s g iv e n b yP
P ( ) = e x p P
2
2
( )2 E P
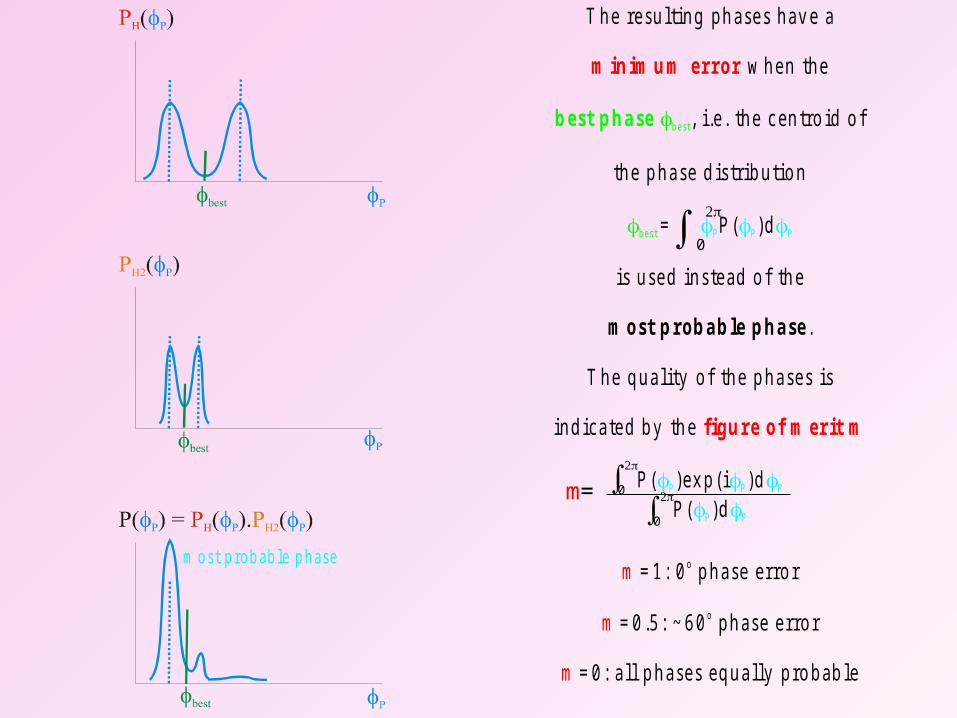
m ost p rob ab le p hase
T h e re su ltin g p h ase s h av e a
w h e n th e
, i.e . th e c en tro id o f
th e p h a se d is trib u tio n
is u se d in s te ad o f th e
.
T h e q u a lity o f th e p h a ses is
in d ica te d b y th e
= P ( )d
P ( )ex p (i )dP ( )d
= 1 : 0 p h a se e rro r
= 0 .5 : ~ 6 0 p h ase e rro r
= 0 : a ll p h a ses eq u a lly p ro b ab le
m o st p rob ab le p h a se
o
o
m in im u m error
figu re o f m erit m
m
m
m
b est p h a se b est
bes t
P P P
P P P
P P
0
0
0
m=
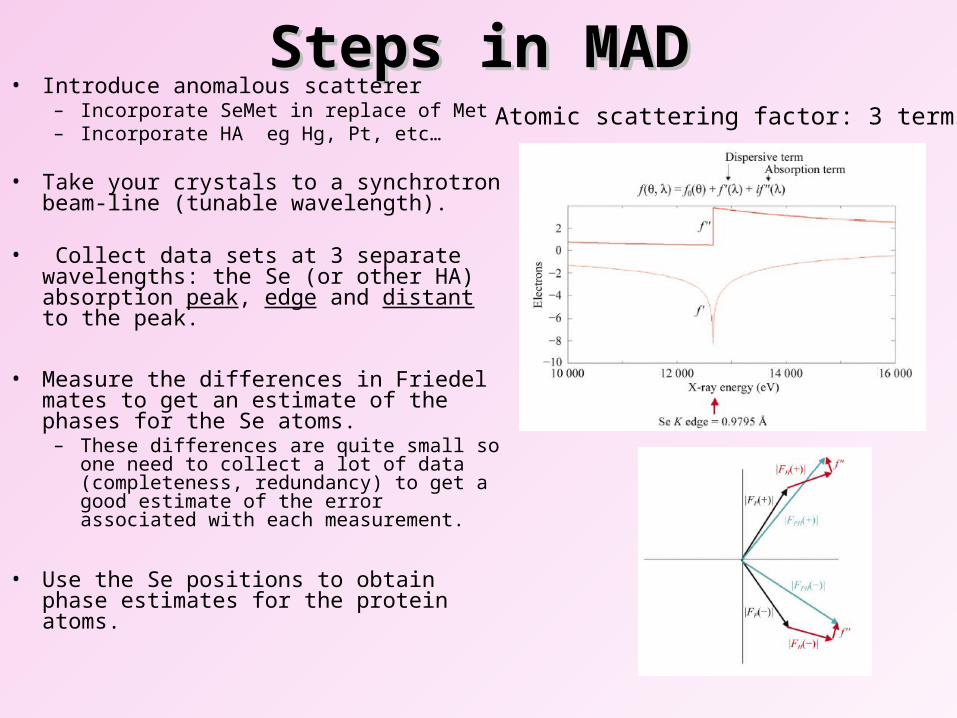
Steps in MADSteps in MAD• Introduce anomalous scatterer
– Incorporate SeMet in replace of Met– Incorporate HA eg Hg, Pt, etc…
• Take your crystals to a synchrotron beam-line (tunable wavelength).
• Collect data sets at 3 separate wavelengths: the Se (or other HA) absorption peak, edge and distant to the peak.
• Measure the differences in Friedel mates to get an estimate of the phases for the Se atoms.
– These differences are quite small so one need to collect a lot of data (completeness, redundancy) to get a good estimate of the error associated with each measurement.
• Use the Se positions to obtain phase estimates for the protein atoms.
Atomic scattering factor: 3 terms

Advantages of MADAdvantages of MAD
• All data is collected from one crystal– Perfect isomorphism
• Fast
• Easily interpretable electron density maps obtained right away.
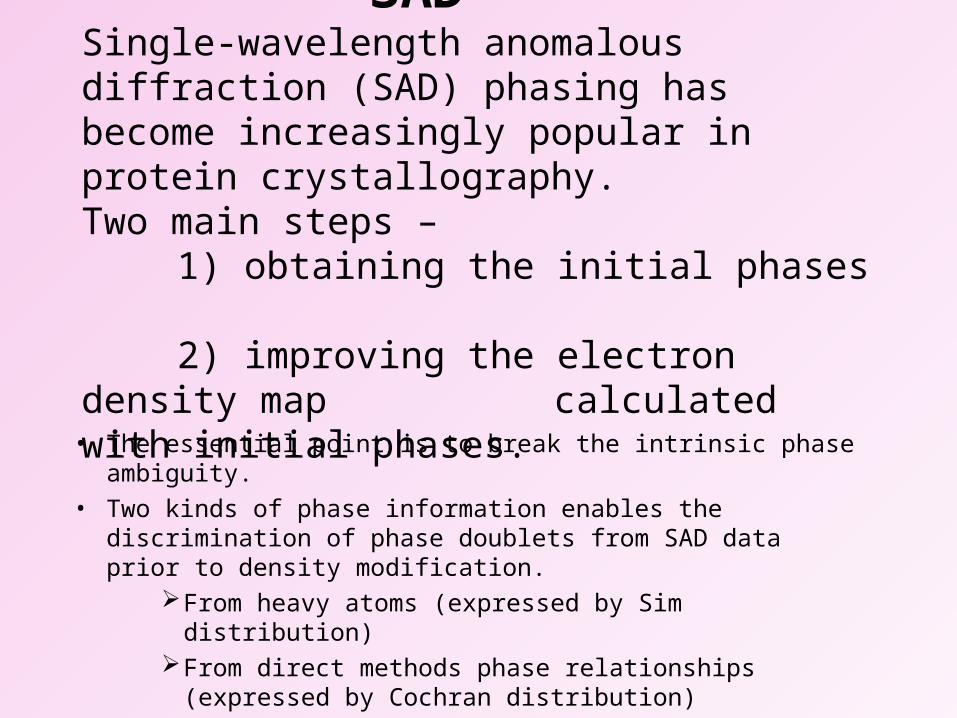
SADSingle-wavelength anomalous diffraction (SAD) phasing has become increasingly popular in protein crystallography.Two main steps –
1) obtaining the initial phases 2) improving the electron density map calculated with initial phases.
• The essential point is to break the intrinsic phase ambiguity.
• Two kinds of phase information enables the discrimination of phase doublets from SAD data prior to density modification.
From heavy atoms (expressed by Sim distribution)From direct methods phase relationships (expressed by
Cochran distribution)


The first example of solving an unknown protein by direct-method phasing of the 2.1Å OAS data
The first example of solving an unknown protein by direct-method phasing of the 2.1Å OAS data
Rusticyanin, MW: 16.8 kDa; SG: P21; a=32.43, b=60.68, c=38.01Å ; =107.82o ;Anomalous scatterer: Cu
Rusticyanin, MW: 16.8 kDa; SG: P21; a=32.43, b=60.68, c=38.01Å ; =107.82o ;Anomalous scatterer: Cu
Mlphare + dm
Oasis + dmOAS distribution Sim distribution Cochran distribution
Solvent flattening
OAS distribution Sim distribution
Solvent flattening

Radiation damage Induced Phasing (RIP)
• Radiation damage has been a curse of macromolecular crystallography from its early days.
• The X-ray radiation damage of cystals can be caused by he breakage of covalent bonds as an immediate consequence of the absorption of an X-ray quantum (a primary effect) of by the destructive effect of the propogation of radicals throughout the crystal (a secondary effect).
• Total dose and dose rate play a role in the amount of radiation damage inflicted on a protein crystal.

• The most pronounced structural changes observed were disulphide-bond breakage and associated main-chain and side-chain movements as well as decarboxylation of aspartate and glutamate residues.
• The structural changes induced on the sulphur atoms were successfully used to obtain high-quality phase estimates through an RIP (Radiation damage Induced Phasing) procedure.
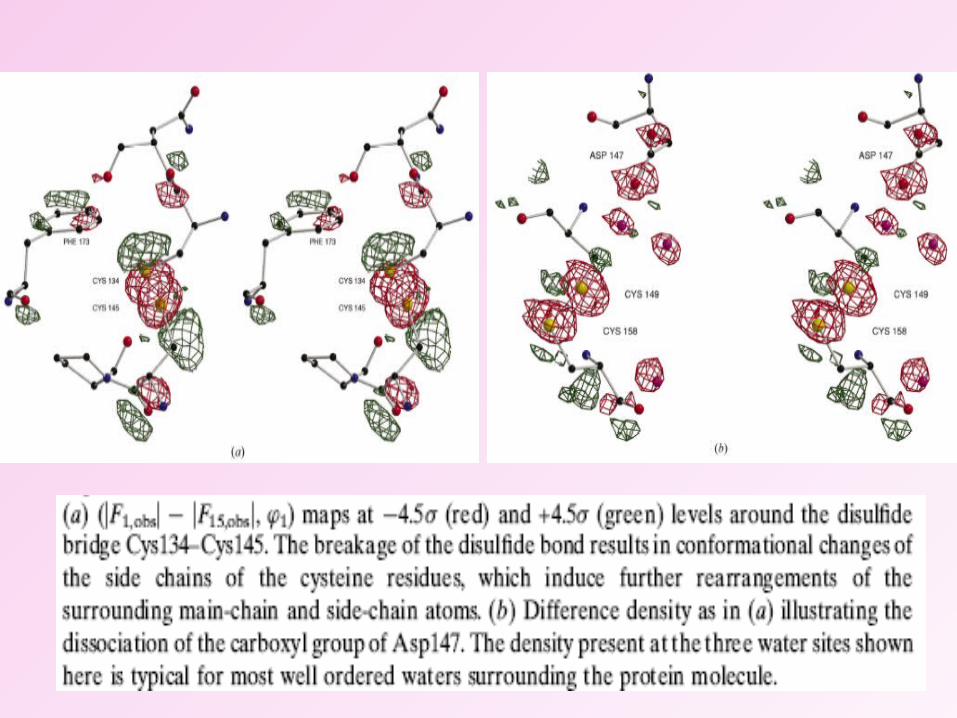
• Substructure solution and phasing procedure using a combination of anomalous scattering and radiation damage induced isomorphous differences.
• RIPAS strategy is beneficial for both locating the substructure and subsequent phasing.
Radiation damage Induced Phasing with Anomalous Scattering (RIPAS)
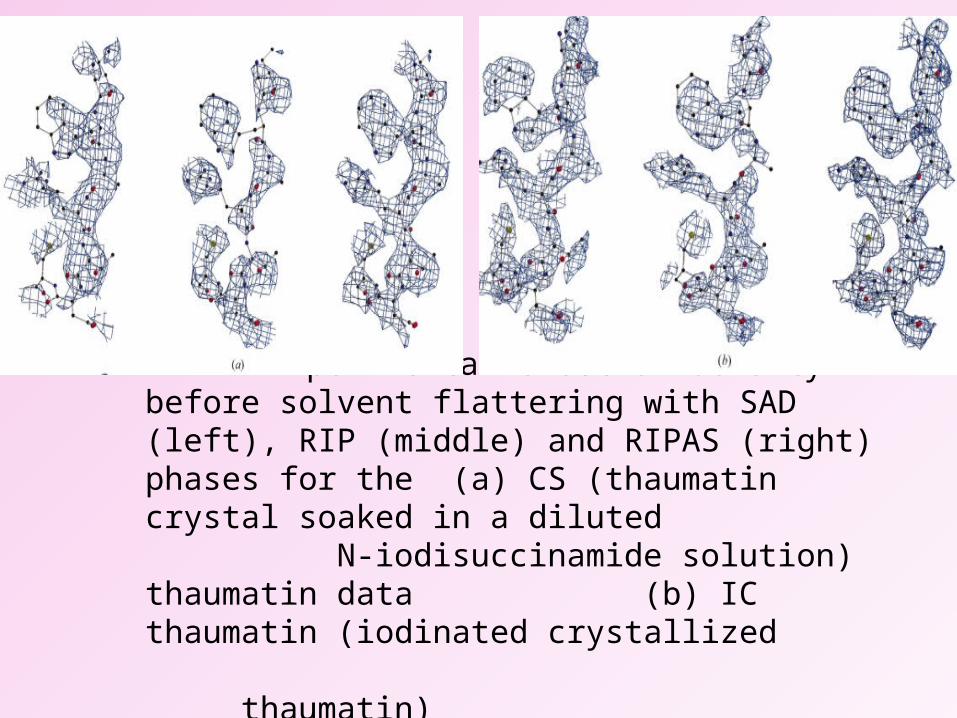
Experimental electron density before solvent flattering with SAD (left), RIP (middle) and RIPAS (right) phases for the (a) CS (thaumatin crystal soaked in a diluted
N-iodisuccinamide solution) thaumatin data (b) IC thaumatin (iodinated crystallized
thaumatin)

Methods of phase improvementMethods of phase improvement
• Solvent Flattening
• Histogram matching
• Non-crystallographic symmetry (NCS) Averaging
these methods can result in dramatic improvements in the clarity of the electron density map.
It is not always (!) possible to recognise features in a first electron density map. There are however ways of improving the map (phases):

1. Solvent flattening. Protein crystals contain large amounts of solvent; this will in general be disordered, and so will not contribute to the crystal diffraction.
By knowing the protein content of the crystal, it is therefore possible to determine the threshold density below which is noise; points with density below the threshold are set to a suitable average value.
This is particularly useful for locating molecular boundaries.
2. Averaging. If the asymmetric unit possesses more than one molecule, the equivalencing of the various copies can lead to dramatic improvement in the map and the phases.
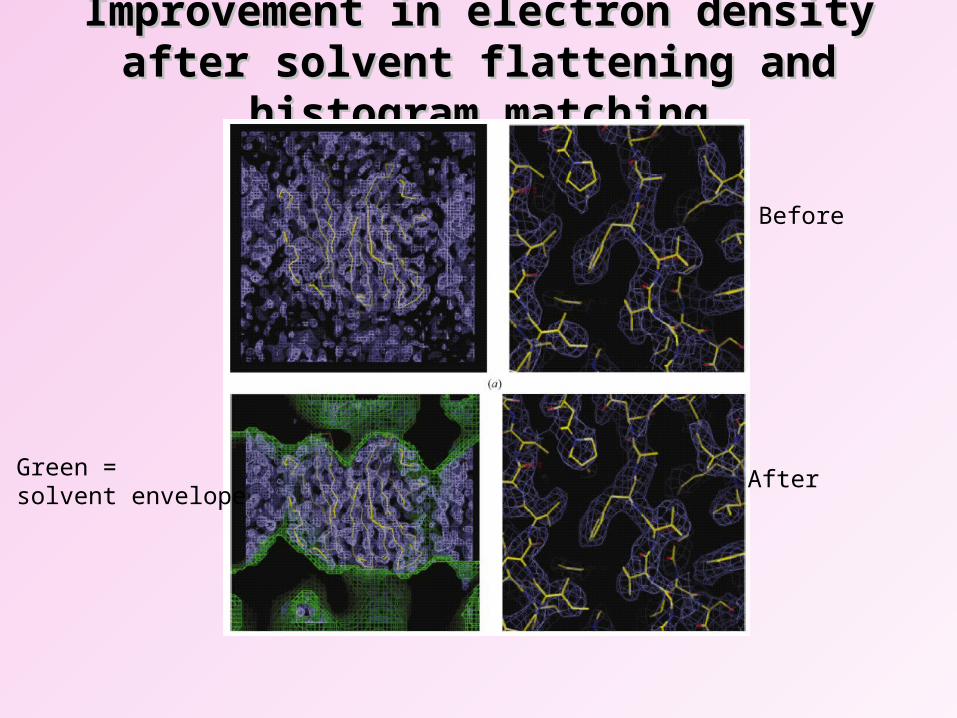
Improvement in electron density after solvent Improvement in electron density after solvent flattening and histogram matchingflattening and histogram matching
Before
AfterGreen = solvent envelope
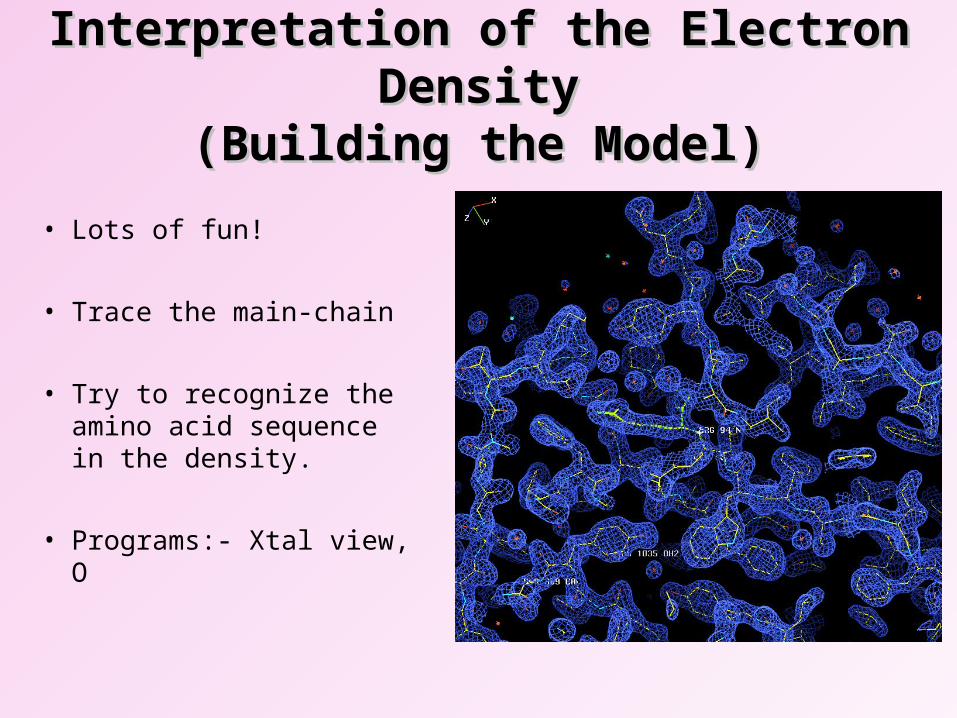
Interpretation of the Electron DensityInterpretation of the Electron Density(Building the Model)(Building the Model)
• Lots of fun!
• Trace the main-chain
• Try to recognize the amino acid sequence in the density.
• Programs:- Xtal view, O
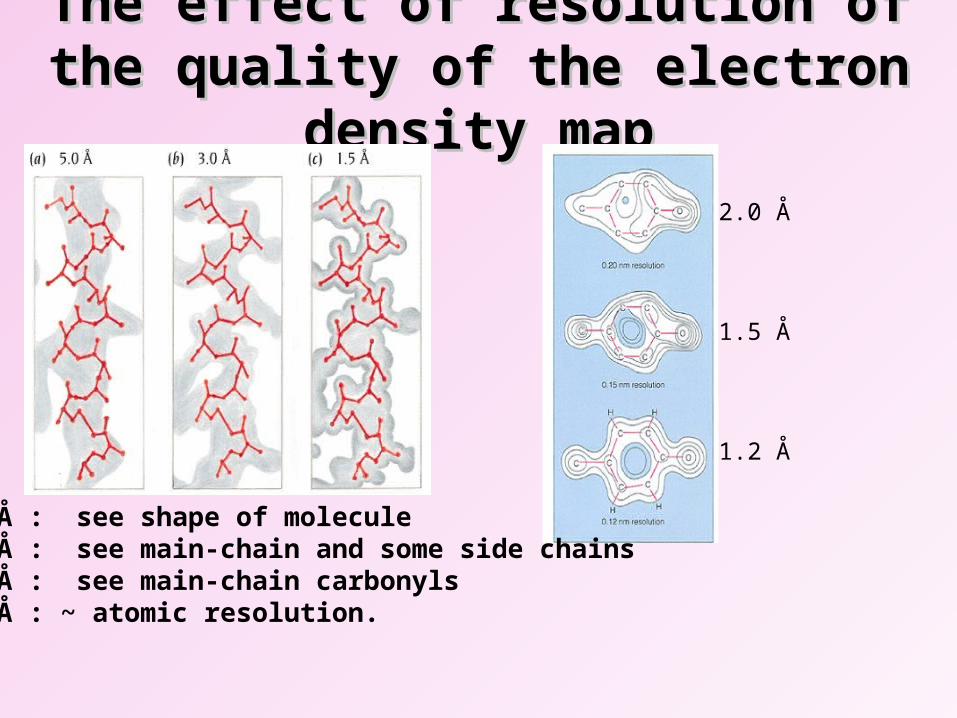
The effect of resolution of the quality of The effect of resolution of the quality of the electron density mapthe electron density map
2.0 Å
1.5 Å
1.2 Å
5.0 Å : see shape of molecule3.0 Å : see main-chain and some side chains2.5 Å : see main-chain carbonyls1.5 Å : ~ atomic resolution.
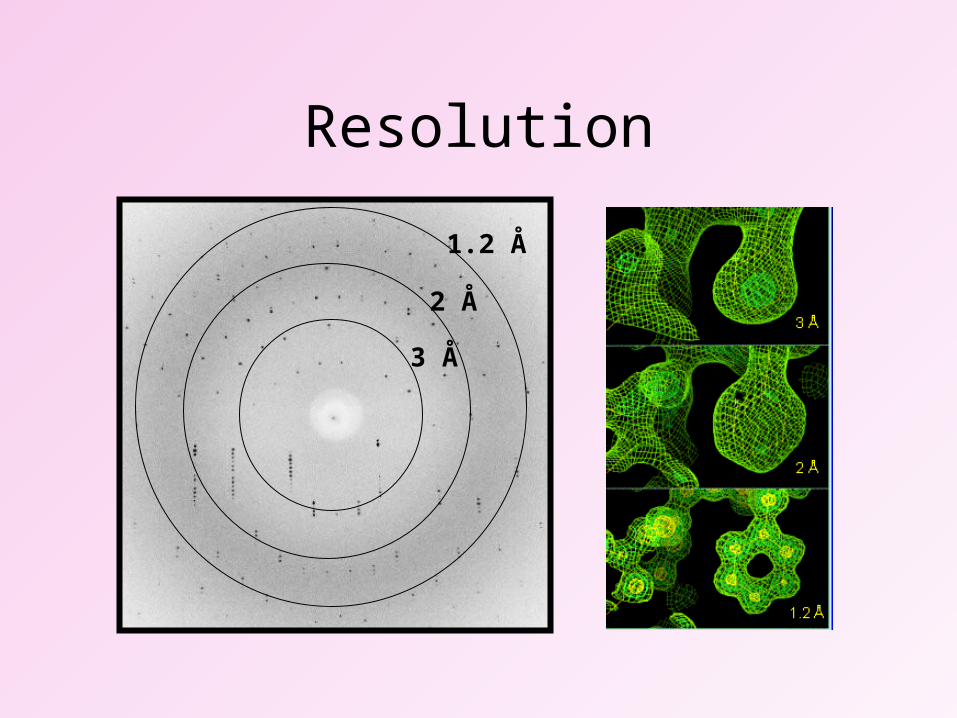
Resolution
1.2 Å
2 Å
3 Å

Atomic resolution

Fitting side chains, adding watersFitting side chains, adding waters
• If the density is good enough you can recognize alternate conformations for side-chains.• Hydrogens are not seen in the density, except in ultra-high resolutions structures < 1.0 Å.• Ordered Waters are seen on the surface and occasionally in the interior of the protein. At 2.0 Å resolution or better ~ 1 water / residue. Waters molecules play a big role in protein stability and enzyme catalysis.•Because the density depends on experimental phases which has error associated with them.The first model can have many errors.• Therefore it is essential to refine the atomic positions and their thermal parameters.

Electron Chain FinalDensity Trace Model
Chain Tracing
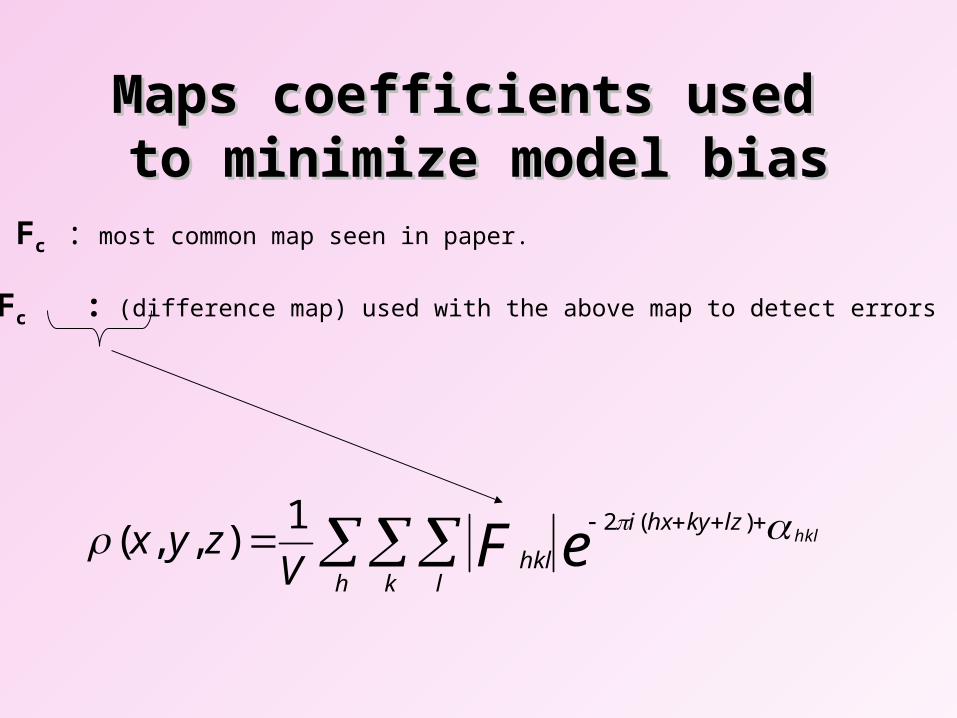
Maps coefficients used Maps coefficients used to minimize model biasto minimize model bias
2Fo – Fc : most common map seen in paper.
Fo – Fc : (difference map) used with the above map to detect errors
eF hkllzkyhxi
h k lhklV
zyx )(21),,(

Refinement CycleRefinement Cycle
Refine
Calculate map
Fit Model
Refinement: Improving the agreement between the model and the experimental density.
Compare Fobs (From reflection Intensities) to Fcalc (Calculated from the model)
Least squares minimization
Simulated Annealing / Molecular dynamics
Rfactor = numerical indicator to follow progress of refinementagreement between data and model
F
FFobs
calcobsR
data model
data

Refinement
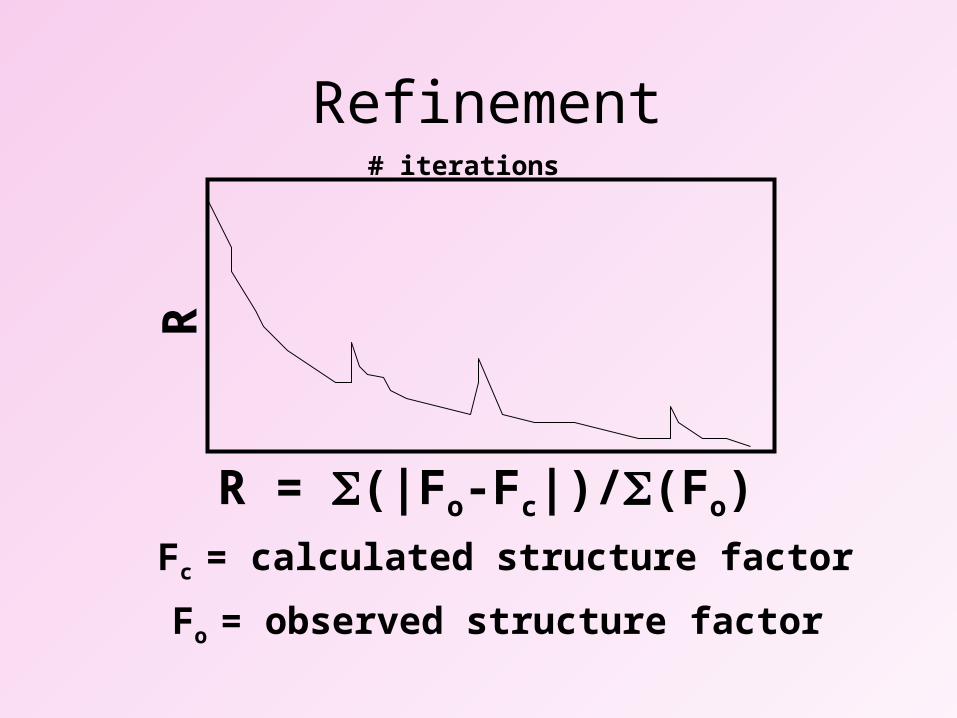
Refinement
R = (|Fo-Fc|)/(Fo)
Fo = observed structure factor
Fc = calculated structure factor
R# iterations
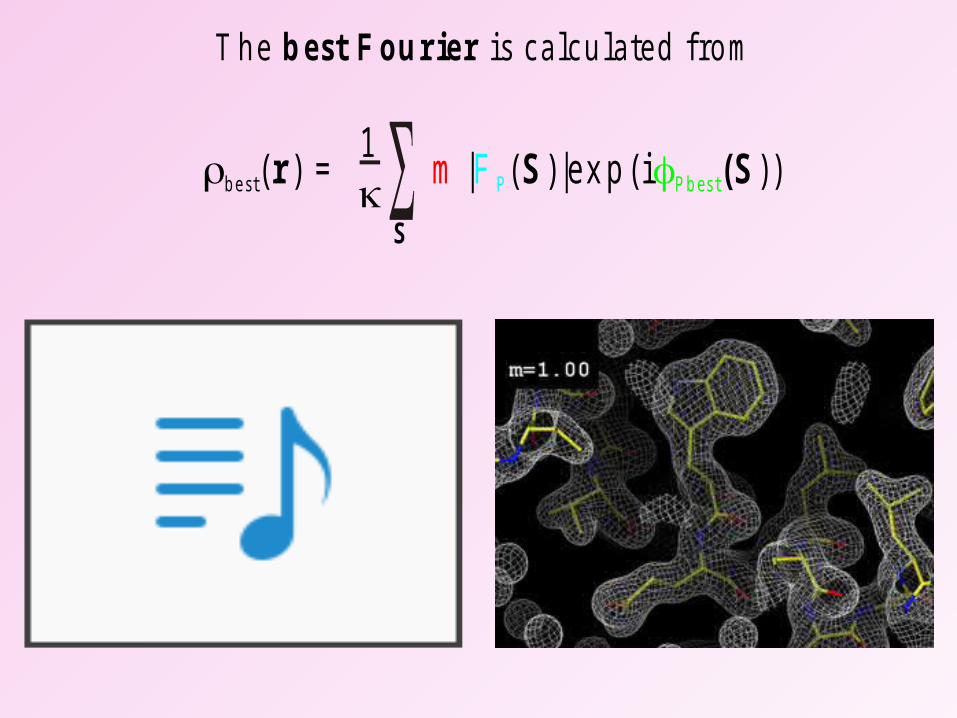
best( ) = | ( ) |e x p ( i ) )r S (Sm F P Pbes t
1
S
T h e is ca lc u la te d fro m b est F ou rier

Protein Data Base growthProtein Data Base growth
Molecular Biology: cloning of genes / over expression of proteins Synchrotron Radiation: MAD phasing, smaller crystals Cryo-cooling of crystals: collect data from 1 crystal,
increase order. Instrumentational and software improvementsIncrease in the number of labs using the technique
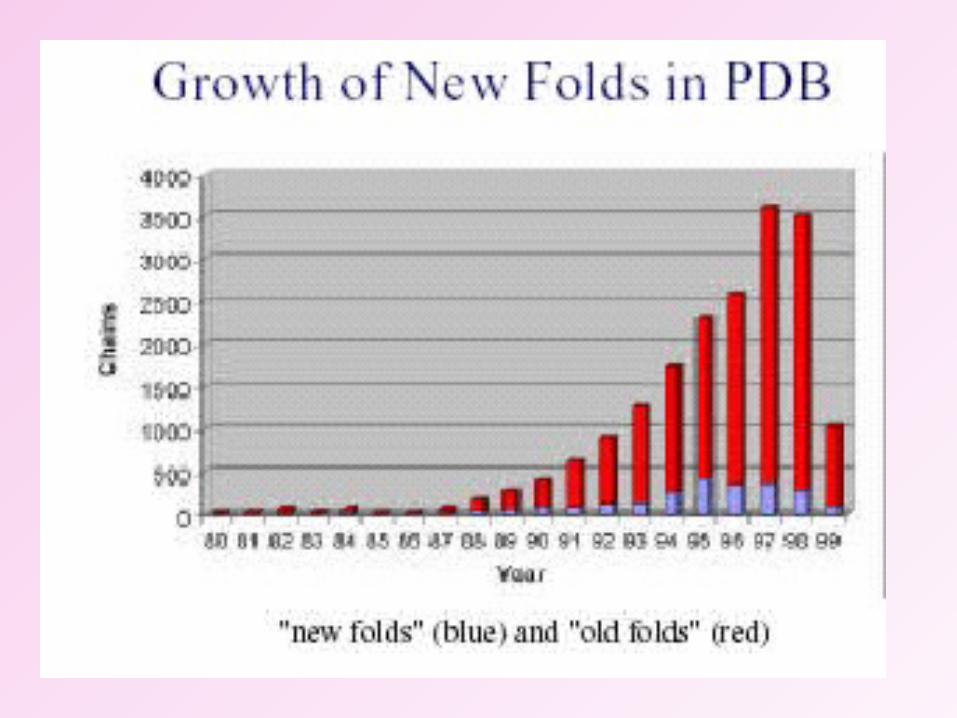

• Due to the advent of synchrotron radiation and due to the seleno-methionine derivatization technique, the total number of protein structures deposited in the PDB from 1980 onwards has increased catastrophically.
• MAD technique played a major role in this. At present nearly 100 new structures are deposited every week.

THANK YOU