Structural Convergence of European Countries - GWDGcege/Diskussionspapiere/75.pdf · Structural...
41
ISSN: 1439-2305 Number 75 – July 2008 Structural Convergence of European Countries Nicole Höhenberger Claudia Schmiedeberg
Transcript of Structural Convergence of European Countries - GWDGcege/Diskussionspapiere/75.pdf · Structural...

ISSN: 1439-2305
Number 75 – July 2008
Structural Convergence of
European Countries
Nicole Höhenberger Claudia Schmiedeberg

This paper is based on a presentation at the “10th Göttingen Workshop on International Economic Relations” at the Georg-August-University of Göttingen in collaboration with the Center for European, Governance and Economic Development Research (cege), April 10-12, 2008. The aim of this annual workshop is to offer a forum for young researchers from the field of International Economics to present and to discuss their current topics of research with other experts. The workshop also provides the opportunity to gain an overview of recent developments, problems and methodological approaches in this field. Detailed information on past workshops and the planning for the 2009 workshop are available at http://workshop-iwb.uni-goettingen.de/. Do not hesitate to contact Prof. Dr. Gerhard Rübel, cege ([email protected]) for further questions.

1
Structural Convergence of European Countries
Nicole Höhenberger1, Karl-Franzens-University Graz
Claudia Schmiedeberg2, University of Hamburg
Keywords: Structural Convergence, European Integration, Economic Development
JEL-No.: O 11, F 14, F 15, P 27
Abstract:
Building on the three-sector-hypothesis, the New Theory of Trade, and the New Economic
Geography, we investigate the development of economic structures of European countries
over the last three decades using employment data. We test for structural convergence which
we analyze on the aggregate level as well as specifically for manufacturing and service
industries. For this we implement both time series and panel data methods. Our results
indicate overall structural convergence between Western European countries over time. This
is mainly due to strong intersectoral convergence patterns as countries shift from
industrialized to service economies. In contrast, the results regarding intrasectoral
convergence are mixed: Increasing spatial concentration in production is dominant in
technology-intensive manufacturing industries which are characterized by economies of scale
and path-dependency, whereas convergence is found in mature, less technology-intensive
industries. In most service branches country-specific differences do not change to a significant
extent with the exception of transport and storage services.
1 Contact: Graz Schumpeter Centre, Universitätsstraße 15/FE, 8010 Graz, Austria. Tel: +43-(0)316-3803596, e-
mail: [email protected]. 2 Contact: Chair of Economic Policy and Industrial Economics, Von-Melle-Park 5, 20146 Hamburg, Germany.
Tel: +49-(0)40-42838-5565, e-mail: [email protected].
We would like to thank Heinz D. Kurz, Wilhelm Pfähler, Hendryk Gurgul, Ulrich Witt, Bart Verspagen, and
Stefan Palan for their comments and help on the paper.

2
1. Introduction
The economic policy of the European Union aims to foster the integration and cohesion
between its member states (art. 158 and 160 of the treaty establishing the European
Community). According to economic theory, deeper integration should have initiated at least
some reallocation of economic production between European countries. As trading costs
diminish, the ability to exploit economies of scale as well as the access to suppliers and other
complementary activities is becoming more important. These tendencies favor the
concentration of industries in very few places and the specialization of countries, thereby
increasing the absolute heterogeneity of countries (Krugman 1991a). Moreover, the deeper
integration has enlarged the possibilities of trade, making it easier to exploit comparative
advantages. Therefore, also the relative structural differences between countries are likely to
have increased over time (Haaland et al. 1998).
These models, however, fail to capture European reality: labor is still a highly immobile
production factor and consumers have made use of the new consumption possibilities to a
lesser extent than expected. Moreover, international technology diffusion fosters catch-up
processes and might lead not only to income but also structural convergence across Europe
(Pigliaru 2003). In addition, the ongoing globalization affects the comparative advantages of
European countries in the same way: European countries lose competitiveness in labor-
intensive, low-skill and low-technology industries in favor of low-cost countries outside
Europe. This forces all European countries to shift production towards high-technology, high-
skill and capital-intensive industries. Altogether, the conclusion is inconclusive, suggesting
extensive branch-specific differences with regard to their convergence potential.
In contrast to the vast amount of empirical literature on income convergence, studies on
structural convergence are scarce. Some work has been done regarding regional convergence
(e.g. Cuadrado-Roura et al. 1999, Guerrieri and Iammarino 2003, Longhi and Musolesi 2007);
others investigate the interrelationship between structural convergence and income
convergence (Wacziarg 2001, Imbs and Wacziarg 2003), productivity convergence
(Fagerberg 2000, Gugler and Pfaffermayr 2004), and monetary integration (Brülhart 1998).
Others again focus on the economic catch-up and structural assimilation of countries, e.g.
Landesmann (2000) for the movement of Central and Eastern Countries towards the Western
European countries and Abegaz (2002) for the convergence between industrialized, newly
industrialized and least-industrial country groups.
With a focus similar to the present paper, Midelfart-Knarvik et al. (2000) investigate
structural convergence between European countries. They analyze specialization tendencies
of European economies and localization trends of industries from 1970 to 1997, measured by
gross value of output, for both the manufacturing and service industries. In doing so, they
account for the interrelationship of industry (such as capital, skill and technology intensity,
returns to scale) and country characteristics (e.g. availability of R&D, high-skill workers and
scientists, market potential) and the impact of these factors on structural convergence. The
authors moreover introduce a measure of spatial dispersion that takes into account the relative
locations of industry clusters, to evaluate the relative locations of concentrations of these
individual industries. Thus, they analyze the reasons for concentration of industries and for
where industries actually locate, rather than convergence of industries as a development over
time.
In this paper, we examine the process of structural convergence of Western European member
states at the industry-level. That is, we analyze whether countries show increased similarity
with regard to their employment shares in individual industries over time. We use data for the
3
three aggregate sectors (agriculture, manufacturing, and services) as well as for nineteen
manufacturing and ten service industries, covering fourteen European countries over the
period from 1970 to 2004 and 2005, respectively. The long time horizon is of great relevance
for our purposes, as we want to compare the levels of structural heterogeneity between
decades which are characterized by very different degrees of European and international
economic integration.
Our analysis contributes to the literature in the following ways: First, we provide a
comprehensive view on both intersectoral and intrasectoral convergence. We put the different
convergence types into relation, showing that the bulk of convergence across European
countries in the last decades was owed to intersectoral rather than intrasectoral convergence.
For this, we define a heterogeneity index which can be decomposed into inter- and
intrasectoral heterogeneity. Second, we analyze the dynamics of employment structures not
only in manufacturing but also in service industries, which so far have been mostly neglected
in the literature. Third, we provide evidence of industry-specific convergence (or divergence)
patterns and establish a procedure to distinguish between two forms of divergence, i.e. general
divergence, where some countries win employment shares in the respective industry at the
expense of other countries, and concentration processes driven by one-country specialization,
where employment shares of all but one country remain stable and only one country strongly
increases its employment share.
The paper is structured as follows: Section 2 presents relevant theoretical concepts including
the main driving forces of convergence and divergence. In Section 3 we explicate our
approach to the implementation of empirical convergence tests, followed by information on
the employment data used in section 4. Section 5 presents descriptive statistics as well as the
results of σ- and β-convergence tests and section 6 concludes.
2. Theoretical Framework and Literature
For the discussion of structural convergence, we have to distinguish between two types of
structural change, i.e. inter- and intrasectoral change. The former refers to variations of
employment shares between the three aggregate sectors3 of an economy and hence focuses on
the transition from the agrarian to the industrial and finally to the service economy. The latter
relates to changes of production structures within one of the aggregate sectors, for instance a
change in the share of the textile industry on total manufacturing employment.
Arguments for intersectoral convergence can be derived from the three-sector-hypothesis and
the convergence hypothesis of Chenery (1960), which both assume that there is a strong
correlation between the production structure of a country and its per-capita income level.
According to these hypotheses, intersectoral convergence is expected to occur whenever
poorer countries are able to close the income gap, since consumption patterns then converge
towards those of richer countries (Fisher 1939, 1952). Rising incomes therefore lead to a
decline in the consumption of basic goods and a rise in the consumption of luxury goods.
When the production side adapts to these changes in demand, employment in agriculture
3 The three aggregate sectors are agriculture, manufacturing and services. In recent years the impact of industries
associated with information and communication technologies (ICT) has risen dramatically and therefore it has
often been argued that the three-sector-hypothesis should be complemented by a forth sector (Porat 1976 and
OECD 2005). As our data are too highly aggregated to allow for a forth sector, we decided to work with three
aggregate sectors and include ICT branches in the manufacturing and service sector, however. Hence, we study
the impact of the diffusion of information and communication technologies in the economy only through
intrasectoral convergence, as our data are too highly aggregated to allow for a forth sector.

4
declines, whereas employment shares rise first in manufacturing; similarly, in later stages,
manufacturing declines whereas service industries increase. The three-sector hypothesis also
stresses supply-side convergence potentials: Knowledge transfer enables technologically
lagging countries to increase labor productivity and catch up to technologically leading
countries (Clark 1940, Fourastié 1949). This process of productivity growth reduces
employment in the agricultural and (in a later stage) the manufacturing sector and increases
the share of the service sector. Thus, convergence of income levels and labor productivity is
expected to lead to structural convergence (as stressed by Pigliaru 2003).
For our investigation of European countries we therefore expect to find that an intersectoral
convergence process has taken place since the 1970s. Countries which were characterized by
a disproportionately high employment share in agriculture and relatively low labor
productivity at the beginning of the investigation period should have undergone a period of
extensive catch-up and transition towards industrialized and service economies. Moreover, as
the incomes of poorer countries have risen, demand patterns should have converged to those
of richer countries. This is associated with a shift in consumption from manufacturing goods
to services.
A certain degree of heterogeneity between countries will remain, however, due to differences
in natural resources, country size, institutional frameworks and cultural backgrounds
(Chenery 1960). Whereas the importance of the latter two factors is diminishing as a
consequence of the ongoing process of European integration, the impact of differences in
country size on divergence processes should not be underestimated, as is suggested by models
of the New Economic Geography (Krugman 1991a, 1991b).
Regarding intrasectoral convergence and divergence, the direction of development is less
clear-cut and highly dependent on the characteristics of each individual industry, but also on
trading costs, trading barriers and the natural endowments of European countries. On the one
hand, the ongoing process of globalization and the decline in trade costs have affected the
comparative advantages of European countries similarily. The competitiveness in labor-
intensive and low-skill industries has decreased compared to low-cost countries. This should
have lead to a massive reallocation of labor within Europe, as low-technology and labor-
intensive industries are outsourced whilst the shares of technology-, skill-, and capital-
intensive industries rise. Structural change has been most dramatic in countries with a
disproportionately high share of low-skill industries at the beginning of this process. Besides,
the vanishing of trade barriers enhances the diffusion of knowledge so that new technologies
become available to a large group of countries and enable technologically lagging countries to
catch-up to technological leaders (de la Fuente 1997; Pigliaru 2003). One important
precondition for this catch-up is that lagging countries have a sufficient base of “social and
technological capabilities” (Nelson 2005) in order to absorb new knowledge and to use new
high-class technologies (Fagerberg 1994). Within Europe, these capabilities ought to be
present in all countries – whereas this is not necessarily the case for newly industrialized
countries. Therefore, the diffusion of knowledge is expected to cause convergence in medium
and high-technology industries. In emerging high-tech industries, however, divergence is
possible, as technologically leading European countries may specialize in high-technology
industries to maintain their competitive edge.
The effect of European integration, on the other hand, is ambiguous: Lower transaction costs
due to European integration lower the importance for producers to be close to suppliers and
customers. Therefore, according to Amiti (1998) and Rossi-Hansberg (2005) the
attractiveness of locations close to large markets decreases in comparison to cost-competitive
peripheral locations. This shift becomes more probable the fiercer the competition of
agglomerated firms (Baldwin and Venables 1995). Thus, lowering trade costs should lead to a
similar convergence across Europe for all types of industries. Yet, this implication is in

5
contrast with the thesis of the New Economic Geography (Krugman 1980, Helpman and
Krugman 1985) that both specialization and concentration increase with a decline in transport
and trade costs as these enhance the opportunities of firms to exploit economies of scale and
reduce production costs. Economic integration and trade liberalization therefore are expected
to facilitate the international division of labor and contribute to the persistence or even the
broadening of structural differences between countries.
Intrasectoral divergence may particularly be promoted by European integration in the
following cases: Industries, that exhibit increasing returns to scale, are likely to concentrate
production in larger countries as large domestic markets can more easily attract industrial
sectors than smaller domestic markets (Midelfart et al. 2003). Similarly, a large number of up-
and downstream linkages in industries leads to a high level of concentration (or clustering) of
economic activities, such as in the case in the automobile industry (Fujita et al. 1999).
Further driving forces for intrasectoral divergence are the existence of pecuniary or
technological externalities (Krugman and Venables 1995), because the presence of such
externalities, industries are likely to be spatially concentrated in order to minimize production
costs, benefit from a common pool of knowledge and infrastructure and take advantage of the
path-dependency in the creation and accumulation of knowledge. In addition, the divergence
of production structures is due to path-dependent developments, i.e. countries tend to
specialize in those branches where they originally have comparative advantages (Ohlin 1933).
This is especially true for high-skill and high-technology industries, which are likely to show
strong patterns of path dependency, since the creation and accumulation of knowledge are
characterized by path-dependencies.
From these arguments we derive the hypothesis that the impact of globalization has been
particularly strong on mature, labor-intensive and low-technology industries. Hence, we
expect convergence in these industries, as employment there should shrink in all observed
countries due to outsourcing processes. Secondly, we presume convergence for low and
medium technology industries due to technology diffusion across European countries. For
industries which exhibit economies of scale and are technology- and knowledge-intensive,
divergence ought to occur, since in these industries path-dependencies are likely to exist.
Industries in the service sector are expected to show slow development - if any - because they
are characterized by a high degree of immobility. Conversely, manufacturing goods are more
easily tradable. European integration as well as globalization therefore is assumed to have a
greater impact on manufacturing than on the service sector. At the same time, we expect to
observe differences between locally oriented branches and globalizing industries.
3. Methodological Issues
In order to detect structural convergence (or divergence, respectively) we implement the
classical approaches of σ- and β-convergence that were initially introduced by Barro and Sala-
i-Martin (1992, 1995) in the context of income convergence.

6
σ-convergence
For empirical tests on structural σ-convergence, a measure of heterogeneity is required; a
number of indices developed for this purpose can be found in the literature.4 The major
drawback of all of these indices is that they are not able to distinguish between inter- and
intrasectoral developments and therefore might lead to misleading conclusions about the
structural economic development within Europe. We construct an index which captures the
total heterogeneity of economic structures between N countries, the Index of Structural
Heterogeneity (SHEN). It is based on the industry-specific N
sSHE , i.e. the N countries’
heterogeneity in each industry s (similar to Krugman 1991a), calculated as the sum of the
countries’ deviations n
sb from the average employment share of industry s from total
employment over all countries sb :
∑
=
−=N
n
sn
s
N
s bbN
SHE1
1
. (1)
Summing the index over all industries yields the aggregate index of structural heterogeneity,
which indicates the overall heterogeneity of all countries’ industry structures. This index is
divided by the number of industries being analyzed, so for S industries and N countries this is:
∑∑
= =
−=S
s
N
n
s
n
s
Nbb
SNSHE
1 1
||11
(2)
Using this index, we are able to measure absolute concentration, that is, to what degree the
production structures of individual countries differ from the average production structure in
Europe. We do not, however, measure relative concentration, e.g. whether country A being
twice as large as country B, also produces twice as much in industry s.
In order to test for σ-convergence we calculate the SHEN for each year in the observation
period 1970-2005 (1970-2004 for manufacturing industries) and analyze the development of
the index over time using the time series methods described below. A growing SHEN is
interpreted as a sign of divergence, while a decreasing SHEN points towards convergence.
So far, differences between inter- and intrasectoral convergence have not been taken into
account, i.e. the index can be used for all aggregation levels alike. Taking the shares of the
three aggregate sectors, i.e. agriculture, manufacturing, and services, makes it possible to test
for intersectoral change and thereby for the validity of the three-sector-hypothesis; similarly
we could focus on only one of these sectors, measuring e.g. the shares of individual
manufacturing industries on total manufacturing, and analyze intrasectoral convergence
instead. For a comprehensive analysis, we combine the different aggregation levels and test to
which extent both types of convergence contribute to overall convergence across countries.
For this purpose, we have to put the respective heterogeneity index values into relation. We
calculate the SHEN for N countries and assume K aggregate sectors, each consisting of Sk
industries; the employment shares b are calculated relative to total employment of the
aggregate sector (marked by the subscript k) or employment of the entire economy (subscript
E). It is easy to show that
4 The best known are the Herfindahl-type indices, such as the Specialization Index of Krugman (1991a) and the
Structural Deviation Index of Landesmann (2000), the Index of Inequality in Productive Structure by Cuadrado-
Roura (1999), and indices based on the Theil Dissimilarity Index (1967) and the Entropy Index of Specialization
and Concentration (Aiginger and Davies 2004; Brülhart and Traeger 2005).

7
∑∑ ∑∑ ∑∑∑
= = == = ==
−+−=−N
n
K
k
S
s
ksn
ks
n
EkS
N
n
N
n
K
k
Ekn
EkS
S
s
Esn
Es
k
kkbbb
Nbb
Nbb
SN 1 1 1
,,,1
1 1 1
,,1
1
,,
1111
(3)
Equation (3) implies that heterogeneity - and hence convergence - can be formally
decomposed into an intersectoral and an intrasectoral part (given by the first and the second
terms on the right-hand side, respectively), the latter being scaled by the average share of the
respective sector. The smaller a sector (i.e. the smaller its employment share Ekb , ) the smaller
is the impact of intrasectoral heterogeneity within this sector on the aggregate index of
structural heterogeneity.
We model the development of heterogeneity as an autoregressive integrated moving average
process (ARIMA(p,d,q)) with d = 1 according to the following (general) equation:
qtqttptptt SHESHESHE −−−− −−−+∆++∆+=∆ εθεθεµµϕ ...... 1111 .
To achieve stationarity of variances and covariances we use the logarithm of the values. First
differences have been taken in all time series, since the hypothesis of (trend-)stationarity was
rejected for all time series.5 The estimation result we are most interested in is the constant φ
which in the case of d = 1 indicates the (deterministic) time trend of the time series. A value
of φ significantly greater than zero is interpreted as a sign that heterogeneity increases over
time (i.e. divergence) whereas a significant and negative φ indicates a decrease of SHE and
thus convergence.
Using the SHE to study structural convergence and divergence still has some drawbacks:
First, the SHE does not enable us to see which countries (de-)specialize in which industries.
Second, we cannot distinguish between general divergence (convergence) in an industry and
one-country specialization (catch-up). In particular in case of divergence the difference
between one-country-specialization and a general dispersion trend would be notable: The
latter case is (more or less) the general type of divergence, i.e. countries gradually differ
regarding their factor endowment and competitiveness in the respective industry or sector.
Thus, an insignificant time trend of the SHEN here means that countries do not specialize. In
the former case, in contrast, one country specializes largely in one industry or sector whereas
the other countries diverge only slightly or might even converge. An insignificant time trend
in this case does not imply irrelevant or slow development, but rather the combination of
strong divergence evoked by the specialization of the leading country and minor divergence,
stagnation or slight convergence of the N-1 countries not specialized in this industry. Both
types affect the heterogeneity across countries, but they may be triggered by different reasons
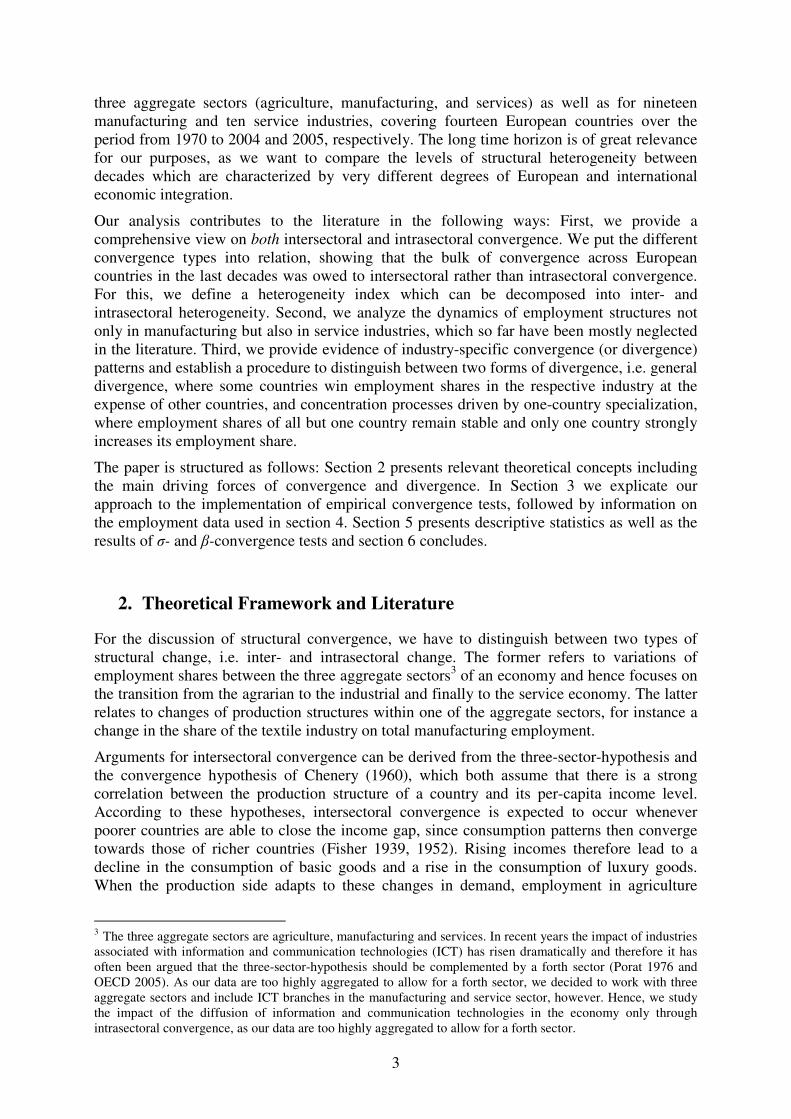
and in different types of industries. Figure 1 illustrates both divergence types in a simplified
form.
In the literature, this distinction of divergence types is not accounted for, and in fact the
differentiation is difficult, since the lines between one-country-specialization and general
divergence are blurry. As an approximate solution we calculate the SHEN, the SHE
N-1 for the
country group without the country deviating the most and the employment share of the
deviating country in relation to the European average. The development of these three
variables over time can be used to identify the convergence/divergence types: One-country-
specialization is present instead of general divergence if the time trends of both the SHEN and
5 Using the Augmented Dickey-Fuller test we cannot reject the hypothesis of a unit root for all time series, but
we find stationarity of the first differences for nearly all sectors/industries; for the results of the ADF see tables
C1 and C2 in the appendix. Lag orders were specified for each time series separately in order to achieve a good
fit of the model. However, we are not interested in the values of the AR- and MA-characteristics of the series.
Therefore the complete results of the ARIMA regressions are reported only in the appendix (see tables C3-C5),
while the interpretation is focused on the values of the constant.
8
the maximal deviation are significant and positive whilst the time trend of the SHEN-1
of the
remaining countries is significant and negative, insignificant, or significantly smaller than the
SHEN. As to convergence, a similar distinction is possible for the case that the most
specialized country gives up its position. We should expect a negative and significant time
trend of the maximum deviation, together with an insignificant time trend of the SHEN-1
. To
validate the result in case of one-country-specialization, we must rule out the possibility that
the role of the most deviating country devolves from one country to the other from one year to
the next. For general divergence a change in the most deviating country is irrelevant. In our
data, we find changes regarding the role of the most deviating country only for general
convergence or divergence - or to be more precise, in cases where no country is highly
specialized.
β-convergence
The second approach to measure convergence/divergence is β-convergence. We test for
unconditional convergence, which implies that all countries tend to converge until all
countries have the same employment shares in all respective industries. Therefore, countries
whose industrial structure deviates the most from the average structure have to undergo the
largest transition and adaptation process. This approach has been widely discussed in the
literature (Quah 1993). Indeed, there are several difficulties, for example both catching up and
leapfrogging will cause significant β-convergence, although the latter does not imply real
convergence, but could even lead to divergence. Nevertheless, β-convergence is still a
commonly used concept, based on the appealingly simple idea that if the initial value of the
variable (in the case of structural convergence e.g. the industries’ employment shares) has a
significant and negative impact on the growth of the variable over the investigation period 0-
T, then the countries are considered to converge:
sisisssi
T ee,,
0
, εβα ++=∆ , (4)
Where sisi
T
si
T eee,
0
,, −=∆ , and si
te, is the deviation of country i’s employment share in industry s
relative to the average European employment share of this industry at time t. We use the
deviation from the average instead of normal employment shares to control for structural
change which affects all countries similarly, thereby causing a bias on the convergence
estimation.
In order to fully exploit our cross-sectional time series data, we depart from the
aforementioned basic model and estimate the following equation:
time
se
cto
r sh
are
s
1.b One-Country-Specialization
time
se
cto
r sh
are
s
1.a General Divergence
Figure 1: Divergence Types
9
si
t
si
t
sssi
t ee,,
1
, εβα ++=∆ − (5)
Here, si
te,∆ is the annual change of country i’s deviation of the employment share in industry
s at time t from the European average, i.e. we test the hypothesis that there is a negative (or in
the case of divergence, positive) link between the deviation from the European average in the
previous year and the growth of the employment share in relation to the European average.
For the analysis of β-convergence, we use a linear6 random effects estimator, as we don’t
want to attribute the changes in employment shares to specific (fixed) country effects.7 Each
industry has been analyzed separately in order to distinguish between diverging and
converging branches, instead of making generalizations across industries.
4. Data
Our empirical analysis is based on macro data of 14 EU member states (EU 15 without
Luxembourg), covering the observation period of 1970-2004/2005. The data is drawn from
the KLEMS data base (see Timmer et al. 2007), which provides data collected from the EU
countries’ national accounts, and additionally from the public Eurostat data base.
Above we presented a method of detecting convergence and divergence, respectively. For the
implementation of these concepts, we use a classification of three aggregate sectors
(agriculture, manufacturing, and services), 19 manufacturing industries and 10 service
branches, according to the NACE classification. The agricultural sector is not further
differentiated, since we don’t expect substantial intrasectoral structural change within this
sector, which contains only three industries. Manufacturing industries are classified according
to their technology intensity, which is used for the analysis of technology diffusion processes.
The definition of technology classes is based on the OECD industry ranking on sector-average
R&D expenditures between 1991 and 1999 (see OECD 2003), which we adapted to our
aggregation level of manufacturing branches. Similarly, we build two groups of service
industries according to their knowledge intensity (see Laafia 1999), although classification is
only rough due to the high aggregation level of the branches. The knowledge and technology
classification, as well as a listing of the manufacturing and service industries, can be found in
table A1 in the appendix.
We exclude a number of industries due to various reasons: For public administration and
community services, like refuse disposal or cultural activities, data is partly missing or
available only on a high aggregation level. Besides, these branches are likely to be dominantly
influenced by the national political and administrative system. We also exclude the
construction sector due to its high sensitivity to the business cycle and public spending as well
as power and utilities (electricity, gas and water supply) for which we assume systemic
differences according to national regulatory conditions.
The main variable used is employment, captured in total yearly hours worked by employed
persons, which is the most comprehensive and (for our purpose) robust measure of sector
(industry) shares available. Total hours worked per year are preferable to the number of
employees, which can be biased by national and intertemporal differences in working hours
and the share of part-time workers. But a drawback of employment data is a productivity bias:
6 On our empirical method one could argue that a linear model does not take into account that our dependent
variable, the deviations from employment shares, is limited between -1 and 1 by definition. But as we don’t
expect any observations near the boundaries the OLS model is a reasonable choice, mainly due to its robustness
to heteroscedasticity and non-normality. 7 The adequacy of the random effects model has been confirmed by Hausman tests.

10
The production share of an industry in total production of the economy could be
overestimated if productivity in this industry is lower than average productivity, so that
comparing two countries, the one being less productive in the respective industry will appear
(wrongly) more specialized than it is in reality. Alternatively, output-oriented indicators such
as value added or exports could be used, but these bear the risk of being biased by inflation,
exchange rates, world market influences (e.g. the prices of intermediate inputs), variation due
to the business cycle and outsourcing. Besides, the calculation methods used for the national
accounts have been standardized only in 1995, so that measurement errors may occur in
particular at the beginning of the observation period.
Although employment data is less problematic than value added, some drawbacks of the long
observation period remain: At the beginning of our observation period only the six founding
member states comprised the European Community. Since then the European Union has been
continuously enlarged up to 15 member countries in 1995. We analyze member and (still)
non-member states together, without accounting for potential differences due to membership.
To put it differently, to just examine the impact of European integration on structural
convergence, one would have to adjust the sample according to membership. But as our focus
is not only on (politically induced) European integration, we investigate countries’
development irrespective of their accession to the European Union. Furthermore, countries are
likely to benefit from the expected accession to the European Union before the official
accession date, so that the membership bias can be neglected for our purposes. A second
question is how to treat Germany before and after reunification in 1990: On the one hand
comparability is affected if we switch between West and Unified Germany; on the other hand,
excluding East Germany after Unification and thus including only West Germany in the
analysis for the whole period will result in a biased picture of the German industry structure.
Therefore, we use the extrapolated values for Germany at its present size for 1970-1990
which are included in the KLEMS database.
5. Empirical results
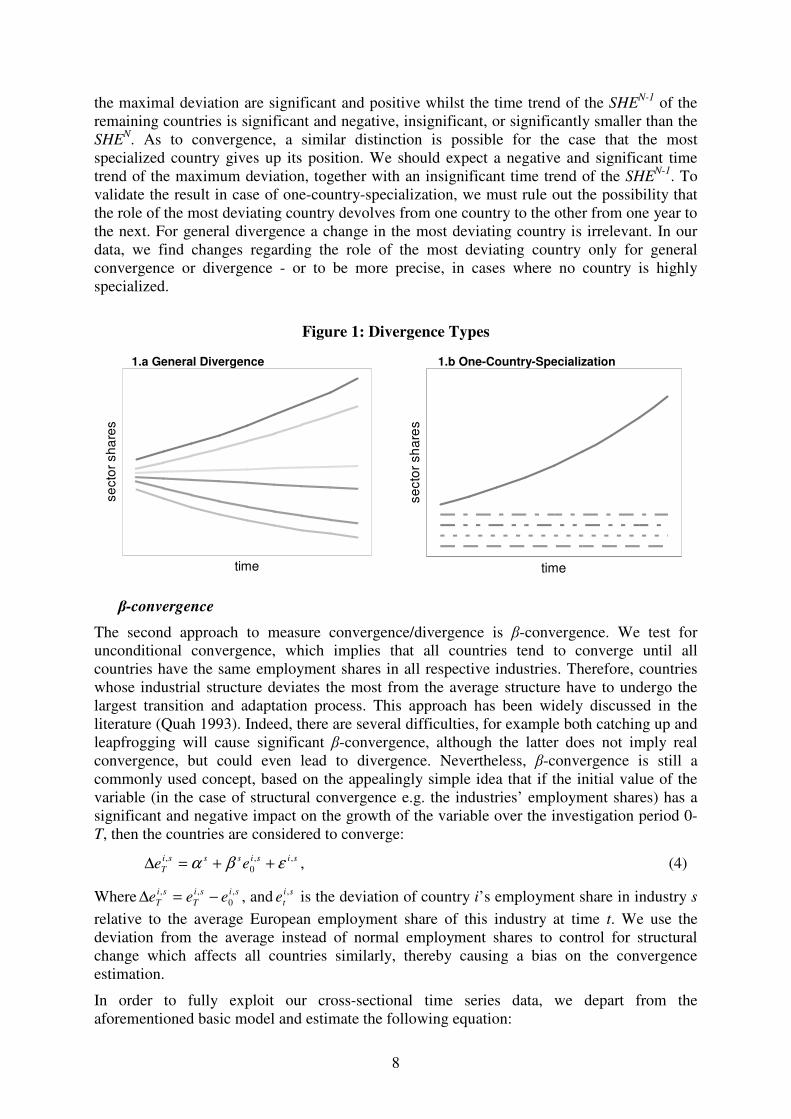
In the overall picture, which comprises both intersectoral and intrasectoral aspects, we clearly
find convergence between the European countries: Total structural heterogeneity (expressed
by the structural heterogeneity index) decreases steadily from 1970 to 2004 (from 0.096 to
0.054). As can be seen from figure 2.a, the driver of convergence is intersectoral change, as
the shares of the three aggregate sectors are getting more and more similar over time due to
industrialization and tertiarization processes occurring in all countries, especially in countries
which were characterized by a relatively large agricultural sector in the 1970s. So far the 3-
sector-hypothesis is corroborated.8 Intrasectoral convergence, in contrast, cannot be found:
Both within manufacturing and service industries, European countries do not seem to
converge, but rather diverge slightly. This is not unexpected, since the industries aggregated
in these two sectors may not develop in identical directions. Some industries may diverge due
to path-dependencies and economies of scale, whereas in other industries congestion costs and
high labor costs at production centers may lead to convergence. As these (simultaneous)
opposing trends may cancel each other out in the aggregate view, an analysis on the industry
level is necessary to detect intrasectoral convergence and divergence tendencies.
8 We do not go into detail on aggregate basic sectors, which have been investigated in some detail in previous
work (see e.g. Chenery and Syrquin 1989).

11
Figure 2: Structural convergence over time
Figure 2.b makes evident the sensitivity of the results to the weighting scheme of the
heterogeneity index. Conditional on the weight we assign to the relative size of countries or
sectors, the conclusions vary considerably. In figure 2.b, we compare the unweighted index of
structural heterogeneity (which we will use throughout the paper) with country- and sector-
weighted versions.9 We find that giving more weight to large sectors strengthens the
divergence trend, whereas favoring large countries over smaller ones leads to more
convergence. This shows that it is mainly large countries and small sectors which drive
convergence, while small countries and large sectors apparently tend to diverge. Analyzing
inter- and intrasectoral shifts separately, yields similar findings, as can be seen from figure B1
in the appendix. However, this comparison confirms our argument that results produced by a
composite index might be somewhat misleading and ought to be complemented by an in-
depth analysis of the development of the individual industries. In order to provide this
analysis, we take a closer look at intrasectoral convergence and divergence in the next
paragraphs.
A first overview of the data is given in tables 1 and 2, which list the values of the intrasectoral
heterogeneity indices SHEN of manufacturing and service industries at the beginning and the
end of the observation period.
9 For the calculation methods of the weighted indices see appendix B.
Source: EU KLEMS Database, March 2007
Note: The lines depicting inter- and intrasectoral heterogeneity in figure 2.a do not add up to total heterogeneity,
because the total SHE contains intrasectoral heterogeneity weighted by the respective sector share (see equation
(3)). Figure 2.a depicts the intrasectoral SHE in its unweighted form to abstract from changes in the size of the
sector, which would bias the SHE in manufacturing towards convergence and in services towards divergence.
2.a Inter- and Intrasectoral Heterogeneity
0
0.02
0.04
0.06
0.08
0.1
0.12
1970 1975 1980 1985 1990 1995 2000
SH
E
intersectoral heterogeneityintrasectoral heterogeneity in manufacturing
intrasectoral heterogeneity in servicestotal heterogeneity
2.b Weighted Heterogeneity Indices
0.03
0.05
0.07
0.09
0.11
0.13
0.15
0.17
1970 1975 1980 1985 1990 1995 2000
SH
Eunweighted SHEcountry weighted SHEsector weighted SHEcountry & sector weighted SHE

12
Table 1: Heterogeneity in manufacturing industries
SHEN
SHEN
/branch size Industry
1970 2004 1970 2004
Food, Beverages & Tobacco 0.5681 0.3976 0.0523 0.0301
Textile 0.6410 0.8927 0.0401 0.1066
Leather & Footwear 0.1298 0.2021 0.0539 0.1295
Wood 0.2686 0.1934 0.0856 0.0565
Paper 0.1828 0.1473 0.0704 0.0609
Printing & Publishing 0.1861 0.2134 0.0442 0.0364
Non-metal Mineral Products 0.1586 0.1691 0.0308 0.0353
Basic Metals 0.3402 0.1710 0.0689 0.0545
Fabricated Metals 0.2518 0.1848 0.0267 0.0166
Coke & Fuel 0.0464 0.0431 0.0685 0.0847
Rubber & Plastic 0.0758 0.1447 0.0260 0.0305
Machinery 0.4260 0.4591 0.0420 0.0442
Transport Equipment 0.3232 0.4571 0.0405 0.0527
Others; Recycling 0.1902 0.2507 0.0407 0.0409
Chemicals 0.1803 0.2679 0.0344 0.0502
Accounting & Computing Machines 0.0462 0.0893 0.0914 0.1641
Electrical Engineering 0.1853 0.1603 0.0457 0.0365
Communications Equipment 0.1458 0.1687 0.0606 0.0709
Medical, Precision & Optical Instruments 0.1734 0.1920 0.0652 0.0646
Source: EU KLEMS Database, March 2007
Table 1 shows that the degree of heterogeneity varies widely between industries. Note that the
heterogeneity index relative to industry size is relevant for this comparison in addition to the
SHE, as the SHE measures the absolute deviations from the European average. For example,
when considering the SHE, e.g. in 2004, the most heterogeneous branch seems to be Textiles
with a SHE of 0.8927, but if taking into account the size of the branches the (smaller)
Accounting and Computing Machines industry is obviously more heterogeneous than the
(larger) textile branch, with 0.1641 versus 0.1066, respectively. It is noticeable that the
impression of larger heterogeneity in low-technology industries, which is given by the
absolute SHE (in the left two rows of table 1), is not confirmed by the SHE relative to industry
size (in the right two rows of table 1). Evidently, the higher values of the absolute SHE are a
result of the larger employment shares of low-technology industries especially in the 1970’s.
Industries differ not only regarding the degree of heterogeneity, but also exhibit differences in
the rate and direction of the development of heterogeneity: Some industries, e.g. wood and
paper, are more homogeneous in 2004 as compared to 1970, while others increase their
heterogeneity, such as the textile, leather and footwear industries.
The same differences in the degree and development of heterogeneity can be found in service
industries (see table 2). The most heterogeneous branch is domestic services, both in 1970 and
in 2005, when taking into account heterogeneity in relation to branch size. Absolute
heterogeneity (listed in the second and third columns of table 2) even increases in this
industry, while the value of SHE/branch size is lower in 2005 than in 1970. This implies that
the increase in heterogeneity is due to employment growth of the industry, which expands
heterogeneity, rather than due to specialization tendencies. In other words: The SHE shows
that heterogeneity between countries has increased due to the development in the domestic
service industry, whereas the SHE in relation to branch size shows a reason for the shift in
heterogeneity.
13
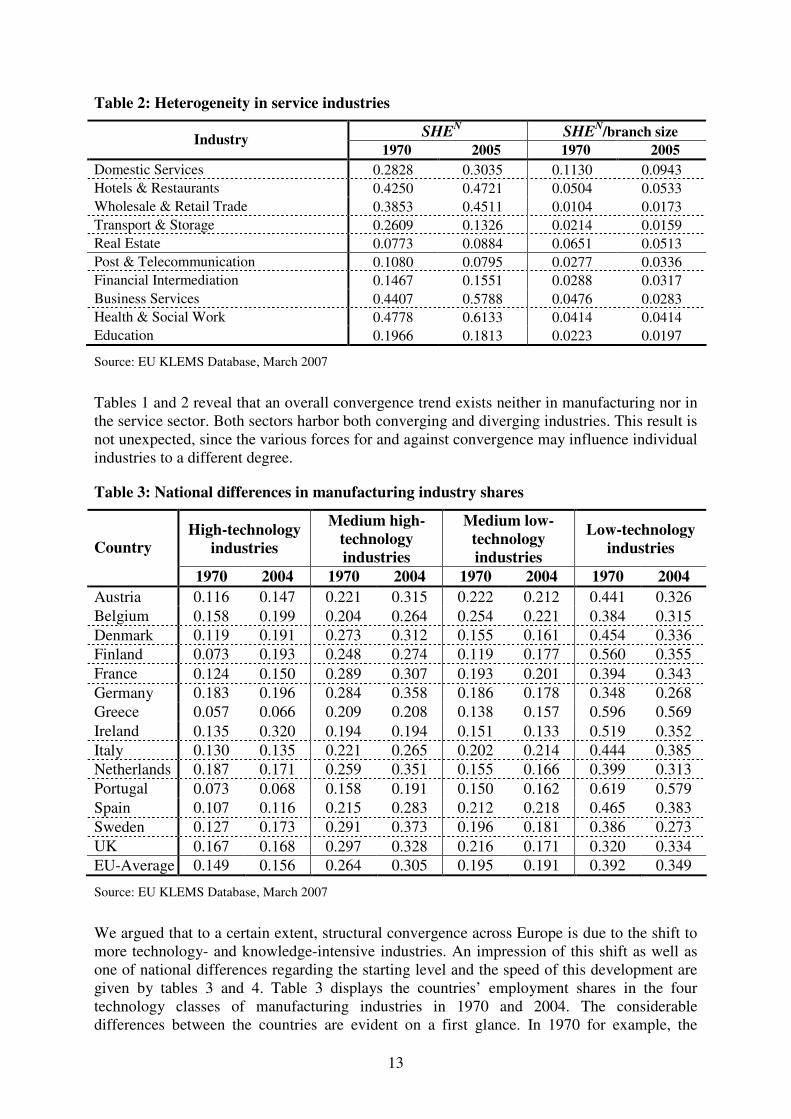
Table 2: Heterogeneity in service industries
SHEN
SHEN
/branch size Industry
1970 2005 1970 2005
Domestic Services 0.2828 0.3035 0.1130 0.0943
Hotels & Restaurants 0.4250 0.4721 0.0504 0.0533
Wholesale & Retail Trade 0.3853 0.4511 0.0104 0.0173
Transport & Storage 0.2609 0.1326 0.0214 0.0159
Real Estate 0.0773 0.0884 0.0651 0.0513
Post & Telecommunication 0.1080 0.0795 0.0277 0.0336
Financial Intermediation 0.1467 0.1551 0.0288 0.0317
Business Services 0.4407 0.5788 0.0476 0.0283
Health & Social Work 0.4778 0.6133 0.0414 0.0414
Education 0.1966 0.1813 0.0223 0.0197
Source: EU KLEMS Database, March 2007
Tables 1 and 2 reveal that an overall convergence trend exists neither in manufacturing nor in
the service sector. Both sectors harbor both converging and diverging industries. This result is
not unexpected, since the various forces for and against convergence may influence individual
industries to a different degree.
Table 3: National differences in manufacturing industry shares
High-technology
industries
Medium high-
technology
industries
Medium low-
technology
industries
Low-technology
industries Country
1970 2004 1970 2004 1970 2004 1970 2004
Austria 0.116 0.147 0.221 0.315 0.222 0.212 0.441 0.326
Belgium 0.158 0.199 0.204 0.264 0.254 0.221 0.384 0.315
Denmark 0.119 0.191 0.273 0.312 0.155 0.161 0.454 0.336
Finland 0.073 0.193 0.248 0.274 0.119 0.177 0.560 0.355
France 0.124 0.150 0.289 0.307 0.193 0.201 0.394 0.343
Germany 0.183 0.196 0.284 0.358 0.186 0.178 0.348 0.268
Greece 0.057 0.066 0.209 0.208 0.138 0.157 0.596 0.569
Ireland 0.135 0.320 0.194 0.194 0.151 0.133 0.519 0.352
Italy 0.130 0.135 0.221 0.265 0.202 0.214 0.444 0.385
Netherlands 0.187 0.171 0.259 0.351 0.155 0.166 0.399 0.313
Portugal 0.073 0.068 0.158 0.191 0.150 0.162 0.619 0.579
Spain 0.107 0.116 0.215 0.283 0.212 0.218 0.465 0.383
Sweden 0.127 0.173 0.291 0.373 0.196 0.181 0.386 0.273
UK 0.167 0.168 0.297 0.328 0.216 0.171 0.320 0.334
EU-Average 0.149 0.156 0.264 0.305 0.195 0.191 0.392 0.349
Source: EU KLEMS Database, March 2007
We argued that to a certain extent, structural convergence across Europe is due to the shift to
more technology- and knowledge-intensive industries. An impression of this shift as well as
one of national differences regarding the starting level and the speed of this development are
given by tables 3 and 4. Table 3 displays the countries’ employment shares in the four
technology classes of manufacturing industries in 1970 and 2004. The considerable
differences between the countries are evident on a first glance. In 1970 for example, the

14
Netherlands have had three times as much high-technology industry employment as Greece
(18.7% vs. 5.7%). The general shift from low to high-technology industries over time is also
remarkable. The transition of Finland and Ireland is particularly notable in this respect,
whereas the share of high-technology industries in Portugal has not only remained low, but
has even fallen from 1970 to 2004. Regarding the three countries with the highest shares of
high-tech industries in 1970 only Germany could substantially increase employment whereas
the Netherlands and the UK shifted towards more medium-high-technology industries. It
would be dangerous, however, to draw conclusions from these rough summary statistics.
A similar picture arises regarding the services sector (see table 4): There are large differences
between more developed and lagging countries (e.g. 48.1% knowledge intensive industry
employment in Sweden vs. 23.2% in Portugal in 1970), as well as a pronounced shift towards
high-value service branches for all countries.
Table 4: National differences in service industry shares
High knowledge
intensity
Low knowledge
intensity Country
1970 2005 1970 2005
Austria 0.356 0.506 0.644 0.494
Belgium 0.407 0.609 0.593 0.391
Denmark 0.422 0.592 0.578 0.408
Finland 0.383 0.561 0.617 0.439
France 0.451 0.584 0.549 0.416
Germany 0.388 0.549 0.612 0.451
Greece 0.335 0.401 0.665 0.599
Ireland 0.386 0.545 0.614 0.455
Italy 0.305 0.421 0.695 0.579
Netherlands 0.413 0.569 0.587 0.431
Portugal 0.232 0.337 0.768 0.663
Spain 0.247 0.399 0.753 0.601
Sweden 0.481 0.633 0.519 0.367
United Kingdom 0.447 0.575 0.553 0.425
EU-Average 0.386 0.518 0.614 0.482
Source: EU KLEMS Database, March 2007
Estimation results – manufacturing sector
Building on these descriptive statistics, we analyze intrasectoral convergence and divergence
using time-series and panel data methods (for σ- and β-convergence tests, respectively),
starting with the manufacturing sector.
As table 5 shows, we find both σ-convergence and σ-divergence in the manufacturing sector.
In low-technology industries, we find highly significance for both convergence and di-
vergence. There is a remarkably strong convergence trend in industries which are intensive in
natural resources such as the food, beverages and tobacco industry and the wood industry.
The development in both cases appears to be driven by de-specialization of formerly lagging
countries. In contrast, the labor-intensive textile production clearly diverges. The production
of leather and footwear also shows significant divergence; in both cases the most deviating
country, Portugal, significantly extends its lead in the leather and footwear industry over the
observation period. It seems therefore that while the North European countries developed
towards high-technology branches, Portugal remains specialized in low-technology industries.

15
Table 5: σ-convergence in manufacturing industries
time trend N
sSHEln time trend 1ln −N
sSHE time trend max deviation
Food, Beverages &
Tobacco -0.0110 ** (0.0052) -0.0087 (0.0071) -.0193 ** (0.0091)
Textile 0.0097 *** (0.0030) 0.0105 ** (0.0041) 0.0075 (0.0050)
Leather & Footwear 0.0135 ** (0.0059) 0.0122 ** (0.0061) 0.0187 * (0.0106)
Wood -0.0097 ** (0.0047) -0.0072 * (0.0044) -0.0195 * (0.0112)
Paper -0.0065 (0.0062) -0.0047 (0.0069) -0.0083 (0.0105)
0.0160 *** (0.0051) 0.0203 *** (0.0067) Printing & Publishing
1
-0.0215 *** (0.0081) -0.0194 * (0.0114) -0.0057 (0.0106)
-0.0221 * (0.0122) -0.198 (0.0215) Non-metal Mineral
Products2
0.0188 ** (0.0086) 0.0213 ** (0.0089) -0.0080 (0.0138)
Basic Metals5 -0.0044 (0.0027) -0.0036 (0.0023) -0.0235 *** (0.0088)
Fabricated Metals -0.0091 * (0.0052) -0.0106 * (0.0057) 0.0052 (0.0244)
Coke & Fuel 0.0001 (0.0119) -0.0025 (0.0158) 0.0062 (0.0193)
Rubber & Plastic 0.0192 *** (0.0056) 0.0212 *** (0.0058) 0.0056 (0.0101)
Machinery 0.0022 (0.0031) 0.0016 (0.0035) 0.0109 (0.0073)
Transport Equipment 0.0110 * (0.0061) 0.0109 * (0.0064) 0.0103 (0.0113)
Others; Recycling 0.0081 * (0.0046) 0.0019 (0.0043) 0.0188 ** (0.0089)
Chemicals 0.0116 ** (0.0059) 0.0067 * (0.0037) 0.0373 *** (0.0115)
Accounting &
Computing Machines 0.0194 (0.0163) 0.0029 (0.0132) 0.0387 * (0.0198)
Electrical Engineering -0.0050 (0.0035) -0.0065 * (0.0037) 0.0078 (0.0068)
-0.0099 (0.0103) Communications
Equipment3
0.0050 (0.0141) -0.0028 (0.0158) 0.1145 * (0.0614)
-0.0057 (0.0107) Medical, Precision &
Optical instruments4
0.0033 (0.0047) -0.0035 (0.0031) 0.0830 ** (0.0344)
***/**/* significant at 1/5/10 percent; standard errors in parenthesis.
1 structural break in 1993/1994;
2 structural break in 1984/1985;
3 structural break in 1994/1995;
4 structural
break in 1991/1992. In all cases, the first sub-period is in the upper line. 5 no logarithm.
A changing behavior is found in the case of printing and publishing: Until 1993, the
estimation reveals divergence, followed by significant convergence in the period 1994-2004.
16
These developments are not related to any particular specialization or de-specialization
tendencies of individual countries. A mixed picture arises also for the medium-low-
technology industries: The production and fabrication of metal products tends to converge,
while the non-metal mineral products branch has been diverging from the mid 1980s. Hence,
it seems that in the two metal industries the globalization factor prevails, i.e. the energy-
intensive fabrication of metal products is being outsourced, while in the non-metal industry
factors like economies of scale are more important.
Interestingly, none of the high and medium-high-technology industries shows significant
convergence, but a number of them clearly diverge. Above, we argued that two types of
divergence must be distinguished, though the distinction is to some extent blurry. Our data
point towards one-country-divergence in the chemical and recycling industries, whereas we
find general divergence for the transport equipment and the rubber and plastics industries. It
seems difficult to explain the differing development of these industries, which have many
characteristics in common: the existence of economies of scale, relatively high skill intensity
and path dependencies. The reason for the differential development may lie in a particular
starting position of the most deviating country in the case of one-country-specialization,
which is unobservable on the basis of our data.
No significant development is found for the high-technology industries “Accounting and
Computing Machines”, “Communications Equipment” and “Medical, Precision and Optical
Instruments” - at least as regards the overall picture. But in these industries, the significant
and positive trend of the maximum deviation is remarkable. It can be interpreted as a form of
one-country-specialization. The specialization in the last two industries above only starts in
the 1990s, with the emerging technological development and the growing importance of these
industries. We believe the reason for this pattern to lie in economies of scale and path
dependencies. Interestingly, the specializing countries are Finland (in Communications
Equipment) and Ireland (the other two branches), so this development can be seen as the
counterpart to the above-mentioned de-specialization of Finland and Ireland in low-
technology industries.
The estimations of β-convergence in general confirm these results, but in addition stress two
further aspects: The development of industry concentration (and thus divergence and
convergence) over the industry lifecycle, as well as the impact of European integration and
globalization become evident from the analysis of the three sub-periods shown in table 6. We
divided the observation period in order to capture the main changes of economic and
technological conditions. The first break in 1985/1986 corresponds to the Single European
Act (SEA), which we took as a milestone in European integration; the second break in
1994/1995 relates to the foundation of the WTO and the associated globalization tendencies.
The results show dynamic developments in particular in the first and the last period.
Significant convergence, visible by the significant and negative coefficient of the initial value
(β), is found in mature low and medium-low-technology industries, such as food and wood.
At a first glance, the divergence of the textile and leather production which are clearly labor
intensive, mature industries does not fit the pattern. But as both industries are to a large extent
path dependent and economic structures of the Mediterranean countries traditionally strongly
relied on them, structural change in Southern Europe took more than one decade to abandon
the textile industry, so that convergence started only in the 1990s. In the last sub-period both
branches show clear convergence, given the significant and negative β-values. These patterns
can be explained by a number of factors: First, lagging countries (in particular the south of
Europe) are catching up, which becomes manifest in both an increase in productivity and a

17
structural reorientation away from low-technology branches and towards more technology
and capital intensive industries.
Table 6: β-convergence in manufacturing industries
1970-1985 1986-1994 1995-2004
β Wald Chi² β Wald Chi² β Wald Chi²
Food, Beverages &
Tobacco
-0.0050
(0.0036) 0.84
-0.0284 ***
(0.0067) 17.95 ***
-0.0196
(0.0130) 2.26
Textile 0.0139 ***
(0.0029) 29.89 ***
0.0076
(0.0057) 1.79
-0.0108 **
(0.0050) 4.74 **
Leather & Footwear 0.0264 ***
(0.0055) 23.26 ***
0.0155 *
(0.0081) 3.69 *
-0.0159 ***
(0.0056) 8.03 ***
Wood -0.0233 ***
(0.0052) 17.87 ***
-0.0109
(0.0094) 1.34
-0.0084
(0.0089) 0.89
Paper -0.0122 ***
(0.0033) 11.50 ***
0.0084
(0.0054) 2.41
-0.0220 ***
(0.0043) 25.60 ***
Printing & Publishing 0.0017
(0.0071) 0.30
0.0011
(0.0114) 0.01
-0.0302 **
(0.0129) 5.46 **
Non-metal Mineral
Products
-0.0186 **
(0.0076) 5.08 **
-0.0104
(0.0161) 0.41
0.0122
(0.0113) 1.17
Basic Metals -0.0185 ***
(0.0044) 13.78 ***
-0.0463 ***
(0.0078) 35.51 ***
-0.0112
(0.0129) 0.76
Fabricated Metals -0.0091
(0.0070) 1.50
-0.0095
(0.0126) 0.57
-0.0097
(0.0117) 0.69
Coke & Fuel -0.0064
(0.0062) 0.66
-0.0193
(0.0132) 2.13
0.0000
(0.0104) 0.00
Rubber & Plastic -0.0041
(0.0127) 0.13
0.0181
(0.0111) 2.66
0.0074
(0.0108) 0.47
Machinery 0.0009
(0.0056) 0.00
0.0026
(0.0057) 0.21
-0.0003
(0.0078) 0.00
Transport Equipment 0.0074
(0.0102) 0.58
-0.0128
(0.0105) 1.49
0.0173 *
(0.0094) 3.38 *
Others; Recycling 0.0030
(0.0084) 0.39
0.0038
(0.0128) 0.09
0.0107
(0.0122) 0.77
Chemicals 0.0141 **
(0.0069) 4.83 **
0.0168
(0.0117) 2.06
0.0138 *
(0.0080) 2.97 *
Accounting & Computing
Machines
0.0270 ***
(0.0074) 16.20 ***
0.0601 ***
(0.0074) 65.85 ***
0.0027
(0.0133) 0.04
Electrical Engineering 0.0022
(0.0077) 0.10
-0.0054
(0.0127) 0.18
-0.0156
(0.0158) 0.97
Communications
Equipment
0.0043
(0.0041) 0.88
-0.0087
(0.0203) 0.18
0.0008
(0.0175) 0.00
Medical, Precision &
Optical Instruments
-0.0010
(0.0058) 0.07
-0.0033
(0.0104) 0.10
0.0336 **
(0.0145) 5.40 **
Observations per industry 224 126 140
***/**/* significant at 1/5/10 percent; standard errors in parenthesis.
In contrast to the low-technology industries, high-technology branches like the chemical
industry and computing machine production tend to diverge. In these industries economies of
scale, technological capabilities (as defined by Nelson 2005), and local knowledge spillovers
may act as preconditions that industries concentrate in few locations, in particular during early
stages of the industry lifecycle, which causes divergence. As industries become more mature,
18
technology diffusion will enable the follower countries to catch up, so that in later stages the
industry might converge if economies of scale do not outweigh the technology diffusion effect
- as might be the case in medium low-technology industries like basic metal production.
Interestingly, for two industries (Transport Equipment and Medical, Precision and Optical
Instruments) significant divergence is found only from 1995 onwards. Reasons for this
development could be the increasing importance of economies of scale, in particular in
transport equipment, or technological dynamics which strengthen the competitive advantages
of specialized countries.
In the medium low-technology industries we find β-convergence at the beginning of the
observation period, which we attribute mainly to technology transfer effects. Remarkable are
the differences to the results of the σ-convergence test: The production of non-metal mineral
goods was characterized by σ-divergence from the mid-1980s onwards, whereas we do not
find any significant β in the last two sub-periods. On the other hand, the production of basic
metals significantly converges only with regard to β, while convergence of the fabricated
metals industry is significant only in σ. This shows the limitations of convergence tests in case
of developments at a low magnitude.
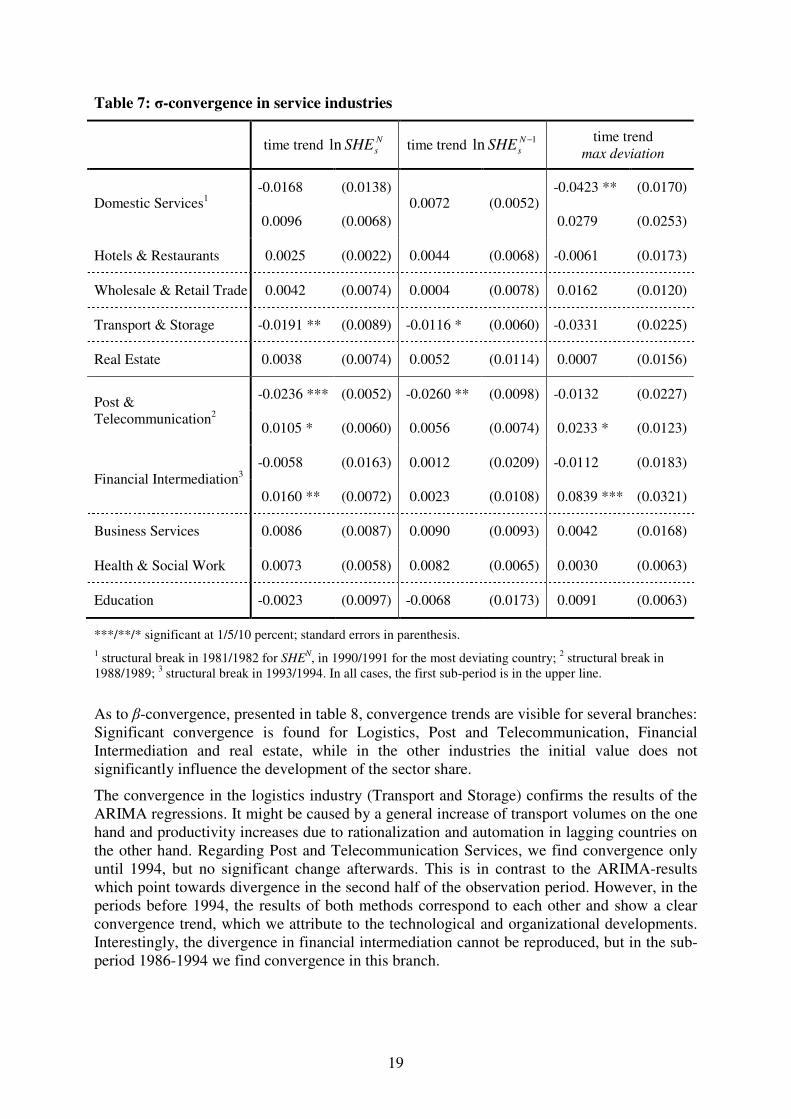
Estimation results – service sector
In the service sector our expectations that convergence or divergence should be low (as
pointed out in chapter 2), is largely confirmed. The time trends of the heterogeneity index are
not significant in most industries, as shown in table 7.10
Significant trends of the SHE are
found only in Transport and Storage, Post and Telecommunications Services, and Financial
Intermediation. The logistics branch significantly converges over the observation period,
while the latter two industries show a divergence trend in the second sub-period, which
appears to be caused by the specialization of one country: Ireland.
The remaining service branches do not show significant changes in heterogeneity over time.
In the first three branches, i.e. Domestic Services, Hotels and Restaurants and Trade, the
reason may be the immobility of these services, which restrains both (path dependent)
specialization within Europe and outsourcing to low-cost countries outside Europe. The
results for Education as well as for Health and Social work mirror the differences in the social
systems of the European countries. Interestingly, no significant divergence is found for
business services, which we expected to be characterized by economies of scale and a strong
dependence on the (diverging) manufacturing industries.
10
This impression is confirmed by figure B2 in the appendix, which reveals that there are in fact no pronounced
shifts in the values of the SHEN.
19
Table 7: σ-convergence in service industries
time trend N
sSHEln time trend 1ln −N
sSHE time trend
max deviation
-0.0168 (0.0138) -0.0423 ** (0.0170) Domestic Services
1
0.0096 (0.0068)
0.0072 (0.0052)
0.0279 (0.0253)
Hotels & Restaurants 0.0025 (0.0022) 0.0044 (0.0068) -0.0061 (0.0173)
Wholesale & Retail Trade 0.0042 (0.0074) 0.0004 (0.0078) 0.0162 (0.0120)
Transport & Storage -0.0191 ** (0.0089) -0.0116 * (0.0060) -0.0331 (0.0225)
Real Estate 0.0038 (0.0074) 0.0052 (0.0114) 0.0007 (0.0156)
-0.0236 *** (0.0052) -0.0260 ** (0.0098) -0.0132 (0.0227) Post &
Telecommunication2
0.0105 * (0.0060) 0.0056 (0.0074) 0.0233 * (0.0123)
-0.0058 (0.0163) 0.0012 (0.0209) -0.0112 (0.0183) Financial Intermediation
3
0.0160 ** (0.0072) 0.0023 (0.0108) 0.0839 *** (0.0321)
Business Services 0.0086 (0.0087) 0.0090 (0.0093) 0.0042 (0.0168)
Health & Social Work 0.0073 (0.0058) 0.0082 (0.0065) 0.0030 (0.0063)
Education -0.0023 (0.0097) -0.0068 (0.0173) 0.0091 (0.0063)
***/**/* significant at 1/5/10 percent; standard errors in parenthesis.
1 structural break in 1981/1982 for SHE
N, in 1990/1991 for the most deviating country;
2 structural break in
1988/1989; 3 structural break in 1993/1994. In all cases, the first sub-period is in the upper line.
As to β-convergence, presented in table 8, convergence trends are visible for several branches:
Significant convergence is found for Logistics, Post and Telecommunication, Financial
Intermediation and real estate, while in the other industries the initial value does not
significantly influence the development of the sector share.
The convergence in the logistics industry (Transport and Storage) confirms the results of the
ARIMA regressions. It might be caused by a general increase of transport volumes on the one
hand and productivity increases due to rationalization and automation in lagging countries on
the other hand. Regarding Post and Telecommunication Services, we find convergence only
until 1994, but no significant change afterwards. This is in contrast to the ARIMA-results
which point towards divergence in the second half of the observation period. However, in the
periods before 1994, the results of both methods correspond to each other and show a clear
convergence trend, which we attribute to the technological and organizational developments.
Interestingly, the divergence in financial intermediation cannot be reproduced, but in the sub-
period 1986-1994 we find convergence in this branch.
20
Table 8: β-convergence of service industries
1970-1985 1986-1994 1995-2005
β Wald
Chi² β
Wald
Chi² β
Wald
Chi²
Domestic Services 0.0014
(0.0143) 0.01
-0.0224
.0292 0.58
-0.0084
(0.0088) 0.90
Hotels & Restaurants 0.0015
(0.0043) 0.12
-0.0230
.0164 1.96
-0.0031
(0.0082) 0.14
Wholesale & Retail Trade -0.0086
(0.0128) 0.45
-0.0229
.0191 1.44
-0.0030
(0.0091) 0.10
Transport & Storage
-0.0128
**
(0.0064)
3.95 **
-0.0473
***
.0136
12.14 *** -0.0503 ***
(0.0126) 15.87 ***
Real Estate 0.0085
(0.0066) 1.70
-.0196
.0187 1.09
-0.0426 ***
(0.0157) 7.40 ***
Post & Telecommunication
-0.0204
***
(0.0073)
7.91 *** -0.0401 **
.0190 4.46 **
-0.0266
(0.0173) 2.34
Financial Intermediation -0.0079
(0.0100) 0.62
-0.0334 **
.0160 4.39 **
0.0012
(0.0160) 0.01
Business Services -0.0033
(0.0086) 0.15
-0.0018
.0122 0.02
0.0017
(0.0108) 0.03
Health & Social Work 0.0036
(0.0090) 0.16
-0.0064
.0067 0.92
-0.0044
(0.0051) 0.76
Education -0.0077
(0.0092) 0.71
-0.0248
.0197 1.59
-0.0123
(0.0125) 0.97
Observations per industry 210 126 154
***/**/* significant at 1/5/10 percent; t-statistics in parenthesis.
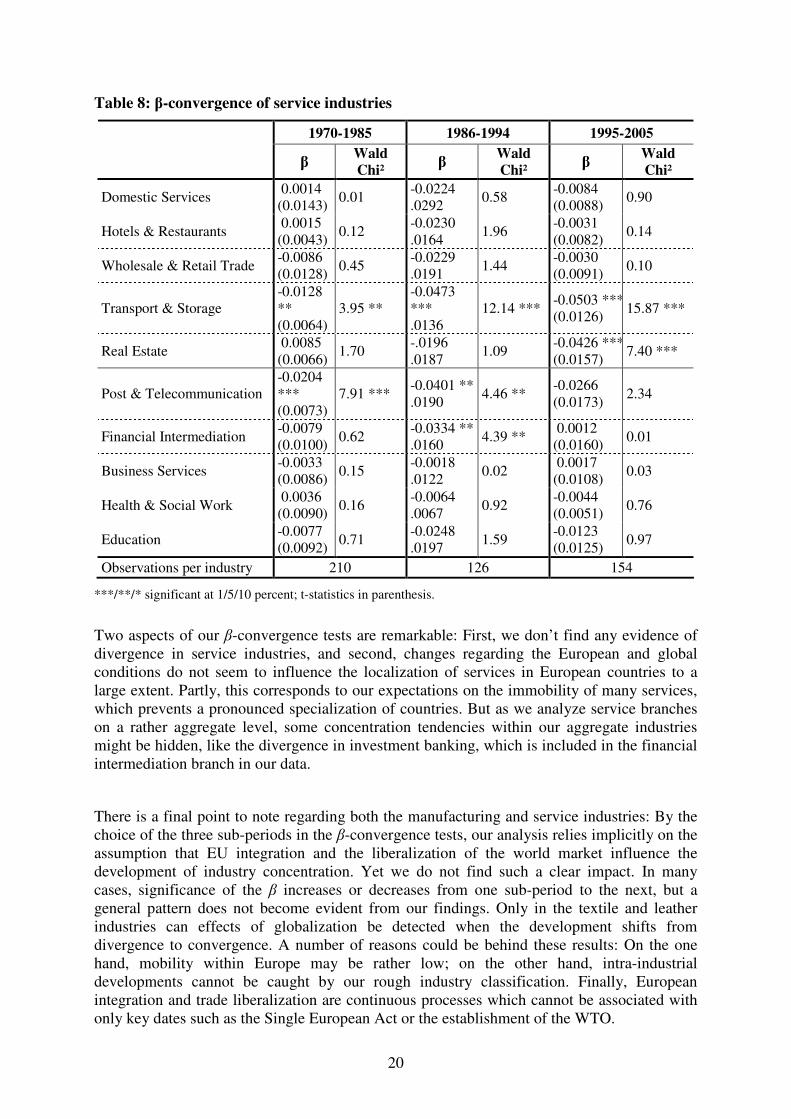
Two aspects of our β-convergence tests are remarkable: First, we don’t find any evidence of
divergence in service industries, and second, changes regarding the European and global
conditions do not seem to influence the localization of services in European countries to a
large extent. Partly, this corresponds to our expectations on the immobility of many services,
which prevents a pronounced specialization of countries. But as we analyze service branches
on a rather aggregate level, some concentration tendencies within our aggregate industries
might be hidden, like the divergence in investment banking, which is included in the financial
intermediation branch in our data.
There is a final point to note regarding both the manufacturing and service industries: By the
choice of the three sub-periods in the β-convergence tests, our analysis relies implicitly on the
assumption that EU integration and the liberalization of the world market influence the
development of industry concentration. Yet we do not find such a clear impact. In many
cases, significance of the β increases or decreases from one sub-period to the next, but a
general pattern does not become evident from our findings. Only in the textile and leather
industries can effects of globalization be detected when the development shifts from
divergence to convergence. A number of reasons could be behind these results: On the one
hand, mobility within Europe may be rather low; on the other hand, intra-industrial
developments cannot be caught by our rough industry classification. Finally, European
integration and trade liberalization are continuous processes which cannot be associated with
only key dates such as the Single European Act or the establishment of the WTO.

21
6. Conclusion
Structural convergence between industrialized countries is a topic which has not been paid a
great deal of attention in the literature. We fill this gap by providing a comprehensive
investigation of convergence of 14 European countries over the period 1970-2004/2005. Our
analysis is based on employment data drawn from national accounts, which is provided by the
EU KLEMS database. We take into account both intersectoral and intrasectoral convergence,
focusing first on shifts between agriculture, manufacturing and services and second on 19
manufacturing and 10 service industries, respectively. Relying on the two common
convergence tests, σ- and β-convergence, we consider also industry specific differences i.e.
that some branches might converge and others diverge (instead of drawing generalizing
conclusions for all manufacturing or service industries).
We find significant and rapid intersectoral convergence, accompanied by a mixed picture with
regard to intrasectoral convergence. In total, European countries do not become more similar
regarding the sector composition within the industry and service sectors, respectively; rather
some industries are found to converge over time, whereas others diverge or do not change at
all. In particular, mature, labor intensive industries show convergence tendencies, while
emerging technology- and knowledge-intensive branches tend to diverge. We explain this by
the changes in the preponderance of the existing antagonistic forces over the industry life
cycle: In emerging industries (with high-technology or knowledge intensity) convergence-
favoring influences prevail, such as knowledge spillovers and the existence of a specialized
labor force. With increasing maturity, these effects diminish, and industries disperse over the
other countries, as long as economies of scale do not outweigh the technology diffusion
effect. In mature branches, finally, general outsourcing and shrinking trends lead to
convergence. Our results on manufacturing industries confirm these hypotheses, showing a
distinct divergence-convergence pattern over time. Service branches, in contrast, converge or
diverge less dynamically, due to the low mobility of services and the importance of local
markets. We find significant convergence only in Post and Telecommunication Services and
Logistics, which might be caused by technological and organizational developments. A more
disaggregated branch classification would be required in order to detect country specialization
effects, like that of the UK in investment banking.
Overall, the results presented in this paper draw a comprehensive picture of the complex
interplay between the European countries, varying from industry to industry. For future
research, we see two promising possibilities: First, research could combine the overall view
on European countries with a finer focus on regional convergence in order to distinguish
between international and intra-national convergence and shed light on the role of regional
industry concentration. In this respect it will be interesting to test to what degree the higher
factor mobility between regions has an effect on overall concentration and specialization
patterns and whether the ongoing European integration has favored the concentration of
economic activity in metropolitan areas at the expense of peripheral regions. Second, it would
be interesting to investigate the adjustment process of the Central and Eastern European
countries towards the economies of Western Europe; catch-up in terms of income and
nominal convergence has been substantial, and one might expect the same to hold for
structural convergence as well.

22
7. References
Abramovitz, M. and P.A. David (1996), Convergence and Deferred Catch-Up: Productivity
Leadership and the Waning of American Exceptionalism, in: Landau, R., Taylor, T. and G.
Wright (eds.), The Mosaic of Economic Growth, Stanford, 21-62.
Aiginger, K. and St. Davis (2004), Industrial specialization and geographic concentration: two
sides of the same coin? Not for the European Union, in: Journal of Applied Economics, Vol.
12, 231-248.
Aiginger, K. and E. Rossi-Hansberg (2006), Specialization and concentration: a note on
theory and evidence, in: Empirica, Vol. 33, 255-266.
Amiti, M (1998), New trade theories and industrial location in the EU: a survey of evidence,
in: Oxford Economic Policy, Vol. 14, 45-53.
Arthur, B. (1989), Competing technologies, increasing returns, and lock-in by historical
events, in: The Economic Journal, Vol. 99, 116-131.Balassa. B. (1965), Trade Liberalisation
and Revealed Comparative Advantage, in: Manchester School of Economics and Social
Studies, Vol. 33, 99-123.
Baldwin, R.E. and A.J. Venables (1995), Regional economic integration, in: Grossman, G.M.
and K. Rogoff (eds,), Handbook of International Economics, Volume 3, 1597-1644.
Barro, R.J. and X. Sala-i-Martin (1991), Convergence across states and regions. in: Brookings
Paper on Economic Activity Vol. 1, 107-182.
Barro, R.J. and X. Sala-i-Martin (1992), Convergence, in: Journal of Political Economy, Vol.
100, 223-251.
Brülhart, M. (1995), Industrial specialisation in the European Union: A test of the new trade
theory, Trinity Economic Papers, No 95/5.
Brülhart, M. (1998), Economic Geography, Industry Location and Trade: The Evidence, in:
The World Economy, Vol. 21, 775-801.
Brülhart, M. (2001b), Evolving Geographical Specialisation of European Manufacturing In-
dustries, in: Weltwirtschaftliches Archiv, Vol. 137, 215-243.
Chenery H.B. (1960), Patterns of Industrial Growth, in: The American Economic Review, Vol.
50, 624-654.
Chenery, H.B. and M. Syrquin (1989), Three Decades of Industrialization, in: World Bank
Economic Review, Vol. 3, 145-181.
Clark, C. (1940), The Conditions of Economic Progress, Macmillan.
Combes, P.P. and H. Overman (2004), The Spatial Distribution of Economic Activities in the
European Union, in: Thisse, J.F. and V. Henderson (eds.), Handbook of urban and regional
economics, Vol. 4, 2845-2910.
Cuadrado-Roura, J.R., Garcia-Greciano, B. and J.L. Raymond (1999), Regional Convergence
in Productivity and Productive Structure: The Spanish Case, in: International Regional
Science Review, Vol. 22, 35-53.
Dalum, B. and G. Villumsen (1996), Are OECD Export Specialisation Patterns ‘Sticky?’
Relations to the Convergence-Divergence Debate, DRUID Working Paper No. 96-3.

23
Dalum, B., Laursen, K. and G. Villumsen (1998), Structural change in OECD Export
Specialisation Patterns: De-specialisation and ‘Stickiness’, DRUID & IKE Group,
Department of Business Studies, Aalborg University.
De la Fuente, A. (1997), The empirics of growth and convergence: a selective review, in:
Journal of Economic Dynamics and Control, Vol. 21, 64-75.
European Commission (2004), Eine neue Partnerschaft für die Kohäsion: Konvergenz,
Wettbewerbsfähigkeit, Kooperation, Dritter Bericht über den wirtschaftlichen und sozialen
Zusammenhalt, Brüssel.
European Union (2006), Treaty establishing the European Community, Consolidated Version,
Official Journal of the European Union, 29.12.2006.
Fagerberg, J. (1994), Technology and International Differences in Growth Rates, in: Journal
of Economic Literature, Vol. 32, 1147-75.
Fagerberg, J. (2000), Technological progress, structural change and productivity growth: a
comparative study, in: Structural Change and Economic Dynamics, Vol. 11, 393-411.
Fisher, A.G.B. (1939), Production, Primary, Secondary and Tertiary, in: The Economic
Record, Vol. 15, 22-38.
Fisher, A.G.B. (1952), A Note on Tertiary Production, in: Economic Journal, Vol. 62, 820-
834.
Fourastié J. (1949), Le Grand Espoir du XXe Siècle: Progrès Technique – Progrès
Economique – Progrès Social, Paris.
Fujita, M., P. Krugman and A.J. Veblen (1999), The spatial economy: cities, regions and
international trade, MIT Press.
Guerrieri, G. and S. Iammarino (2003), The Dynamics of Export Specialisation in the Regions
of the Italian Mezzogiorno: Persistence and Change, SPRU Electronic Working Papers No.
105.
Gugler, K. and M. Pfaffermayr (2004), Convergence in Structure and Productivity in
European Manufacturing?, in: German Economic Review, Vol. 5, 61-79.
Helpman, E. and P. Krugamn (1985), Market Structure and Foreign Trade. Increasing
Returns, Imperfect Competition, and the International Economy, Harvester Press.
Imbs, J. and R. Wacziarg (2003), Stages of Diversification, in: American Economic Review,
Vol. 93, 63-86.
Jackman, R. and C. Pauna (1997), Labour market policy and the reallocation of labour across
sectors, in: Zecchini, S. (ed), Lessons from the Economic Transition, Kluwer, 373-392.
Karsten, J. (1996), Economic Development and Industrial Concentration; an inverted U-
curve, Kiel Working Paper 770.
Krugman, P. (1980), Scale Economies, Product Differentiation, and the Pattern of Trade, in:
American Economic Review, Vol. 70, 950-59.
Krugman, P. (1991a), Geography and Trade, MIT Press.
Krugman, P. (1991b), Increasing returns and economic geography, in: Journal of Political
Economy, Vol. 99, 183-199.
Krugman, P. (1993), Lessons of Massachusetts for EMU, in: Torres F. and F. Giavassi
(Hrsg.), Adjustment and Growth in European Monetary Union, Cambridge University Press,
241-269.
24
Krugman P. and A.J. Venables (1995), Globalisation and the Inequality of Nations, NBER
Working Paper.
Krugman P. and A.J. Venables (1996), Integration, specialization and adjustment, in: Euro-
pean Economic Review, Vol. 40, 959-967.
Laafia, I. (1999), Beschäftigung im Hochtechnologiebereich, in: Eurostat (eds.), Statistik kurz
gefasst, Thema 9, Forschung und Entwicklung, Luxembourg.
Landesmann, M. (2000), Structural change in the Transition Economies 1989-1999, in:
Economic Survey of Europe, Vol. 2, 95-123.
Longhi, C. and A. Musolesi (2007), European cities in the process of economic integration:
towards structural change, in: Annuals of Regional Science, Vol. 41, 333-351.
Midelfart-Knarvik, K., H.G. Overman, S.J. Redding and A.J. Venables (2000), The Location
of European industry, in: European Commission (eds.), European integration and the
functioning of product market, Brussels, 213-270.
Midelfart, K., Overman H.G. and Venables A.J. (2003), Monetary Union and the Economic
Geography of Europe, in: Journal of Common Market Studies, Vol. 41, 847–868.
Nelson, R. (2005), Technology, Institutions, and Economic Growth, Harvard University.
OECD (2003), Classification of manufacturing industries based on technology. OECD
Science, Technology Scoreboard 2003 – Towards a knowledge-based economy, OECD, Paris.
OECD (2005), Guide to Measuring the Information Society, Paris.
Ohlin, B. (1933) Interregional and International Trade, Cambridge.
Pasinetti, L.L. (1993), Structural Economic Dynamics – A Theory of the Economic
Consequences of Human Learning, Cambridge University Press.
Percoco, M., Dall’erba, S. and G. Hewings (2005), Structural Convergence of the National
Economies of Europe, MPRA paper 1380.
Pigliaru, F. (2003), Detecting Technological Catch-Up in Economic Convergence, in:
Metroeconomica, Vol. 54, 161-178.
Porat, M.U. (1976), The Information Economy, Vol. 1, UMI Dissertation Information
Service.
Puga, D. (1999), The rise and fall of regional inequalities, in: European Economic Review,
Vol. 43, 303-334.
Quah, D. (1993). Galton’s fallacy and tests of convergence hypothesis, in: The Scandinavian
Journal of Econometrics, Vol. 95, 9-19.
Rossi-Hansberg, E. (2005), A spatial theory of trade, in: American Economic Review, Vol. 95,
1464–1491.
Solow, R. (1957), Technical Change and Aggregate Production Function, in: Review of
Economics and Statistics, Vol. 39, 312-320.
Theil, H. (1967), Economics and Information Theory. NorthHolland.
Timmer, M., O'Mahony, M. and B. van Ark (2007), The EU KLEMS Growth and
Productivity Accounts: An Overview, University of Groningen and University of
Birmingham.
Venables, A. (1996), Equilibrium locations of vertically linked industries, in: International
Economic Review, Vol. 37, 341-359.
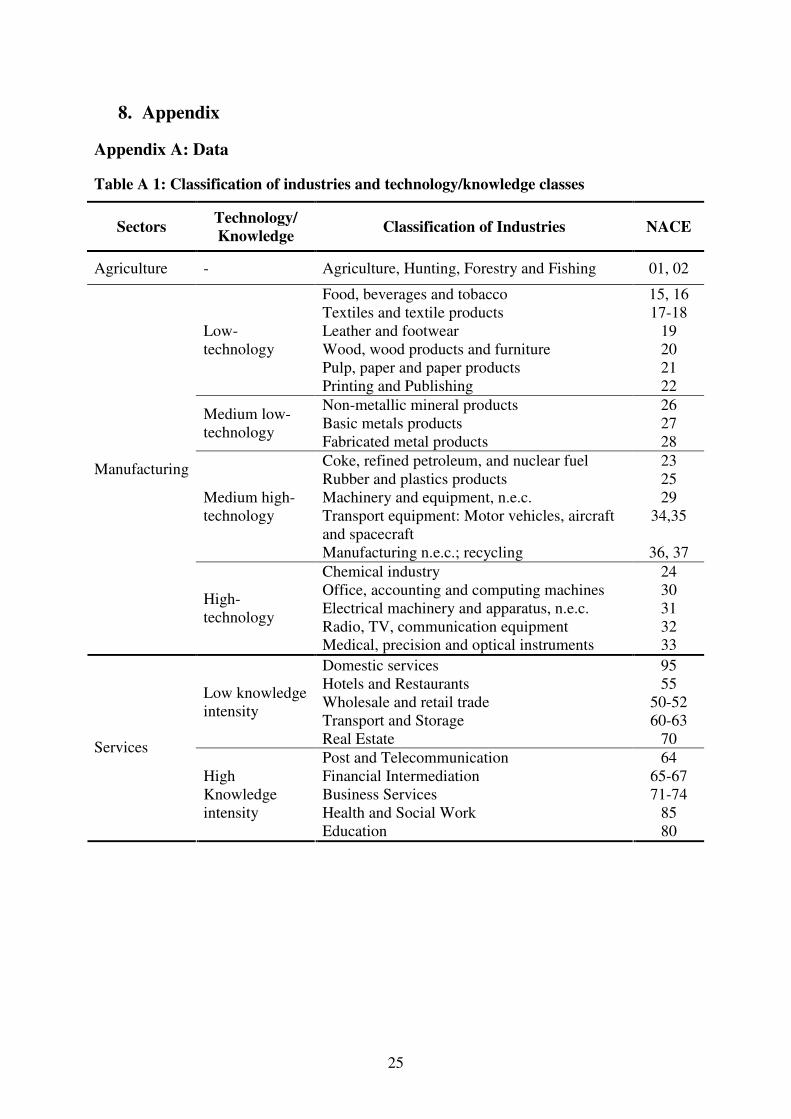
25
8. Appendix
Appendix A: Data
Table A 1: Classification of industries and technology/knowledge classes
Sectors Technology/
Knowledge Classification of Industries NACE
Agriculture - Agriculture, Hunting, Forestry and Fishing 01, 02
Low-
technology
Food, beverages and tobacco
Textiles and textile products
Leather and footwear
Wood, wood products and furniture
Pulp, paper and paper products
Printing and Publishing
15, 16
17-18
19
20
21
22
Medium low-
technology
Non-metallic mineral products
Basic metals products
Fabricated metal products
26
27
28
Medium high-
technology
Coke, refined petroleum, and nuclear fuel
Rubber and plastics products
Machinery and equipment, n.e.c.
Transport equipment: Motor vehicles, aircraft
and spacecraft
Manufacturing n.e.c.; recycling
23
25
29
34,35
36, 37
Manufacturing
High-
technology
Chemical industry
Office, accounting and computing machines
Electrical machinery and apparatus, n.e.c.
Radio, TV, communication equipment
Medical, precision and optical instruments
24
30
31
32
33
Low knowledge
intensity
Domestic services
Hotels and Restaurants
Wholesale and retail trade
Transport and Storage
Real Estate
95
55
50-52
60-63
70 Services
High
Knowledge
intensity
Post and Telecommunication
Financial Intermediation
Business Services
Health and Social Work
Education
64
65-67
71-74
85
80

26
Appendix B: Heterogeneity Indices
1. Country-weighted heterogeneity index
;;1
1 1 EUemploymenttotal
ncountryemploymenttotalwbbw
ScwSHE
nN
n
S
s
sn
s
nN =−= ∑ ∑= =
2. Sector-weighted heterogeneity index
;;1
1 1
ss
N
n
S
s
sn
s
sNbwbbw
NswSHE =−= ∑∑
= =
3. Country- & sector-weighted heterogeneity index
;1 1
∑ ∑= =
−=N
n
S
s
sn
s
snNbbwwcswSHE
Figure B 1: Inter-/intrasectoral heterogeneity indices
Intersectoral Heterogeneity
0.03
0.04
0.05
0.06
0.07
0.08
0.09
1970 1975 1980 1985 1990 1995 2000
SH
E
unw eighted SHE country w eighted SHE
sector w eighted SHE country & sector w eighted SHE
Manufacturing Sector
0
0.01
0.02
0.03
1970 1975 1980 1985 1990 1995 2000
SH
E
unw eighted SHE country w eighted SHE
sector w eighted SHE country & sector w eighted SHE

27
Service Sector
0.01
0.02
0.03
0.04
1970 1975 1980 1985 1990 1995 2000
SH
E
unw eighted SHE country w eighted SHE
sector w eighted SHE country & sector w eighted SHE
Figure B 2: σ-convergence in service industries
0
0.1
0.2
0.3
0.4
0.5
0.6
0.7
1970 1975 1980 1985 1990 1995 2000 2005
SH
E
Domestic Services Hotels & Restaurants
Wholesale & Retail Trade Transport & Storage
Post & Telecommunication Financial Intermediation
Real Estate Business Services
Health & Social Work Education

28
Appendix C: Empirical results
Table C 1: Augmented Dickey-Fuller test for manufacturing industries
N
tSHEln 1ln −N
tSHE ln max deviation
d = 0 d = 1 d = 0 d = 1 d = 0 d = 1
Food, Beverages &
Tobacco -0.852 -4.742 -1.835 -4.891 0.461 -3.874
Textile -2.922 -4.417 -2.398 -5.114 -2.023 -5.273
Leather & Footwear -2.759 -3.737 -3.036 -3.822 -1.189 -4.311
Wood -1.608 -4.089 -1.427 -5.148 -1.655 -5.000
Paper -1.037 -3.995 -1.779 -5.359 -0.645 -5.443
Printing & Publishing -1.632 -4.102 -1.741 -3.988 -0.597 -6.090
Non-metal Mineral
Products -1.446 -3.703 -1.469 -4.049 -2.661 -4.587
Basic Metals -0.468 -5.101 -1.245 -5.067 -1.644 -3.884
Fabricated Metals 0.179 -6.200 0.279 -6.321 -1.376 -5.110
Coke & Fuel -0.512 -3.569 -0.241 -4.042 -1.543 -5.394
Rubber & Plastic -1.330 -3.826 -1.641 -3.599 0.58 -6.157
Machinery -1.078 -5.279 -1.548 -5.951 -2.07 -3.725
Transport Equipment -0.394 -4.791 -0.879 -4.728 -1.414 -5.388
Others; Recycling -0.636 -5.024 -1.046 -4.753 -0.557 -5.515
Chemicals -1.371 -7.161 -1.231 -7.235 -2.022 -5.239
Accounting &
Computing Machines -1.194 -2.187 -1.203 -2.638 0.498 -4.009
Electrical Engineering -0.250 -4.309 -2.055 -5.396 2.606 -2.523
Communications
Equipment -0.468 -4.127 -0.980 -4.354 -0.194 -5.227
Medical, Precision &
Optical instruments 0.111 -4.599 -1.512 -4.688 -0.073 -3.518
1%/5%/10% critical values: -3.689/-2.975/-2.619 (d=0); -3.696/-2.978/-2.620 (d=1).

29
Table C 2: Augmented Dickey-Fuller test for service industries
N
tSHEln 1ln −N
tSHE ln max deviation
d = 0 d = 1 d = 0 d = 1 d = 0 d = 1
Domestic Services -0.596 -5.630 0.006 -5.767 -2.270 -6.041
Hotels &
Restaurants -2.383 -9.826 -1.249 -8.087 -1.597 -4.606
Wholesale & Retail
Trade -2.034 -5.449 -1.359 -4.634 -2.539 -8.004
Transport & Storage 1.348 -5.279 0.302 -6.338 0.852 -5.894
Real Estate -2.380 -4.946 -2.684 -5.253 -1.207 -3.365
Post &
Telecommunication -1.711 -5.457 -1.899 -6.065 -1.174 -5.468
Financial
Intermediation -1.461 -7.091 -1.027 -8.038 -0.056 -4.895
Business Services -0.636 -4.032 -0.548 -4.187 -1.577 -2.769
Health & Social
Work -2.629 -4.347 -2.529 -4.391 -1.926 -4.83
Education -1.323 -4.517 -1.242 -4.330 -1.844 -4.99
Observations 35 34 35 34 35 34
1% critical value -3.682 -3.689 -3.682 -3.689 -3.682 -3.689
1%/5%/10% critical values: -3.682/-2.972/-2.618 (d=0); -3.689/-2.975/-2.619 (d=1).
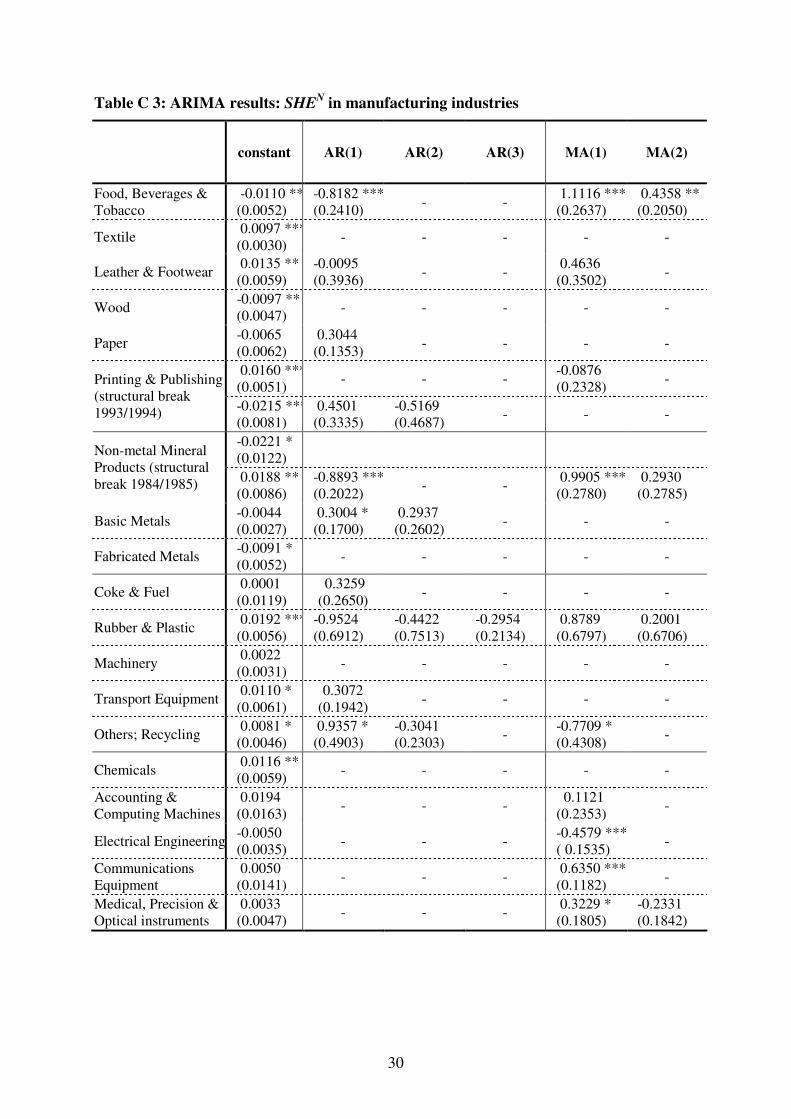
30
Table C 3: ARIMA results: SHEN in manufacturing industries
constant AR(1) AR(2) AR(3) MA(1) MA(2)
Food, Beverages &
Tobacco
-0.0110 **
(0.0052)
-0.8182 ***
(0.2410) - -
1.1116 ***
(0.2637)
0.4358 **
(0.2050)
Textile 0.0097 ***
(0.0030) - - - - -
Leather & Footwear 0.0135 **
(0.0059)
-0.0095
(0.3936) - -
0.4636
(0.3502) -
Wood -0.0097 **
(0.0047) - - - - -
Paper -0.0065
(0.0062)
0.3044
(0.1353) - - - -
0.0160 ***
(0.0051) - - -
-0.0876
(0.2328) - Printing & Publishing
(structural break
1993/1994) -0.0215 ***
(0.0081)
0.4501
(0.3335)
-0.5169
(0.4687) - - -
-0.0221 *
(0.0122) Non-metal Mineral
Products (structural
break 1984/1985) 0.0188 **
(0.0086)
-0.8893 ***
(0.2022) - -
0.9905 ***
(0.2780)
0.2930
(0.2785)
Basic Metals -0.0044
(0.0027)
0.3004 *
(0.1700)
0.2937
(0.2602) - - -
Fabricated Metals -0.0091 *
(0.0052) - - - - -
Coke & Fuel 0.0001
(0.0119)
0.3259
(0.2650) - - - -
Rubber & Plastic 0.0192 ***
(0.0056)
-0.9524
(0.6912)
-0.4422
(0.7513)
-0.2954
(0.2134)
0.8789
(0.6797)
0.2001
(0.6706)
Machinery 0.0022
(0.0031) - - - - -
Transport Equipment 0.0110 *
(0.0061)
0.3072
(0.1942) - - - -
Others; Recycling 0.0081 *
(0.0046)
0.9357 *
(0.4903)
-0.3041
(0.2303) -
-0.7709 *
(0.4308) -
Chemicals 0.0116 **
(0.0059) - - - - -
Accounting &
Computing Machines
0.0194
(0.0163) - - -
0.1121
(0.2353) -
Electrical Engineering-0.0050
(0.0035) - - -
-0.4579 ***
( 0.1535) -
Communications
Equipment
0.0050
(0.0141) - - -
0.6350 ***
(0.1182) -
Medical, Precision &
Optical instruments
0.0033
(0.0047) - - -
0.3229 *
(0.1805)
-0.2331
(0.1842)

31
Table C 4: ARIMA results: SHEN-1
in manufacturing industries
constant AR(1) AR(2) AR(3) MA(1) MA(2)
Food, Beverages &
Tobacco
-0.0087
(0.0071)
-0.8331 ***
(0.1297) - -
1.4896 ***
(0.1895)
0.9194 ***
(0.2205)
Textile 0.0105 **
(0.0041) - - - - -
Leather & Footwear 0.0122 **
(0.0061)
-0.0332
(0.3298) - -
0.5102 *
(0.3030) -
Wood -0.0072 *
(0.0044)
-0.0875
(0.2778)
-0.0080
(0.2899) - - -
Paper -0.0047
(0.0069)
0.0180
(0.1698) - - - -
0.0203 ***
(0.0067) - - - - - Printing & Publishing
(structural break
1993/1994) -0.0194 *
(0.0114)
0.7412
(0.4637)
-0.6332 ***
(0.1964) - - -
-0.198
(0.0215)
0.4498 *
(0.2586) - - - - Non-metal Mineral
Products (structural
break 1984/1985) 0.0213 **
(0.0089)
-0.9459 **
(0.3776) - -
0.9244
(0.5650)
0.1017
(0.3010)
Basic Metals -0.0036
(0.0023)
0.3003 **
(0.1374)
0.1411
(0.1498) - - -
Fabricated Metals -0.0106 *
(0.0057) - - - - -
Coke & Fuel -0.0025
(0.0158)
-0.2329
(0.7247) - -
0.5736
(0.6588)
0.3112
(0.2927)
Rubber & Plastic 0.0212 ***
(0.0058)
-0.0544
(0.8166)
-0.2461
(0.2472) -
-0.0892
(0.7846) -
Machinery 0.0016
(0.0035) - - - - -
Transport Equipment 0.0109 *
(0.0064)
0.2703
(0.2067) - - - -
Others; Recycling 0.0019
(0.0043)
1.4622 ***
(0.1409)
-0.8896 ***
(0.1570) -
-1.5698 ***
(0.2733)
0.8202 ***
(0.2549)
Chemicals -0.0067 *
(0.0037) - - -
-0.3843 **
(0.1701)
-0.1182
(0.2140)
Accounting &
Computing Machines
0.0029
(0.0132)
-0.6367 *
(0.3442) - -
0.8203 ***
(0.3116) -
Electrical Engineering-0.0065 *
(0.0037) - - -
-0.4693 ***
(0.1497) -
Communications
Equipment
-0.0028
(0.0158) - - -
0.9047 ***
(0.0824) -
Medical, Precision &
Optical instruments
-0.0035
(0.0031) - - -
0.1267
(0.1662)
-0.4917 ***
(0.1702)
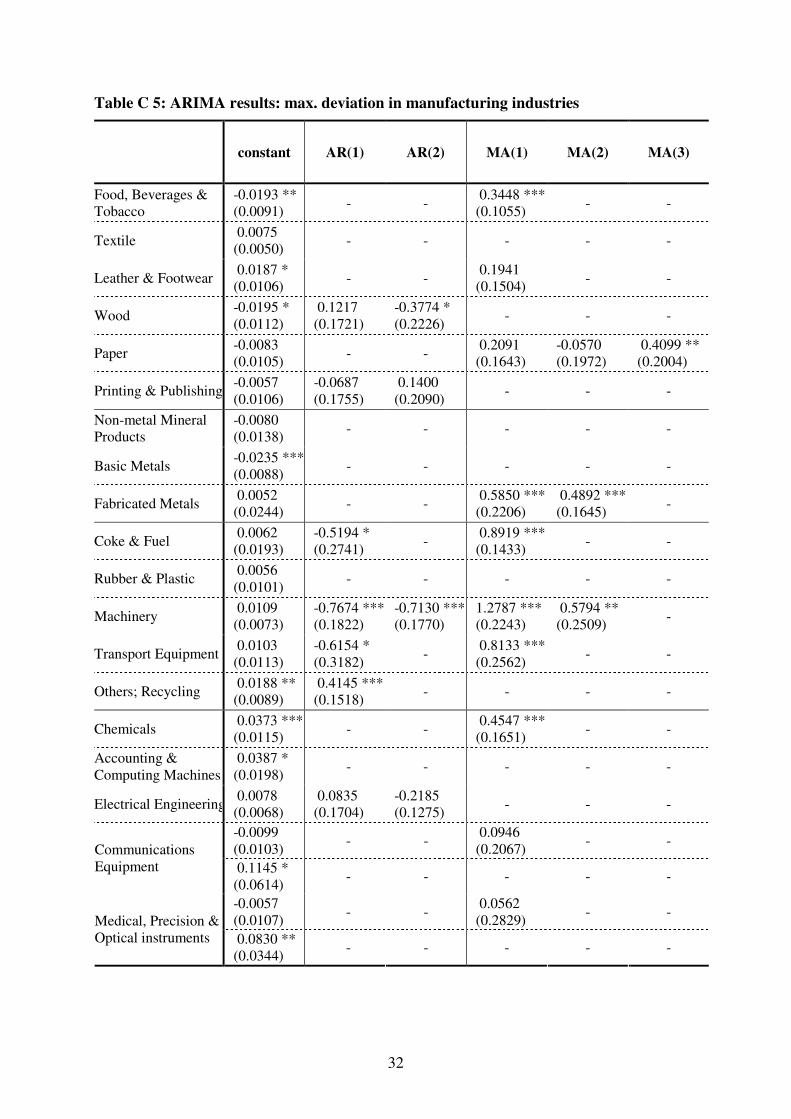
32
Table C 5: ARIMA results: max. deviation in manufacturing industries
constant AR(1) AR(2) MA(1) MA(2) MA(3)
Food, Beverages &
Tobacco
-0.0193 **
(0.0091) - -
0.3448 ***
(0.1055) - -
Textile 0.0075
(0.0050) - - - - -
Leather & Footwear 0.0187 *
(0.0106) - -
0.1941
(0.1504) - -
Wood -0.0195 *
(0.0112)
0.1217
(0.1721)
-0.3774 *
(0.2226) - - -
Paper -0.0083
(0.0105) - -
0.2091
(0.1643)
-0.0570
(0.1972)
0.4099 **
(0.2004)
Printing & Publishing -0.0057
(0.0106)
-0.0687
(0.1755)
0.1400
(0.2090) - - -
Non-metal Mineral
Products
-0.0080
(0.0138) - - - - -
Basic Metals -0.0235 ***
(0.0088) - - - - -
Fabricated Metals 0.0052
(0.0244) - -
0.5850 ***
(0.2206)
0.4892 ***
(0.1645) -
Coke & Fuel 0.0062
(0.0193)
-0.5194 *
(0.2741) -
0.8919 ***
(0.1433) - -
Rubber & Plastic 0.0056
(0.0101) - - - - -
Machinery 0.0109
(0.0073)
-0.7674 ***
(0.1822)
-0.7130 ***
(0.1770)
1.2787 ***
(0.2243)
0.5794 **
(0.2509) -
Transport Equipment 0.0103
(0.0113)
-0.6154 *
(0.3182) -
0.8133 ***
(0.2562) - -
Others; Recycling 0.0188 **
(0.0089)
0.4145 ***
(0.1518) - - - -
Chemicals 0.0373 ***
(0.0115) - -
0.4547 ***
(0.1651) - -
Accounting &
Computing Machines
0.0387 *
(0.0198) - - - - -
Electrical Engineering 0.0078
(0.0068)
0.0835
(0.1704)
-0.2185
(0.1275) - - -
-0.0099
(0.0103) - -
0.0946
(0.2067) - -
Communications
Equipment 0.1145 *
(0.0614) - - - - -
-0.0057
(0.0107) - -
0.0562
(0.2829) - -
Medical, Precision &
Optical instruments 0.0830 **
(0.0344) - - - - -

33
Table C 6: ARIMA results: SHEN in service industries
constant AR(1) AR(2) AR(3) MA(1)
-0.0168
(0.0138)
0.5568 *
(0.2983) - - - Domestic Services
(structural break in
1981/1982) 0.0096
(0.0068) - - - -
Hotels & Restaurants 0.0025
(0.0022)
-0.1322
(0.2436) - -
-0.4863 **
(0.2158)
Wholesale & Retail Trade 0.0042
(0.0074)
-0.6853
(0.4620)
0.0820
(0.2907)
0.1968
(0.2445)
0.7845 *
(0.4383)
Transport & Storage -0.0191 **
(0.0089)
0.0529
(0.1975)
0.2380
(0.2155) - -
Real Estate 0.0038
(0.0074) - - - -
-0.0236 ***
(0.0052) - - -
-0.4013 *
(0.2251) Post & Telecommunication
(structural break in
19888/1989) 0.0105 *
(0.0060)
-0.5492
(0.3920)
-0.4022
(0.4116) - -
-0.0058
(0.0163) - - - - Financial Intermediation
(structural break in
1993/1994) 0.0160 **
(0.0072) - - -
-0.1536
(0.3831)
Business Services 0.0086
(0.0087) - - -
0.4059 ***
(0.1538)
Health & Social Work 0.0073
(0.0058)
0.2431
(0.1822) - - -
Education -0.0023
(0.0097) - - - -
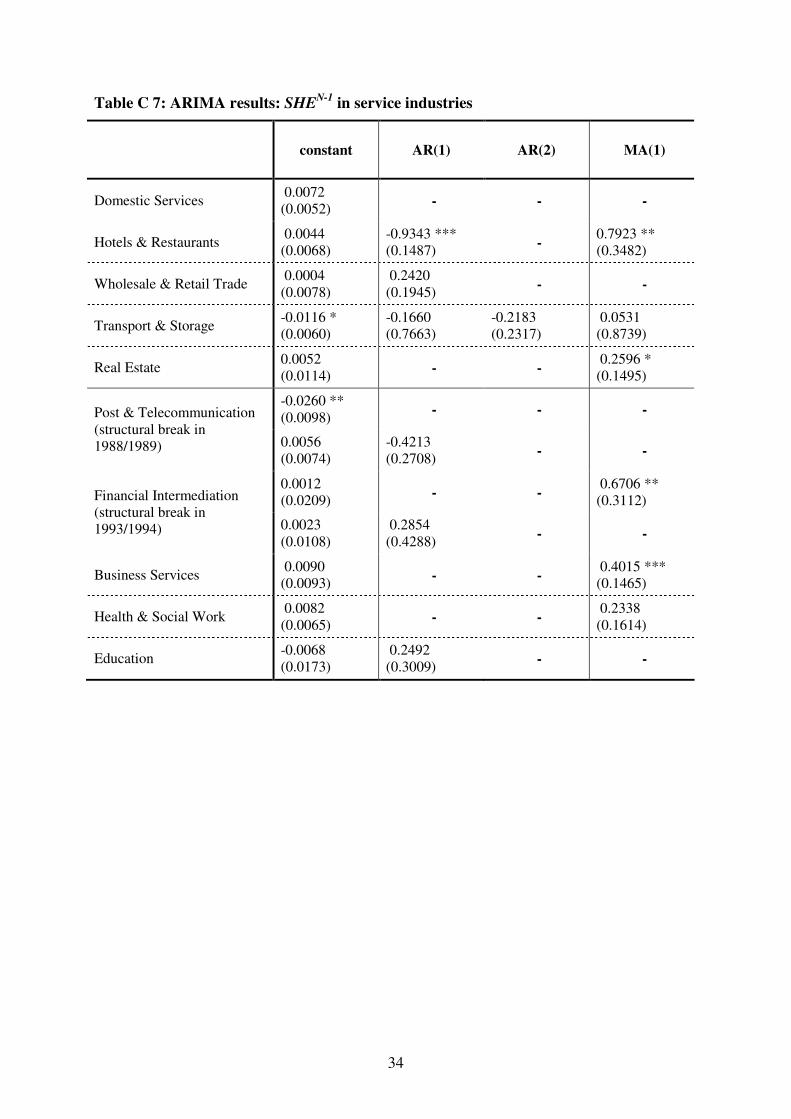
34
Table C 7: ARIMA results: SHEN-1
in service industries
constant AR(1) AR(2) MA(1)
Domestic Services 0.0072
(0.0052) - - -
Hotels & Restaurants 0.0044
(0.0068)
-0.9343 ***
(0.1487) -
0.7923 **
(0.3482)
Wholesale & Retail Trade 0.0004
(0.0078)
0.2420
(0.1945) - -
Transport & Storage -0.0116 *
(0.0060)
-0.1660
(0.7663)
-0.2183
(0.2317)
0.0531
(0.8739)
Real Estate 0.0052
(0.0114) - -
0.2596 *
(0.1495)
-0.0260 **
(0.0098) - - - Post & Telecommunication
(structural break in
1988/1989) 0.0056
(0.0074)
-0.4213
(0.2708) - -
0.0012
(0.0209) - -
0.6706 **
(0.3112) Financial Intermediation
(structural break in
1993/1994) 0.0023
(0.0108)
0.2854
(0.4288) - -
Business Services 0.0090
(0.0093) - -
0.4015 ***
(0.1465)
Health & Social Work 0.0082
(0.0065) - -
0.2338
(0.1614)
Education -0.0068
(0.0173)
0.2492
(0.3009) - -
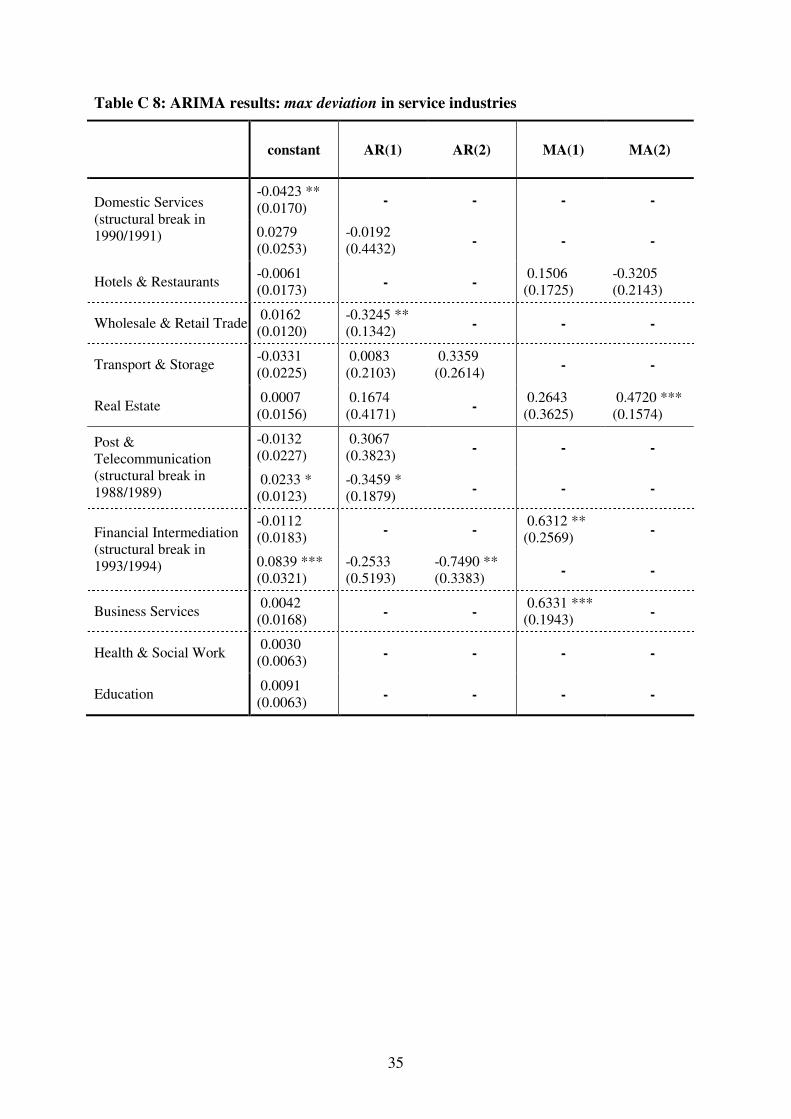
35
Table C 8: ARIMA results: max deviation in service industries
constant AR(1) AR(2) MA(1) MA(2)
-0.0423 **
(0.0170) - - - - Domestic Services
(structural break in
1990/1991) 0.0279
(0.0253)
-0.0192
(0.4432) - - -
Hotels & Restaurants -0.0061
(0.0173) - -
0.1506
(0.1725)
-0.3205
(0.2143)
Wholesale & Retail Trade 0.0162
(0.0120)
-0.3245 **
(0.1342) - - -
Transport & Storage -0.0331
(0.0225)
0.0083
(0.2103)
0.3359
(0.2614) - -
Real Estate 0.0007
(0.0156)
0.1674
(0.4171) -
0.2643
(0.3625)
0.4720 ***
(0.1574)
-0.0132
(0.0227)
0.3067
(0.3823) - - - Post &
Telecommunication
(structural break in
1988/1989) 0.0233 *
(0.0123)
-0.3459 *
(0.1879) - - -
-0.0112
(0.0183) - -
0.6312 **
(0.2569) - Financial Intermediation
(structural break in
1993/1994) 0.0839 ***
(0.0321)
-0.2533
(0.5193)
-0.7490 **
(0.3383) - -
Business Services 0.0042
(0.0168) - -
0.6331 ***
(0.1943) -
Health & Social Work 0.0030
(0.0063) - - - -
Education 0.0091
(0.0063) - - - -
Bisher erschienene Diskussionspapiere Nr. 75: Höhenberger, Nicole; Schmiedeberg, Claudia: Structural Convergence of European
Countries, Juli 2008 Nr. 74: Nowak-Lehmann D., Felicitas; Vollmer, Sebastian, Martinez-Zarzoso, Inmaculada: Does
Comparative Advantage Make Countries Competitive? A Comparison of China and Mexico, Juli 2008
Nr. 73: Fendel, Ralf, Lis, Eliza M., Rülke, Jan-Christoph: Does the Financial Market Believe in the Phillips Curve? – Evidence from the G7 countries, Mai 2008
Nr. 72: Hafner, Kurt A.: Agglomeration Economies and Clustering – Evidence from German Firms, Mai 2008
Nr. 71: Pegels, Anna: Die Rolle des Humankapitals bei der Technologieübertragung in Entwicklungsländer, April 2008
Nr. 70: Grimm, Michael, Klasen, Stephan: Geography vs. Institutions at the Village Level, Februar 2008
Nr. 69: Van der Berg, Servaas: How effective are poor schools? Poverty and educational outcomes in South Africa, Januar 2008
Nr. 68: Kühl, Michael: Cointegration in the Foreign Exchange Market and Market Efficiency since the Introduction of the Euro: Evidence based on bivariate Cointegration Analyses, Oktober 2007
Nr. 67: Hess, Sebastian, Cramon-Taubadel, Stephan von: Assessing General and Partial Equilibrium Simulations of Doha Round Outcomes using Meta-Analysis, August 2007
Nr. 66: Eckel, Carsten: International Trade and Retailing: Diversity versus Accessibility and the Creation of “Retail Deserts”, August 2007
Nr. 65: Stoschek, Barbara: The Political Economy of Enviromental Regulations and Industry Compensation, Juni 2007
Nr. 64: Martinez-Zarzoso, Inmaculada; Nowak-Lehmann D., Felicitas; Vollmer, Sebastian: The Log of Gravity Revisited, Juni 2007
Nr. 63: Gundel, Sebastian: Declining Export Prices due to Increased Competition from NIC – Evidence from Germany and the CEEC, April 2007
Nr. 62: Wilckens, Sebastian: Should WTO Dispute Settlement Be Subsidized?, April 2007 Nr. 61: Schöller, Deborah: Service Offshoring: A Challenge for Employment? Evidence from
Germany, April 2007 Nr. 60: Janeba, Eckhard: Exports, Unemployment and the Welfare State, März 2007 Nr. 59: Lambsdoff, Johann Graf; Nell, Mathias: Fighting Corruption with Asymmetric Penalties and
Leniency, Februar 2007 Nr. 58: Köller, Mareike: Unterschiedliche Direktinvestitionen in Irland – Eine theoriegestützte
Analyse, August 2006 Nr. 57: Entorf, Horst; Lauk, Martina: Peer Effects, Social Multipliers and Migrants at School: An
International Comparison, März 2007 (revidierte Fassung von Juli 2006) Nr. 56: Görlich, Dennis; Trebesch, Christoph: Mass Migration and Seasonality Evidence on
Moldova’s Labour Exodus, Mai 2006 Nr. 55: Brandmeier, Michael: Reasons for Real Appreciation in Central Europe, Mai 2006 Nr. 54: Martínez-Zarzoso, Inmaculada; Nowak-Lehmann D., Felicitas: Is Distance a Good Proxy
for Transport Costs? The Case of Competing Transport Modes, Mai 2006
Nr. 53: Ahrens, Joachim; Ohr, Renate; Zeddies, Götz: Enhanced Cooperation in an Enlarged EU, April 2006
Nr. 52: Stöwhase, Sven: Discrete Investment and Tax Competition when Firms shift Profits, April 2006
Nr. 51: Pelzer, Gesa: Darstellung der Beschäftigungseffekte von Exporten anhand einer Input-Output-Analyse, April 2006
Nr. 50: Elschner, Christina; Schwager, Robert: A Simulation Method to Measure the Tax Burden on Highly Skilled Manpower, März 2006
Nr. 49: Gaertner, Wulf; Xu, Yongsheng: A New Measure of the Standard of Living Based on Functionings, Oktober 2005
Nr. 48: Rincke, Johannes; Schwager, Robert: Skills, Social Mobility, and the Support for the Welfare State, September 2005
Nr. 47: Bose, Niloy; Neumann, Rebecca: Explaining the Trend and the Diversity in the Evolution of the Stock Market, Juli 2005
Nr. 46: Kleinert, Jörn; Toubal, Farid: Gravity for FDI, Juni 2005 Nr. 45: Eckel, Carsten: International Trade, Flexible Manufacturing and Outsourcing, Mai 2005 Nr. 44: Hafner, Kurt A.: International Patent Pattern and Technology Diffusion, Mai 2005 Nr. 43: Nowak-Lehmann D., Felicitas; Herzer, Dierk; Martínez-Zarzoso, Inmaculada; Vollmer,
Sebastian: Turkey and the Ankara Treaty of 1963: What can Trade Integration Do for Turkish Exports, Mai 2005
Nr. 42: Südekum, Jens: Does the Home Market Effect Arise in a Three-Country Model?, April 2005 Nr. 41: Carlberg, Michael: International Monetary Policy Coordination, April 2005 Nr. 40: Herzog, Bodo: Why do bigger countries have more problems with the Stability and Growth
Pact?, April 2005 Nr. 39: Marouani, Mohamed A.: The Impact of the Mulitfiber Agreement Phaseout on
Unemployment in Tunisia: a Prospective Dynamic Analysis, Januar 2005 Nr. 38: Bauer, Philipp; Riphahn, Regina T.: Heterogeneity in the Intergenerational Transmission of
Educational Attainment: Evidence from Switzerland on Natives and Second Generation Immigrants, Januar 2005
Nr. 37: Büttner, Thiess: The Incentive Effect of Fiscal Equalization Transfers on Tax Policy, Januar 2005
Nr. 36: Feuerstein, Switgard; Grimm, Oliver: On the Credibility of Currency Boards, Oktober 2004 Nr. 35: Michaelis, Jochen; Minich, Heike: Inflationsdifferenzen im Euroraum – eine
Bestandsaufnahme, Oktober 2004 Nr. 34: Neary, J. Peter: Cross-Border Mergers as Instruments of Comparative Advantage, Juli 2004 Nr. 33: Bjorvatn, Kjetil; Cappelen, Alexander W.: Globalisation, inequality and redistribution, Juli
2004 Nr. 32: Stremmel, Dennis: Geistige Eigentumsrechte im Welthandel: Stellt das TRIPs-Abkommen
ein Protektionsinstrument der Industrieländer dar?, Juli 2004 Nr. 31: Hafner, Kurt: Industrial Agglomeration and Economic Development, Juni 2004 Nr. 30: Martinez-Zarzoso, Inmaculada; Nowak-Lehmann D., Felicitas: MERCOSUR-European
Union Trade: How Important is EU Trade Liberalisation for MERCOSUR’s Exports?, Juni 2004
Nr. 29: Birk, Angela; Michaelis, Jochen: Employment- and Growth Effects of Tax Reforms, Juni 2004
Nr. 28: Broll, Udo; Hansen, Sabine: Labour Demand and Exchange Rate Volatility, Juni 2004
Nr. 27: Bofinger, Peter; Mayer, Eric: Monetary and Fiscal Policy Interaction in the Euro Area with different assumptions on the Phillips curve, Juni 2004
Nr. 26: Torlak, Elvisa: Foreign Direct Investment, Technology Transfer and Productivity Growth in Transition Countries, Juni 2004
Nr. 25: Lorz, Oliver; Willmann, Gerald: On the Endogenous Allocation of Decision Powers in Federal Structures, Juni 2004
Nr. 24: Felbermayr, Gabriel J.: Specialization on a Technologically Stagnant Sector Need Not Be Bad for Growth, Juni 2004
Nr. 23: Carlberg, Michael: Monetary and Fiscal Policy Interactions in the Euro Area, Juni 2004 Nr. 22: Stähler, Frank: Market Entry and Foreign Direct Investment, Januar 2004 Nr. 21: Bester, Helmut; Konrad, Kai A.: Easy Targets and the Timing of Conflict, Dezember 2003 Nr. 20: Eckel, Carsten: Does globalization lead to specialization, November 2003 Nr. 19: Ohr, Renate; Schmidt, André: Der Stabilitäts- und Wachstumspakt im Zielkonflikt zwischen
fiskalischer Flexibilität und Glaubwürdigkeit: Ein Reform-ansatz unter Berücksichtigung konstitutionen- und institutionenökonomischer Aspekte, August 2003
Nr. 18: Ruehmann, Peter: Der deutsche Arbeitsmarkt: Fehlentwicklungen, Ursachen und Reformansätze, August 2003
Nr. 17: Suedekum, Jens: Subsidizing Education in the Economic Periphery: Another Pitfall of Regional Policies?, Januar 2003
Nr. 16: Graf Lambsdorff, Johann; Schinke, Michael: Non-Benevolent Central Banks, Dezember 2002
Nr. 15: Ziltener, Patrick: Wirtschaftliche Effekte des EU-Binnenmarktprogramms, November 2002 Nr. 14: Haufler, Andreas; Wooton, Ian: Regional Tax Coordination and Foreign Direct Investment,
November 2001 Nr. 13: Schmidt, André: Non-Competition Factors in the European Competition Policy: The
Necessity of Institutional Reforms, August 2001 Nr. 12: Lewis, Mervyn K.: Risk Management in Public Private Partnerships, Juni 2001 Nr. 11: Haaland, Jan I.; Wooton, Ian: Multinational Firms: Easy Come, Easy Go?, Mai 2001 Nr. 10: Wilkens, Ingrid: Flexibilisierung der Arbeit in den Niederlanden: Die Entwicklung
atypischer Beschäftigung unter Berücksichtigung der Frauenerwerbstätigkeit, Januar 2001 Nr. 9: Graf Lambsdorff, Johann: How Corruption in Government Affects Public Welfare – A
Review of Theories, Januar 2001 Nr. 8: Angermüller, Niels-Olaf: Währungskrisenmodelle aus neuerer Sicht, Oktober 2000 Nr. 7: Nowak-Lehmann, Felicitas: Was there Endogenous Growth in Chile (1960-1998)? A Test of
the AK model, Oktober 2000 Nr. 6: Lunn, John; Steen, Todd P.: The Heterogeneity of Self-Employment: The Example of Asians
in the United States, Juli 2000 Nr. 5: Güßefeldt, Jörg; Streit, Clemens: Disparitäten regionalwirtschaftlicher Entwicklung in der
EU, Mai 2000 Nr. 4: Haufler, Andreas: Corporate Taxation, Profit Shifting, and the Efficiency of Public Input
Provision, 1999 Nr. 3: Rühmann, Peter: European Monetary Union and National Labour Markets,
September 1999 Nr. 2: Jarchow, Hans-Joachim: Eine offene Volkswirtschaft unter Berücksichtigung des
Aktienmarktes, 1999

Nr. 1: Padoa-Schioppa, Tommaso: Reflections on the Globalization and the Europeanization of the Economy, Juni 1999
Alle bisher erschienenen Diskussionspapiere zum Download finden Sie im Internet unter: http://www.uni-goettingen.de/de/60920.html.