
Structural change and economic development in China and ...
22
Structural change and economic development in China and India. (Preliminary draft, not to be quoted) Vittorio Valli (University of Turin) 1 1. Introduction China since 1978 and India since 1992 have passed through a phase of very rapid economic growth accompanied by very important structural changes in the productive systems and severe and largely unresolved social problems. The aim of this paper is to evaluate and compare some aspects of the different growth patterns of the two economies analyzing in particular the relations between structural change and economic development. In doing so, we will utilise two concepts: Gerschenkron’s “relative economic backwardness” 2 and “the fordist model of growth” 3 . The first concept is well known and stresses the fact that an emerging backwards economy may benefit of some advantages, such as the adoption of modern technologies coming from more advanced countries and the possibility of transferring large masses of labour force from low productivity sectors (agriculture and traditional tertiary activities) to sectors with a higher productivity (industry and modern services). The second concept, which is not to be confused with the more general, concept of “fordism” of Gramsci or of the French regulationist school, 4 is mainly associated to a phase of strong growth of some interlinked industrial and service sectors where scale economy and network economies are of crucial importance. 1 Professor of economic policy (vittorio.valli@ unito.it). The paper belongs to a Vittorio Alfieri research project on the Chinese and Indian economies financed by the CRT Foundation. I thank G. Balcet, M. Deaglio, S. Dalmazzone, C. Grua, L. Sau and D. Saccone for comments on the fist draft of this paper. 2 See Gerschenkron (1962) and Fua (1980) 3 See Valli (2002), (2005) 4 While my concept of “fordist model of growth” mainly regards the core of economic transformation, the concept of fordism of the French regulationist school (Boyer and other authors) is much wider and regards also the relations of the economic aspects with socio-political and institutional changes, the organization of labour and of production in the firms and the social conditions of workers. Their approach, which is is partly a derivation of Gramsci’s concept of fordism, is fascinating, but it is probably overly ambitious, since it implies the existence of a fully integrated social science.
Transcript of Structural change and economic development in China and ...

Structural change and economic development in China and India. (Preliminary draft, not to be quoted) Vittorio Valli (University of Turin)1
1. Introduction China since 1978 and India since 1992 have passed through a phase of very rapid economic growth accompanied by very important structural changes in the productive systems and severe and largely unresolved social problems. The aim of this paper is to evaluate and compare some aspects of the different growth patterns of the two economies analyzing in particular the relations between structural change and economic development. In doing so, we will utilise two concepts: Gerschenkron’s “relative economic backwardness”2 and “the fordist model of growth”3. The first concept is well known and stresses the fact that an emerging backwards economy may benefit of some advantages, such as the adoption of modern technologies coming from more advanced countries and the possibility of transferring large masses of labour force from low productivity sectors (agriculture and traditional tertiary activities) to sectors with a higher productivity (industry and modern services). The second concept, which is not to be confused with the more general, concept of “fordism” of Gramsci or of the French regulationist school,4 is mainly associated to a phase of strong growth of some interlinked industrial and service sectors where scale economy and network economies are of crucial importance.
1 Professor of economic policy (vittorio.valli@ unito.it). The paper belongs to a Vittorio Alfieri research project on the Chinese and Indian economies financed by the CRT Foundation. I thank G. Balcet, M. Deaglio, S. Dalmazzone, C. Grua, L. Sau and D. Saccone for comments on the fist draft of this paper. 2 See Gerschenkron (1962) and Fua (1980) 3 See Valli (2002), (2005) 4 While my concept of “fordist model of growth” mainly regards the core of economic transformation, the concept of fordism of the French regulationist school (Boyer and other authors) is much wider and regards also the relations of the economic aspects with socio-political and institutional changes, the organization of labour and of production in the firms and the social conditions of workers. Their approach, which is is partly a derivation of Gramsci’s concept of fordism, is fascinating, but it is probably overly ambitious, since it implies the existence of a fully integrated social science.

2. The third wave of the fordist model of growth The US has experienced the first wave of the fordist model of growth for some decades since 1908. West Europe, Japan and the four Asian tigers have passed through its second wave in the 1950s and the 1960s. Since the late Sixties the US, Western Europe and Japan have experienced the crisis of the fordist model and have entered the post- fordist phase. On the other hand China and India have entered the third wave of the fordist model of growth respectively in the 1980s and the 1990s, benefiting at the same time of some aspects of post-fordism and of several advantages of relative economic backwardness. In the US the crucial sectors of the fordist model of growth were the automobile industry with all its interlinked sectors (steel, oil, tyres, car assistance and repairs, construction of roads and motorways, etc.). When in 1908 the Ford motor corporation launched, as a mass production good, the new T model, which was much less expensive than the pre-existing cars, it greatly accelerated the demand and the diffusion of the automobiles in the US market, and stimulated a rapid expansion of the steel industry, the tyre industry, the oil industry, road building, etc. In the 1980s in China, in a very different economic and socio-political context, the crucial sectors of the fordist model of growth were instead the electrical domestic appliances and their interlinked sectors (steel, plastics, electricity, etc.). In the 90s, there was in China the addition of microelectronics, telecommunication, energy. Finally, since the 2000s, there was also a rapid growth of the production of industrial vehicles, motorcycles and automobiles. In India, since 1992, machinery, household electric appliances, steel, pharmaceuticals, and, more recently, software services, telecommunication, motorcycles and automobiles and air communication have been the crucial sectors.
3. Structural transformation Most empirical analyses about structural transformation have two severe shortcomings. They often consider only the changes between the three great productive branches: agriculture, industry, services, while great importance have also the changes among the different sectors of industry and services. It is usually overlooked or underestimated also the chance given to young school leavers not to remain unemployed or underemployed in agriculture, but to find a job in industry or in the services, which in general pay higher wages than agriculture, or to find a job in in modern industrial or service sectors which in general pays higher wages than the traditional ones.

Moreover, most empirical studies do not adequately consider the five main “virtuous circles” contained in the “ fordist model of growth”. The first virtuous circle, can have a huge importance and consists in the fact that the rapid growth of production may generate economies of scale or network economies, higher productivity, higher profits, higher investment, further increase in productivity and production (see Chart 1). This feedback is associated to the rapid growth of industrial sectors where economies of scale are important, such as TV sets, refrigerators, washing machines, automobiles, steel, chemicals, PCs, mobile phones, etc. This effect is particularly strong in the period in which the internal demand for these goods rises very fast because several families buy their first TV set, or refrigerator, or their first PC, or mobile phone, etc. The effect becomes much weaker when economies of scale are fully exploited or when the sectors become mature, with almost only substitution demand, trend which finally brings to the post-fordist phase. The second important “virtuous circle” operates through aggregate demand. The rapid increase in productivity makes possible a rapid increase in unit wages, without reducing profits margins. This trend, if accompanied by a rise in employment, determines a fast increase of total wages and thus of consumption, which can favour, together with the increase in total profits, a substantial increase in investment. The rise in consumption and investment leads to a rapid increase in internal demand. After some years the improvement in productivity leads also to an increase in external competitiveness and exports and in the attractiveness of foreign direct investment, so that the internal demand-led growth gradually can become an export-led growth, as it has already happened in China, but not yet fully in India. The third “virtuous circle” operates through total profits and investment: The rapid increase in labour productivity permits a great rise in total sales and then in total profits, provided that profit margins remain relatively stable. This determines a rapid rise in both intensive and extensive investment. The former improves labour productivity, while the latter leads to an increase of employment and thus to a rise in total wages, consumption and aggregate demand. The fourth “virtuous circle” regards relative prices and the demand of selected goods and services. The very rapid increase of productivity in scale -economy industrial sectors or network -economy service sectors can contribute to reduce the prices of their goods or services relatively to the average level of prices. The fall in relative prices of these goods or services may boost their demand, already fuelled by the fast increase of the income of a part of the population. The rapid increase of demand spurs a rapid rise in profits and investment in these goods and services,
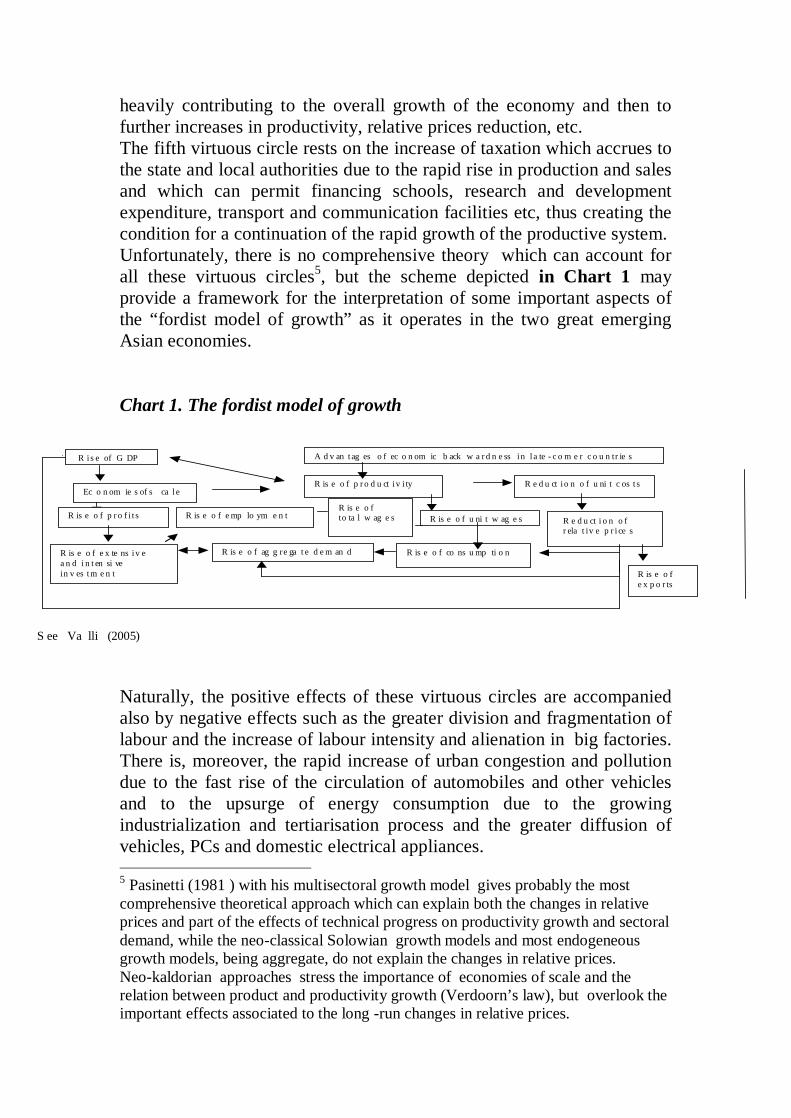
heavily contributing to the overall growth of the economy and then to further increases in productivity, relative prices reduction, etc. The fifth virtuous circle rests on the increase of taxation which accrues to the state and local authorities due to the rapid rise in production and sales and which can permit financing schools, research and development expenditure, transport and communication facilities etc, thus creating the condition for a continuation of the rapid growth of the productive system. Unfortunately, there is no comprehensive theory which can account for all these virtuous circles5, but the scheme depicted in Chart 1 may provide a framework for the interpretation of some important aspects of the “fordist model of growth” as it operates in the two great emerging Asian economies. Chart 1. The fordist model of growth
Naturally, the positive effects of these virtuous circles are accompanied also by negative effects such as the greater division and fragmentation of labour and the increase of labour intensity and alienation in big factories. There is, moreover, the rapid increase of urban congestion and pollution due to the fast rise of the circulation of automobiles and other vehicles and to the upsurge of energy consumption due to the growing industrialization and tertiarisation process and the greater diffusion of vehicles, PCs and domestic electrical appliances. 5 Pasinetti (1981 ) with his multisectoral growth model gives probably the most comprehensive theoretical approach which can explain both the changes in relative prices and part of the effects of technical progress on productivity growth and sectoral demand, while the neo-classical Solowian growth models and most endogeneous growth models, being aggregate, do not explain the changes in relative prices. Neo-kaldorian approaches stress the importance of economies of scale and the relation between product and productivity growth (Verdoorn’s law), but overlook the important effects associated to the long -run changes in relative prices.
S ee Va lli (2005)
R is e o fe x p o r ts
Ec o n om ie s of s ca l eR e d u ct i o n o f u ni t c os t sR is e o f p r o d u ct i v i ty
R is e o f p r o f i t s R is e o f e mp lo ym e n tR is e o fto ta l w ag e s R is e o f u ni t w ag e s R e d u ct i o n o f
r ela t iv e p r i ce s
R is e o f co ns u mp ti o nR is e o f ag g re ga t e d e m an dR is e o f e x te ns i v ea n d i n t en si vein v es t m e n t
R i s e of G DP A d v an t ag es o f ec o n om ic b ack w a r d n e ss i n l a te - c o m e r c o u n tr ie s

4. Structural change and growth in China since 1978 After the 1978 economic reforms China has experienced a very rapid economic growth. In terms of GGDC estimates of total GDP in purchasing power parities China had a partial, but impressive, catching up towards the US (see Chart 2), rising from the 22.9 % of the US GDP in 1978 to 98.1 % in 2007 6. While the first wave of reforms regarded mainly agriculture, the second wave of reforms in the 1980s and 1990s involved mainly industry, the services, property rights and institutions, while the third wave of reforms in the late 1990s and 2000s regarded mainly banking, finance and international economic relations. In 1978 China was a predominantly agrarian economy, with 70.5 % of employed labour force and 27,9.% of internal GDP formed in agriculture, forestry and fishing, In 2005 the situation had completely changed as China experienced a rapid and widespread industrialisation and tertiarisation process. The primary sector percentages on employment and value added went down to 44.8 and 12.6 while the secondary sector (industry and construction) increased to 23.8 and 47.5 and the tertiary sector went up to 31.4 and 39.9 (see Table 1), Table 1. Employment and value added by sector in China (% of total) Employment 1978 1989 1997 2005 Primary (agriculture, forestry, fishing) 70.5 60.1 49.9 44.8 Secondary (industry and construction) 17.3 21.6 23.7 23.8 Tertiary (Services) 12.2 18.3 26.4 31.4 Total employment 100.0 100.0 100.0 100.0 Value added Primary 27.9 24.9 18.1 12.6 Secondary 47.9 42.9 47.5 47.5 Tertiary 24,2 32.2 34.4 39.9 Total value added 100.0 100.0 100.0 100.0 Source: National Bureau of Statistics of China (2007), p. 34 6 See GGDC (2008). The recently revised estimates of the World Bank for China and India are significantly lower, but the methodological bases of such large revisions vis- a vis the old World Bank estimates are controversial.

Chart 2. GDP in the US, China and India (Billions $ 1990 in PPPs, Source GGDC, 2008)
0
1.000.000
2.000.000
3.000.000
4.000.000
5.000.000
6.000.000
7.000.000
8.000.000
9.000.000
10.000.000
1978
1980
1982
1984
1986
1988
1990
1992
1994
1996
1998
2000
2002
2004
2006
United States China India
It must be stressed that in 1978 the labour productivity of industry (including construction) and of services were respectively about 5.1 and 4.9 times the labour productivity of agriculture 7 , while in 2004 the gap in productivity with industry rose to a ratio of 7.2, and for services it slightly diminished to 4.58. Therefore the transfer of many employees from agriculture to industry and services, has contributed to the rapid economic growth,9. Even more important was the possibility of young school leavers to enter industry or services, rather than remaining unemployed or underemployed in agriculture, thus gaining much higher
7 See Maddison (2006), p. 90 8 See National Bureau of Statistics of China (2007), pp. 61,125 9 According to Maddison (2007, p. 70) in the 1978-2003 period the impact of redistribution of employed labour force among the three great branches could be estimated to 2.01 % points of average annual rate of growth of real GDP, equal to 25.6 % of the overall rate of growth (+ 7.85 %). See also IMF (2006), Herd and Dougherty ( 2007) and Bosswoth, Collins (2008) , for other estimates.

incomes or wages. The Chinese government tried to hinder the possibility of moving from rural villages to urban centres by means of legal and administrative restrictions. However many workers left illegally the rural areas creating an enormous reserve of precarious jobs in the cities, although the government tried to improve the conditions of life in rural areas encouraging the expansion of industrial and services activities through locally controlled public firms (TVE s), private firms and joint ventures with foreign multinationals, all strongly contributing to industrialisation and to rapid economic growth. The original source of capital formation for the rapid growth of TVEs was mainly due to the fast rise of productivity and surplus in agriculture, after the post 1978 reforms, followed then by large investment in industry and services, spurred by the fact the government’s policy maintained prices very favourable to industrial and tertiary production compared with agriculture goods. The richer agricultural zones had thus relevant profits, which partly served to finance the use of fertilizers and machines in agriculture, and thus to increase agricultural productivity, and partly were devoted to the creation or expansion of TVEs, private firms and joint ventures with foreign firms both in industry and in the services. Moreover the rise of agricultural and industrial activities led to a further growth of the demand for modern and traditional services, for
Chart 3. Employment by sector in China (Millions, source: NBS, 2007, pp. 27,34)
0100200300400500600700800
1978 1989 1997 2005
Primary Secondary Tertiary Total

residential and non-residential construction and for infrastructures (roads, bridges, electricity, railways, telecommunication, ports, airports, etc.). On the opposite, the poorest agricultural zones experienced a very low growth in industry, services and public infrastructure, so that regional inequalities tended to rapidly widen. The expansion of TVEs, private firms and joint ventures with foreign multinationals made up for the decline of several state firms and led to a rapid increase in employment in industry and services, which contributed to almost 80% of the increase of total employment .in the 1978-1995 period and to a substantial share of the increase in the 1995- 2006 period. But in addition to the great transformation between the three main branches: agriculture, industry and services, in the last three decades there were also a dramatic structural transformation within industry and within the tertiary activities. Table 2 gives an idea of the very rapid growth of the volume of output in some modern industrial and service sectors and of the consistent, bur on average lower rate of growth of traditional sectors: In 1980 the main industrial sectors were the traditional ones: textiles, clothes, food and beverage, bicycles, etc. with a limited presence of some scale intensive sectors such as steel, chemicals and fertilizers. Electricity and telecommunication services were poor and scanty and residential constructions were curtailed, with very small and crowded apartments in the cities. In 1995 and much more in 2005 the situation had radically changed. 10 While in 1978 textiles had been in China by far the most important sector in terms of the percentage of total value added, since the mid-90s the electrical and non-electrical machines and chemicals surpassed textiles. Also the growth in production quantities of the goods produced by modern industrial products such as Pcs and mobile phones was much faster than for textiles and most other traditional sectors. Residential and non –residential constructions were booming, especially in big urban centres. Richer provinces built a relatively good network of public and private infrastructures, but pollution, congestion and energy dependence from abroad were also rapidly rising. Since 1992 China became a net importer of oil and other energy sources, and its imports grew rapidly over time, partly contributing to the recent strong rise of world oil prices. Moreover, China continues to heavily rely on its abundant coal reserves, thus increasing pollution. Table 2: Growth of the output of some industrial and service sectors in China (1978-2005) (quantities, 1978 =100)
10 See Maddison ( 2006), p.179, Wu (1997)

Sectors 1978 1989 2005 Index Index Index Refined sugar, 10 000 tons 227 100 501 221 912 402 Cloth ,100 million m. 110 100 189 172 484 440 Electricity, 100 million Kwh 2566 100 5848 228 25003 974 Crude steel, 10 000 tons 3178 100 6159 194 35324 1112 Washing machines, thousands 0.4 100 8,250 2063 303.6 75888 Refrigerators, thousands 28 100 6710 23964 29870 106679 Color TV sets, millions 0.038 100 9.400 24737 82.83 217973 Telephones, millions* 2.14 100 6.84 319.6 312.6 146093 Motor vehicles, millions* 0.22 100 0.50 227.3 5.1 2318 of which automobiles* 0.10 100 0.30 300.0 2.3 2300 Pcs, millions ** 45.1 Mobile phones, millions** 233.0 Fax, millions** 13.8
* 1980, 1990, 2004, ** 2004 Sources: China National Bureau of Statistics, Statistical Yearbook (various years) The rapid growth of household electrical appliances, telecommunication, and then PC, steel, means of transportation and finance led to the rise and consolidation of a middle and upper middle class, concentrated mainly in the great urban costal zones. Thus social and economic inequalities increased strongly. In particular there was a marked increase in overall inequality indexes, such as the Gini index, which surpassed the levels of the US and of most industrialized countries, and a marked rise the regional inequalities among provinces11.
5. Structural change and growth in India (1992-2007) India had a marked acceleration of economic growth after the debt crisis of 1991 and the ensuing economic reforms of Prime minister Narasimha Rao of the Indian Congress Party. 12 According to several authors the bases of the period of rapid growth were introduced in the mid 80s, but it is true that after 1992 there was a sharp rise of the rate of economic 11 See, for example, Galbraith, Kritynskaia, Wang (2004), Saccone (2008) 12 According to F. R. Frankel (2005), p. 591, “ the government drastically cut back the number of industry reserved for the public sector, removed compulsory licensing on the private sector for starting and expanding new enterprises in virtually all industries; devalued the rupee; introduced current account convertibility to pay balances on the current export and import (trade ) account ; removed quantitative quotas on import; steadily reduced tariff levels on import; lifted restrictions on majority foreign investment in a wide range of industries; allowed foreign companies to borrow funds in India, raise public deposits and expand their operations by creating new businesses, and permitted foreign financial institutions to make direct portfolio investment in India’s two stock markets”

growth In the 1992- 2007 period the rate of growth of real per capite GDP in PPA markedly increased, surpassing 5%. The phase of rapid growth in the Indian economy led, with less intensity and a delay of 14-15 years if compared with China, to a gradual decrease of the agricultural share in employment and value-added, and an increase in the share of industry and services. (see Table 3) Table 3. Employment and value added by sector in India (% of total) Employment 1978 1993 2004 Agriculture, forestry and fishing 71 64 57 Industry 13 15 18 Services 16 21 25 Total 100 100 100 Agriculture, forestry and fishing 44 33 22 Industry and construction 24 28 28 Services 32 39 50 Total 100 100 100 See Bossworh, Collins (2008), p. 49. Sources: India national accounts, Indian National Sample Survey Organization The 1992-2007 period of rapid growth was accompanied by some features of the “fordist model of growth”. But, while in China this model of growth was essentially based upon a large and increasing number of industrial sectors, in India it was delayed of 12-14 years and less based on industry, but more on services, such as banking, transport and telecommunication and especially on the production and export of a variety of software services. However, if we consider that India reached the 1995 GDP per capita level in PPA of China about 11-12 years later and began its period of rapid growth about 14 years later than China, it is not true that while China tends to become the “factory of the world”, India is becoming the “office of the world”. In India several industrial sectors such as machinery, chemicals, steel, pharmaceutics, three-wheel vehicles, motorcycles and more recently, microelectronics hardware and automobiles, had a relevant and accelerated growth, although often inferior and delayed of some years with respect to the one registered in China. As we can see in Table 3, although in the period 1993-94/2006-7 a traditional sector (beverages, tobacco and related products) had the highest growth in manufacturing industries, modern economies- of scale- sectors such as transport equipment and parts, machinery, non-metallic mineral products, chemicals, had a strong and above the average dynamics. Although in India a large mass of population remains very poor, and therefore unable to buy almost any durable consumption goods, the rapid

growth of the last 15 years made it possible for an increasing proportion of medium and high income people, mainly concentrated in urban areas, to have access to durable consumer goods, such as TV sets and other electric household appliances, scooters or three- wheels vehicles, and in Table 4. Index number for manufacturing industry in India ( base 1993-4 = 100, weights. industry = 100) R. Industry group Weight 1999-00 2004-05 2005-06 2006-07 P
1 Beverages, tobacco and related products
2,38 192,1 345,9 400,3 444,5
2 Transport equipment and parts 3,98 194,1 283,7 319,7 367,7 3 Machinery and equipment other
than transport equipment 9,57 182,5 279,4 312,8 357,1
4 Non-metallic mineral products 4,4 220,8 244,3 271,1 305,8 5 Other manufacturing industries 2,56 142,5 221,2 276,9 298,4 6 Textile products (including
wearing apparel) 2,54 156,1 219,6 255,5 285,0
7 Basic chemicals and chemical products (except products of petroleum & coal)
14.0 164,6 238,6 258,5 283,4
8 Basic metal and alloy industries 7,45 146,9 196,1 227 278,9 9 Wool, silk and man- made fibre
textiles 2,26 197,8 249 248,9 268,4
10 Paper and paper products and printing, publishing and allied industries
2,65 180,5 230,7 228,6 248,6
11 Rubber, plastic petroleum and coal products
5,73 137,2 192,2 200,5 226,3
12 Food products 9,08 140,3 167,3 170,6 185,2 13 Metal products and parts (except
machinery and equipment) 2,81 137,8 166,3 164,4 183,2
14 Cotton textiles 5,52 123,7 126,3 137 157,3 15 Leather and leather& fur products 1,14 135,5 156,9 149,3 150,2 16 Wood and wood products;
furniture& fixtures 2,7 101,4 74,8 70,5 91
17 Jute and other vegetable fibre textiles (except cotton)
0,59 105 107,2 107,7 90,7
Manufacturing (Total) 79,36 159,4 214,6 234,2 263,5 P : Provisional. Source : Central Statistical Organisation, Government of India. the most affluent families, a Pc and an automobile. From 1988-89 to 1998-9 the “higher income groups” (middle and upper middle class households, with an annual income of at least 75001 Rs. in 1998-9 prices)

almost doubled in percentage of total households passing from 14% to 26%.13 However in 1998-99, they rose up to 47% of urban households, but only to 17% of rural households. Of these “higher income groups” about 150 million people lived in households with some purchasing power for durable consumer goods. In any case, even though applied to a limited, although gradually rising, minority of the population, India had become the fifth or sixth world market for a substantial number of durable consumer goods and of services. These goods or services are partly imported, but in large part they are produced inland with relative prices steadily declining thanks to economies of scale or network economies. However, although less than in China, pollution and congestion phenomena, as well as economic inequalities and the cost of decent housing have risen also in India and threaten to create growing social and economic tensions.
6. China and India: a comparison
If now we come to a closer comparison of the relations between structural transformation and economic growth in China and India, we can observe (Chart 4) that, while in 1978 the share of agriculture in total employment in the two countries was practically the same (around 71%), China had a very sharp decline of the shares in the 1978-1993 period and a rapid
Chart 4: The % share of employment and value added on total in agriculture in China and India 14
decrease in the 1993-2004 period, versus a slower and gradual decline in India, which only after 2004 reached the 1993 share of China. However, as regards value added, in 1978 the share of agriculture was already
13 See Frankel (2005), p. 596. The source of data is NCAER, Indian Market Demographics Report (2002) 14 The data of the charts are based on official statistics of the two countries.
01020304050607080
Empl.1978
Empl.1993
Empl.2004
VA1978
VA1993
VA2004
ChinaIndia
consistently lower in China than in India and it remained much lower also in 2004. While the reduction of the agriculture shares was in China due to the rise of both the industrial and services shares, the reduction of the Indian shares of agriculture was more associated to the increase of services than to the increase of industry. However, we must stress the fact that the increase of several of the more dynamic sectors of services is largely due to the rise of the demand from internal industry, though for the Indian software services also foreign demand played an important role.
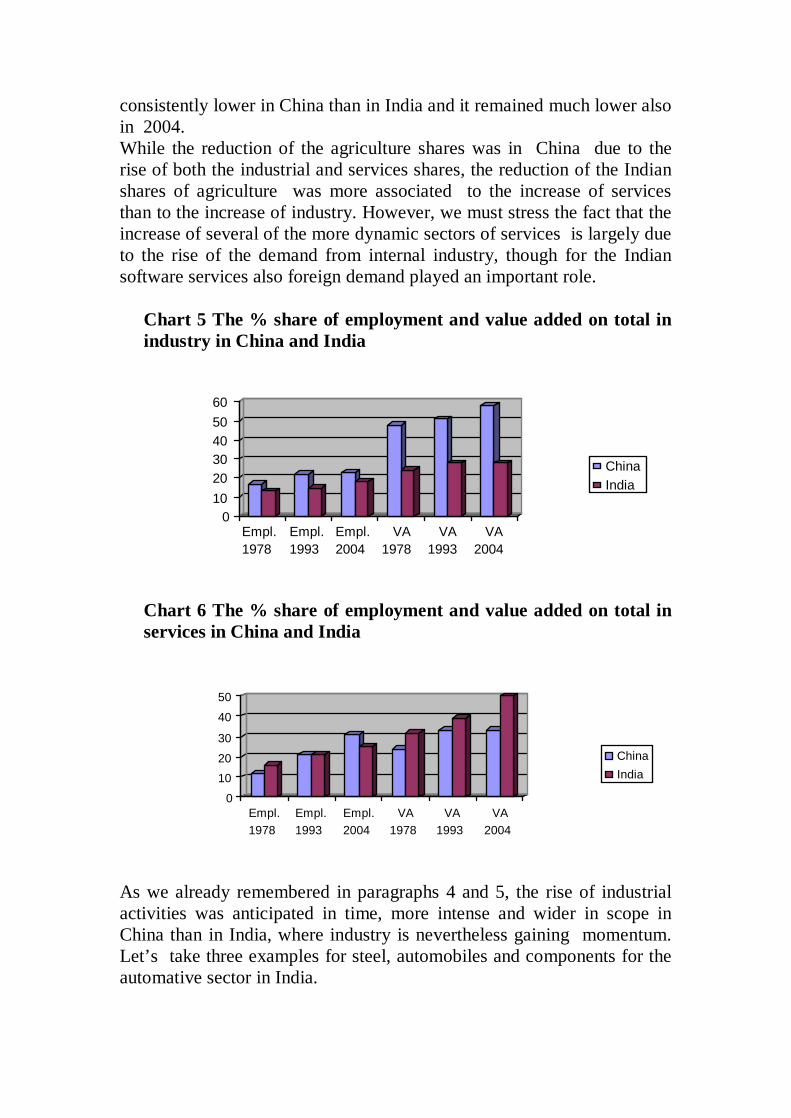
Chart 5 The % share of employment and value added on total in industry in China and India
Chart 6 The % share of employment and value added on total in services in China and India
As we already remembered in paragraphs 4 and 5, the rise of industrial activities was anticipated in time, more intense and wider in scope in China than in India, where industry is nevertheless gaining momentum. Let’s take three examples for steel, automobiles and components for the automative sector in India.
0102030405060
Empl.1978
Empl.1993
Empl.2004
VA1978
VA1993
VA2004
ChinaIndia
0
1020
30
40
50
Empl.1978
Empl.1993
Empl.2004
VA1978
VA1993
VA2004
ChinaIndia

The giant Indian steel corporation Mittal has rapidly grown and has recently acquired the control of two of the leading European steel corporations. Moreover, the larger automative sector in India has risen from 3.5 millions vehicles in 1995-6 (of which 2.2 millions scooters and motorcycles, about 350.000 cars and 129.000 buses and trucks) to 9.7 millions vehicles in 2005-6 (of which 7.2 millions scooters and motorcycles, about1.1 millions cars and 219. 000 buses and trucks)15. After 1999 the production of passenger cars of China has surpassed the Indian production. However, although the major Indian car maker remains Maruti, which is controlled by a Japanese corporation (Suzuki), from the technological point of view there is probably no Chinese national car producer (distinguished from joint venrtures with Japanese or Western firms) as strong as the Indian Tata, whose Nano project for small cars, the acquisition of Jaguar for luxury cars and the joint venture with Fiat in Latin America for pick ups, will probably lead to a very fast growth of output both inland and abroad16. Finally, the Indian corporation Bharat Forge, which prepare components for cars ad trucks, has rapidly grown in recent years and has invested massively abroad acquiring also the control of a leading German firm.17. There are, however very important differences in the pattern of growth of the two countries, some of which closely associated to the different timing and amplitude of structural changes. Not only China has a much larger industrial sector than India, even discounting the fact that its rapid industrialization process began 12-15 years earlier than in India, but also its industrial activities are much less fragmented. India has a extraordinarily large number of micro-enterprises and a very vast “informal economy”, much wider than the one in China. Moreover, India has often a very large chain of furnishers, and sub-furnishers for production and of wholesale and retail traders. These long production and distributive chains may sustain employment and reduce labour costs, but decrease productivity and tend to greatly increase the spread between prices earned by producers and consumer prices. In India in micro-electronics the software sector is more advanced than in China, although a relevant part of the work is made as sub-contractor of foreign companies, while the production of hardware is in India much weaker than in China. Some of the differences in the productive structure are associated to differences in education in the two countries. India has a more bi-polar
15 See Richet, Ruet (2008) 16 See Balcet, Bruschieri (2008) 17 idem (2008)

system. It has, in fact, a large mass of people illiterate or with a weak command of the more diffused national languages and no knowledge of foreign languages as English, and at the same time, a consistent and rapidly growing number of engineers, microelectronics experts and other University graduates with a good knowledge of English, while China has a less differentiated education system, with a more educated work-force, but increasing inequalities in the access to higher education and high quality schools18. Owing to its earlier economic period of rapid growth and to its more centralized decision –making process, China has created, in its more economically dynamic zones, better transport and communication infrastructures than India. Greater transport and trading costs and inferior scale economies in some sectors have contributed to reduce the international competitiveness of India if compared with China: Moreover, in China a part of agricultural goods is sold by the State at political prices, lower than the world market prices, thereby containing the cost of life, and some inputs, such as steel, are sold by subsidized State firms, thereby lowering the costs of inputs of Chinese mechanical firms and enhancing their international competitiveness. While the Indian banking and financial markets appears to be more advanced and sophisticated than the Chinese markets, the latter has grown much more rapidly and has greatly benefited from the return under the control of China of the great and sophisticated financial market of Hong Kong. Finally, since 1978, pollution and income and wealth inequalities among families and among regions have increased both in China and in India, but much more markedly in China. Although absolute poverty has diminished in both the countries, it remains very large in India and consistent in various zones of China. Bibliography:
18 See, for the Chinese case, Saccone (2008)

Amighini A. (2005), China in the International Fragmentation of Production: Evidence from the ICT Industry, in “European Journal of Comparative Economics”, n. 2 Balcet G. Bruschieri S: (2008), Technology tranfer, joint ventures and the emergence of Indian multinationals. The case of the automative industry, Turin (forthcoming) Basu K. (2007) (ed.) The Oxford Companion to economics in India, Oxford University Press, Oxford Bossworth B., Collins S.M. (2008), Accounting for Growth: Comparing China and India, in “The Journal of Economic Perspectives”, vol. 22, n.1, pp. 45-65 Chiarlone S., Amighini A. (2007), L’economia della Cina, Carocci, Roma Frankel F.R. (2005), Indian’s Political economy: 1947-2004, Oxford University Press Fua G. (1980 ), Problemi dello sviluppo tardivo in Europa, il Mulino, Bologna Galbraith J.K., Krytynskaia L., Q.Wang, The Experience of Rising Inequality in Russia and China during the Transition, in “European Journal of Comparative Economics”, 2004, n.1 Gerschenkron A. (1962), Economic Backwardness in Historical Perspective, Harvard University Press, Cambridge, Mass. GGDC (2008), Groningen Growth and Development Center, Total Data Base, in http://www. eco.rug.nl/ggdc Herd S., Dougherty R.(2007), Growth Prospects in China and India Compared, in “European Journal of Comparative Economics”, June, 2007 IMF (2006), Asia rising: paterns of economic development and growth, in “World economic Oulook”, chapter 3. Maddison A. (2007), Chinese economic performance in the long- run, OECD , 2 nd edition, Paris. Maddison A (2007), Contours of the World Economy. I-2030, Oxford University Press, Oxford. Malle S. ( 2006), Profili macro-economici della Cina, in “Il Politico” , Sett:-Dic- , pp. 194-216 National Bureau of Statistics of China (2006), http://www. Stats.gov. cn/english/ National Bureau of Statistics of China (2007), China Statistics Yearbook OECD (2005), OECD economic Surveys: China, Paris OECD, ( 2007) OECD economic Surveys: India, Paris Pasinetti L. (1981), Structural Change and Economic Growth, Cambridge University Press, Cambridge. Richet X, Ruet J, (2008), The Chinese and Indian Automobile Industry in

Perspective: Technology Appropriation, Catching-up and Development( (forthcoming) Saccone D.(2008), Apertura eonomica, istruzione e diseguaglianze nei paesi in via di sviluppo, PH.D. thesis, Torino UNDP (2007), Human Development Report, Oxford University Press, Oxford Valli V. (2002), L’Europa e l’economia mondiale (Europe and the world economy), Carocci, Roma Valli V. (2005), Politica economica. Introduzione all’economia dello sviluppo, Carocci, Roma World Bank (2007), World Development Indicators, Washington D.C. Wu H.X.(1997), Reconstructing Chinese GDP according to the National Accounts Concepts of Value Added . the Industrial Sector, COPPAA paper, n. 4, Griffith University, Brisbane

A1: GDP in PPPs US $ 1990 Geary Khamis ( Source: GGDC, 2008) Years United States China India 1978 4.089.548 935.083 625.695 1979 4.228.647 1.007.193 594.510 1980 4.230.558 1.041.142 637.202 1981 4.336.141 1.103.378 675.882 1982 4.254.870 1.186.387 697.705 1983 4.433.129 1.287.034 753.942 1984 4.755.958 1.447.262 783.042 1985 4.940.383 1.596.691 814.344 1986 5.110.480 1.703.670 848.990 1987 5.290.129 1.883.027 886.154 1988 5.512.845 2.016.024 978.822 1989 5.703.521 2.051.813 1.043.912 1990 5.803.200 2.123.852 1.098.100 1991 5.791.931 2.263.794 1.109.780 1992 5.985.152 2.483.921 1.170.599 1993 6.146.210 2.724.344 1.226.409 1994 6.395.858 2.997.060 1.308.016 1995 6.558.151 3.450.084 1.407.023 1996 6.803.769 3.521.141 1.513.355 1997 7.109.775 3.706.647 1.574.713 1998 7.406.631 3.717.352 1.672.244 1999 7.736.163 3.961.441 1.795.778 2000 8.019.378 4.319.339 1.868.299 2001 8.079.583 4.780.797 1.965.601 2002 8.208.732 5.374.025 2.038.852 2003 8.414.751 6.187.983 2.209.952 2004 8.720.920 6.812.969 2.393.931 2005 8.988.533 7.521.518 2.614.943 2006 9.246.669 8.326.321 2.859.541 2007 9.459.342 9.283.847 3.102.603 Source: GGDC 2008 1

PIL pro capite in $ 1990 Geary Khamis Years United States China India 1978 18.373 853 889 1979 18.789 894 937 1980 18.577 978 966 1981 18.856 1.039 895 1982 18.325 1.061 938 1983 18.920 1.110 977 1984 20.123 1.186 985 1985 20.717 1.258 1.043 1986 21.236 1.396 1.060 1987 21.788 1.519 1.079 1988 22.499 1.597 1.101 1989 23.059 1.737 1.125 1990 23.201 1.830 1.216 1991 22.849 1.834 1.270 1992 23.298 1.871 1.309 1993 23.616 1.967 1.296 1994 24.279 2.132 1.342 1995 24.603 2.312 1.376 1996 25.230 2.515 1.441 1997 26.052 2.863 1.518 1998 26.824 2.892 1.605 1999 27.699 3.013 1.642 2000 28.403 2.993 1.715 2001 28.347 3.162 1.811 2002 28.535 3.421 1.854 2003 28.982 3.759 1.920 2004 29.761 4.197 1.971 2005 30.394 4.803 2.105 2006 30.983 5.258 2.248 2007 31.412 5.772 2.421

Source: GGDC 2008.1 Indicators of sectoral growth performance: China 1952-2006 1952-78 1978-2003 2003-2006 Agricultural GDP 2.20 4.52 Agricultural employment 2.02 0.51 Agricultural labour productivity 0.17 3.99 Industry and construction GDP 9.76 9.76 Industry and construction employment 5.84 2,83 Industry and construction labour productivity 3.70 6.74 Tertiary sector GDP 4.18 7.60 Tertiary employment 3.20 3.65 Tertiary labour productivity 0.96 3.81 Whole economy GDP 4.39 7.85 Total employment 2.57 1.89 Aggregate labour productivity 1.78 5.85 Impact of sectoral employment Shift on aggregate GDP growth
0.88
2.01
Source: Maddison (2007), table 3.10, p. 70, updated (to be completed)
05.000
10.00015.00020.00025.00030.00035.000
1978 1986 1994 2002
USCina India

See also p. 145 ( Wu’s estimates) for more detailed sectoral industrial estimates (1952-2003) Indicators of sectoral growth performance: China 1952-2006 1952-78 1978-2003 1978-2005 Agricultural GDP 2.2 4.5 6.2 Agricultural employment 2.0 0.5 0.2 Agricultural labour productivity 0.2 4.0 6.0 Industry and construction GDP 9.7 9.7 Industry and construction employment 5.8 2,8 Industry and construction labour productivity 3.9 6.9 Tertiary sector GDP 4.2 7.6 Tertiary employment 3.2 3.7 Tertiary labour productivity 1.0 3.9 Whole economy GDP 4.4 7.8 Total employment 2.6 1.9 Aggregate labour productivity 1.8 5.9 Impact of sectoral employment Shift on aggregate GDP growth
0.9
2.0
Source: Maddison (2007), table 3.10, p. 70, updated (to be completed) BS China (2007), p. 29 China: Structural indicators (%) Employment 1978 1989 1997 2005 Primary 70.5 60.1 49.9 44.8 Secondary 17.3 21.6 23.7 23.8 Tertiary 24.2 32.2 34.4 39.9 GDP Primary 27.9 24.9 18.1 12.6 Secondary 47.9 42.9 47.5 47.5 Tertiary 24,2 32.2 34.4 39.9 BS China (2007), p. 35 India Agriculture Industry Services Total Employment 1978 71 13 16 100 1993 64 15 21 100 2004 57 18 25 100 Value added

1978 44 24 32 100 1993 33 28 39 100 2004 22 28 50 100