Structural Acoustic Prediction and Interior Noise Control Technology
70
November 2001 NASA/CR-2001-211247 Structural Acoustic Prediction and Interior Noise Control Technology G. P. Mathur, C. L. Chin, M. A. Simpson, and J. T. Lee The Boeing Company, Long Beach, California
Transcript of Structural Acoustic Prediction and Interior Noise Control Technology

November 2001
NASA/CR-2001-211247
Structural Acoustic Prediction and InteriorNoise Control Technology
G. P. Mathur, C. L. Chin, M. A. Simpson, and J. T. LeeThe Boeing Company, Long Beach, California

The NASA STI Program Office ... in Profile
Since its founding, NASA has been dedicated tothe advancement of aeronautics and spacescience. The NASA Scientific and TechnicalInformation (STI) Program Office plays a keypart in helping NASA maintain this importantrole.
The NASA STI Program Office is operated byLangley Research Center, the lead center forNASA’s scientific and technical information. TheNASA STI Program Office provides access to theNASA STI Database, the largest collection ofaeronautical and space science STI in the world.The Program Office is also NASA’s institutionalmechanism for disseminating the results of itsresearch and development activities. Theseresults are published by NASA in the NASA STIReport Series, which includes the followingreport types:
• TECHNICAL PUBLICATION. Reports of
completed research or a major significantphase of research that present the results ofNASA programs and include extensivedata or theoretical analysis. Includescompilations of significant scientific andtechnical data and information deemed tobe of continuing reference value. NASAcounterpart of peer-reviewed formalprofessional papers, but having lessstringent limitations on manuscript lengthand extent of graphic presentations.
• TECHNICAL MEMORANDUM. Scientific
and technical findings that are preliminaryor of specialized interest, e.g., quick releasereports, working papers, andbibliographies that contain minimalannotation. Does not contain extensiveanalysis.
• CONTRACTOR REPORT. Scientific and
technical findings by NASA-sponsoredcontractors and grantees.
• CONFERENCE PUBLICATION. Collected
papers from scientific and technicalconferences, symposia, seminars, or othermeetings sponsored or co-sponsored byNASA.
• SPECIAL PUBLICATION. Scientific,
technical, or historical information fromNASA programs, projects, and missions,often concerned with subjects havingsubstantial public interest.
• TECHNICAL TRANSLATION. English-
language translations of foreign scientificand technical material pertinent to NASA’smission.
Specialized services that complement the STIProgram Office’s diverse offerings includecreating custom thesauri, building customizeddatabases, organizing and publishing researchresults ... even providing videos.
For more information about the NASA STIProgram Office, see the following:
• Access the NASA STI Program Home Pageat http://www.sti.nasa.gov
• E-mail your question via the Internet to
[email protected] • Fax your question to the NASA STI Help
Desk at (301) 621-0134 • Phone the NASA STI Help Desk at
(301) 621-0390 • Write to:
NASA STI Help Desk NASA Center for AeroSpace Information 7121 Standard Drive Hanover, MD 21076-1320

National Aeronautics andSpace Administration
Langley Research Center Prepared for Langley Research CenterHampton, Virginia 23681-2199 under Contract NAS1-97040
November 2001
NASA/CR-2001-211247
Structural Acoustic Prediction and InteriorNoise Control Technology
G. P. Mathur, C. L. Chin, M. A. Simpson, and J. T. LeeThe Boeing Company, Long Beach, California

Available from:
NASA Center for AeroSpace Information (CASI) National Technical Information Service (NTIS)7121 Standard Drive 5285 Port Royal RoadHanover, MD 21076-1320 Springfield, VA 22161-2171(301) 621-0390 (703) 605-6000

iii
Preface
This report was prepared by Boeing Phantom Works - Long Beach under Task Assignment 14 of
Contract NAS1-97040 with NASA Langley Research Center, Hampton, VA. The NASA
technical monitor was Daniel L. Palumbo.
This report describes work performed during FY 2000-2001. Dr. Gopal P. Mathur was the
principal investigator. Gopal Mathur and Cliff Chin prepared this report. Dr. Cliff Chin
developed the 3-dimensional FE modeling and code of the poro-elastic foam coupled with
vibrating structures. Cliff Chin also developed the FE models of the double wall system with
foam for prediction of its TL. Joshua Lee developed the active control algorithms and
implemented them within the FE code. Gopal Mathur coordinated the smart foam tests with the
Virginia Tech team (Dr. Chris Fuller, Dr. Mike Kidner and Pierre Marcotte). The smart foam
tests were conducted at the Boeing Noise Engineering Laboratories in Seattle, Washington with
the support of Mr. Eric Hofbeck of the Noise Laboratories. Myles Simpson provided overall
technical guidance on the project.
iv
Table of Contents
1. INTRODUCTION 1
2. FINITE ELEMENT MODELING OF SMART FOAM SYSTEM FORPASSIVE/ACTIVE NOISE CONTROL 32.1 Introduction 32.2 Finite Element Formulations 3
2.2.1 FE Formulations for Poroelastic Foam 4a. Poroelastic Constitutive equations 4b. Energy density functions 6c. FE discretization 7
2.2.2 FE Formulation for Acoustic Medium 82.2.3 FE Formulation of Elastic Plate 102.2.4 FE Formulations of Piezoelectric Actuator 10
2.3 FE Coupling Conditions 122.3.1 Structural-acoustic coupling 122.3.2 Structural-poroelastic coupling 132.3.3 Poroelastic-acoustic coupling 13
a. Open surface interface condition 13b. Sealed surface interface conditions 14c. Acuator-foam coupling 14
2.4. Implementation of Active Control using Smart Foam 142.5 The Complete Coupled FE System 16
2.5.1 Sound transmission loss 162.6 Numerical Validations and Discussions 17
2.6.1 Surface impedance of poroleastic material 172.6.2 Absorption coefficient of poroelastic material 182.6.3 Sound transmission through a double panel system 182.6.4 Double-wall panel with bonded-bonded foam 182.6.5 Active control in a 2-D smart foam system 19
2.7 Conclusions 20
3. SMART FOAM TESTS 333.1 Introduction 333.2 Experimental Test Setup 343.3 Discussion of Results 36
3.3.1 Flat, Stiffened Panel Tests 363.3.2 Fuselage Sidwall Tests 37
3.4 Conclusions 37
4. SMART FOAM SYSTEM DESIGN FOR FLIGHT TESTING 51
5. CONCLUSIONS AND RECOMMENDATIONS 55

v
6. REFERENCES 57
Appendix A: “Stiffness and Mass Matrices for Poroelastic and Acoustic Elements” 59
vi
List of Tables
2.1 Physical properties and dimensions of glass wool material 242.2 Physical properties and dimensions of poroelastic foam material 252.3 Physical properties and dimensions of for a double-panel system 28
List of Figures
2.1 Geometry of the coupled plate/air/foam/air/plate problem 222.2 Macroscopic modeling of smart foam 222.3 Geometry of 8-noded isoparametric hexahedra element 232.4a Geometry of the surface impedance problem 232.4b Finite element model of the surface impedance problem 242.5 Comparison of the surface impedance between an analytical model and theFE model for the glass wool layer 252.6a Finite element model of the sound absorption coefficient problem, foamelements are in dark area, and others are air elements 262.6b Comparison of the absorption coefficient between a previously validated2-D FE model and the current 3-D model 262.7a FE model for the air-filled double wall system 272.7b Comparison of the normal incidence sound transmission loss through anair-filled double panel between FE predictions and results from [9] 272.8a FE model for the foam-filled double wall system 292.8b Comparison of the normal incidence sound transmission loss through adouble panel with bonded-bonded foam: -- FE predictions andresults from [9], ----- 292.9 The FE model for the active control implementation 302.10 The Response of air duct without control 302.11 Response of air duct with global control at f=80 Hz 312.12 Response of air duct with local control at f=80 Hz 312.13 Computed applied voltages for smart foam actuators due to control strategies3.1. Laboratory setup showing smart foam actuators, error sensors andmonitoring microphones. 403.2 Stiffened panel with four smart foam actuators. 403.3 Instrumentation layout. 413.4a. Fuselage sidewall section mounted in the INTF test section – viewfrom source room 423.4b. Fuselage sidewall section mounted in the INTF test section – viewfrom anechoic room 423.5a. Test panel area and smart foam/DVA test arrangement 433.5b. Close up of smart foam and DVA elements 43


1
1. INTRODUCTION
The overall objective of the Interior Noise Reduction subelement of NASA's Advanced
Subsonic Technology program is to develop and validate weight-efficient technology to
minimize cabin and cockpit noise in commercial and general aviation aircraft. The goal of this
development and validation effort is to produce technology capable of yielding a 6 dB overall
interior noise reduction by the year 2001.
To help achieve this goal, two subtasks were conducted by the Boeing Company in 2000-
2001 under Task 14, “Structural Acoustic Prediction and Interior Noise Control Technology,” of
Contract NAS1-97040. One of the subtask involved development of finite-element based
prediction models and validation of the models with test data, while the other subtask involved
development and laboratory testing of smart foam for noise control treatments.
The next section of this report describes the development of a finite-element code for
modeling and determining response of vibrating structures lined with poroelastic foam. The FE
model was used to predict the structural response and transmission loss of a double wall panel,
simulating a structure with a trim panel, and treated with passive foam. Comparison of these
predictions with the available data is used to validate the FE method.
Section 3 discusses the results of transmission loss tests with passive and combined
passive/active treatments applied to a 757-sidewall test section. These treatments employ various
designs using "smart foam" elements. Such elements combine acoustic foam for high frequency
passive noise reduction with embedded active piezoelectric elements for low frequency noise
control, and also include an additional distributed mass to provide tuning of the element to
reduce noise in a specific frequency range.
In section 4, a smart foam configuration and overall system design that could be installed on
NASA’s 757 experimental aircraft for flight-testing is presented. This proposed design is based
upon the results of the 757-sidewall tests, combined with the results of earlier NASA-funded
work performed at Virginia Tech in which multiple de-coupled control elements were used
instead of a fully coupled system.

2
Section 5 summarizes the conclusions of all the subtasks, and provides recommendations
based on the results. References are listed in Section 6.
The appendix contain a description of: (i) stiffness and mass matrices for FE modeling of
poroelastic foam and acoustic media.
3
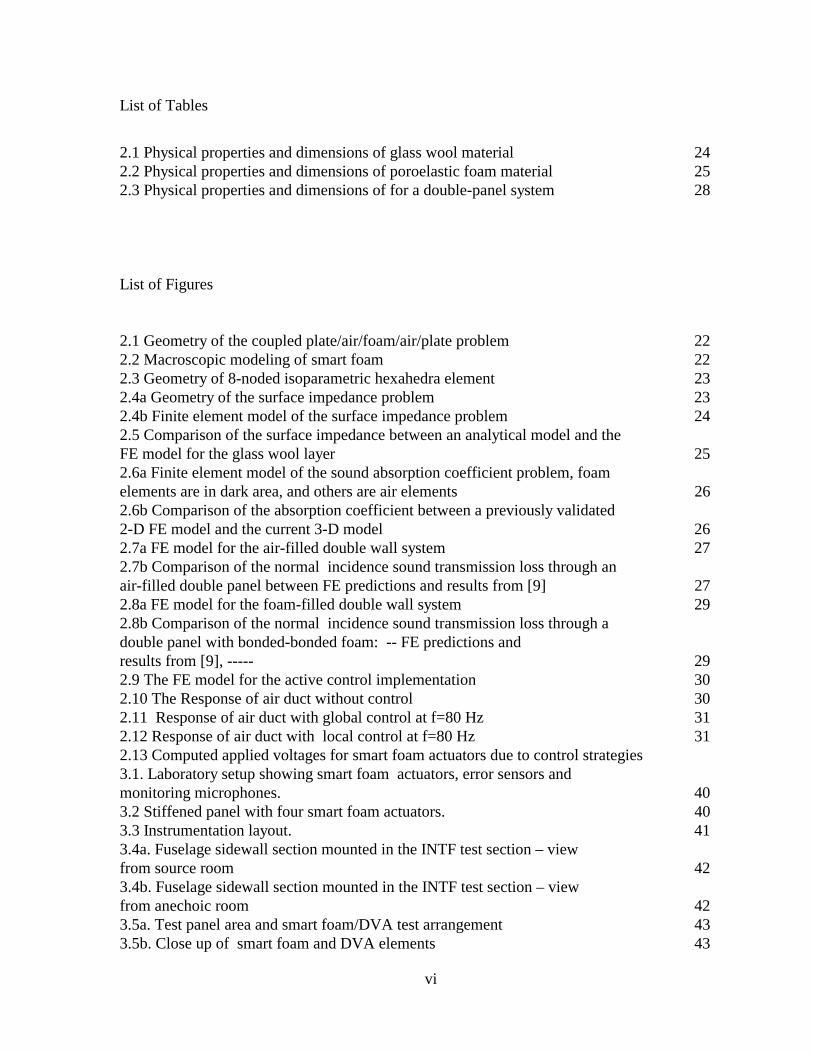
2. FINITE ELEMENT MODELING OF SMART FOAM SYSTEM FORPASSIVE/ACTIVE NOISE CONTROL
2.1 INTRODUCTION
The smart foam noise control system is designed to reduce sound by a combination of the
passive absorbing component of the poroelastic foam and the active component of the voltage-
driven PVDF (polyvinylidene fluoride) film [1]. In general, the passive foam works well in
middle to high frequencies while the active component provides cancellation for low frequencies.
In combining active and passive concepts, a hybrid noise control methodology is obtained which
allows the control of noise over a wide frequency bandwidth.
The purpose of developing this smart foam finite element model is to provide prediction
capabilities for varied configurations ranging from a single medium, such as structure, air space,
foam and PVDF film, to a system made of coupled multiple media, like the Distributed Active
Vibration Absorber (DAVA) system as mentioned in [2]. In order to achieve this, a three-
dimensional smart foam finite element model was developed to incorporate foam, acoustic,
structural, mass and PVDF elements together to meet the diverse numerical simulations.
The three-dimensional model is based on a previously developed two-dimensional smart
foam system. It has six additional types of elements in the three-dimensional (3-D) space (plate,
beam, in-plane structure membrane, acoustic, poroelastic, and peizoelectric elements), plus their
related coupling matrices for interfacing with the neighboring media. Except for the 3-D PVDF
element and its coupling with poroelastic element, all other elements in the smart foam model
have been validated against known data, as were their corresponding interface coupling matrices.
Those verification cases are detailed in Section 2.5. Although the development of a 3-D PVDF
element will be an ongoing task, the 2-D PVDF element was completely developed and
incorporated with the poroelastic element from a previous work. Also, the feed forward open-
loop control algorithm has been included to the 2-D smart system for implementing the active
control under the current task, and some results will be discussed in a later section.
2.2 FINITE ELEMENT FORMULATIONS
The typical three-dimensional smart foam system without the PVDF film is depicted in
Figure 2.1. The sound absorbing material, either fiberglass or acoustic foam, is inserted into an

4
air cavity which is enclosed by two elastic plates with arbitrary boundary conditions. The
absorbing material could be bonded or unbonded to the plates. If it is unbonded to the plate,
there will be a thin air gap between plate and the absorbing layer as shown in Figure 2.1. The
double plate system is assumed mounted in a rigid baffle, and one plate is subject to acoustic
excitation and another is radiating sound to the receiving room. Harmonic oscillation (ejwt) is
assumed for all excitation cases in this report.
2.2.1 Finite Element Formulation for Poroelastic Foam
Porous materials can be described as either rigid framed or elastic framed materials.
Fiberglass and acoustical foams are considered elastically framed porous materials. All of these
materials are heterogeneous in that they are comprised of a solid phase and a fluid phase as
shown in Figure 2.2. The theory used here is similar to [3] as a macroscopic approach. The
basic assumption is that the pore size (d) is much smaller than the macroscopic elementary
volume of porous material (D1). Also, the wavelength (D2) of sound propagating within the
porous medium is much larger than the pore space and the macroscopic elementary volume.
In the following, a Lagrangian approach together with finite element discretization is used to
obtain the discretized equations of motion for a poroelastic medium. For a three-dimensional
poroelastic element, six degrees of freedom per node are used. Three displacement components
are for the solid phase and three others for the fluid phase.
2.2.1.a Poroelastic constitutive equations:
The constitutive equations of poroelastic material describe the stress-strain linear relation
which is based on Biot-Allard model [4, 5], given as
}]{[}]{[}{ fsfsss DD εεσ += (2.1)
and
}]{[}]{[}{ ssffff DD εεσ += (2.2)
where Tsxz
syz
sxy
szz
syy
sxxs )222(}{ εεεεεεε = and Tf
xzfyz
fxy
fzz
fyy
fxxf )222(}{ εεεεεεε = are the strain
vectors for the solid and fluid phase, respectively, and [Ds], [Df], and [Dsf] are the matrices of the

5
elastic coefficients related to the solid phase, the fluid phase, and their coupling strain,
respectively. These matrices are written as
++
+
=
N
N
NNAAA
ANAA
AANA
Ds
0
0
2
2
2
][ (2.3)
Tsf mmQD }}{{][ = (2.4)
Tf mmRD }}{{][ = (2.5)
where A and N are Biot’s coefficients corresponding to the Lame’s coefficients in the theory of
elasticity, and A is expressed as
νν
212
−≅ NA (2.6)
Q is the Biot’s coefficient for the elastic coupling between the solid and fluid phases. R is the
Biot’s coefficient for the bulk modulus of the fluid phase. The strain-displacement relations for
the solid phase and the fluid phase are, respectively,
}{][}{ uLs =ε (2.7)
}{][}{ ULf =ε (2.8)
where [L] is the spatial derivative operator as
∂∂
∂∂∂∂
∂∂
∂∂
∂∂
∂∂
∂∂
∂∂
=
xy
zx
zy
z
y
x
L T
0
0
0
00
00
00
][ (2.9)
6
where {u} is the solid phase displacement and {U} the fluid phase displacement.
2.2.1.b Energy density functions
The equation of motion of a poroelastic system can be obtained from the energy functions of
the system. These energy functions consist of the strain, kinetic, dissipation and work energy
done by the applied loads. These energy function are described as follows:
1. Strain energy
The strain energy density for a poroelastic medium is given as
( )}{}{}{}{2
1f
Tfs
TsdU εσεσ += , (2.10)
From the previous material constitutive equations and strain-displacement relations, the strain
energy density term can be expanded into more meaningful expression as,
( )}]{][[})]{([}{]][[})]{([2}]{][[})]{([2
1uLDuLULDuLuLDuLdU s
Tsf
Ts
T +×+= (2.11)
The coupling between the strains of the frame and the fluid is represented by the middle term in
Eq. (2.11).
2. Kinetic energy
The kinetic energy for a poroelastic medium is given by [5]
( )}{}{}{}{2}{}{2
1221111 UUUuuudT TTT &&&&&& ρρρ ++= , (2.12)
where u and U are solid and fluid phase displacements, respectively; 11ρ and 22ρ are the
effective Biot’s densities depending on the geometry of the poroelastic frame; 12ρ is related to
the tortuosity of the frame.

7
3. Dissipation energy
The dissipation energy is introduced through the dissipation function [3],
}){}({}){}({)(2
1UuUubdD T &&&& −−= ω , (2.13)
where )(ωb is a complex and frequency-dependent viscous damping coefficient, and is related to
the flow resistivity and tortuosity of the porous material. Also, the dissipation is proportional to
the relative motion between the solid phase and the fluid phase.
4. External work energy
The external work done by the surface force is given as
},{}{}){}({}{ nT
nT fUhfhfudW +−= (2.14)
where }{ nf is the normal force vector. In Eq. (2.14) the first two terms and the last term are
related to the solid and fluid phase, respectively.
2.2.1.c Finite element discretization
The continuous poroelastic system can be mathematically discretized into algebraic form for
numerical computations. In order to do that, the interpolation functions are used to approximate
the macroscopic displacement fields {u} and {U} in terms of their nodal displacements, for
example, the e-th element mesh has the following form
eeu
e uNu }{][}{ = and eeU
e UNU }{][}{ = (2.15)
where euN ][ and e
UN ][ are the corresponding shape functions. The three-dimensional
hexahedral shape function is illustrated in Figure 2.3. For an eight-node hexahedral or brick
element, the Lagrange shape functions can be written as
)1()1()1(8
1 ζζηηξξ iiiiN +++= (2.16)

8
where ),,( iii ζηξ represent the coordinates of node i (from 1 to 8) of the element in the
),,( ζηξ system. The generalized nodal displacements for the element are represented by the
vector
[ ]Tqqqq 4821 ,,, L= (2.17)
where each node has six degrees-of-freedom, three for solid phase and three others for fluid
phase displacements.
Substituting Eq. (2.15) into all energy terms in Eqs. (2.11)-(2.14), summing those energy
terms and integrating over the element, the discretized equations of motion for the poroelastic
medium are in the matrix form as,
( ) ( )( ) ( )
( ) ( )( ) ( )
=
+
+
−
}{
}{
][][
][][
][][
][][
][][
][][2
f
s
ffsf
sfss
ffsf
sfss
ffsf
sfss
F
F
U
u
KK
KK
CC
CCj
MM
MM
ωωωω
ωωωω
ωω (2.18)
where [M], [C] and [K] are the equivalent stiffness, damping, and mass matrices, and the
subscripts “ss”, “ff” and “sf” denote solid phase, fluid phase and solid-fluid coupled phases inside
the foam, respectively. The detailed expression of each sub-matrix is given in Appendix 1. In
Eq. (2.18) the damping and stiffness matrices of the poroelastic medium are complex valued and
frequency-dependent. Therefore, the final finite element system matrix is big and its frequency-
dependent sub-matrices need to be calculated at each frequency. In general, the poroelastic
elements occupy a significant portion of the system’s degrees-of-freedom, and they require more
lengthy computations when compared to other medium matrices.
2.2.2 Finite Element Formulation for Acoustical Medium
Consider a volume V enclosed by a surface S. Within the volume the pressure, p, must
satisfy the wave equation
0)(2
22 =+∇ p
cp
ω, (2.19)

9
where ω is the angular frequency of vibration and c the speed of sound. On the acoustically hard
surface the normal velocity is zero, giving
0=∂∂
np , (2.20)
The solution of the governing equation (2.19) subject to the boundary condition (2.20) can
be written as an equivalent variational principle,
0)()(2
1 22
22 =
−∇∫ dVp
cp
v
ωδ , (2.21)
In order to discretize the acoustic domain into classical finite element matrices, a three
dimensional hexahedral shape function similar to poroelastic element (Figure 2.3) is used, which
has only the pressure DOF per node. The pressure distribution is represented by a shape function
as
{ } ii pNp = (2.22)
where
{ } [ ]Ti pppp 821 ,,, L= (2.23)
is a column matrix of nodal pressure values for the i-th element.
The acoustical finite element formulation for the air cavity is based on Petyt’s model [6].
The matrix equation for the acoustic enclosure is given as
{ }
=
−
ωρωρR
jPc
MK
a
a
a
a22
][][ (2.24)
where ][ aK is the stiffness matrix of the acoustic medium, ][ aM the acoustic mass matrix (those
are detailed in Appendix 2), P is the acoustic pressure, ρ0 the air density, c the sound speed in air
and the {R} the volume displacement of the air.

10
2.2.3 Finite Element Formulation of Elastic Plate
In deriving the energy functions for a thin plate, it is assumed that the direct stress in the
transverse direction is zero. Also, normals to the middle surface of the undeformed plate remain
straight and normal to the middle surface during deformation.
The kinetic and strain energy of the thin plate are given as [7],
∫=Ae dAwhT 2
2
1&ρ (2.25)
{ } [ ]{ }∫=A
Te dAD
hU χχ
122
1 3
(2.26)
where
{ }
∂∂∂
∂∂
∂∂
=
xxw
yw
xw
2
2
2
2
2
2
χ (2.27)
[ ]
−−
−−=
G
EE
EE
D
00
011
011
22
22
υυυ
υυ
υ (2.28)
The work done by external forces is
( )dsvpupWs yx∫ += δδ (2.29)
where s denotes the boundary of the element.
2.2.4 Finite Element Formulation of Piezoelectric Actuator
The active component of the smart foam system is the PVDF film that is embedded in the
acoustic foam, and the PVDF film is driven by an electrical voltage that causes the film to strain.
11
The in-plane strain of the film is considered aligned with the electrical field and its strain energy
density is expressed [3] as,
( )Eddx
duY
dx
duYdV 31
2
2
1
2
1
+
= (2.30)
where Y is the Young’s modulus of the PVDF film, d31 the piezoelectric strain constant, E the
applied electrical field—voltage/thickness of PVDF.
The kinetic energy density of the in-plane motion of the PVDF film is described by
2
2
1umdT L &= (2.31)
where mL is the mass per unit length of the PVDF film and u& the axial velocity.
For numerical computation, the piezoelectric energy equation is discretized into matrix form via
shape functions, eN ][ . The displacement field of the PVDF film, {u}, is in terms of the nodal
displacement eu}{ for the eth element,
{ } [ ] { } eeu
e uNu = (2.32)
For a two-dimensional piezoelectric film element the shape function is written as,
[ ]
+−=
2
1,
2
1 ξξeuN , (2.33)
and the three-dimensional shape function is
[ ] ( ) ( ) ( ) ( ) ( ) ( ) ( ) ( ) ηξηξηξηξ +−++−+−−= 11,11,11,114
1euN (2.34)
where ξ and η are finite element natural coordinates in x and y axes, respectively.
Substitutions of equations (2.33) and (2.34) into (2.30) and (2.31), the equation of motion
for a piezoelectric actuator element is therefore, given by
[ ]( ){ } { }FuMK =− 2][ ω (2.35)
12
where [K] and [M] are, respectively,
[ ] [ ] Γ∂∂
∂∂= ∫ dN
uN
uYK
T
e uu][ (2.36)
[ ][ ] Γ= ∫ dNNMT
e uuρ][ . (2.37)
The force vector is driven by a given voltage described as
{ } Γ∂∂= ∫Γ
dNx
EYdF ][31 (2.38)
Since the PVDF film is embedded in the acoustic foam, the mass and stiffness matrices and
the forcing vector of the PVDF element will be added to the corresponding degrees of freedom of
the foam.
2.3 FINITE ELEMENT COUPLING CONDITIONS
The coupling conditions involved in the smart foam system are of the following types:
structural-acoustic, structural-poroelastic, poroelastic-acoustic, poroelastic-structural, and
structural-acoustic-poroelastic.
2.3.1 Structural-Acoustic Coupling
The motion of the flexible wall is induced by the external pressure loads, and the motion of
vibrating wall causes the acoustical medium inside the enclosed cavity to oscillate. This
acoustic-structure interaction can be described by the following classical continuity equations [8],
jijjij nPn δσ −= (2.39)
nWn
P0
2 ρω=∂∂
(2.40)
where Wn is the normal displacement of the vibrating structure. The compatibility of the normal
force is ensured in (2.39) and the normal velocity ensured in (2.40) at nodal points at the
interface joining the structural and acoustical system.

13
2.3.2 Structural-Poroelastic Coupling
When the poroelastic system is attached to a plate, there is continuity between the
displacement field of the plate and that of the poroelastic material to be ensured at the nodal
points at their interface. The interface conditions to be satisfied at the interface are [8]
nn uUWu == , (2.41)
where un and Un represent the normal displacement of the solid and fluid phases, respectively.
The first equation ensures continuity of the solid displacements, while the second equation the
continuity of the normal component of the acoustical flow. In the problems where rigid
connections between the different media are required, we use the Lagrange multiplier method to
treat constraints. The Lagrange multiplier adds constraint equation to the system but requires
less matrix manipulations compared to the method of eliminating the dependent degrees of
freedom.
2.3.3 Poroelastic-Acoustic Coupling
When the poroelastic material is coupled to a neighboring acoustic system, compatibility of
the normal and shear forces and the continuity of the normal volume velocity should be ensured
at the interface joints. Two types of interface conditions are considered here [8]. The first set of
interface conditions model an open surface and the second set a sealed surface.
2.3.3.a Open surface interface conditions
At an open surface, there are four boundary conditions to be satisfied: two normal stress
conditions, one shear stress condition, and a normal volume velocity condition. Those conditions
are, respectively,
shp =− (2.42)
( ) xph σ=−− 1 (2.43)
0=xyτ (2.44)
( ) xxx hUjuhjv ωω +−= 1 (2.45)
where h is the porosity of a foam.

14
2.3.3.b Sealed surface interface conditions
When the poroelastic material is bonded to a membrane, there are four boundary conditions
that must be satisfied: one normal velocity condition, two displacement conditions, and a force
condition. These conditions are
Wjvx ω= (2.46)
Wux = (2.47)
WU x = (2.48)
Wmqp sp2)()( ω−=±± (2.49)
where W is the membrane transverse displacement, ms is the membrane mass per unit area and qp
is the normal force per unit area exerted on the membrane by the foam.
2.3.4 Actuator -Foam Coupling
In the case where the PVDF film is perfectly bonded to the structure, there are continuity of
displacements between the PVDF film and the foam.
fafa vvuu == , (2.50)
where subscripts “a” and “f” denote the actuator and foam, respectively.
2.4 IMPLEMENTATION OF ACTIVE CONTROL IN SMART FOAM
SYSTEMS
In order to devise an active noise control strategy using smart foam elements, the method of
complex least squares is applied. The acoustic pressure is induced by two factors: external
excitations and control excitations. In a mathematical expression,
{ } { } [ ]{ }VPPP ve += (2.51)
where,
15
{P} = The total acoustic pressure state vector resulting from external excitations and control
inputs.
{Pe} = The acoustic pressure state vector due to external excitations.
[Pv] = The acoustic pressure state matrix resulting from unit voltage input to the smart foams
{V} = The unknown voltage input to the smart foams.
In order to compute the unknown voltage input that would minimize the total acoustic
pressure, the following steps are taken. First, the total acoustic pressure vector is set to zero.
Because the total pressure state vector is set to zero, the overall acoustic effect is global.
{ } [ ]{ } { }0=+ VPP ve (2.52)
Second, [Pv]H, the hermitian of [Pv], is multiplied to both the {Pe} and [Pv]. This makes the
resulting control-induced acoustic pressure matrix invertible. Finally, the unknown voltage is
solved. The final expression of the unknown voltage for the global acoustic control is
{ } [ ] [ ]( ) [ ] { }eHvv
HvG PPPPV
1−−= (2.53)
This is an approximate minimization approach because the resulting {P} due to {VG} is not
null. When a set of multiple smart foams is used, {VG} can be used as a tool to identify the ones
that are more effective than the others.
The next step taken is a development of a local control strategy. Mathematically, a pressure
output vector is generated by multiplying Equation (2.51) with an output matrix [C].
{ } [ ]{ }PCPoutput = (2.54)
where {Poutput} is an output acoustic pressure vector composed of pressures at pre-selected
locations of sensors. It is a subset of the acoustic pressure state vector, {P}. Therefore, the output
matrix [C] extracts the information at the sensor locations from {P}. By substituting Equation
(2.52) into Equation (2.54), the following expression of local minimization voltage is derived.
{ } [ ] [ ]( ) [ ] [ ] [ ] { }eTHvv
THvL PCCPPCCPV
1][][
−−= (2.55)

16
2.5 THE COMPLETE COUPLED FINITE ELEMENT SYSTEM
The completely coupled system consists of structural, acoustic, and poroelastic elements and
their related coupling matrices where interface conditions are established. In this present study,
the 4-noded rectangular element is used for the plate element. This plate element has three
degrees of freedom at each node, namely, the normal displacement and two rotations. As for the
acoustic cavity, the 8-noded isoparametric hexahedron element with one pressure degree of
freedom is used. A similar hexahedron element for the poroelastic medium is used, but it has 6
degrees of freedom per node (three translations for the solid phase and three for the fluid phase).
Combining each individual element and their corresponding coupling matrices, the coupled
system is established. For example, in the case of a plate/air/porous/plate configuration, the
coupled system is given as
[ ][ ]
[ ][ ]
[
[ ][ ]
[ ][ ]
[ ][ ]
[ ][ ]
[ ][ ]
[ ][ ]
]
[ ]
=
00
11/1
0
0
1/1
1/1
0
int
01/1
1
1/1
00
1/1
1
2
1
2
1
p
f
a
p
l
p
f
a
p
T
T
T
T
F
FF
F
D
D
DD
D
g
a
l
plateplfo
matrix
plfofoam
airfo
constra
airfo
air
airpl
lagrange
airpl
plate
M
L
(2.56)
where [plate1] and [plate2] are plate system matrices, [foam] the poroelastic matrix, [pl1/air1]
the coupling matrix for plate 1 and air cavity 1, same matrix notations applied to [fo1/air1] and
[fo1/pl1]. The Lagrange constraint matrix is utilized for rigid connections between foam and
plate. Due to the frequency-dependent nature of poroelastic material, the foam system matrix
needs to be updated for each frequency, which is the most time consuming portion in the whole
computation process and it happens only to the poroelastic element.
2.5.1 Sound Transmission Loss
The sound transmission loss is evaluated as
=
t
i
I
ITL log10 (2.57)

17
where ( )cpI armsi ρ4/2= is the normal intensity incident on the panel, 2rmsP is the space-average,
mean square sound pressure in the reverberation room, and It is the transmitted normal intensity
averaged over the surface of the test panel.
2.6 NUMERICAL VALIDATIONS AND DISCUSSIONS
The finite element model described in the previous sections was coded in Matlab script
language and executed under the Matlab environment. The sound transmission loss program
based on Rayleigh integral and mesh generator programs were written in C language. Matlab was
chosen to develop the program because of its rich math library and pre-coded control algorithms.
However, Matlab codes are written in script language which may not be executed as fast as
compiled machine codes, such as programs writtrn in FORTRAN, C and C++.
In the following, the program is used to make predictions for foam medium, foam-air
coupled system, and double-panel cases with bonded-bonded foam configurations. The results
are compared with results in the existing literature as a means of validating the finite element
model.
2.6.1 Surface Impedance of Poroelastic Material
The prediction of surface impedance of poroelastic material is used to validate the
poroelastic finite element model. The prediction is compared with an exact analytical calculation
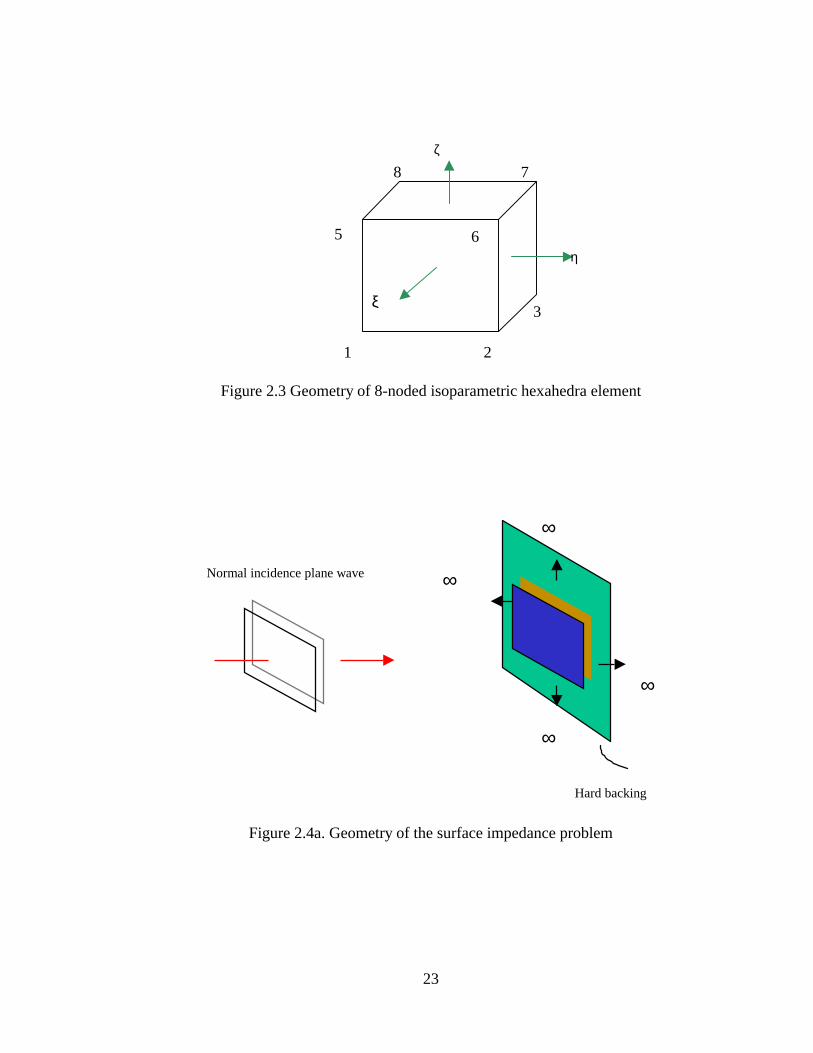
in [10]. The configuration of poroelastic layer is depicted in Figure 2.4a, the material properties
are described in Table 2.1. The glass wool layer is bonded to a rigid impervious wall, and a
normal incidence plane wave of unit amplitude excites the absorbing material. Since the layer is
assumed laterally infinite, only the axial displacement is considered and the lateral displacement
is set to zero. The poroelastic layer is modeled with ten 8-noded hexahedral elements in Figure
2.4b. The finite element prediction provides excellent results when compared with the exact
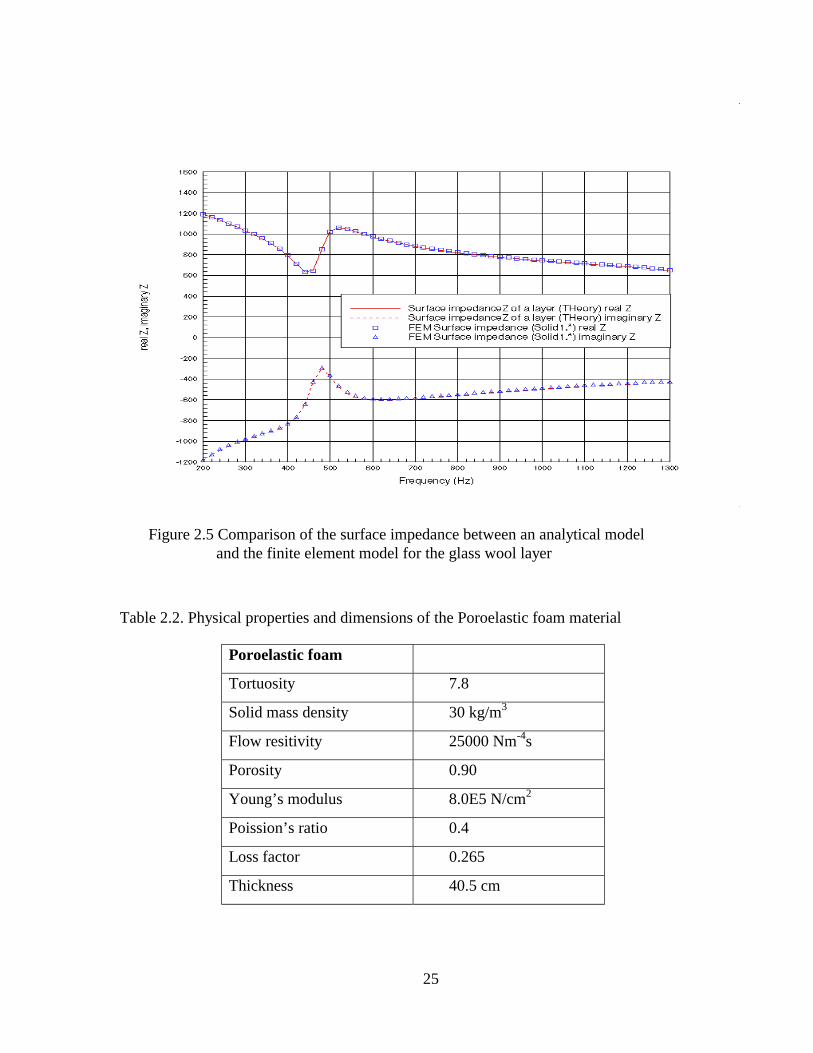
solution, shown in Figure 2.5, and proves the validity of the developed poroelastic element.
2.6.2 Absorption Coefficient of Poroelastic Material
In order to validate the accuracy of the coupled poroelastic/acoustic finite element model, a
three-dimensional waveguide containing foam and air elements is used, shown in Figure 2.6a.

18
The material properties of the foam are listed in Table 2.2. The predicted absorption coefficient
of the foam is compared with the result from [7]. In this case, a plane acoustic wave is traveling
toward the foam, and the surface velocity on the foam surface can be calculated from the finite
element model. Once the surface velocity of the foam is predicted, the same approach described
earlier can be used to compute the surface impedance Zn. The absorption coefficient is then
obtained through the following equation
2
1cZ
cZ
an
an
ρρα
+−−= (2.58)
In this validation, the finite element prediction is compared with a previously validated 2-D
model, as shown in Figure 2.6b. The previous 2-D finite element has been validated against the
analytical solution in [8]. An excellent agreement between both is obtained, and it validates the
developed coupling matrix between poroelastic and acoustic media.
2.6.3 Sound Transmission through a Double-Panel System
In this section, the validation of the panel vibration and sound radiation is presented. Air is
the only medium inside the double-panel cavity. The finite element model for this air-filled
double-panel is depicted in Figure 2.7a. The normal incidence transmission loss through a
double-panel is used to validate the plate, acoustic elements and their structure-acoustic coupling
matrix all together. The sound transmission loss is based on the Rayleigh’s integral method
which needs the finite element solution of surface velocities of plate 2. Comparison between the
finite element prediction and the published data from [9] is shown in Figure 2.7b, and the good
agreement validates the structure-acoustic finite element model.
2.6.4 Double-Wall Panel with Bonded-bonded Foam
A double-panel system with bonded-bonded foam configuration is presented to study the
coupling between panels and the foam. The foam is assumed perfectly attached to the flexible
panels. Material properties and dimensions are listed in Table 2.3. The finite element model for
this design configuration is shown in Figure 2.8a. A uniform acoustic pressure is applied to plate
1 as the only external force to the system. Plate 2 vibrates and radiates sound caused by the
coupling of foam and plate 1. The finite element prediction is close to the published data [9],

19
and differences are less than 5 dB, see Figure 2.8b. This agreement would likely be improved
with a higher mesh density model. When this finite element model is compared with the
previous air filled model the previous one has much higher mesh density than the current model.
Obviously, the foam model needs a higher density than the acoustic system because of its
complex physical mechanism and its 6-DOF node containing both solid and fluid phases.
However, a higher mesh density for this foam model results in a substantial increase in
computation time, so there is a trade between accuracy and speed which must be taken into
account when one makes predictions for FE models with foam elements.
This example can be extended to model a Distributed Vibration Absorber (DAV) system, if
one of the plates bonded to the foam does not have any constraints. A DVA system can be tuned
by varying the mass distribution or stiffness distribution of this plate in order to minimize the
vibration of the structure and therefore reduce the noise. Moreover, if an active PVDF film is
embedded in the foam, a Distributed Active Vibration Absorber (DAVA) is created.
2.6.5 Active Control in a 2-D Smart Foam System
A subsection in the main MATLAB file is created to implement the active control strategies
and a simple case is tested to determine their effectiveness. The tested finite element model is
shown in the Figure 2.9. It consists of 3 smart foam elements placed in the bottom of an air duct.
The external excitation is a line volume velocity source of 0.002 m3/s and this represents a noise
source with 80dB SPL. Figure 2.10 shows the response of the duct without any control input at
80 Hz. Figure 2.11 shows the response of the duct after implementing the global control strategy
at 80 Hz. As the two figures indicate, the overall reduction ranges from about 10 to 40 dB.
In order to study the effectiveness of the local minimization strategy, a strip between the
smart foams and the noise source is chosen as a sensor location. Figure 2.12 shows the duct
response after applying {VL}. As the figure clearly indicates, the control strategy is highly
effective in reducing the noise within the chosen zone. And, unlike the global reduction strategy,
the local control effort is clearly more effective in terms of the level reduction within a selected
zone because of the fewer number of the pressure variables to minimize.
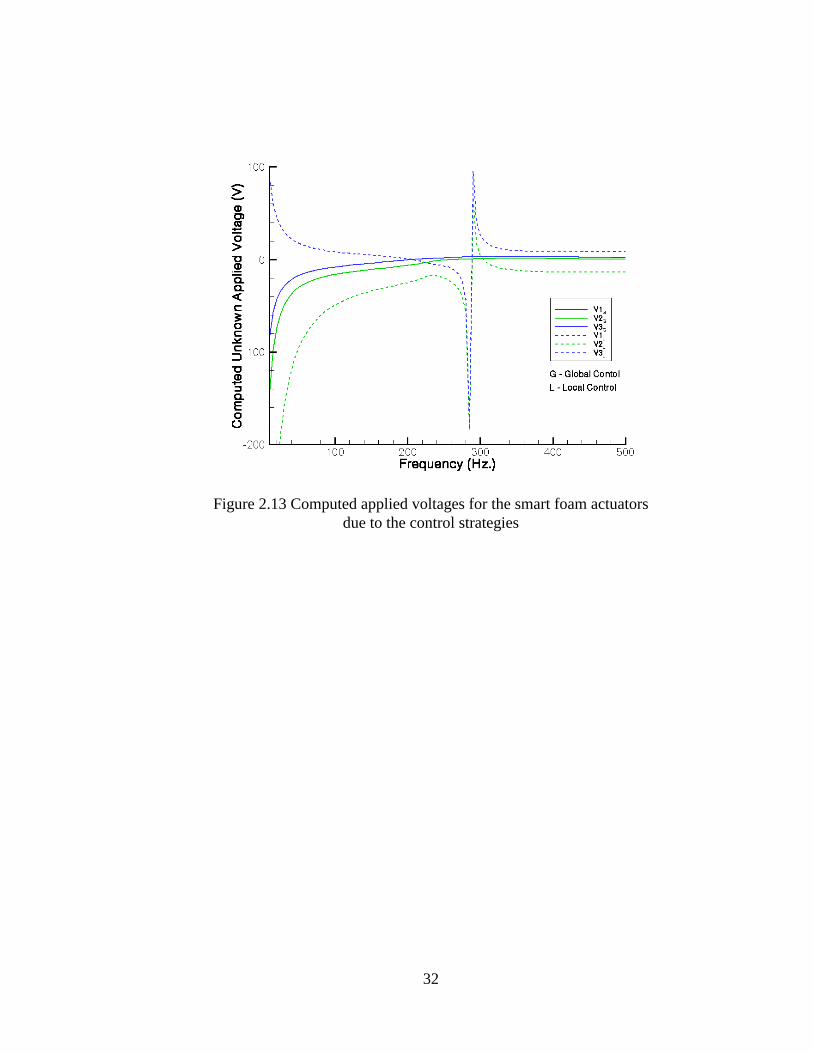
To observe the performance of the smart foam elements, the computed applied voltages are
plotted. Figure 2.13 shows the computed voltages for both the global and local control strategies

20
in the frequency range from 5Hz to 50 Hz. As expected, the control effort is significantly higher
in the low frequency region for both the strategies. Generally, the local control takes more effort
than global control throughout the frequency range. Also, Foams 1 and 3 show identical trends.
This indicates that the computed voltages actuate the foams in spatially symmetric manners. In
terms of magnitude, the voltage for the Smart Foam 2 shows higher levels for both the control
strategies, thus playing a more critical role in reducing sound pressure than its neighbors.
Consequently, a control strategy can be devised to take advantage of this factor, which would
reduce the overall control level. Finally, the local control strategy shows a modal behavior
around 280 Hz. The cause is still under investigation.
2.7 CONCLUSIONS
In this section, the development of a three-dimensional finite element model for a coupled
PVDF-structure-acoustic-poroelastic smart foam system is described. Predictions can be made
using this smart finite element model for a variety of configurations ranging from systems with
single medium to systems made of elastic, acoustic, and poroelastic media. For a single medium
system, the program predicts surface impedances of the foam, cavity pressures and structural
responses, and for a multiple media coupled system the program can predict sound absorption
coefficients and sound transmission loss for a simple double-panel or that with different foam
lined configurations. A step-by-step approach was taken in building the smart foam finite
element model from individual medium elements to multiple coupled interface matrices along
with their corresponding validations.
Except for the foam lined case which may need refined meshes to improve accuracy, this
finite element model predicts results which agree very well with published data. Those
validations verify implementations of mathematical equations on which the finite element model
is based. In the future, the capability of the smart foam finite element model will be improved to
handle detailed models more efficiently without losing accuracy, by applying techniques such as
DOF reduction of foam elements where lateral DOF’s can be mathematically ignored under
certain conditions.

21
The finite element model can be used for other complex boundary conditions, geometries,
excitations, and different liner designs. The smart foam model development will be continued,
and the three-dimensional PVDF element will be developed and integrated in the present foam
system. Further, the design parameters of the smart foam element, including the dimensions,
shapes and material properties of the foam and the PVDF actuator, can be determined by using
this model to achieve the noise reduction in the frequency range of interest.

22
Figure 2.1 Geometry of the coupled plate/ai
Figure 2.2 Macroscopic Modeling
plate 1
m
air
=
D1
d
Elemental volume
D2
plate 2
foa
r/foam/air/pl
of Smart Foa
gap 1
Solid phase
air gap 2
ate problem
m
+
Fluid phase
23
Figure 2.3 Geometry of 8-noded isoparametric hexahedra element
Figure 2.4a. Geometry of the surface impedance problem
η
ζ
ξ
2
3
5 6
78
1
Normal incidence plane wave
∞
∞
∞
∞
Hard backing

24
Figure 2.4b. Finite element model of the surface impedance problem
Table 2.1. Physical properties and dimensions of the glass wool material
Glass wool
Tortuosity 1.06
Solid mass density 130 kg/m3
Flow resitivity 40000 Nm-4s
Porosity 0.94
Shear modulus 220(1+0.1j) N/cm2
Viscous characteristic dimension 56 um
Thermal characteristic dimension 110 um
Thickness 10 cm
25
Figure 2.5 Comparison of the surface impedance between an analytical model and the finite element model for the glass wool layer
Table 2.2. Physical properties and dimensions of the Poroelastic foam material
Poroelastic foam
Tortuosity 7.8
Solid mass density 30 kg/m3
Flow resitivity 25000 Nm-4s
Porosity 0.90
Young’s modulus 8.0E5 N/cm2
Poission’s ratio 0.4
Loss factor 0.265
Thickness 40.5 cm

26
Figure 2.6a. Finite element model of the sound absorption coefficient problem,
foam elements are in dark area, and others are air elements
Figure 2.6b. Comparison of the absorption coefficient between a previously
validated 2-D finite element model and the current 3-D model

27
Figure 2.7a. Finite element model for the air-filled double wall system
Figure 2.7b. Comparison of the normal incidence sound transmission loss through anair-filled double panel between the FE prediction,---, and results from [9], - - -

28
Table 2.3, Physical properties and dimensions for a double-panel system
Plates
Width 0.35 m
Height 0.22 m
Thickness 0.001 m
Mass density 2814 kg/m^3
Young’s modulus 71 Gpa
Acoustic pressure 1.0 N/m-2
Poisson’s ratio 0.33
Loss factor 0.01
Foam
Depth 0.0762 m
Flow resistivity 25000 Nm-4
Porosity 0.90
Tortuosity 7.8
Viscous characteristic dimension 93.2 um
Thermal characteristic dimension 93.2 um
Poisson’s ratio 0.4
Bulk modulus 800 kPa
Loss factor 0.265
Solid mass density 30 Kg/m3

29
Figure 2.8a. Finite element model for the double wall system withbonded-bonded foam configuration
Figure 2.8b. Comparison of the normal incidence sound transmission loss through a double-panelwith bonded-bonded foam: FE prediction,--ρ-, and result from [9], ---

30
Figure 2.9 The finite element model for active control implementations
Figure 2.10 The response of the air duct without control

31
Figure 2.11 The response of the air duct with the global control at f=80 Hz
Figure 2.12 The response of the air duct with the local control at f=80 Hz
32
Figure 2.13 Computed applied voltages for the smart foam actuatorsdue to the control strategies

33
3. SMART FOAM TESTS
The development and testing of an aircraft sidewall treatment using smart foam lining is
discussed in this section. In the first phase, laboratory experiments were conducted on a double
wall panel system to evaluate acoustic performance of several passive and active configurations
of smart foam actuators attached to the base panel. In the second series of tests, active control
using smart foam actuators was implemented on a 757-sidewall section configured with a trim
panel. A multi-input, multi-output (MIMO), filtered-X, feed-forward controller with realistic
reference sensors (e.g., accelerometers) was used to accomplish active control through the smart
foam elements by minimizing the error signal provided by an array of error microphones. The
active control through smart foam actuators significantly improved noise reduction of the
sidewall in the low to mid frequency range (200 – 800 Hz).
3.1 INTRODUCTION
In recent years, there has been an increasing interest in the reduction of sound and/or
vibration by use of hybrid active-passive control techniques. Smart foam is a composite noise
control treatment that consists of a distributed piezoelectric actuator, known as polyvinylidene
fluoride (PVDF), embedded within a layer of partially reticulated polyurethane acoustic foam.
Passive acoustic foams offer a very reliable high frequency sound reduction method. Embedding
piezoelectric actuators in the foam enhances the noise reduction characteristics of the foam
through active control in the low frequency region. The resultant smart foam combines the
inherent mid- to high-frequency passive noise control capability of an acoustical foam treatment
with the low frequency noise control capabilities of an active control system. This active noise
control approach utilizes and integrates the passive sound proofing subsystem as part of the
active system to conserve weight and space.
Bolton et al [11], Fuller et al [1,12,13], have investigated the effectiveness of smart foam
actuators for reducing sound radiation from vibrating panels. In these previous investigations,
smart foam actuators were directly bonded to the vibrating structures and tested for different
excitation fields, such as acoustic and boundary layer noise. Mathur et al [14] examined the

34
effectiveness of smart foam lined trim panels in improving transmission loss of a fuselage
sidewall. In the present work, the emphasis is on the design and testing of a configuration of
smart actuators which can be integrated into the noise reduction treatment package of a fuselage
sidewall.
3.2 EXPERIMENTAL SETUP
These tests were divided into two groups: (i) active control of broadband sound radiation
from a flat, stiffened panel and (ii) active control tests on the 757 fuselage sidewall. Both of these
configurations incorporated a trim panel, thereby creating a double wall system. In the first tests,
the main objectives were to: (1) investigate the effects of different reference sensors and select
the most effective reference sensor strategy, and (2) optimize controller configuration. The main
objective of the second tests was to incorporate the lessons learned from the first tests to
demonstrate significant active control of broadband noise transmission through a full-scale
fuselage.
In the first series of tests, a flat, stiffened panel was mounted in the test window of a
transmission loss suite consisting of two reverberation chambers at VPI&SU (Virginia
Polytechnic Institute & State University, Blacksburg VA). An illustration of the test setup is
shown in Figure 3.1. Four smart foam actuators were bonded to four sub-panels of the stiffened
panel, see Figure 3.2. A trim panel, attached to the frames of the stiffened panel, created the
double wall system and covered the smart foam actuators. The sound field in the source room
was monitored by 3 microphones placed at random locations. Four microphones were placed in
the double wall cavity. Eight far-field and 4 near-field microphones were used for control and
measurement in the receiving room. Twelve accelerometers, three on each of the four sub-panels
with smart foam actuators, provided realistic reference signals.
In the active control tests, the performance of smart foam was compared with and without
control. The effect of controller configuration on smart foam performance was also investigated.
Several other parameters, such as number and placement of smart foam actuators, reference

35
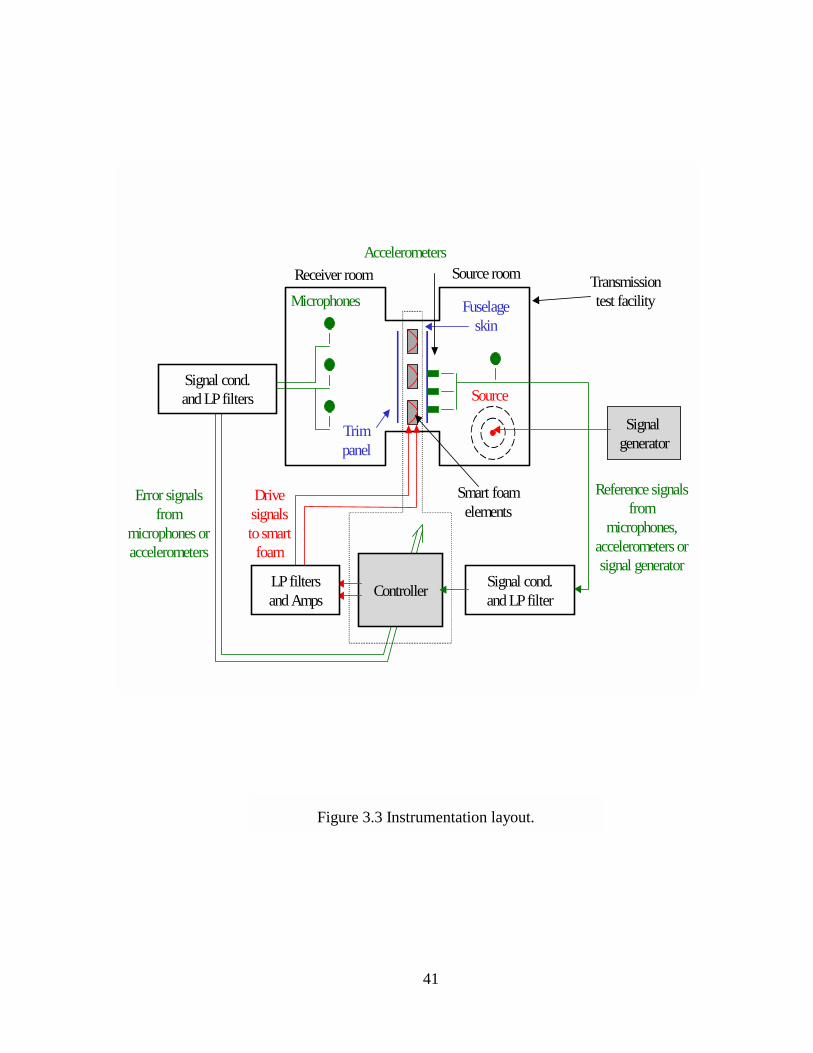
signal and number of control channels, were studied during the tests. The instrumentation layout
for active smart foam tests is shown in Figure 3.3.
In the second series of tests, a sidewall section of a 757 fuselage was mounted in the test
window (see Figures 3.4a and 3.4b) of the Interior Noise Test Facility (INTF) located in the
Boeing ANP (Aerodynamic, Noise and Propulsion) Engineering Laboratory complex in Seattle.
This sidewall section includes the sidewall, floor and cargo compartment and extends over four
frame bays. Within the INTF, a reverberation chamber, with a dimension of 35 x 29 x 23 feet,
houses the source speaker system. An anechoic chamber, with a dimension of 58 x 41 x 31 feet,
was used to measure the transmitted sound through the structure.
The receiving side of the fuselage panel with the trim removed is shown in Figure 3.5a. The
smart foam tests reported here were limited to an area encompassing three frames and six
longerons as shown. The other areas were treated with acoustic foam and lead vinyl blankets to
reduce the flanking of acoustic energy via this path. The corresponding trim panels were located
over these areas as well. For all the tests the overhead baggage containers were located in
position as shown. The arrangement of smart foam elements and DVAs, used to control the
sound transmission, is illustrated in Figure 3.5a. Four smart foam actuators numbered 1 through
4 were located above the window plane as shown. Four additional smart foam actuators
numbered 5 through 8 were also located along the floor line. Twelve DVAs with tuned
frequencies in the frequency range of 350 -450 Hz were located as shown in Figure 3.5a. A close
up photo of the smart foam element (#2) and DVA combination located above the window line is
shown in Figure 3.5b. Note that the smart foam elements do not completely cover the panel as
desired. This is due to limitations in the number of usable control channels for a fully coupled
controller. It is observed that the lack of continuous smart foam coverage is likely to reduce the
obtained performance.
A random, diffuse sound field of approximately 100 dB over a frequency range of 100 –
1000 Hz, with a peak at 450 Hz, was set up in the reverberation chamber. A shaker was attached
to the fuselage section (on the source side) in the window belt area for the case of structural
excitation. A microphone array containing 10 microphones was installed in the anechoic
chamber. Four additional monitoring microphones were placed in the anechoic chamber at

36
different heights and distances from the test panel. Several configurations of smart foam
actuators on the sidewall were tested.
An acoustical grade, partially reticulated polyurethane open cell foam, designed to give
maximum sound absorption per given thickness, provided the passive element of the smart foam.
Since passive noise reduction is only significant at high frequencies, a PVDF film was embedded
in the foam to implement the active control, which is most effective at low frequencies. The
active PVDF film forces both the fluid and solid phases of the acoustic foam. The PVDF film is
intentionally curved to couple the predominantly in-plane strain associated with the piezoelectric
effect and the out-of-plane motion, which is the dominant mechanism of radiating sound away
from the surface of the foam. Much work has been done to investigate the optimal configuration
of a smart foam actuator [3]. In this investigation, smart foam actuators were constructed with the
PVDF film curved into a half cylinder form along the length of the actuator and is embedded in
two foam halves with a spray adhesive.
3.3 DISCUSSION OF RESULTS
3.3.1 Flat, Stiffened Panel Tests
A 4x4x4 controller configuration with four input channels (e.g., error sensors), four output
channels to drive four actuators and four reference sensors (except for the ideal reference) was
used for active control tests. The bandwidth of active control was kept in the frequency range of
200 – 630 Hz. The ideal reference, taken from the wide-band noise generator, was initially used
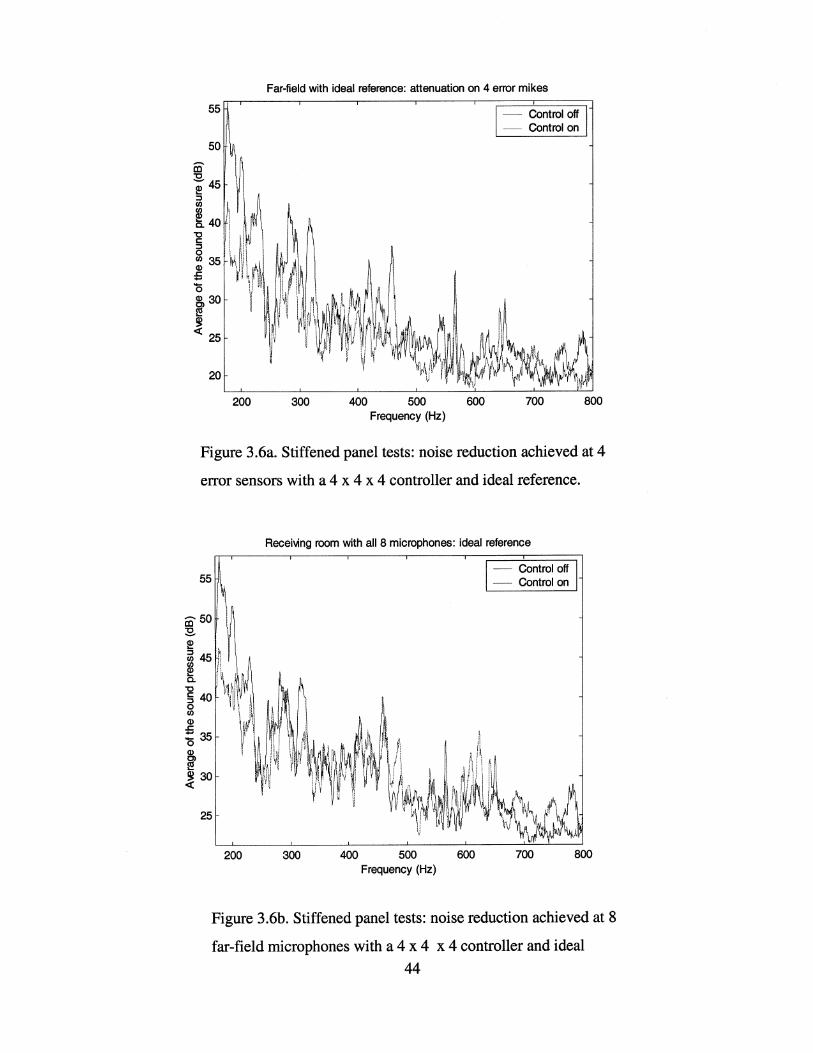
in the active control experiments. Figure 3.6a shows a comparison of the sound field measured at
4 error microphones for control on and off conditions. With the ideal reference, significant
reduction in the noise radiated by the double panel was achieved at the 4 error sensor locations.
The noise reduction, mostly between 200 – 500 Hz, achieved at eight far field monitoring
microphones is shown in Figure 3.6b.
A practical reference sensor scheme, which involved four accelerometers mounted on the
stiffened panel, was used with the 4 x 4 x 4 controller configuration. In this setup, significant
noise reduction in the frequency range of 200 – 700 Hz was achieved at 4 far-field control

37
microphone locations, see Figure 3.7a. The noise reduction at all eight monitoring microphones,
however, was confined to some of the peak pressures (Figure 3.7b).
In the next setup, four near-field microphones were used in place of far-field sensors. The
noise reduction achieved at four near-field error sensors is shown in Figure 3.8a, whereas the
noise reduction at eight far field monitoring microphone locations is illustrated in Figure 3.8b.
In the next configuration, four cavity microphones were used as reference sensors with the
same 4 x 4 x 4 controller configuration. Although significant noise reduction was achieved at
four cavity error microphones, as shown in Figure 3.9a, it did not result in any noise reduction at
eight far-field monitoring microphones (see Figure 3.9b).
In an effort to improve controller effectiveness, the control bandwidth was set in the
frequency range of 315 – 630 Hz. The noise reduction achieved at four far-field error
microphones for the case of four accelerometer reference sensors is shown in Figure 3.10. When
compared with Figure 3.7a, the noise reduction achieved at four error sensors improved
considerably due to a reduction in the control bandwidth.
These laboratory tests conducted on a double-panel system demonstrated that: (1) smart
foam actuators can provide global sound reductions of transmitted broadband noise, (2) feed-
forward control approach using realistic sensors (i.e., accelerometers) located on the base panel
can be used for broadband noise control for such systems, and (3) control voltages for smart
foam actuators were typically in the range of 30 – 50 V rms.
3.3.2 Fuselage Sidwall Tests
The flat, stiffened panel tests showed that the most effective strategy for broadband noise
reduction through double wall systems is to use a 4 x 4 x 4 controller configuration with
accelerometers mounted on the stiffened panel as error sensors. This approach was used in the
fuselage sidewall tests. The middle two frame bays of the757 sidewall section, shown in Figure
3.3, were used as the test area for active noise control. The outer two frames bays of the sidewall
section were treated with insulation, trim panel and two layers of mass fabric to reduce flanking
sound transmission through these sections.
Eight smart foam cells were placed on four sub-panels. The actuators were wired in pairs,
effectively making 4 control channels out of 8 smart foam actuators. The smart foam tests were

38
conducted in several steps. First, the effectiveness of controller configuration and reference
sensors on noise reduction was investigated on the fuselage sidewall without the trim panel. The
controller performance improved by increasing the number of system ID coefficients, number of
controller coefficients and sampling frequency.
In the first case, active control tests were conducted on the fuselage sidewall with the smart
foam actuators but without the trim panel. Three accelerometers on each of the sub-panels
provided the reference signals for the controller. A marked improvement in the noise reduction or
attenuation in the control bandwidth of 200 – 800 Hz was achieved with active control over the
error sensors (see Figure 3.11). Peak attenuations of greater than 10 dB and a total of 5 dB over
the bare panel were achieved.
The trim panel was then added to the sidewall. The noise reduction achieved with 4 x 4 x 4
controller is shown in Figure 3.12. The use of four accelerometers as reference sensors with four
coupled smart foam actuators resulted in about 7 – 10 dB noise reduction over the control
bandwidth of 200 –700 Hz (see Figure 3.11). Control voltages were typically 50 – 90 V rms for
the source levels described previously.
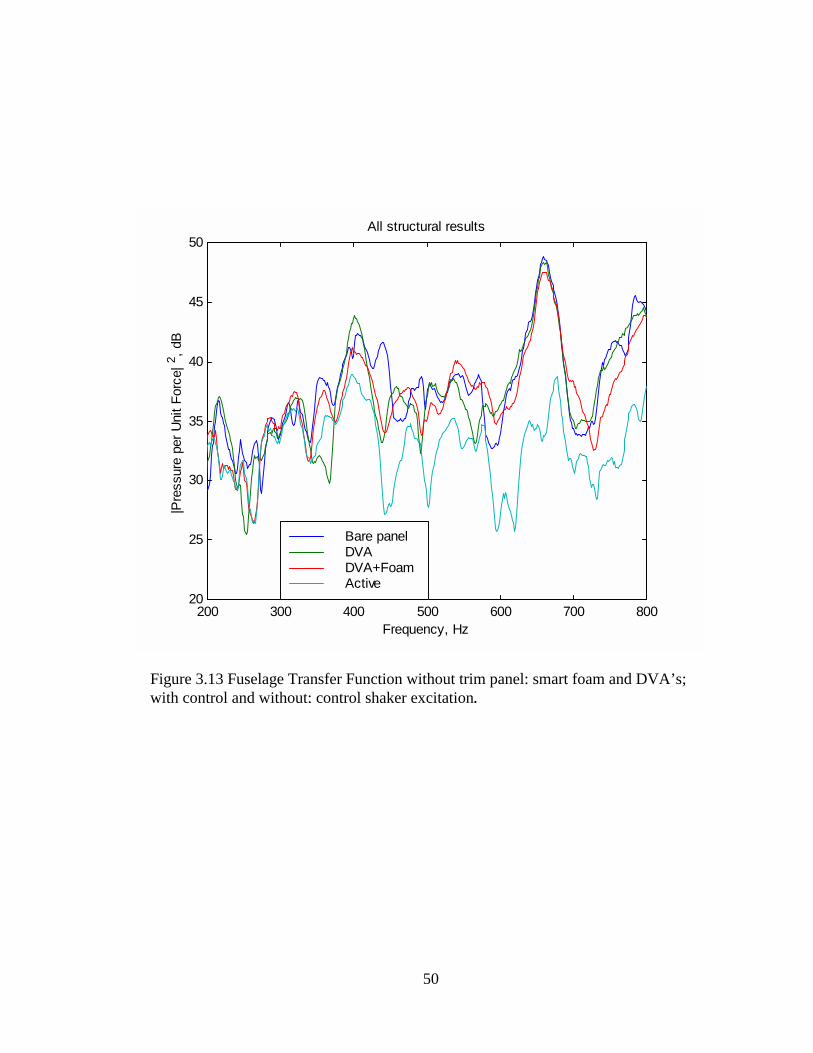
The results for structural excitation (e.g., shaker excitation) are summarized for comparison
purposes in Figure 3.13. Significant reductions in the averaged sound pressure levels were
achieved at control microphones, with a total reduction across the 200 to 800 Hz bandwidth of
6dbB. It is again evident that the smart foam/DVA treatment leads to significant active/passive
reduction in broadband radiated sound from the 757-fuselage panel.
3.4 CONCLUSIONS
Extensive laboratory tests were conducted on several configurations of active smart foam
actuators attached to a flat stiffened panel and a stiffened fuselage sidewall. The following
conclusions may be drawn based on these tests: (i) significant improvement in noise reduction of
the test panel and the 757 fuselage section were observed for both acoustic and structural
excitations due to active control with smart foam actuators, (ii) accelerometers on source plate
provide very good references for the controller, (iii) the 4 x 4 x 4 controller configuration was
effective for achieving significant reductions at error sensors, (iv) control strategies using far-
39
field microphones as error sensors lead to very good broadband attenuation, but more error
sensors/actuators would be needed to control the sound pressure over the entire receiving room at
high frequencies, (v) good attenuation at near-field microphones allows some attenuation at far-
field microphones, (vi) strategies using error microphones in cavities and accelerometers as
volume velocity sensors are not working well on the far-field attenuation at the present time;
further investigation are needed for those cases.

40
4 near field error mikes
8 Monitor mikes
i i i
4 Smart foam actuators
PanelNoise
source
Receiving
room
Source Room
3 Monitor mikes
i
Figure 3.1. Laboratory setup showing smart foam actuators, errorsensors and monitoring microphones.
Figure 3.2 Stiffened panel with four smart foam actuators.
Source
Fuselageskin
Trimpanel
Smart foamelements
Microphones
Accelerometers
ControllerSignal cond.and LP filter
LP filtersand Amps
Signal cond.and LP filters
Signal generator
Reference signalsfrom
microphones,accelerometers orsignal generator
Error signalsfrom
microphones oraccelerometers
Drivesignalsto smartfoam
Transmissiontest facility
Source roomReceiver room
Figure 3.3 Instrumentation layout.
41


250 300 350 400 450 500 550 600 650 700
20
25
30
35
40
Frequency (Hz)
Ave
rage
of t
he s
ound
pre
ssur
e (d
B)
Far-field with real reference: attenuation on 4 error mikes
Control offControl on
Figure 3.7a. Stiffened panel tests: noise reduction achieved at 4 error
sensors with a 4 x 4 x 4 controller and accelerometer reference sensors
200 300 400 500 600 700 800
24
26
28
30
32
34
36
38
40
42
44
Frequency (Hz)
Ave
rage
of t
he s
ound
pre
ssur
e (d
B)
Receiving room with all 8 microphones
Control offControl on
Figure 3.7b. Stiffened panel tests: noise reduction achieved at 8 far-field monitoring
microphones with a 4 x 4 x 4 controller and accelerometer reference sensors.
45

200 300 400 500 600 700 800
25
30
35
40
45
50
Frequency (Hz)
Ave
rage
of t
he s
ound
pre
ssur
e (d
B)
Near-field control: attenuation on the 4 near-field mikes
Control offControl on
Fi
w
Figure 3.8a. Stiffened panel tests: noise reduction achieved at 4 error microphones
with a 4 x 4 x 4 controller and near-field microphone reference sensors.
46
200 300 400 500 600 700 800
25
30
35
40
45
Frequency (Hz)
Ave
rage
of t
he s
ound
pre
ssur
e (d
B)
Near-field control: effect on the far-field
Control offControl on
gure 3.8b. Stiffened panel tests: noise reduction achieved at 8 far-field microphones
ith a 4 x 4 x 4 controller and near-field microphone reference sensors.

200 300 400 500 600 700 800
25
30
35
40
45
50
Frequency (Hz)
Ave
rage
of t
he s
ound
pre
ssur
e (d
B)
Cavity control: effect on the far-field
Control offControl on
Figure 3.9a. Stiffened panel tests: noise reduction achieved at 4 error sensors
with a 4 x 4 x 4 controller and cavity microphones as reference sensors.
200 300 400 500 600 700 800
25
30
35
40
45
50
Frequency (Hz)
Ave
rage
of t
he s
ound
pre
ssur
e (d
B)
Cavity control: effect on the far-field
Control offControl on
Figure 3.9b. Stiffened panel tests: noise reduction achieved at far-field microphones with
a 4 x 4 x 4 controller and cavity microphones as reference sensors.
47

250 300 350 400 450 500 550 600 650 700
20
25
30
35
40
Frequency (Hz)
Ave
rage
of t
he s
ound
pre
ssur
e (d
B)
Far-field with real reference: attenuation on 4 error mikes
Control offControl on
Figure 3.10. Stiffened panel tests: noise reduction achieved at 4 error sensors
with a 4 x 4 x 4 controller and accelerometer sensors as reference sensors –
reduced control bandwidth.
48

200 300 400 500 600 700 800
0
5
10
15
20
25
30
Noi
seR
educ
tion
Frequency, Hz
Figu
Figure 3.11. Noise Reduction comparison without trim panel in place, acousticexcitation.
49
200 300 400 500 600 700 8000
5
10
15
20
25
30
Noi
se R
educ
tion,
dB
Frequency, Hz
Bare panel
trim & passive
Active & passive with trim
re 3.12 Noise Reduction comparison with trim panel in place, acoustic excitation.
50
200 300 400 500 600 700 80020
25
30
35
40
45
50
Frequency, Hz
|Pre
ssur
e pe
r U
nit
For
ce|
2 , dB
All structural results
Bare panelDVADVA+FoamActive
Figure 3.13 Fuselage Transfer Function without trim panel: smart foam and DVA’s;with control and without; control shaker excitation.

51
4. SMART FOAM SYSTEM DESIGN FOR FLIGHT TESTING
The previous work demonstrated the potential of the smart foam and DVA system for
providing significant increases in aircraft panel transmission losses in the 300 to 1000 Hz
bandwidth in a lightweight, conformal configuration. The tests, however, also established some
of the limitations of the present active control arrangement. Although the DSP system used was
quite powerful, the controller was limited to a four-reference, four-actuator, four-error sensor
system. Thus the area to be treated is limited to four smart foam elements. In practice treating
large areas of the aircraft fuselage will require many smart foam elements in a nearly continuous
layer. It is not cost effective to keep increasing the DSP power and CPU so that higher order
systems could be used. In addition the use of error sensors in the far-field are not practical since
they lead to cross-coupling between the active smart foam elements, and installation is difficult.
Thus an alternative, more realistic configuration was studied. This system was based upon earlier
work performed at Virgina Tech under NASA funding in which multiple de-coupled control
elements were used instead of a fully coupled system.
Figure 4.1 shows a schematic arrangement of the uncoupled control system. In this case
reference sensors are located under each smart foam element. The reference sensor signal is
passed through a single adaptive filter and fed to the smart foam element. A near-field
microphone array is located above each smart foam element and used to converge the adaptive
filter using a SISO LMS algorithm. In order to decouple the smart foam element from the
neighboring noise and control fields, special sensor configurations have to be used. The reference
and error sensor arrays consist of a ring of three accelerometers and microphones respectively.
This sensor configuration has maximum sensitivity at its center and reduced sensitivity to waves
travelling towards the array from outside its sensor circle. The sensor configuration thus allows
reduction of noise local to each smart foam element and rejection of non-local information. Each
smart foam element thus consists of a reference sensor, a SISO feedforward controller and an
error sensor all integrated into a treatment package. Such smart foam elements would then easily
be located in the fuselage in a nearly continuous layer of multiple elements. In addition since the
controller is SISO, the DSP requirements are very small and a cost-effective electronic unit with

52
integrated DSP and power electronics could be constructed. Such electronics are presently under
construction in the Structural Acoustics Branch at NASA Langley.
A laboratory test was performed on the 757 sidewall in the INTF to validate the above
concept. Figure 4.2 shows a picture of two SISO uncoupled smart foam control systems located
at the floor level. In this case two smart foam elements are hard-wired together to act as one
control actuator. Figure 4.2 shows a close up of one of the SISO smart foam systems. The error
sensor array is shown and consists of three microphones located on a circle at three inches above
the smart foam surface. The reference sensor consists of three accelerometers located on a circle
on the sub-panel under the two smart foam elements (which are wired together as one control
channel).
Figure 4.3 shows the performance of the system versus frequency. For comparison the fully
coupled LMS control is also shown and achieves about 8dB sound reduction from 300 to 750Hz.
The two uncoupled SISO loops achieve nearly similar reductions of about 7dB across 300 to 750
Hz. Thus comparable performance is achieved in a cost-effective and much less complex
arrangement with sensors integrated near the smart foam surface.
The results thus validate the proposed flight test system. Work tasks that remain to be done
on this concept before the flight test can occur are: (1) develop the SISO DSP and power
electronics; (2) program the SISO feedforward adaptive controller; (3) develop practical
reference and error sensor arrays; and (4) validate the SISO uncoupled approach over an
extended fuselage area with multiple smart foam elements.

53
Figure 4.2 Two SISO smart foam systems installed in test rig
Single Channel Controller
Active Foam
ShapedReference Sensor
Near FieldMicrophone Array
Vibrating Structure
Active Foam
Single Channel Controller
Single Channel Controller
Active Foam
ShapedReference Sensor
Near FieldMicrophone Array
Vibrating Structure
Active Foam
Single Channel Controller
Figure 4.1 Schematic arrangement of uncoupled SISO control approach

54
Figure 4.3 Close up of SISO error array.
1000
Figure 4.4 Performance comparison of a SISO uncoupled control approach vs a coupledapproach.
300 400 500 600 700 800 900
-40
-30
-20
-10
0
10
20
Frequency, Hz
Sum
of
Squa
red
Erro
rs, d
B
No control
Coupled, 8dB
Uncoupled, 7dB

55
5. CONCLUSIONS AND RECOMMENDATIONS
This report summarizes the results of investigations conducted by the Boeing Company in
2000-2001 under two subtasks of Task 14, “Structural Acoustic Prediction and Interior Noise
Control Technology,” of Contract NAS1-97040. One of the subtasks involved development of a
finite-element based prediction tool for double-wall panel systems with poro-elastic smart foam
and validation of the model with test data, while the other subtask involved experimental
evaluations of smart foam treatment for broad band noise control. The following conclusions
and recommendations can be made based on the analytical and experimental investigations
conducted.
(1) A 3-diemnsional finite element code was developed for modeling a smart foam noise
control treatment for an aircraft sidewall section. A step-by-step process was used to build the
smart foam finite element code from individual medium elements to multiple coupled interface
matrices, along with the corresponding intermediate validations. The FE code can be used to
predict surface impedance of the poro-elastic foam, cavity pressures and structural responses, to
determine sound absorption coefficients of multiple media coupled systems, and to calculate
sound transmission loss of a double-panel with different foam-lined configurations.
(2) Extensive laboratory tests were conducted on several configurations of passive and
active smart foam actuators attached to a stiffened flat panel and a stiffened 757-sidewall section.
The following conclusions may be drawn from these tests: (i) significant improvement in noise
reduction of the test panel and the fuselage section were observed for both acoustic and structural
excitations due to active control with smart foam actuators, (ii) accelerometers on the source
plate provide very good references for the controller, (iii) the 4 x 4 x 4 controller configuration
was effective for achieving significant reductions at error sensors, (iv) control strategies using
far-field microphones as error sensors lead to very good broadband attenuation, but more error
sensors/actuators would be needed to control the sound pressure over the entire receiving room at
high frequencies, (v) good attenuation at near-field microphones allows some attenuation at far-
field microphones, (vi) strategies using error microphones in cavities and accelerometers as
volume velocity sensors are not working well on the far-field attenuation at the present time;
further investigation are needed for those cases.

56
(3) Based on the good noise reductions obtained with the smart foam actuator configuration
used in the 757-sidewall tests, it is recommended that a similar smart foam configuration be used
in upcoming 757 flight tests. However, the overall system design can be improved by adopting
an uncoupled approach using multiple SISO smart foam systems instead of the 4x4x4 coupled
smart foam system used in the lab tests. Further development and validation of the system
electronics, controller algorithms, and sensor arrays is recommended before this smart foam
treatment package is installed on the 757 aircraft.

57
6.0 REFERENCES
[1] “Control of aircraft interior broadband noise with foam-PVDF smart skin,” C. Guigou and C.
R. Fuller, Journal of Sound and Vibration, 220(3), pp. 541-557, 1999
[2] “Control of the noise radiated by a plate using a distributed active vibration absorber
(DAVA),” P. Marcotte, C. R. Fuller and P. Cambou, Proceedings of Active 99, Fort Lauderdale,
FL, USA,1999
[3] “A study of smart foam for noise control applications,” Cassandra A. Gentry-Grace, Ph.D.
thesis, Mechanical Engineering Dept., Virginia Polytechnic Institute & State University, 1998
[4] “The theory of propagation of elastic waves in a fluid-saturated porous solid. I Low frequency
range,” M. A. Biot, J. Acoust. Soc. Am. 28, 168-191, 1956
[5] “An efficient finite element scheme for solving the three-dimensional poroelasticity problem
in acoustics,” R. Panneton and N. Atalla, J. Acoust. Soc. Am. 101 (6), 3287-3298, 1997
[6] “A finite element method for determining the acoustic modes of irregular shaped cavity,” M.
Petyt, Journal of Sound and Vibration, 45(4), pp. 495-502, 1976
[7] “Introduction to finite element vibration analysis,” Maurice Petyt, Cambridge
University Pres, 1990
[8] “Finite element modeling of isotropic elastic porous materials coupled with acoustical finite
elements,” Y. J. Kang and J. S. Bolton, J. Acoust. Soc. Am. 98 (1), 635-643, 1995
[9] “Numerical prediction of sound transmission through finite multilayer systems with
poroelastic materials,” R. Panneton and N. Atalla, J. Acoust. Soc. Am. 100 (1), 346-354, 1996
[10] “Propagation of sound in porous media: Modelling sound absorbing materials,” Elsevier,
New York, 1993
58
[11] “Smart Foam for Active Control of Sound,” Bolton, J. S. and Green, E. R., Second
Conference on Recent Advances in Active Control of Sound and Vibration, Blacksburg, VA,
139-149, 1993
[12] “Control of Sound Radiation/Reflection with Adaptive Foams,” Fuller, C. R., Bronzel, M.
J., Gentry, C. A. and Whitington, D. E., Proc. Noise-Con 94, May 1994.
[13] “Smart Foam for Applications in Passive/Active Noise Reduction Control,” Gentry, C. A.,
Guigou, C and Fuller, C. R., Journal Acoust. Soc. Am., 10(4), 1771-1778, 1997.
[14] “Smart Foam Lines Trim Panels for Aircraft Cabin Noise Control,” Mathur, G. P., Fuller, C.
R., Johnson, M. E., and D’Angelo, J, Paper presented at the 6th AIAA/CEAS Aeroacoustics
Conference, Lahaina, Hawaii, 12 – 1, 4 June 2000.

59
Appendix A
1. Stiffness and mass matrices for poroelastic element
dVNNM eu
euss
T
][][][ 11∑∫= ρ
dVNNM eU
eusf
T
][][][ 12∑∫= ρ
dVNNM eU
eUff
T
][][][ 22∑∫= ρ
dVBDBK eUs
euss
T
][][][][ ∑∫=
dVBDBK eUsf
eusf
T
][)]([][)]([ ∑∫= ωω
dVBDBK eUf
eUff
T
][)]([][)]([ ∑∫= ωω
dVBbNC eu
euss
T
][)(][][ ∑∫= ω
dVBbNC eU
eusf
T
][)(][][ ∑∫= ω
dVBbNC eU
eUff
T
][)(][][ ∑∫= ω
dSfhfNF ne
us
T∑∫ −= }){}({][][
dSfhNF ne
Uf
T∑∫= }){][][

60
where eu
eu NLB ]][[][ = and e
Ue
U NLB ]][[][ =
2, Stiffness and mass matrices for acoustic element
dVBBK ea
eaa
T
][][][ ∑∫=
[ ] iaa N
z
y
x
B
∂∂∂∂∂∂
=
dVNNM ea
eaa
T
][][][ ∑∫=

REPORT DOCUMENTATION PAGE Form ApprovedOMB No. 0704-0188
Public reporting burden for this collection of information is estimated to average 1 hour per response, including the time for reviewing instructions, searching existing datasources, gathering and maintaining the data needed, and completing and reviewing the collection of information. Send comments regarding this burden estimate or any otheraspect of this collection of information, including suggestions for reducing this burden, to Washington Headquarters Services, Directorate for Information Operations andReports, 1215 Jefferson Davis Highway, Suite 1204, Arlington, VA 22202-4302, and to the Office of Management and Budget, Paperwork Reduction Project (0704-0188),Washington, DC 20503.1. AGENCY USE ONLY (Leave blank) 2. REPORT DATE
November 20013. REPORT TYPE AND DATES COVERED
Contractor Report4. TITLE AND SUBTITLE
Structural Acoustic Prediction and Interior Noise Control Technology5. FUNDING NUMBERS
C NAS1-97040TA 14
6. AUTHOR(S)
G. P. Mathur, C. L. Chin, M. A. Simpson, and J. T. LeeWU 706-81-14-01
7. PERFORMING ORGANIZATION NAME(S) AND ADDRESS(ES)
The Boeing Company Long Beach, CA 90807
8. PERFORMING ORGANIZATIONREPORT NUMBER
9. SPONSORING/MONITORING AGENCY NAME(S) AND ADDRESS(ES)
National Aeronautics and Space AdministrationLangley Research CenterHampton, VA 23681-2199
10. SPONSORING/MONITORINGAGENCY REPORT NUMBER
NASA/CR-2001-211247
11. SUPPLEMENTARY NOTES
Langley Technical Monitor: Daniel L. Palumbo
12a. DISTRIBUTION/AVAILABILITY STATEMENT
Unclassified-UnlimitedSubject Category 71 Distribution: NonstandardAvailability: NASA CASI (301) 621-0390
12b. DISTRIBUTION CODE
13. ABSTRACT (Maximum 200 words)
This report documents the results of Task 14, "Structural Acoustic Prediction and Interior Noise ControlTechnology" of Contract NAS1-97040 with The Boeing Company. The task was to evaluate the performance oftuned foam elements (termed Smart Foam) both analytically and experimentally. Results taken from a three-dimensional finite element model of an active, tuned foam element are presented. Measurements of soundabsorption and sound transmission loss were taken using the model. These results agree well with publisheddata. Experimental performance data were taken in Boeing's Interior Noise Test Facility where 12 smart foamelements were applied to a 757 sidewall. Several configurations were tested. Noise reductions of 5-10 dB wereachieved over the 200-800 Hz bandwidth of the controller. Accelerometers mounted on the panel provided agood reference for the controller. Configurations with far-field error microphones outperformed near-fieldcases.
14. SUBJECT TERMS
Aircraft Interior Noise; Active/Passive Noise Control; Smart Foam; Finite15. NUMBER OF PAGES
70Element Model 16. PRICE CODE
A0417. SECURITY CLASSIFICATION
OF REPORT
Unclassified
18. SECURITY CLASSIFICATIONOF THIS PAGE
Unclassified
19. SECURITY CLASSIFICATION OF ABSTRACT
Unclassified
20. LIMITATION OF ABSTRACT
UL
NSN 7540-01-280-5500 Standard Form 298 (Rev. 2-89)Prescribed by ANSI Std. Z-39-18298-102