Strongly Correlated Superconductivity G. Kotliar Physics Department and Center for Materials Theory...
77
Strongly Correlated Superconductivity G. Kotliar Physics Department and Center for Materials Theory Rutgers
-
date post
19-Dec-2015 -
Category
Documents
-
view
222 -
download
0
Transcript of Strongly Correlated Superconductivity G. Kotliar Physics Department and Center for Materials Theory...

Strongly Correlated Superconductivity
G. KotliarPhysics Department and Center for
Materials TheoryRutgers

• Cluster Dynamical Mean Field Theory . Plaquette as Reference Frame.
• Mott transition and Superconductivity [Anderson RVB]
• The Mott transition in the actinide series. Strongly Correlated Superconductivity in Am ?
o Model for kappa organics. [O. Parcollet, G. Biroli and G. Kotliar PRL, 92, 226402. (2004)) ]
o Model for cuprates [ M. Civelli [ Rutgers] Ph.D ThesisO. Parcollet (Saclay), M. Capone (U. Rome) V. Kancharla (Sherbrooke) GK(2005). PRL in press.
• Cluster Dynamical Mean Field Theories a Strong Coupling Perspective. T. Stanescu and G. Kotliar (in preparation 2005)
• Work on Am and Pu S. Savrasov K. Haule and GK.
References

RVB phase diagram of the Cuprate Superconductors
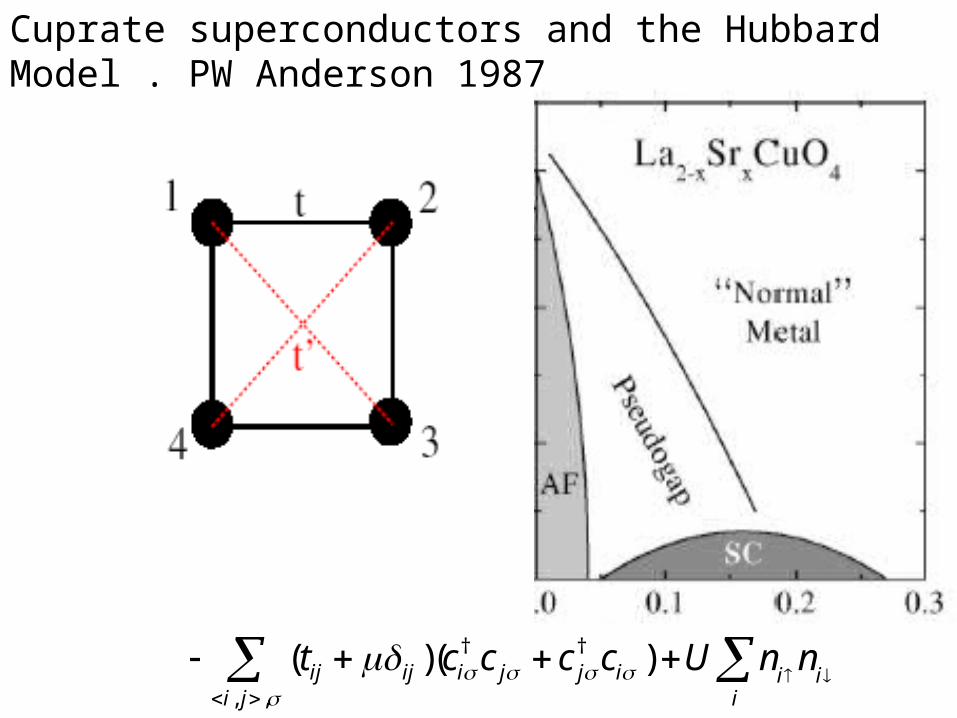
• P.W. Anderson. Connection between high Tc and Mott physics. Science 235, 1196 (1987)
• Connection between the anomalous normal state of a doped Mott insulator and high Tc.
• Slave boson approach. <b> coherence order parameter. singlet formation order parameters.Baskaran Zhou Anderson (1987)

RVB phase diagram of the Cuprate Superconductors. Superexchange.
• The approach to the Mott insulator renormalizes the kinetic energy Trvb increases.
• The proximity to the Mott insulator reduce the charge stiffness , TBE goes to zero.
• Superconducting dome. Pseudogap evolves continously into the superconducting state.
G. Kotliar and J. Liu Phys.Rev. B 38,5412 (1988)
Related approach using wave functions:T. M. Rice group. Zhang et. al. Supercond Scie Tech 1, 36 (1998, Gross Joynt and Rice (1986) M. Randeria
N. Trivedi , A. Paramenkanti PRL 87, 217002 (2001)

Problems (or non problems) with the approach.
• Neel order
• Stability of the pseudogap state at finite temperature. [Ubbens and Lee]
• Missing incoherent spectra . [ fluctuations of slave bosons ]
• Dynamical Mean Field Methods are ideal to remove address these difficulties.

T/W
Phase diagram of a Hubbard model with partial frustration at integer filling. M. Rozenberg et.al., Phys. Rev. Lett. 75, 105-108 (1995). .
COHERENCE INCOHERENCE CROSSOVER


Impurity Model-----Lattice Model
Weiss Field

Focus of this work
• Generalize and extend these early mean field approaches to systems near the Mott transition.
• Obtain the solution of the 2X 2 plaquette and gain physical understanding of the different CDMFT states.
• Even if the results are changed by going to larger clusters, the short range physics is
general and will teach us important lessons. Follow states as a function of parameters. Adiabatic continuity. Furthermore the results can be stabilized by adding further interactions.
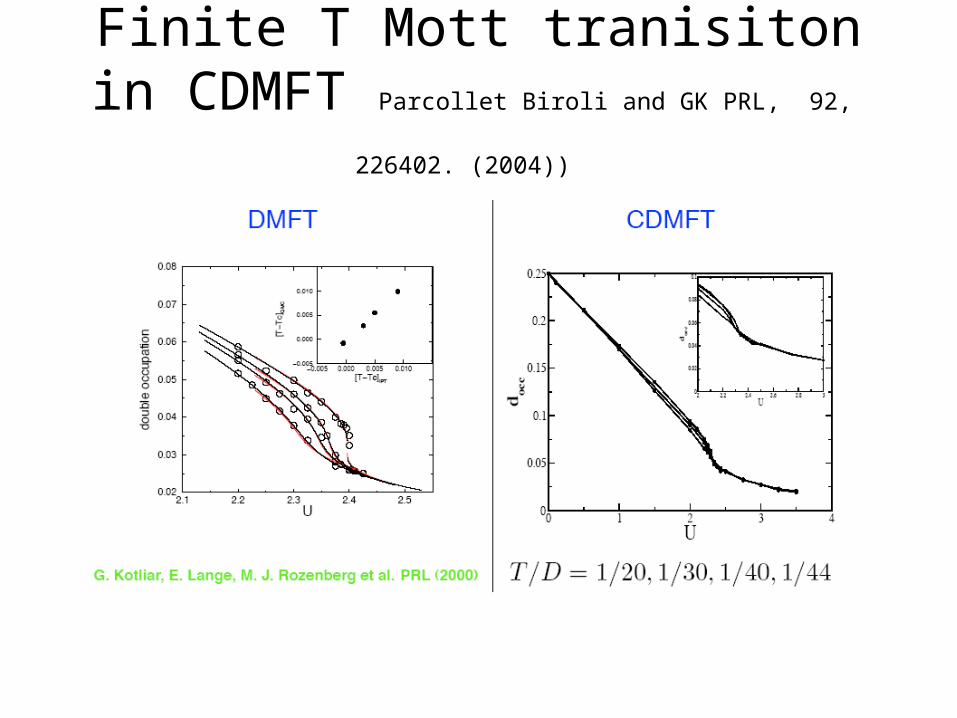
Finite T Mott tranisiton in CDMFT Parcollet Biroli and GK PRL, 92, 226402. (2004))
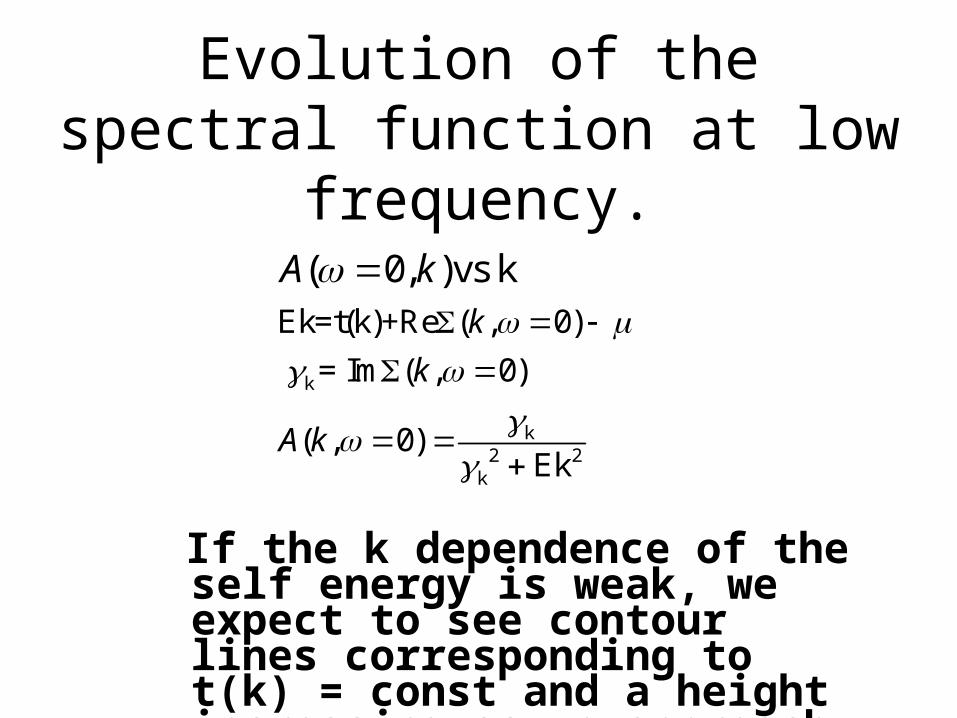
Evolution of the spectral function at low frequency.
( 0, )vs k A k
If the k dependence of the self energy is weak, we expect to see contour lines corresponding to t(k) = const and a height increasing as we approach the Fermi surface.
k
k2 2
k
Ek=t(k)+Re ( , 0)
= Im ( , 0)
( , 0)Ek
k
k
A k

Evolution of the k resolved Spectral Function at zero frequency. (QMC
study Parcollet Biroli and GK PRL, 92, 226402. (2004)) ) ( 0, )vs k A k
Uc=2.35+-.05, Tc/D=1/44. Tmott~.01 W
U/D=2 U/D=2.25

Momentum Space Differentiation the high
temperature story T/W=1/88

Physical Interpretation• Momentum space differentiation. The Fermi liquid –Bad
Metal, and the Bad Insulator - Mott Insulator regime are realized in two different regions of momentum space.
• Cluster of impurities can have different characteristic temperatures. Coherence along the diagonal incoherence along x and y directions.
• Connection with slaveBoson theory divergence ofSigma13 . Connections withRVB (Schmalian and Trivedi)
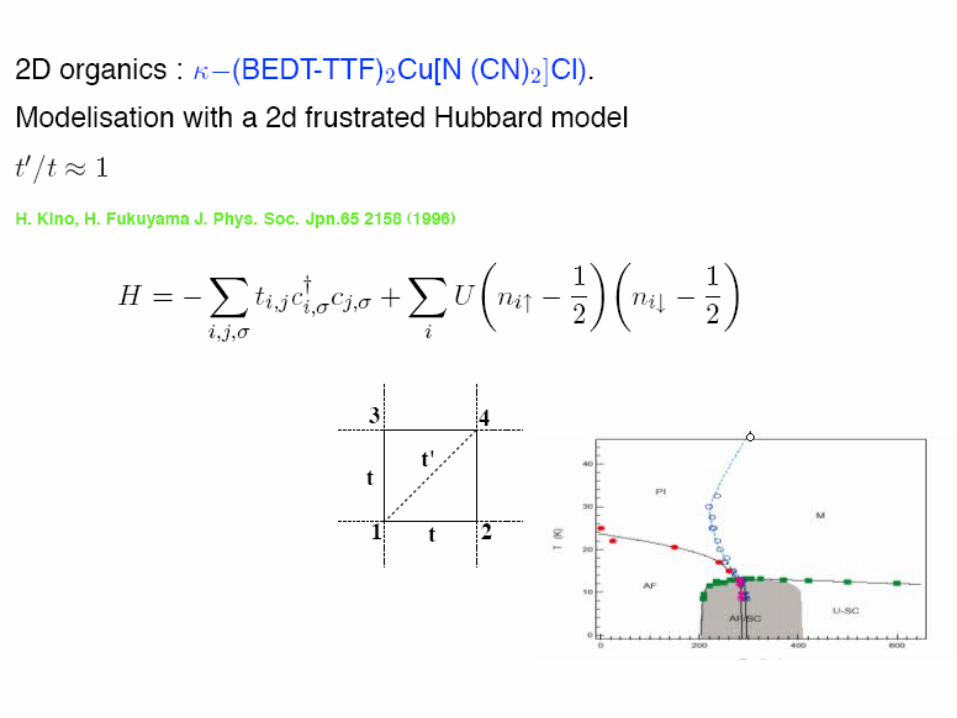
† †
, ,
( )( )ij ij i j j i i ii j i
t c c c c U n n
Cuprate superconductors and the Hubbard Model . PW Anderson 1987

.
• Allows the investigation of the normal state underlying the superconducting state, by forcing a symmetric Weiss function, we can follow the normal state near the Mott transition.
• Earlier studies (Katsnelson and Lichtenstein, M. Jarrell, M Hettler et. al. Phys. Rev. B 58, 7475 (1998). T. Maier et. al. Phys. Rev. Lett
85, 1524 (2000) ) used QMC as an impurity solver and DCA as cluster scheme.
• We use exact diag ( Krauth Caffarel 1995 with effective temperature 32/t=124/D ) as a solver and Cellular DMFT as the mean field scheme.
CDMFT study of cuprates

Superconducting State t’=0
• Does the Hubbard model superconduct ?
• Is there a superconducting dome ?
• Does the superconductivity scale with J ?

Superconductivity in the Hubbard model role of the Mott transition and influence of the super-
exchange. ( work with M. Capone V. Kancharla. CDMFT+ED, 4+ 8 sites t’=0) .
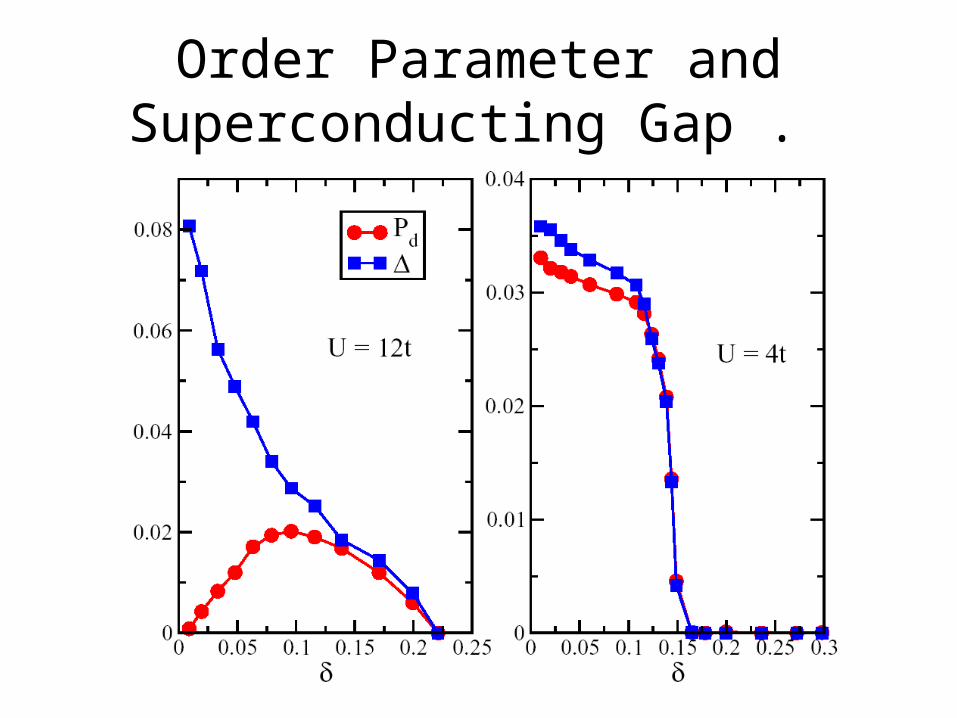
Order Parameter and Superconducting Gap .
• In BCS theory the order parameter is tied to the superconducting gap. This is seen at U=4t, but not at large U.
• How is superconductivity destroyed as one
approaches half filling ?

• The superconductivity scales
with J, as in the RVB approach.
Qualitative difference between large and small U. The superconductivity goes to zero at half filling ONLY above the Mott transition.

Superconducting State t’=0
• Does it superconduct ?
• Yes. Unless there is a competing phase.
• Is there a superconducting dome ?
• Yes. Provided U /W is above the Mott transition .
• Does the superconductivity scale with J ?
• Yes. Provided U /W is above the Mott transition .

D wave Superconductivity and Antiferromagnetism t’=0 M. Capone V. Kancharla (see also VCPT Senechal and
Tremblay ). Antiferromagnetic (left) and d wave superconductor (right) Order Parameters

•Can we connect the superconducting state with the “underlying “normal” state “ ?
What does the underlying “normal” state look like ?
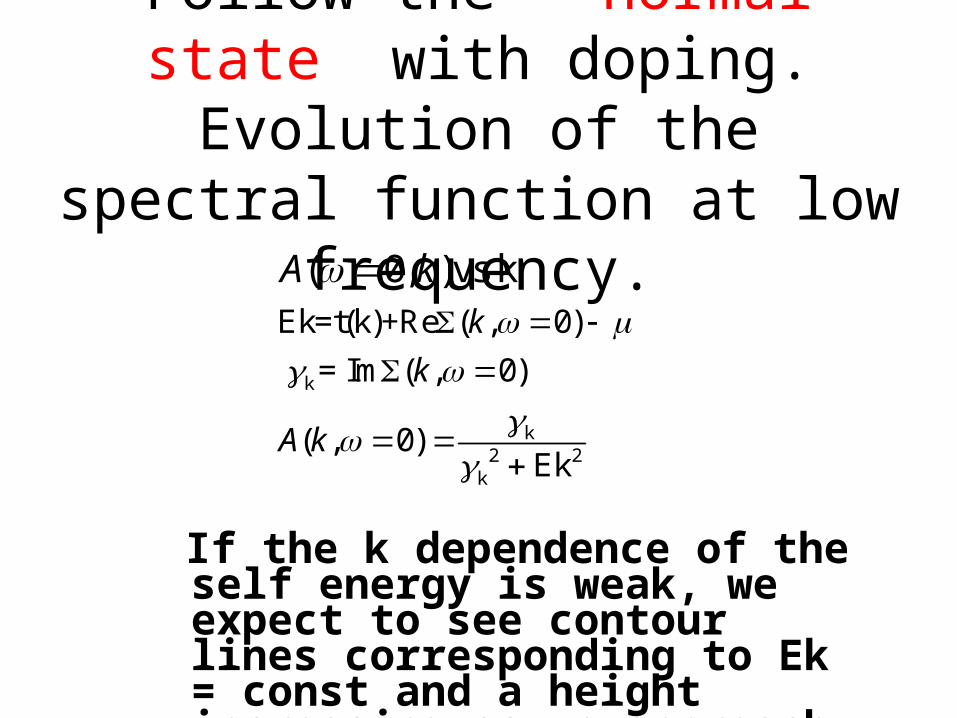
Follow the “normal state” with doping. Evolution of the spectral
function at low frequency.( 0, )vs k A k
If the k dependence of the self energy is weak, we expect to see contour lines corresponding to Ek = const and a height increasing as we approach the Fermi surface.
k
k2 2
k
Ek=t(k)+Re ( , 0)
= Im ( , 0)
( , 0)Ek
k
k
A k

: Spectral Function A(k,ω→0)= -1/π G(k, ω →0) vs k U=16 t
hole doped
K.M. Shen et.al. 2004
2X2 CDMFT
Approaching the Mott transition: CDMFT Picture
• Fermi Surface Breakup. Qualitative effect, momentum space differentiation. Formation of hot –cold regions is an unavoidable consequence of the approach to the Mott insulating state!
• D wave gapping of the single particle spectra as the Mott transition is approached.
• Similar scenario was encountered in previous study of the kappa organics. O Parcollet G. Biroli and G. Kotliar PRL, 92, 226402. (2004) .
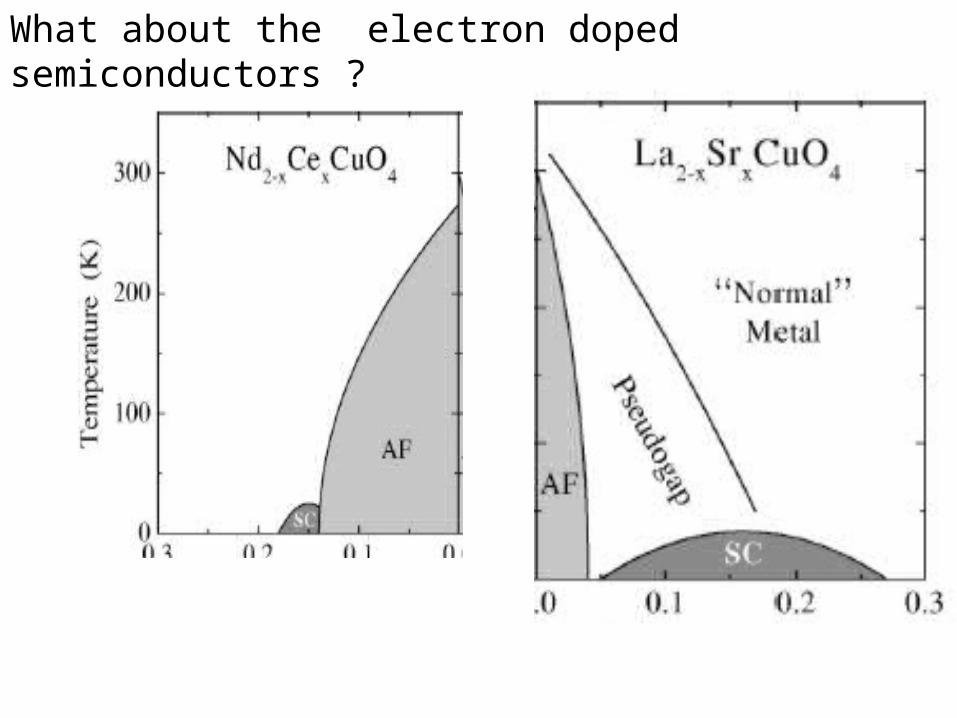
What about the electron doped semiconductors ?

Spectral Function A(k,ω→0)= -1/π G(k, ω →0) vs k
electron doped
P. Armitage et.al. 2001
Civelli et.al. 2004
Momentum space differentiation a we approach the Mott
transition is a generic phenomena.
Location of cold and hot regions depend on parameters.

o Qualitative Difference between the hole doped and the electron doped phase diagram is due to the underlying normal state.” In the hole doped, it has nodal quasiparticles near (,/2) which are ready “to become the superconducting quasiparticles”. Therefore the superconducing state can evolve continuously to the normal state. The superconductivity can appear at very small doping.
o Electron doped case, has in the underlying normal state quasiparticles leave in the ( 0) region, there is no direct road to the superconducting state (or at least the road is tortuous) since the latter has QP at (/2, /2).

Can we connect the superconducting state with the “underlying “normal” state “ ?
Yes, within our resolution in the hole doped case.
No in the electron doped case.
What does the underlying “normal state “ look like ? Unusual distribution of spectra (Fermi arcs) in the normal
state.

To test if the formation of the hot and cold regions is the result of the
proximity to Antiferromagnetism, we studied various values of t’/t, U=16.

Introduce much larger frustration: t’=.9t U=16t
n=.69 .92 .96

Approaching the Mott transition:
• Qualitative effect, momentum space differentiation. Formation of hot –cold regions is an unavoidable consequence of the approach to the Mott insulating state!
• General phenomena, but the location of the cold regions depends on parameters.
• With the present resolution, t’ =.9 and .3 are similar. However it is perfectly possible that at lower energies further refinements and differentiation will result from the proximity to different ordered states.
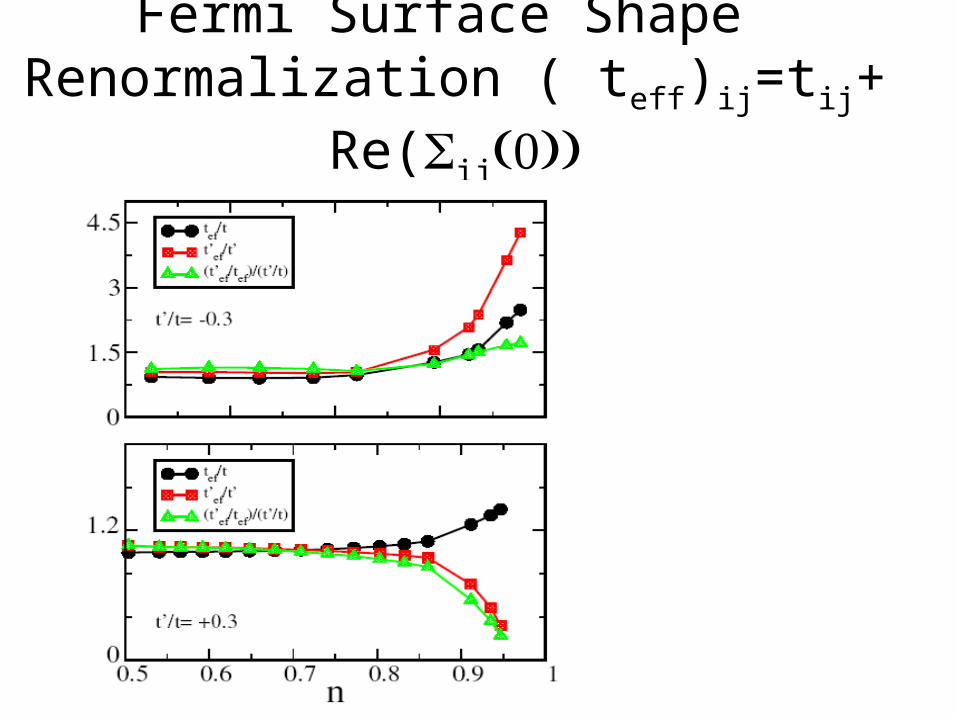
Fermi Surface Shape Renormalization ( teff)ij=tij+ Re(ij
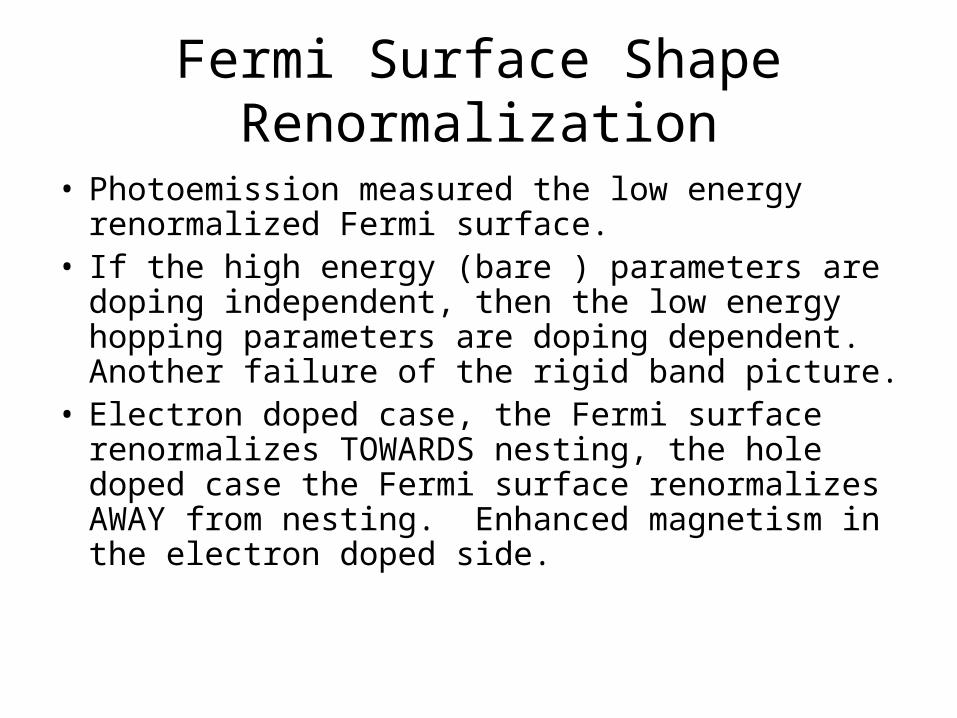
Fermi Surface Shape Renormalization
• Photoemission measured the low energy renormalized Fermi surface.
• If the high energy (bare ) parameters are doping independent, then the low energy hopping parameters are doping dependent. Another failure of the rigid band picture.
• Electron doped case, the Fermi surface renormalizes TOWARDS nesting, the hole doped case the Fermi surface renormalizes AWAY from nesting. Enhanced magnetism in the electron doped side.

Understanding the location of the hot and cold regions. Interplay of
lifetime and fermi surface.

Large Doping

Small Doping

How is the Mott insulatorapproached from the
superconducting state ?
Work in collaboration with M. Capone, see also V. Kancharla’s talk.

Superconductivity is destroyed by transfer of spectral weight.
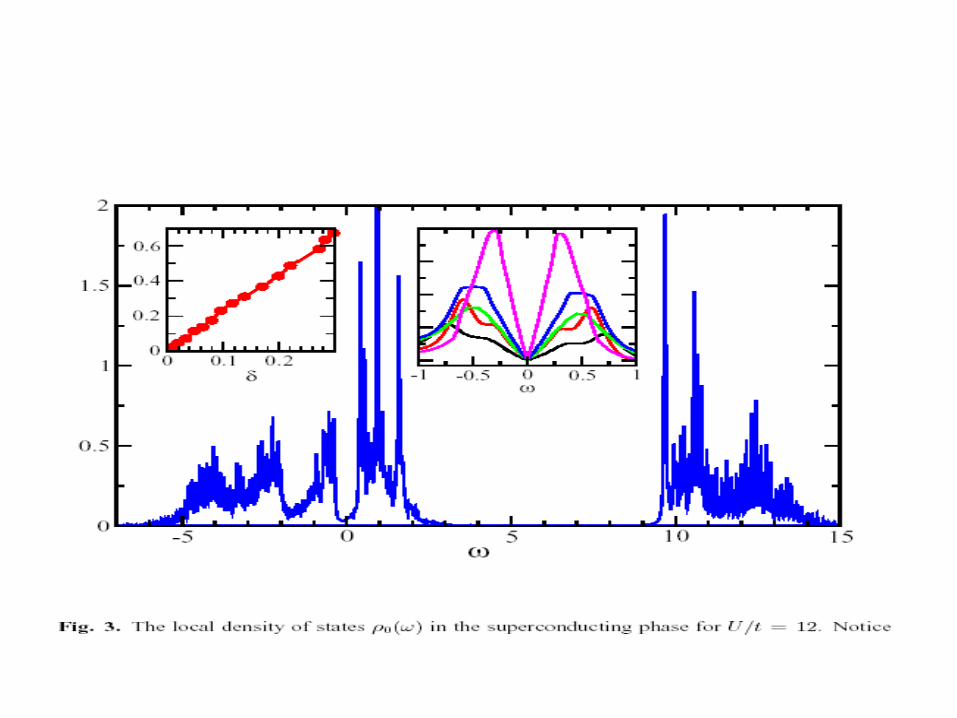

Evolution of the low energy tunneling density of state with doping. Decrease of spectral weight
as the insulator is approached.

• Superconductivity is destroyed at half filling due to a reduction of the one electron weight. Just like in the slave boson.
• High energy ph asymmetry.
• Low energy ph symmetry.
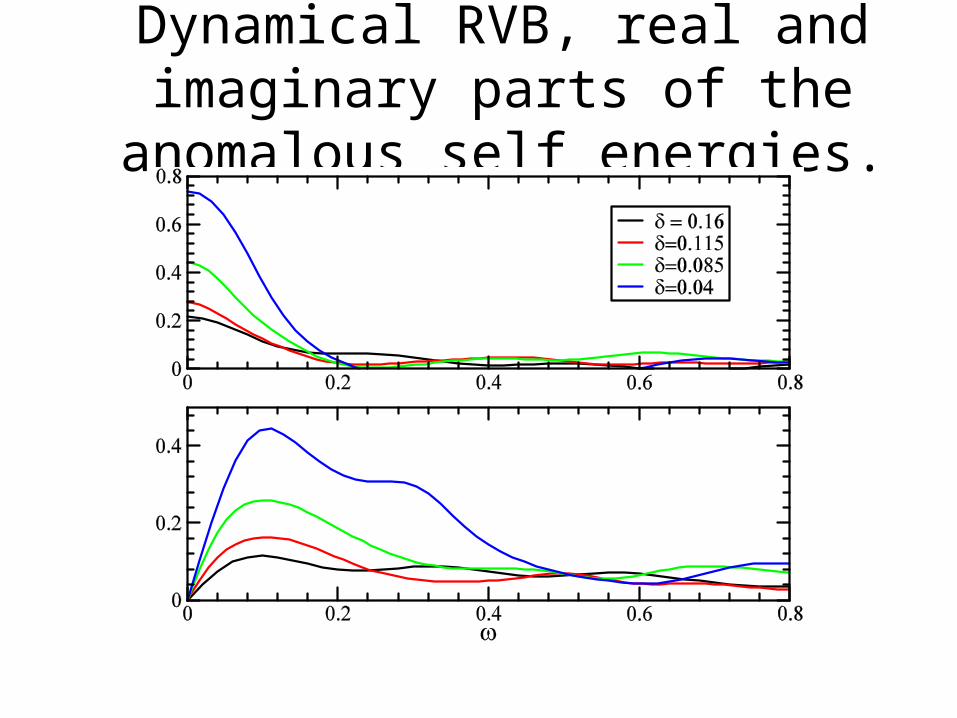
Dynamical RVB, real and imaginary parts of the anomalous self energies.

• DMFT is a useful mean field tool to study correlated electrons. Provide a zeroth order picture of a physical phenomena.
• Provide a link between a simple system (“mean field reference frame”) and the physical system of interest. [Sites, Links, and Plaquettes]
• Formulate the problem in terms of local quantities (which we can usually compute better).
• Allows to perform quantitative studies and predictions . Focus on the discrepancies between experiments and mean field predictions.
• Generate useful language and concepts. Follow mean field states as a function of parameters.
• K dependence gets strong as we approach the Mott transition. Fermi surfaces and lines of zeros of G.
Conclusions

Conclusions
• Qualitative effect, momentum space differentiation. Formation of hot –cold regions is an unavoidable consequence of the approach to the Mott insulating state!
• General phenomena, but the location of the cold regions depends on parameters. Study the “normal state” of the Hubbard model is useful.
• Character of the superconductivity is different for small and large U.

Dynamical Mean Field Theory Basic idea: reduce the quantum many body problem to a
one site or a cluster of sites, in a medium of non interacting electrons obeying a self consistency condition.[A. Georges and GK Phys. Rev. B 45, 6497, 1992].
Merge atomic physics and band theory. Atom in a medium. Weiss field. = Quantum impurity model.
Solid in a frequency dependent potential. Incorporate band structure and orbital degeneracy to
achive a realistic description of materials. LDA +DMFT. Realistic combination with band theory: LDA+DMFT V. Anisimov, A. Poteryaev, M. Korotin, A. Anokhin and G. Kotliar, J. Phys. Cond. Mat. 35, 7359 (1997).
.

LDA+DMFT V. Anisimov, A. Poteryaev, M. Korotin, A. Anokhin and G. Kotliar, J. Phys.
Cond. Mat. 35, 7359 (1997).
• The light, sp (or spd) electrons are extended, well described by LDA .The heavy, d (or f) electrons are localized treat by DMFT. Use Khon Sham Hamiltonian after substracting the average energy already contained in LDA.
• Add to the substracted Kohn Sham Hamiltonian a frequency dependent self energy, treat with DMFT. In this method U is either a parameter or is estimated from constrained LDA
• • Describes the excitation spectra of many strongly correlated solids. .

Spectral Density Functional• Determine the self energy , the density and the structure
of the solid self consistently. By extremizing a functional of DENSITY +LOCAL SPECTRA. (Chitra, Kotliar, PRB 2001, Savrasov, Kotliar, PRB 2005).
• Coupling of electronic degrees of freedom to structural degrees of freedom. Full implementation for Pu. Savrasov and Kotliar Nature 2001.
• Under development. Functional of G and W, self consistent determination of the Coulomb interaction and the Greens function.
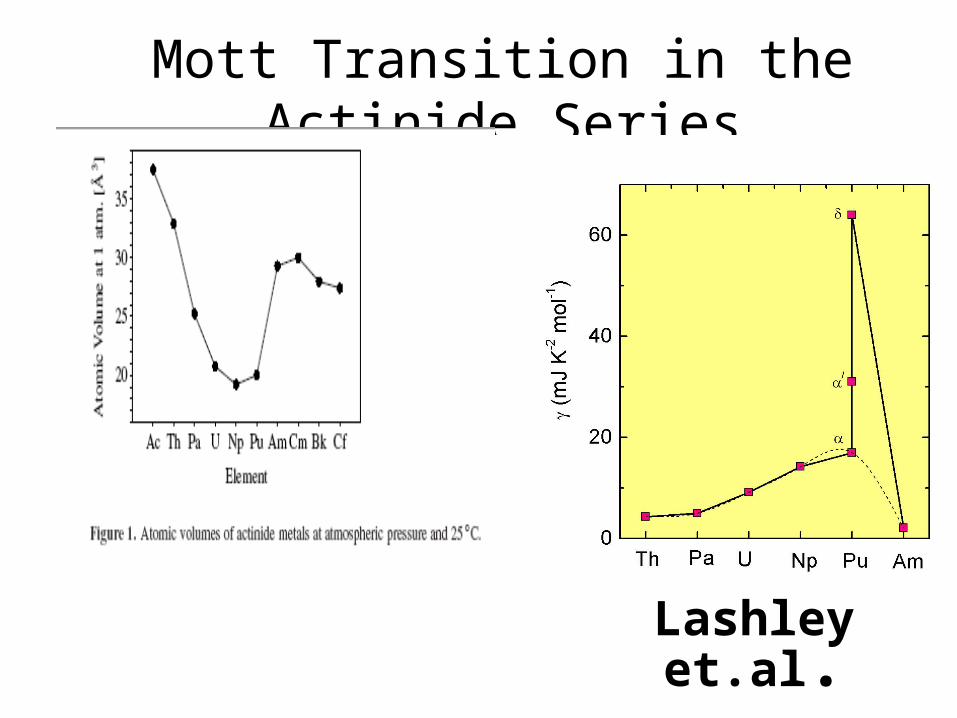
Mott Transition in the Actinide Series
Lashley et.al.

Pu phases: A. Lawson Los Alamos Science 26, (2000)
LDA underestimates the volume of fcc Pu by 30%.
Within LDA fcc Pu has a negative shear modulus.
LSDA predicts Pu to be magnetic with a 5 b moment. Experimentally it is not.
Treating f electrons as core overestimates the volume by 30 %

Pu is not MAGNETIC, alpha and delta have comparable
susceptibility and specific heat.

Total Energy as a function of volume for Total Energy as a function of volume for Pu Pu W (ev) vs (a.u. 27.2 ev)
(Savrasov, Kotliar, Abrahams, Nature ( 2001)Non magnetic correlated state of fcc Pu.
iw
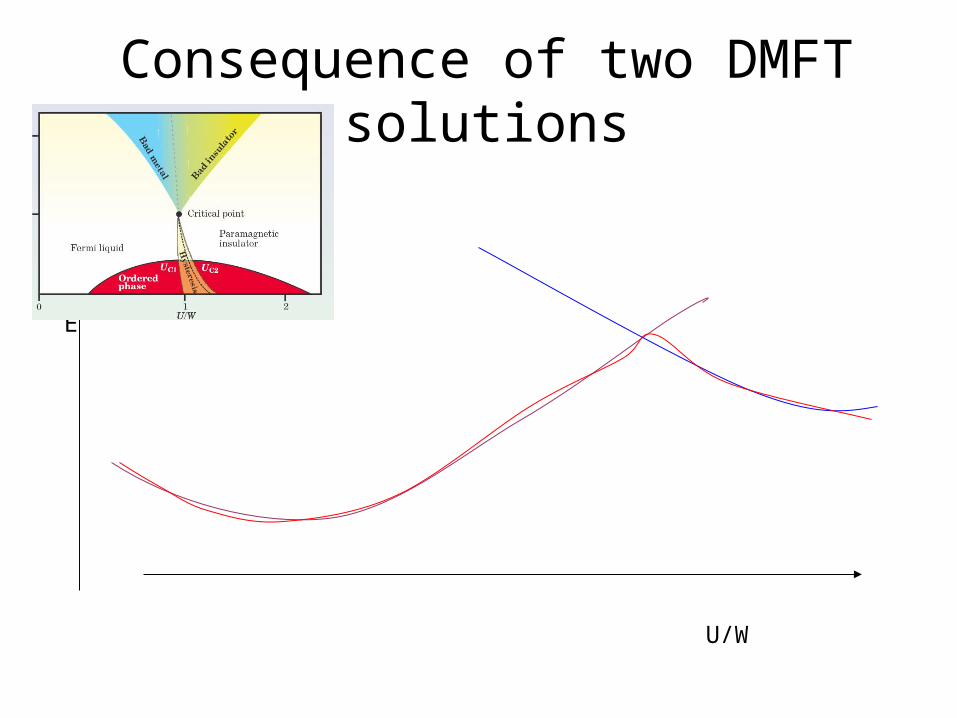
Consequence of two DMFT solutions
U/W
E

Double well structure and Pu Qualitative explanation of negative thermal expansion[ G. Kotliar J.Low
Temp. Physvol.126, 1009 27. (2002)]See also A . Lawson et.al.Phil. Mag. B 82, 1837 ]

Phonon Spectra
• Electrons are the glue that hold the atoms together. Vibration spectra (phonons) probe the electronic structure.
• Phonon spectra reveals instablities, via soft modes.
• Phonon spectrum of Pu had not been measured.

Phonon freq (THz) vs q in delta Pu X. Dai et. al. Science vol 300, 953, 2003
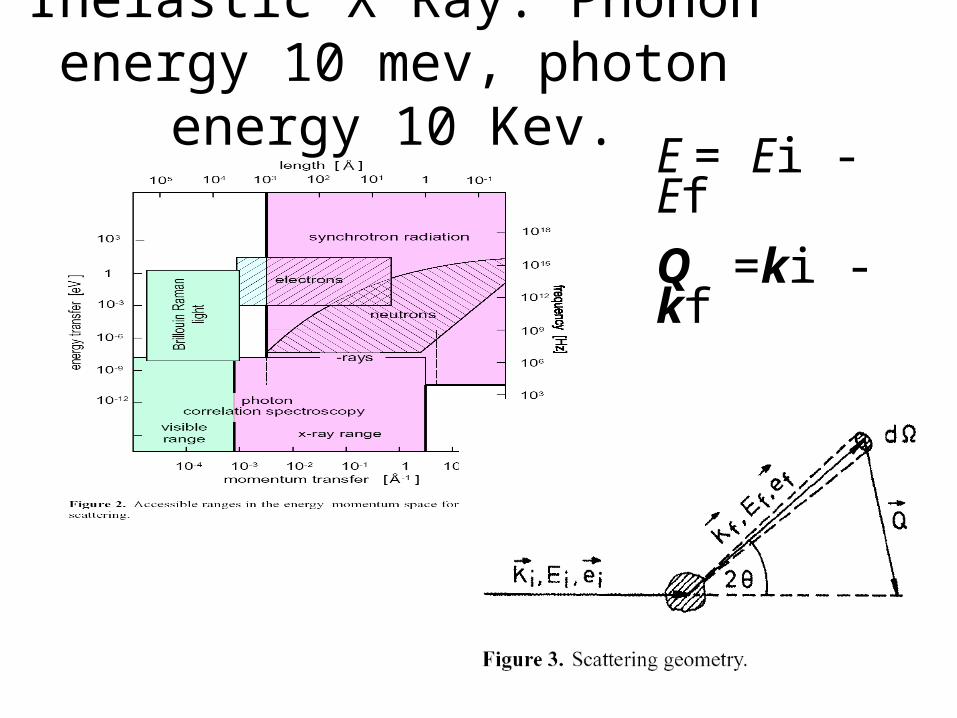
Inelastic X Ray. Phonon energy 10 mev, photon energy 10 Kev.
E = Ei - EfQ =ki - kf

DMFT Phonons in fcc DMFT Phonons in fcc -Pu-Pu
C11 (GPa) C44 (GPa) C12 (GPa) C'(GPa)
Theory 34.56 33.03 26.81 3.88
Experiment 36.28 33.59 26.73 4.78
( Dai, Savrasov, Kotliar,Ledbetter, Migliori, Abrahams, Science, 9 May 2003)
(experiments from Wong et.al, Science, 22 August 2003)
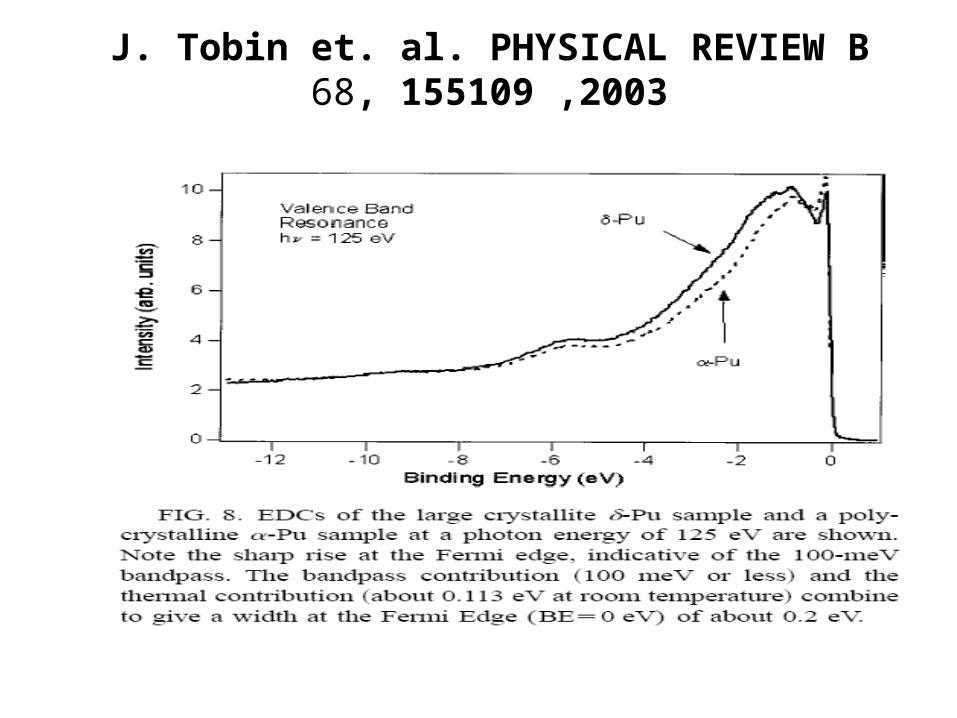
J. Tobin et. al. PHYSICAL REVIEW B 68, 155109 ,2003
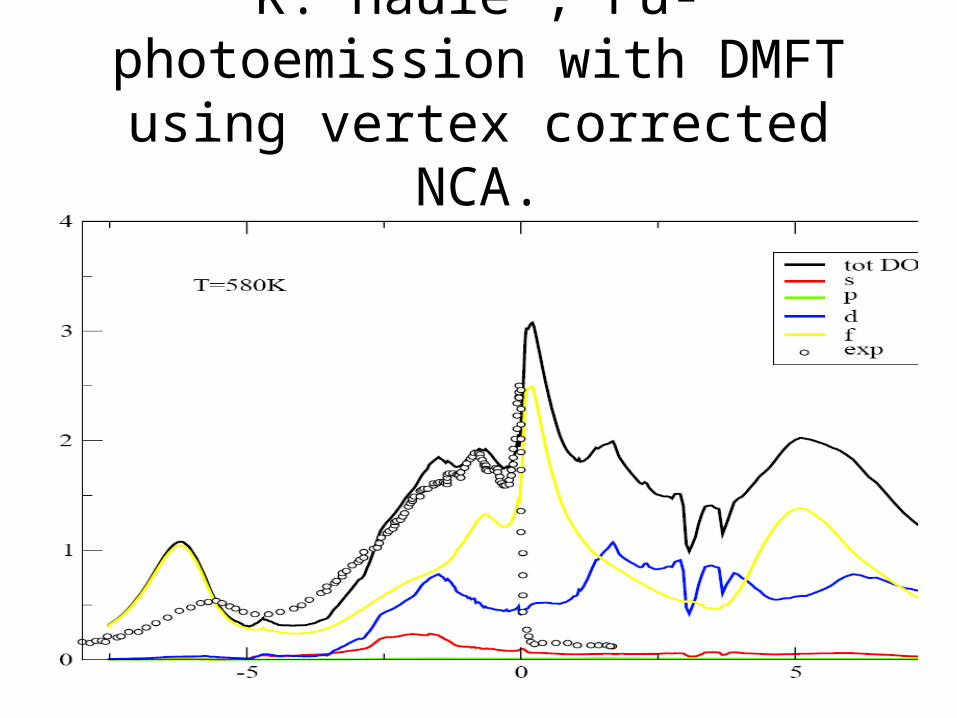
K. Haule , Pu- photoemission with DMFT using vertex corrected NCA.

Actinides and The Mott PhenomenaEvolution of the electronic structure between the atomic limit and
the band limit in an open shell situation.The “”in between regime” is ubiquitous central theme in
strongly correlated systems.Actinides allow us to probe this physics in ELEMENTS. Mott
transition across the actinide series [ B. Johansson Phil Mag. 30,469 (1974)] . Revisit the problem using a new insights and new techniques from the solution of the Mott transition problem within DMFT in a model Hamiltonian.
Use the ideas and concepts that resulted from this development to give physical qualitative insights into real materials.
Turn the technology developed to solve simple models into a practical quantitative electronic structure method .

Mott Transition in the Actinide Series
Lashley et.al.

Mott transition in open (right) and closed (left) shell systems. Superconductivity and Singlet Mott State.
Anderson RVB. Single Site DMFT calculation. Capone et.al. (2001)
S S
U U
TLog[2J+1]
Uc
~1/(Uc-U)
J=0
???
Tc
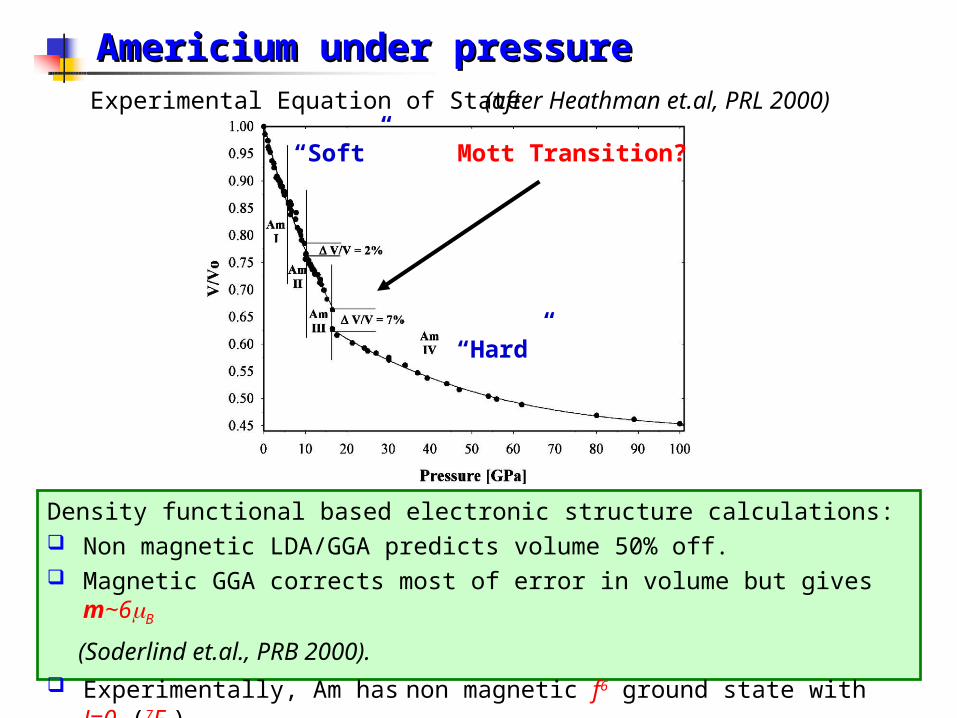
Americium under pressureAmericium under pressure
Density functional based electronic structure calculations: Non magnetic LDA/GGA predicts volume 50% off. Magnetic GGA corrects most of error in volume but gives m~6B
(Soderlind et.al., PRB 2000). Experimentally, Am has non magnetic f6 ground state with J=0 (7F0)
Experimental Equation of State (after Heathman et.al, PRL 2000)
Mott Transition?“Soft”
“Hard”

Am under pressure: J.C. GriveauJ. Rebizant G. Lander G. Kotliar PRL (2005)

Photoemission Spectrum from Photoemission Spectrum from 77FF00 Americium Americium
LDA+DMFT Density of States
Experimental Photoemission Spectrum(after J. Naegele et.al, PRL 1984)
S. Savrasov et. al. Multiplet Effects
F(0)=4.5 eV F(2)=8.0 eVF(4)=5.4 eV F(6)=4.0 eV
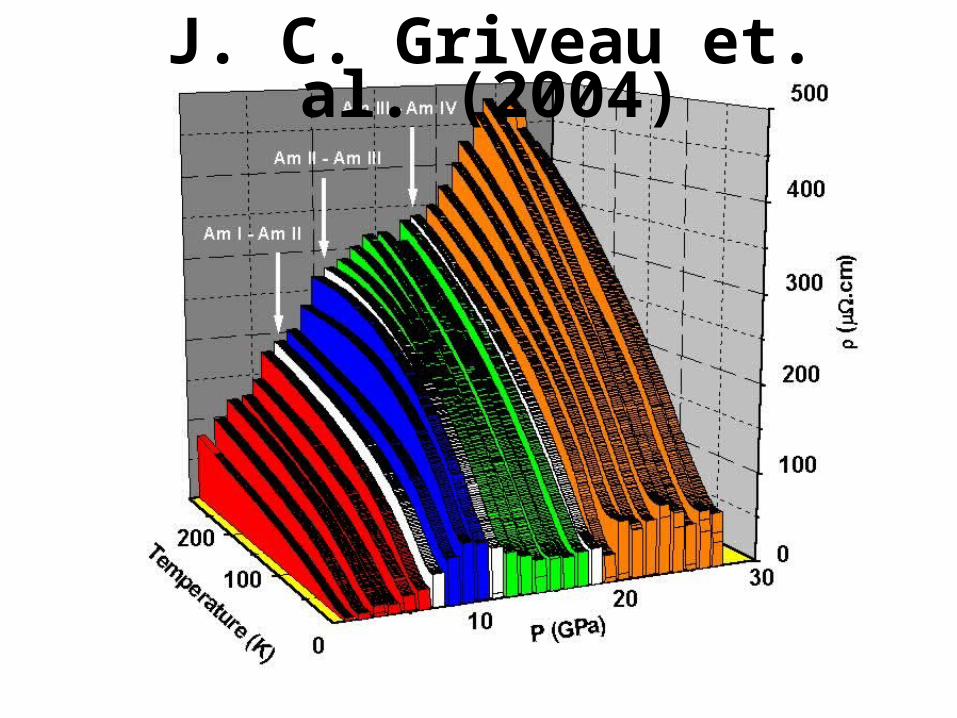
J. C. Griveau et. al. (2004)


Americium: mixed valence under pressure.
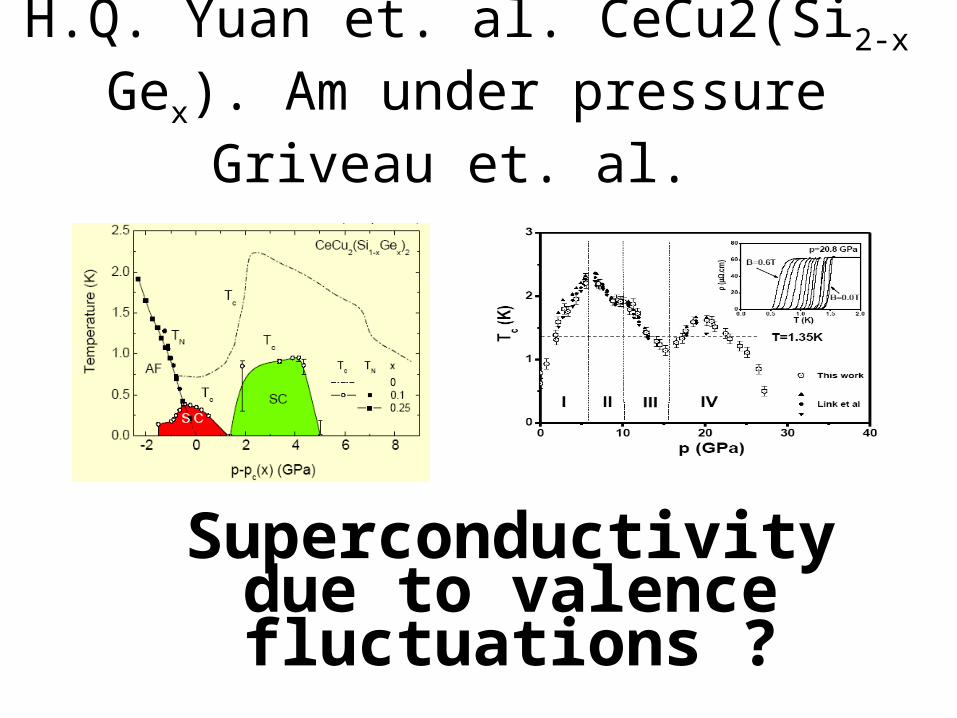
H.Q. Yuan et. al. CeCu2(Si2-x Gex). Am under pressure Griveau et. al.
Superconductivity due to valence fluctuations ?
Conclusions and Outlook
• Motivation: Mott transition in Americium and Plutonium. In both cases theory (DMFT) and experiment suggest gradual subtle changes.
• DMFT: Physical connection between spectra and structure. Studied the Mott transition open and closed shell cases. .
• DMFT: method under construction, but it already gives quantitative results and qualitative insights. Interactions between theory and experiments.
• Pu: simple picture of alpha delta and epsilon. Interplay of lattice and electronic structure near the Mott transition.
• Am: Rich physics, mixed valence under pressure ? Superconductivity near the Mott transition.
•

Actinides and The Mott PhenomenaEvolution of the electronic structure between the atomic limit and
the band limit in an open shell situation.The “”in between regime” is ubiquitous central theme in
strongly correlated systems.Actinides allow us to probe this physics in ELEMENTS. Mott
transition across the actinide series [ B. Johansson Phil Mag. 30,469 (1974)] . Revisit the problem using a new insights and new techniques from the solution of the Mott transition problem within DMFT in a model Hamiltonian.
Use the ideas and concepts that resulted from this development to give physical qualitative insights into real materials.
Turn the technology developed to solve simple models into a practical quantitative electronic structure method .


![Journal of Magnetism and Magnetic Materialsof high temperature superconductivity [11–17] and more generally correlated physics in complex oxides materials [6,18,19]. Towards this](https://static.fdocuments.us/doc/165x107/5f268f96f8de0d2e6d643af2/journal-of-magnetism-and-magnetic-materials-of-high-temperature-superconductivity.jpg)