Strong Lensing by Galaxies - University of Maryland ...richard/ASTRO620/annurev-astro-treu.pdf ·...
41
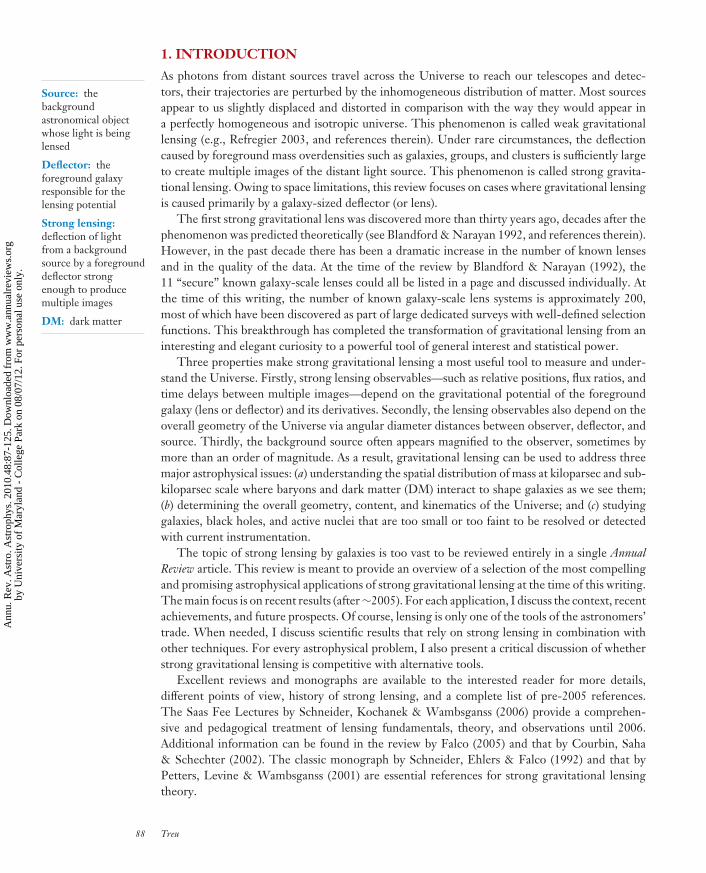
Strong Lensing by Galaxies Tommaso Treu Physics Department, University of California, Santa Barbara, California 93106; email: [email protected] Annu. Rev. Astron. Astrophys. 2010. 48:87–125 First published online as a Review in Advance on April 1, 2010 The Annual Review of Astronomy and Astrophysics is online at astro.annualreviews.org This article’s doi: 10.1146/annurev-astro-081309-130924 Copyright c 2010 by Annual Reviews. All rights reserved 0066-4146/10/0922-0087$20.00 Key Words dark energy, dark matter, galaxy evolution, galaxy formation, gravitational lensing Abstract Strong lensing is a powerful tool to address three major astrophysical issues: understanding the spatial distribution of mass at kiloparsec and subkiloparsec scale, where baryons and dark matter interact to shape galaxies as we see them; determining the overall geometry, content, and kinematics of the Universe; and studying distant galaxies, black holes, and active nuclei that are too small or too faint to be resolved or detected with current instrumentation. After summarizing strong gravitational lensing fundamentals, I present a selection of recent important results. I conclude by discussing the exciting prospects of strong gravitational lensing in the next decade. 87 Annu. Rev. Astro. Astrophys. 2010.48:87-125. Downloaded from www.annualreviews.org by University of Maryland - College Park on 08/07/12. For personal use only.
Transcript of Strong Lensing by Galaxies - University of Maryland ...richard/ASTRO620/annurev-astro-treu.pdf ·...
AA48CH04-Treu ARI 23 July 2010 15:22
Strong Lensing by GalaxiesTommaso TreuPhysics Department, University of California, Santa Barbara, California 93106;email: [email protected]
Annu. Rev. Astron. Astrophys. 2010. 48:87–125
First published online as a Review in Advance onApril 1, 2010
The Annual Review of Astronomy and Astrophysics isonline at astro.annualreviews.org
This article’s doi:10.1146/annurev-astro-081309-130924
Copyright c© 2010 by Annual Reviews.All rights reserved
0066-4146/10/0922-0087$20.00
Key Words
dark energy, dark matter, galaxy evolution, galaxy formation, gravitationallensing
Abstract
Strong lensing is a powerful tool to address three major astrophysical issues:understanding the spatial distribution of mass at kiloparsec and subkiloparsecscale, where baryons and dark matter interact to shape galaxies as we seethem; determining the overall geometry, content, and kinematics of theUniverse; and studying distant galaxies, black holes, and active nuclei that aretoo small or too faint to be resolved or detected with current instrumentation.After summarizing strong gravitational lensing fundamentals, I present aselection of recent important results. I conclude by discussing the excitingprospects of strong gravitational lensing in the next decade.
87
Ann
u. R
ev. A
stro
. Ast
roph
ys. 2
010.
48:8
7-12
5. D
ownl
oade
d fr
om w
ww
.ann
ualr
evie
ws.
org
by U
nive
rsity
of
Mar
ylan
d -
Col
lege
Par
k on
08/
07/1
2. F
or p
erso
nal u
se o
nly.
AA48CH04-Treu ARI 23 July 2010 15:22
Source: thebackgroundastronomical objectwhose light is beinglensed
Deflector: theforeground galaxyresponsible for thelensing potential
Strong lensing:deflection of lightfrom a backgroundsource by a foregrounddeflector strongenough to producemultiple images
DM: dark matter
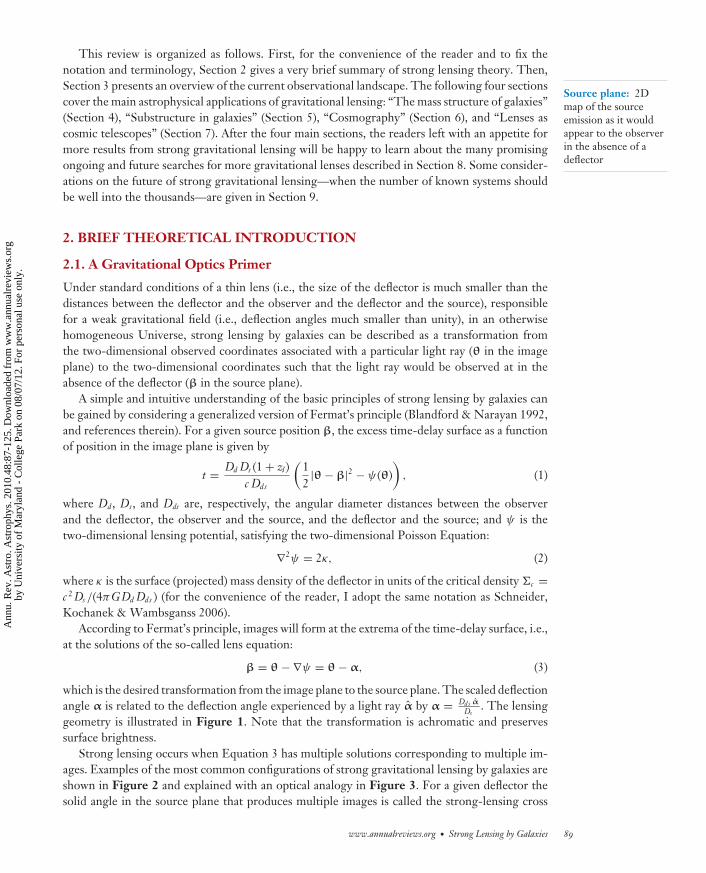
1. INTRODUCTION
As photons from distant sources travel across the Universe to reach our telescopes and detec-tors, their trajectories are perturbed by the inhomogeneous distribution of matter. Most sourcesappear to us slightly displaced and distorted in comparison with the way they would appear ina perfectly homogeneous and isotropic universe. This phenomenon is called weak gravitationallensing (e.g., Refregier 2003, and references therein). Under rare circumstances, the deflectioncaused by foreground mass overdensities such as galaxies, groups, and clusters is sufficiently largeto create multiple images of the distant light source. This phenomenon is called strong gravita-tional lensing. Owing to space limitations, this review focuses on cases where gravitational lensingis caused primarily by a galaxy-sized deflector (or lens).
The first strong gravitational lens was discovered more than thirty years ago, decades after thephenomenon was predicted theoretically (see Blandford & Narayan 1992, and references therein).However, in the past decade there has been a dramatic increase in the number of known lensesand in the quality of the data. At the time of the review by Blandford & Narayan (1992), the11 “secure” known galaxy-scale lenses could all be listed in a page and discussed individually. Atthe time of this writing, the number of known galaxy-scale lens systems is approximately 200,most of which have been discovered as part of large dedicated surveys with well-defined selectionfunctions. This breakthrough has completed the transformation of gravitational lensing from aninteresting and elegant curiosity to a powerful tool of general interest and statistical power.
Three properties make strong gravitational lensing a most useful tool to measure and under-stand the Universe. Firstly, strong lensing observables—such as relative positions, flux ratios, andtime delays between multiple images—depend on the gravitational potential of the foregroundgalaxy (lens or deflector) and its derivatives. Secondly, the lensing observables also depend on theoverall geometry of the Universe via angular diameter distances between observer, deflector, andsource. Thirdly, the background source often appears magnified to the observer, sometimes bymore than an order of magnitude. As a result, gravitational lensing can be used to address threemajor astrophysical issues: (a) understanding the spatial distribution of mass at kiloparsec and sub-kiloparsec scale where baryons and dark matter (DM) interact to shape galaxies as we see them;(b) determining the overall geometry, content, and kinematics of the Universe; and (c) studyinggalaxies, black holes, and active nuclei that are too small or too faint to be resolved or detectedwith current instrumentation.
The topic of strong lensing by galaxies is too vast to be reviewed entirely in a single AnnualReview article. This review is meant to provide an overview of a selection of the most compellingand promising astrophysical applications of strong gravitational lensing at the time of this writing.The main focus is on recent results (after ∼2005). For each application, I discuss the context, recentachievements, and future prospects. Of course, lensing is only one of the tools of the astronomers’trade. When needed, I discuss scientific results that rely on strong lensing in combination withother techniques. For every astrophysical problem, I also present a critical discussion of whetherstrong gravitational lensing is competitive with alternative tools.
Excellent reviews and monographs are available to the interested reader for more details,different points of view, history of strong lensing, and a complete list of pre-2005 references.The Saas Fee Lectures by Schneider, Kochanek & Wambsganss (2006) provide a comprehen-sive and pedagogical treatment of lensing fundamentals, theory, and observations until 2006.Additional information can be found in the review by Falco (2005) and that by Courbin, Saha& Schechter (2002). The classic monograph by Schneider, Ehlers & Falco (1992) and that byPetters, Levine & Wambsganss (2001) are essential references for strong gravitational lensingtheory.
88 Treu
Ann
u. R
ev. A
stro
. Ast
roph
ys. 2
010.
48:8
7-12
5. D
ownl
oade
d fr
om w
ww
.ann
ualr
evie
ws.
org
by U
nive
rsity
of
Mar
ylan
d -
Col
lege
Par
k on
08/
07/1
2. F
or p
erso
nal u
se o
nly.
AA48CH04-Treu ARI 23 July 2010 15:22
Source plane: 2Dmap of the sourceemission as it wouldappear to the observerin the absence of adeflector
This review is organized as follows. First, for the convenience of the reader and to fix thenotation and terminology, Section 2 gives a very brief summary of strong lensing theory. Then,Section 3 presents an overview of the current observational landscape. The following four sectionscover the main astrophysical applications of gravitational lensing: “The mass structure of galaxies”(Section 4), “Substructure in galaxies” (Section 5), “Cosmography” (Section 6), and “Lenses ascosmic telescopes” (Section 7). After the four main sections, the readers left with an appetite formore results from strong gravitational lensing will be happy to learn about the many promisingongoing and future searches for more gravitational lenses described in Section 8. Some consider-ations on the future of strong gravitational lensing—when the number of known systems shouldbe well into the thousands—are given in Section 9.
2. BRIEF THEORETICAL INTRODUCTION
2.1. A Gravitational Optics Primer
Under standard conditions of a thin lens (i.e., the size of the deflector is much smaller than thedistances between the deflector and the observer and the deflector and the source), responsiblefor a weak gravitational field (i.e., deflection angles much smaller than unity), in an otherwisehomogeneous Universe, strong lensing by galaxies can be described as a transformation fromthe two-dimensional observed coordinates associated with a particular light ray (θ in the imageplane) to the two-dimensional coordinates such that the light ray would be observed at in theabsence of the deflector (β in the source plane).
A simple and intuitive understanding of the basic principles of strong lensing by galaxies canbe gained by considering a generalized version of Fermat’s principle (Blandford & Narayan 1992,and references therein). For a given source position β, the excess time-delay surface as a functionof position in the image plane is given by
t = Dd Ds (1 + zl )c Dds
(12|θ − β|2 − ψ(θ)
), (1)
where Dd , Ds, and Dds are, respectively, the angular diameter distances between the observerand the deflector, the observer and the source, and the deflector and the source; and ψ is thetwo-dimensional lensing potential, satisfying the two-dimensional Poisson Equation:
∇2ψ = 2κ, (2)
where κ is the surface (projected) mass density of the deflector in units of the critical density �c =c 2 Ds /(4πGDd Dds ) (for the convenience of the reader, I adopt the same notation as Schneider,Kochanek & Wambsganss 2006).
According to Fermat’s principle, images will form at the extrema of the time-delay surface, i.e.,at the solutions of the so-called lens equation:
β = θ − ∇ψ = θ − α, (3)
which is the desired transformation from the image plane to the source plane. The scaled deflectionangle α is related to the deflection angle experienced by a light ray α by α = Dds α
Ds. The lensing
geometry is illustrated in Figure 1. Note that the transformation is achromatic and preservessurface brightness.
Strong lensing occurs when Equation 3 has multiple solutions corresponding to multiple im-ages. Examples of the most common configurations of strong gravitational lensing by galaxies areshown in Figure 2 and explained with an optical analogy in Figure 3. For a given deflector thesolid angle in the source plane that produces multiple images is called the strong-lensing cross
www.annualreviews.org • Strong Lensing by Galaxies 89
Ann
u. R
ev. A
stro
. Ast
roph
ys. 2
010.
48:8
7-12
5. D
ownl
oade
d fr
om w
ww
.ann
ualr
evie
ws.
org
by U
nive
rsity
of
Mar
ylan
d -
Col
lege
Par
k on
08/
07/1
2. F
or p
erso
nal u
se o
nly.

AA48CH04-Treu ARI 23 July 2010 15:22
Observer
Dd Dds
Ds
Image plane Source plane
θ
β
α
Figure 1Sketch of thegravitational lensinggeometry, courtesy ofB.J. Brewer.
section. For a given population of deflectors, the optical depth is the fraction of the sky wheredistant sources appear to be multiply imaged.
The Jacobian of the transformation from the image to the source plane gives the inversemagnification tensor, which can be written as
∂β
∂θ= δi j − ∂2ψ
∂θi∂θ j=
(1 − κ − γ1 −γ2
−γ2 1 − κ + γ1
), (4)
a b
c d
Figure 2Examples of the most common configurations of galaxy-scale gravitational lens systems. (a) A backgroundsource can produce four visible images—(b) a “quad,” (c) an (incomplete) Einstein ring, or (d ) two visibleimages (a “double”)—depending on the ellipticity of the projected mass distribution of the deflector and onthe relative alignment between source and deflector. (Data from Moustakas et al. 2007, image courtesy ofP. Marshall).
90 Treu
Ann
u. R
ev. A
stro
. Ast
roph
ys. 2
010.
48:8
7-12
5. D
ownl
oade
d fr
om w
ww
.ann
ualr
evie
ws.
org
by U
nive
rsity
of
Mar
ylan
d -
Col
lege
Par
k on
08/
07/1
2. F
or p
erso
nal u
se o
nly.

AA48CH04-Treu ARI 23 July 2010 15:22
aa b
c d
a b
c d
Figure 3Optical analogy to illustrate the gravitational lensing phenomenon. The optical properties of the stem of awineglass are similar to those of a typical galaxy-scale lens. Viewed through a wineglass, a backgroundcompact source such as (a) a distant candle can reproduce (b) the quad, (c) Einstein ring, and (d ) doubleconfigurations observed in gravitational lensing, as shown in Figure 2. Image courtesy of P. Marshall.
Convergence:Dimensionlessprojected surface-massdensity in units of thecritical density
Shear: dimensionlessquantity that describesthe local distortion oflensed images
Einstein radius:characteristic scale ofstrong lensing; for acircular deflector itcorresponds to theradius within which〈κ〉 = 1
and describes the local isotropic magnification of a source (determined by the convergence κ
defined above) and its distortion (shear components γ 1, and γ 2).In the limit of a point source, the local magnification μ is given by the determinant of the
magnification tensor,
μ = 1(1 − κ)2 − γ 2
1 − γ 22
. (5)
For extended sources, the observed magnification depends on the surface brightness distributionof the source as well as on the magnification matrix.
When the determinant of the inverse magnification matrix vanishes, the magnification becomesformally infinite. The loci of formally infinite magnification in the image plane are called criticallines. The corresponding loci in the source plane are called caustics. Compact sources locatedclose to a caustic can be magnified by very large factors up to almost two orders of magnitude(Stark et al. 2008), although the total observed flux is always finite for astrophysical sources offinite angular size.
It is convenient to define the Einstein radius. For a circular deflector it is the radius of theregion inside where the average surface-mass density equals the critical density. A point sourceperfectly aligned with the center of a circular mass distribution is lensed into a circle of radiusequal to the Einstein radius, the so-called Einstein ring (see Figure 2). The size of the Einsteinradius depends on the enclosed mass as well as on the redshifts of deflector and source. Thedefinition of Einstein radius needs to be modified for noncircular deflectors (Kormann, Schneider& Bartelmann 1994). Once appropriately defined, the Einstein radius is a most useful quantity toexpress the lensing strength of an object, and it is usually very robustly determined via strong lensmodels (e.g., Schneider, Kochanek & Wambsganss 2006). As a consequence, the mass enclosedin the cylinder of radius equal to the Einstein radius can be measured to within 1–2%, includingall random and systematic uncertainties.
www.annualreviews.org • Strong Lensing by Galaxies 91
Ann
u. R
ev. A
stro
. Ast
roph
ys. 2
010.
48:8
7-12
5. D
ownl
oade
d fr
om w
ww
.ann
ualr
evie
ws.
org
by U
nive
rsity
of
Mar
ylan
d -
Col
lege
Par
k on
08/
07/1
2. F
or p
erso
nal u
se o
nly.
AA48CH04-Treu ARI 23 July 2010 15:22
Macrolensing: stronglensing producingimage separations oforder arcseconds, thetypical scale of massivegalaxies
SIE: singularisothermal ellipsoid
SIS: singularisothermal sphere
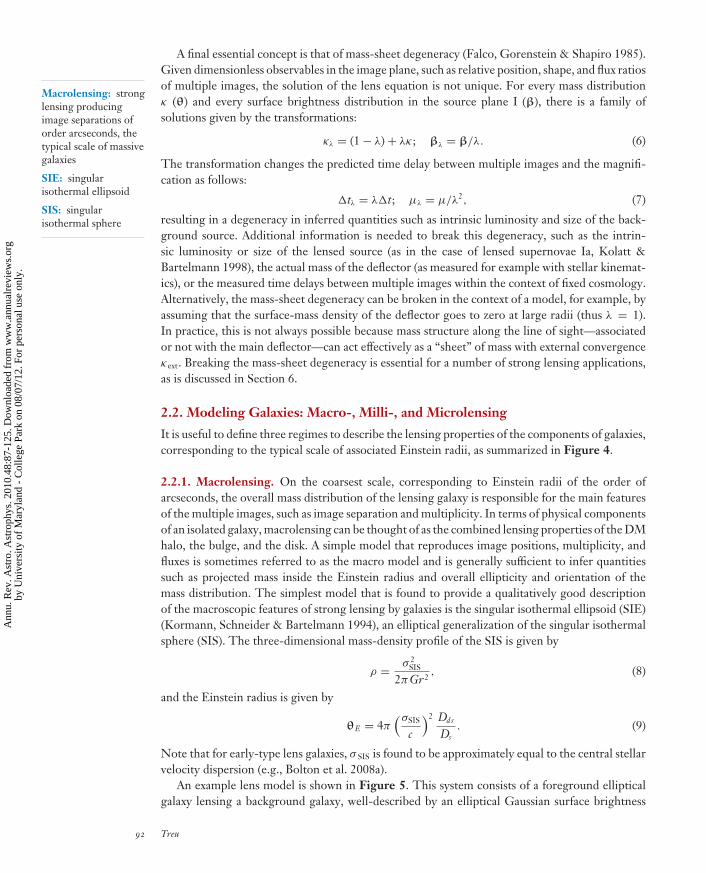
A final essential concept is that of mass-sheet degeneracy (Falco, Gorenstein & Shapiro 1985).Given dimensionless observables in the image plane, such as relative position, shape, and flux ratiosof multiple images, the solution of the lens equation is not unique. For every mass distributionκ (θ) and every surface brightness distribution in the source plane I (β), there is a family ofsolutions given by the transformations:
κλ = (1 − λ) + λκ ; βλ = β/λ. (6)
The transformation changes the predicted time delay between multiple images and the magnifi-cation as follows:
tλ = λt; μλ = μ/λ2, (7)
resulting in a degeneracy in inferred quantities such as intrinsic luminosity and size of the back-ground source. Additional information is needed to break this degeneracy, such as the intrin-sic luminosity or size of the lensed source (as in the case of lensed supernovae Ia, Kolatt &Bartelmann 1998), the actual mass of the deflector (as measured for example with stellar kinemat-ics), or the measured time delays between multiple images within the context of fixed cosmology.Alternatively, the mass-sheet degeneracy can be broken in the context of a model, for example, byassuming that the surface-mass density of the deflector goes to zero at large radii (thus λ = 1).In practice, this is not always possible because mass structure along the line of sight—associatedor not with the main deflector—can act effectively as a “sheet” of mass with external convergenceκext. Breaking the mass-sheet degeneracy is essential for a number of strong lensing applications,as is discussed in Section 6.
2.2. Modeling Galaxies: Macro-, Milli-, and Microlensing
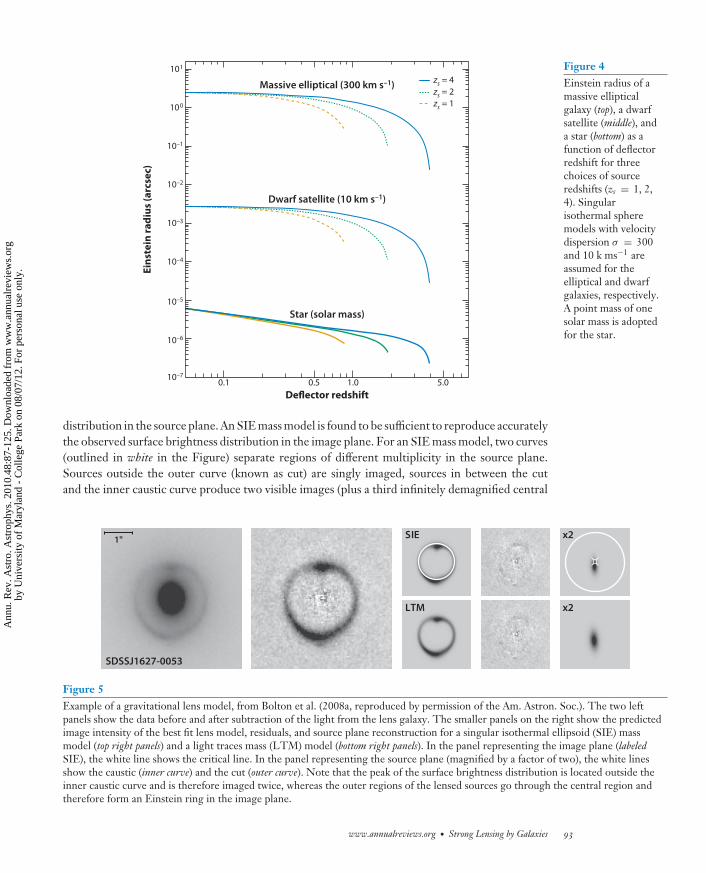
It is useful to define three regimes to describe the lensing properties of the components of galaxies,corresponding to the typical scale of associated Einstein radii, as summarized in Figure 4.
2.2.1. Macrolensing. On the coarsest scale, corresponding to Einstein radii of the order ofarcseconds, the overall mass distribution of the lensing galaxy is responsible for the main featuresof the multiple images, such as image separation and multiplicity. In terms of physical componentsof an isolated galaxy, macrolensing can be thought of as the combined lensing properties of the DMhalo, the bulge, and the disk. A simple model that reproduces image positions, multiplicity, andfluxes is sometimes referred to as the macro model and is generally sufficient to infer quantitiessuch as projected mass inside the Einstein radius and overall ellipticity and orientation of themass distribution. The simplest model that is found to provide a qualitatively good descriptionof the macroscopic features of strong lensing by galaxies is the singular isothermal ellipsoid (SIE)(Kormann, Schneider & Bartelmann 1994), an elliptical generalization of the singular isothermalsphere (SIS). The three-dimensional mass-density profile of the SIS is given by
ρ = σ 2SIS
2πGr2, (8)
and the Einstein radius is given by
θE = 4π(σSIS
c
)2 Dds
Ds. (9)
Note that for early-type lens galaxies, σ SIS is found to be approximately equal to the central stellarvelocity dispersion (e.g., Bolton et al. 2008a).
An example lens model is shown in Figure 5. This system consists of a foreground ellipticalgalaxy lensing a background galaxy, well-described by an elliptical Gaussian surface brightness
92 Treu
Ann
u. R
ev. A
stro
. Ast
roph
ys. 2
010.
48:8
7-12
5. D
ownl
oade
d fr
om w
ww
.ann
ualr
evie
ws.
org
by U
nive
rsity
of
Mar
ylan
d -
Col
lege
Par
k on
08/
07/1
2. F
or p
erso
nal u
se o
nly.
AA48CH04-Treu ARI 23 July 2010 15:22
Massive elliptical (300 km s–1)
Dwarf satellite (10 km s–1)
Star (solar mass)
Eins
tein
radi
us (a
rcse
c)
Deflector redshift
101
100
10–1
0.1 0.5 1.0 5.0
10–2
10–3
10–4
10–5
10–6
10–7
zs = 4zs = 2zs = 1
Figure 4Einstein radius of amassive ellipticalgalaxy (top), a dwarfsatellite (middle), anda star (bottom) as afunction of deflectorredshift for threechoices of sourceredshifts (zs = 1, 2,4). Singularisothermal spheremodels with velocitydispersion σ = 300and 10 k ms−1 areassumed for theelliptical and dwarfgalaxies, respectively.A point mass of onesolar mass is adoptedfor the star.
distribution in the source plane. An SIE mass model is found to be sufficient to reproduce accuratelythe observed surface brightness distribution in the image plane. For an SIE mass model, two curves(outlined in white in the Figure) separate regions of different multiplicity in the source plane.Sources outside the outer curve (known as cut) are singly imaged, sources in between the cutand the inner caustic curve produce two visible images (plus a third infinitely demagnified central
1" SIE
SDSSJ1627-0053
LTM
x2
x2
Figure 5Example of a gravitational lens model, from Bolton et al. (2008a, reproduced by permission of the Am. Astron. Soc.). The two leftpanels show the data before and after subtraction of the light from the lens galaxy. The smaller panels on the right show the predictedimage intensity of the best fit lens model, residuals, and source plane reconstruction for a singular isothermal ellipsoid (SIE) massmodel (top right panels) and a light traces mass (LTM) model (bottom right panels). In the panel representing the image plane (labeledSIE), the white line shows the critical line. In the panel representing the source plane (magnified by a factor of two), the white linesshow the caustic (inner curve) and the cut (outer curve). Note that the peak of the surface brightness distribution is located outside theinner caustic curve and is therefore imaged twice, whereas the outer regions of the lensed sources go through the central region andtherefore form an Einstein ring in the image plane.
www.annualreviews.org • Strong Lensing by Galaxies 93
Ann
u. R
ev. A
stro
. Ast
roph
ys. 2
010.
48:8
7-12
5. D
ownl
oade
d fr
om w
ww
.ann
ualr
evie
ws.
org
by U
nive
rsity
of
Mar
ylan
d -
Col
lege
Par
k on
08/
07/1
2. F
or p
erso
nal u
se o
nly.

AA48CH04-Treu ARI 23 July 2010 15:22
Millilensing: stronglensing producingimage separation oforder ofmilliarcseconds, thetypical scale of smallsatellite galaxies
image), and sources inside the inner caustic curve produce four visible images (plus a fifth infinitelydemagnified central image). In this case, the detectable part of the extended source crosses theinner caustic curve so that it appears partly doubly imaged and partly quadruply imaged. Owingto the good alignment of the deflector and source, the image forms an almost perfect Einsteinring. An alternative light traces mass (LTM) model (i.e., the surface-mass density of the deflectoris obtained by multiplying its surface brightness by a mass-to-light ratio, allowed to be a free-parameter) is also shown. In this case, the LTM model is almost indistinguishable from an SIEmodel, because strong lensing is sensitive only to the mass enclosed by the Einstein radius, tofirst approximation. In general, LTM models can be excluded when considering extended sourcesbecause they fail to reproduce the detailed geometry, the radial behavior in particular. LTMmodels can also be excluded on the basis of a number of other considerations, as reviewed inSection 4.
We just discussed an example of a simply-parametrized gravitational lens macro model, whereboth the source surface brightness and the mass distribution of the deflector are described by as-trophysically motivated models with a small number of parameters. This kind of model is generallycapable of reproducing all the macroscopic features while delivering robust estimates of the mostimportant quantities for the deflector (e.g., total mass ellipticity and orientation) and the source(e.g., intrinsic size and luminosity). For these reasons, simply-parametrized models are often allone needs in interpreting lensing data.
However, some applications require more sophisticated lens models, capable of extractingmore detailed information. In recent years, the increase in number of known lenses has beenparalleled by ever more sophisticated lens modeling tools. A full description of advanced lensmodels is beyond the scope of this review. However, I list a few examples to point the inter-ested reader toward the technical literature. A number of groups have developed “grid-based”models (also known—incorrectly—as nonparametric models; pixel values are parameters like anyother), where the potential (or surface-mass density) of the deflector and/or the surface bright-ness of the source are described by a set of pixels on regular or irregular grids, using regu-larization schemes to suppress spurious features caused by noise (e.g., Warren & Dye 2003,Treu & Koopmans 2004, Dye & Warren 2005, Koopmans 2005, Brewer & Lewis 2006, Suyuet al. 2006, Vegetti & Koopmans 2009a). An alternative hybrid approach consists of using largenumbers of simply-parametrized models to strike a balance between flexibility and prior infor-mation on the shape and surface brightness of galaxies (Marshall 2006). Bayesian statistics hasbecome the standard statistical framework for advanced models, allowing for rigorous analysis ofthe uncertainties in highly dimensional spaces as well as quantitative model selection. Heuristicpixelated approaches have also been adopted with some success (Saha & Williams 2004) and re-cently have been cast in a Bayesian framework to improve the understanding of the uncertainties(Coles 2008).
2.2.2. Millilensing. On an intermediate angular scale are the lensing effects introduced by sub-structure, both luminous and dark. Typically, a lens galaxy has some satellites, like the dwarfsatellites of the Milky Way (Kravtsov 2010, and references therein). The mass associated with thesatellites introduces perturbations in an otherwise smooth potential. These perturbations can bedetected relative to a smooth model using accurate measurements of flux ratios, relative position,and time delays between multiple images. This regime is sometimes referred to as millilensing,owing to the characteristic milliarcsecond Einstein radii expected for dwarf satellites of massivegalaxies. However, the phenomenon could span several orders of magnitude, depending on themass function of satellites and their spatial distribution (e.g., Kravtsov 2010).
94 Treu
Ann
u. R
ev. A
stro
. Ast
roph
ys. 2
010.
48:8
7-12
5. D
ownl
oade
d fr
om w
ww
.ann
ualr
evie
ws.
org
by U
nive
rsity
of
Mar
ylan
d -
Col
lege
Par
k on
08/
07/1
2. F
or p
erso
nal u
se o
nly.
AA48CH04-Treu ARI 23 July 2010 15:22
Microlensing: stronglensing producingimage separation oforder ofmicroarcseconds, thetypical scale ofindividual stars
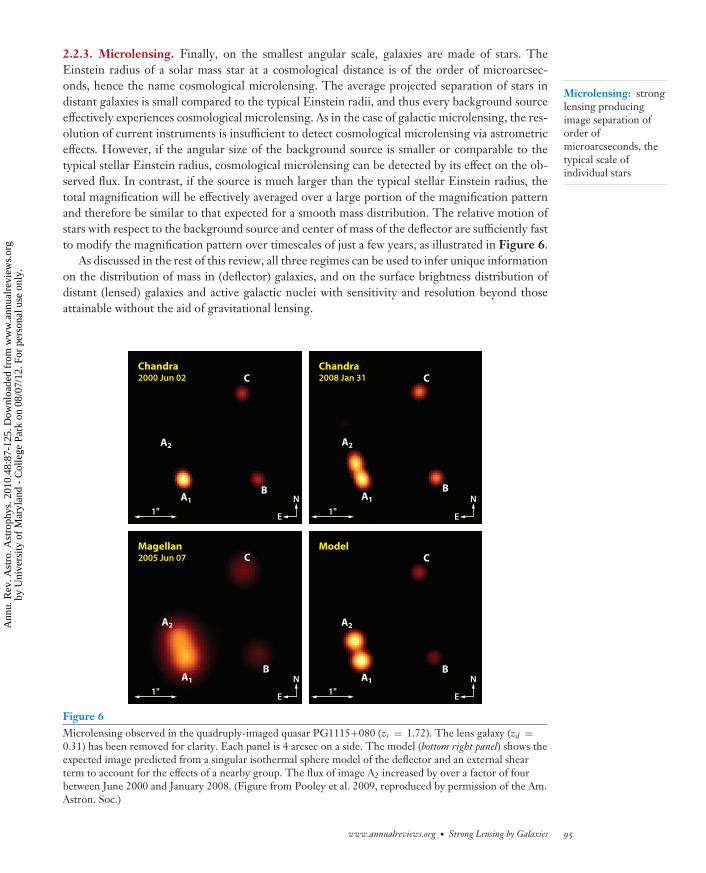
2.2.3. Microlensing. Finally, on the smallest angular scale, galaxies are made of stars. TheEinstein radius of a solar mass star at a cosmological distance is of the order of microarcsec-onds, hence the name cosmological microlensing. The average projected separation of stars indistant galaxies is small compared to the typical Einstein radii, and thus every background sourceeffectively experiences cosmological microlensing. As in the case of galactic microlensing, the res-olution of current instruments is insufficient to detect cosmological microlensing via astrometriceffects. However, if the angular size of the background source is smaller or comparable to thetypical stellar Einstein radius, cosmological microlensing can be detected by its effect on the ob-served flux. In contrast, if the source is much larger than the typical stellar Einstein radius, thetotal magnification will be effectively averaged over a large portion of the magnification patternand therefore be similar to that expected for a smooth mass distribution. The relative motion ofstars with respect to the background source and center of mass of the deflector are sufficiently fastto modify the magnification pattern over timescales of just a few years, as illustrated in Figure 6.
As discussed in the rest of this review, all three regimes can be used to infer unique informationon the distribution of mass in (deflector) galaxies, and on the surface brightness distribution ofdistant (lensed) galaxies and active galactic nuclei with sensitivity and resolution beyond thoseattainable without the aid of gravitational lensing.
Chandra2000 Jun 02
1" E
N1" E
N
1" E
N1" E
N
Chandra2008 Jan 31
Magellan2005 Jun 07
Model
A2 A2
A1
A2
A1
A1
A2
A1
B
B
B
B
C
C
C
C
Figure 6Microlensing observed in the quadruply-imaged quasar PG1115+080 (zs = 1.72). The lens galaxy (zd =0.31) has been removed for clarity. Each panel is 4 arcsec on a side. The model (bottom right panel) shows theexpected image predicted from a singular isothermal sphere model of the deflector and an external shearterm to account for the effects of a nearby group. The flux of image A2 increased by over a factor of fourbetween June 2000 and January 2008. (Figure from Pooley et al. 2009, reproduced by permission of the Am.Astron. Soc.)
www.annualreviews.org • Strong Lensing by Galaxies 95
Ann
u. R
ev. A
stro
. Ast
roph
ys. 2
010.
48:8
7-12
5. D
ownl
oade
d fr
om w
ww
.ann
ualr
evie
ws.
org
by U
nive
rsity
of
Mar
ylan
d -
Col
lege
Par
k on
08/
07/1
2. F
or p
erso
nal u
se o
nly.
AA48CH04-Treu ARI 23 July 2010 15:22
SDSS: Sloan DigitalSky Survey
SLACS: Sloan LensAdvanced Camera(for) Surveys
HST: Hubble SpaceTelescope
3. OBSERVATIONAL OVERVIEW
3.1. Present-Day Samples and Challenges
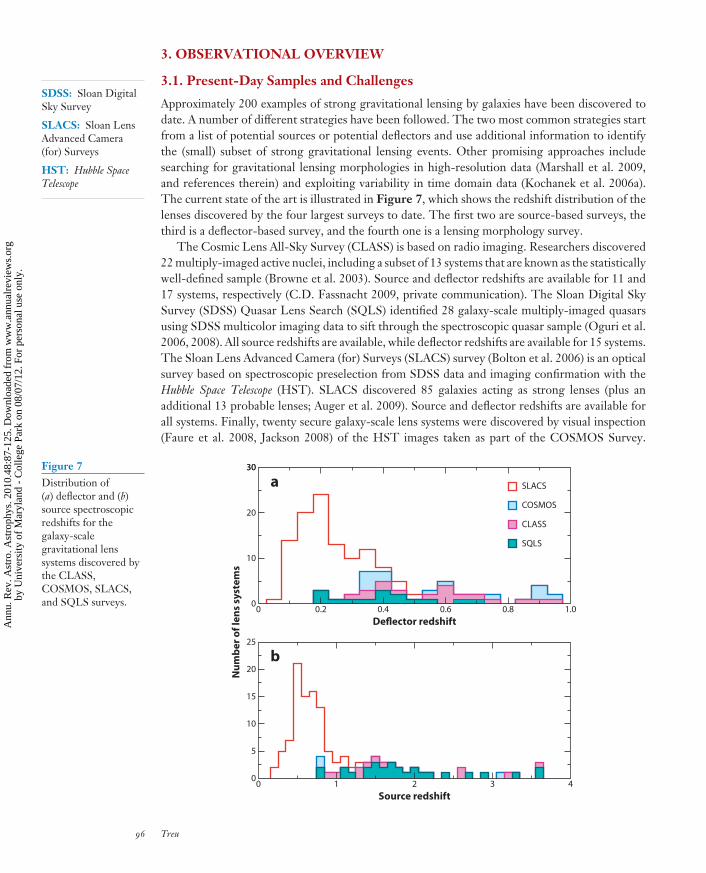
Approximately 200 examples of strong gravitational lensing by galaxies have been discovered todate. A number of different strategies have been followed. The two most common strategies startfrom a list of potential sources or potential deflectors and use additional information to identifythe (small) subset of strong gravitational lensing events. Other promising approaches includesearching for gravitational lensing morphologies in high-resolution data (Marshall et al. 2009,and references therein) and exploiting variability in time domain data (Kochanek et al. 2006a).The current state of the art is illustrated in Figure 7, which shows the redshift distribution of thelenses discovered by the four largest surveys to date. The first two are source-based surveys, thethird is a deflector-based survey, and the fourth one is a lensing morphology survey.
The Cosmic Lens All-Sky Survey (CLASS) is based on radio imaging. Researchers discovered22 multiply-imaged active nuclei, including a subset of 13 systems that are known as the statisticallywell-defined sample (Browne et al. 2003). Source and deflector redshifts are available for 11 and17 systems, respectively (C.D. Fassnacht 2009, private communication). The Sloan Digital SkySurvey (SDSS) Quasar Lens Search (SQLS) identified 28 galaxy-scale multiply-imaged quasarsusing SDSS multicolor imaging data to sift through the spectroscopic quasar sample (Oguri et al.2006, 2008). All source redshifts are available, while deflector redshifts are available for 15 systems.The Sloan Lens Advanced Camera (for) Surveys (SLACS) survey (Bolton et al. 2006) is an opticalsurvey based on spectroscopic preselection from SDSS data and imaging confirmation with theHubble Space Telescope (HST). SLACS discovered 85 galaxies acting as strong lenses (plus anadditional 13 probable lenses; Auger et al. 2009). Source and deflector redshifts are available forall systems. Finally, twenty secure galaxy-scale lens systems were discovered by visual inspection(Faure et al. 2008, Jackson 2008) of the HST images taken as part of the COSMOS Survey.
0 0.2 0.4 0.6 0.8 1.0
Num
ber o
f len
s sy
stem
s
20
30
10
0
25
20
15
10
5
00 1 2 3 4
Source redshift
Deflector redshift
SLACS
COSMOS
CLASS
SQLS
a
b
30Figure 7Distribution of(a) deflector and (b)source spectroscopicredshifts for thegalaxy-scalegravitational lenssystems discovered bythe CLASS,COSMOS, SLACS,and SQLS surveys.
96 Treu
Ann
u. R
ev. A
stro
. Ast
roph
ys. 2
010.
48:8
7-12
5. D
ownl
oade
d fr
om w
ww
.ann
ualr
evie
ws.
org
by U
nive
rsity
of
Mar
ylan
d -
Col
lege
Par
k on
08/
07/1
2. F
or p
erso
nal u
se o
nly.
AA48CH04-Treu ARI 23 July 2010 15:22
Source and deflector redshifts are available for 3 and 13 systems, respectively (D.J. Lagattuta,C.D. Fassnacht, M.W. Auger, P.J. Marshall, M. Bradac, et al., submitted).
The compilation is not complete, owing to the difficulty of keeping track of the ever-growingnumber of lenses discovered serendipitously or by ongoing concerted efforts (Cabanac et al. 2007,Marshall et al. 2009) that still lack confirmation and spectroscopic redshifts (a useful resource tofind data for lenses from a variety of sources is the online database of strong gravitational lensesCASTLES at URL http://www.cfa.harvard.edu/castles). However, the compilation gives a goodidea of the observational landscape and of the two main limitations of current samples. Firstly,most new lenses have been found at z � 0.4, which is a very favorable regime for detailed follow-up, but limits the look-back time baseline for evolutionary studies and the spatial scales probed bylensing. Secondly, many gravitational lens systems still lack source or deflector redshifts.
It is customary to classify strong lenses as galaxy-galaxy lenses (e.g., Figures 2 and 5), andgalaxy–quasi-stellar object (QSO) lenses (e.g., Figure 6), depending on whether an active galacticnucleus is present in the background source. Galaxy-QSO lenses are more rare on the sky thangalaxy-galaxy lenses (Marshall, Blandford & Sako 2005). However, they can be found efficiently byexploiting their radio emission and the variability of the point source. Furthermore, the compactpoint source enables studies of the granularity of the lens galaxy (from microlensing), and ofcosmography and lens galaxy structure (from direct measurements of time delays between images).Galaxy-galaxy lenses are typically more suited for the study of the deflector itself, because itsemission is not overwhelmed by the multiple images of the background source. Furthermore,the extended surface brightness of the source provides detailed information on the gravitationalpotential of the deflector.
It is observationally challenging to extract the wealth of information available from stronglensing systems. First and foremost, subarcsecond angular resolution is key to identifying andcharacterizing strong lensing systems. Radio or optical/near-IR observations from space (andrecently from the ground with adaptive optics) have been essential for the progress of the field.Secondly, both source and deflector redshifts are needed to transform angular quantities intomasses and lengths. Especially for the source redshift, long exposure on the largest telescopes aretypically required (e.g., Ofek et al. 2006). Success is not assured, and in many cases one must relyon photometric redshifts, which are also challenging because light from the foreground deflectorcomplicates photometry of the background source. Third, microlensing and variability dependcritically on source size. This makes X-ray (e.g., Pooley et al. 2009), and mid-IR observations(e.g., Agol et al. 2009)—probing sources that are much smaller and much larger than the scale ofmicrolensing, respectively—particularly useful, even with limited spatial resolution. Fourth, timedelays and microlensing studies require intensive monitoring campaigns, with all the associatedlogistical challenges. Last, depending on the application, ancillary data such as velocity dispersionor information on the local large scale structures are typically needed to break degeneracies andcontrol systematic errors.
3.2. Selection
Strong lensing is a very rare phenomenon. With present technology only ∼1/1,000 galaxies can bedetected as strong lenses (Marshall, Blandford & Sako 2005). Similarly, the optical depth is of theorder 10−3–104, i.e., �1/1,000 high-redshift sources in the sky have detectable multiple images(e.g., Browne et al. 2003). Both numbers depend strongly on the depth and resolution of theobservations. Thus, in order to generalize the results obtained from this technique to the overallpopulation of deflectors and sources, and for applications of strong lensing to cosmography, it isessential to understand the selection function very well.
www.annualreviews.org • Strong Lensing by Galaxies 97
Ann
u. R
ev. A
stro
. Ast
roph
ys. 2
010.
48:8
7-12
5. D
ownl
oade
d fr
om w
ww
.ann
ualr
evie
ws.
org
by U
nive
rsity
of
Mar
ylan
d -
Col
lege
Par
k on
08/
07/1
2. F
or p
erso
nal u
se o
nly.
AA48CH04-Treu ARI 23 July 2010 15:22
To first order, strong lensing galaxies can be described as selected by velocity dispersion.Most galaxy-scale strong gravitational lenses discovered to date are massive elliptical galaxies withvelocity dispersions in the range of 200–300 km s−1. This well-understood selection function arisesfrom the rapid increase in the strong lensing cross section with mass (∝ σ 4 for an SIS), and fromthe rapid decline of the velocity dispersion function of galaxies above 300 km s−1 (see Schneider,Kochanek & Wambsganss 2006 for a comprehensive discussion). As an example, the average stellarvelocity dispersion of the SLACS sample is 248 km s−1, with an rms. scatter of 46 km s−1. Thevelocity dispersion selection is also responsible for the adverse selection against late-type galaxies.Approximately 80% of the SLACS deflectors are pure ellipticals, 10% are lenticulars, and 10% arespirals, mostly bulge dominated (Auger et al. 2009). With sufficiently large surveys, it is possible toidentify and study galaxies with σ < 200 km s−1, acting as strong gravitational lenses. Small massdeflectors represent an exciting frontier for the next decade. However, this is an observationallychallenging problem because the image separation drops quickly below 0′′3−0′′4, the currentpractical limit for detection with HST and the Very Large Array (VLA). Furthermore, once theresolution drops significantly below the typical arcsecond size of distant galaxies, disentanglinglight from the deflector and background source becomes increasingly difficult, particularly atoptical/IR wavelengths.
The lensed sources are, to first-approximation, flux and surface-brightness selected. This trans-lates into a complex selection function in terms of the intrinsic properties of the source populationbecause of the magnification effects of lensing. It is easier to understand the effect for point sourcesurveys, such as CLASS and SQLS. Due to lensing magnification, sources that are fainter than thesurvey flux limit will enter the sample. However, magnification also reduces the solid angle actuallysurveyed. Therefore, the number of strong lensing events depends critically on the dependency ofthe surface density of sources on the observed flux. This effect is known as magnification bias. Forextended sources, observed magnification will also depend on surface brightness and size of thesource, generally being larger for more compact sources. The redshift distribution of the lensedsources will, in general, be different than that for a nonlensed population selected to the sameapparent magnitude limit.
Other more subtle selection effects are also at work. Factors that may affect the strong lensingcross-section of a galaxy include elongation along the line of sight, flattening of the projected massdistribution, concentration of the mass distribution (e.g., the slope of the mass-density profile atfixed virial mass), overdensity of the local environment, and abundance of small-scale structurein the plane of the deflector or along the line of sight. Factors that may affect the probability ofa source being identified as multiply imaged include extinction from the foreground lens galaxy,configuration of the multiple images (in particular image separation and flux ratios), time variabil-ity, and presence of emission lines and, hence, properties of the stellar populations or existence ofan active nucleus.
Three complementary strategies have been followed to quantify selection effects. One strategyconsists of starting from a realistic cosmological model and simulating the selection process fromfirst principles (e.g., Mandelbaum, van de Ven & Keeton 2009, and references therein). Thisis the most direct way to compare observations with theoretical models of galaxy formation.The challenge of this approach is that lensing selection depends on the details of the mass andsurface brightness distributions on scales much smaller than a galaxy. Unfortunately, realisticsimulations of the Universe on this scale are beyond our current capabilities. Therefore, oneneeds to rely on DM-only simulations and approximate the effects of baryons, with all associateduncertainties. A second strategy consists of comparing samples of lens galaxies with control samplesof nonlens galaxies. This approach was used with the SLACS sample to show that—once velocitydispersion and redshifts are matched—lens galaxies are indistinguishable within the uncertainties
98 Treu
Ann
u. R
ev. A
stro
. Ast
roph
ys. 2
010.
48:8
7-12
5. D
ownl
oade
d fr
om w
ww
.ann
ualr
evie
ws.
org
by U
nive
rsity
of
Mar
ylan
d -
Col
lege
Par
k on
08/
07/1
2. F
or p
erso
nal u
se o
nly.

AA48CH04-Treu ARI 23 July 2010 15:22
CDM: cold darkmatter
from twin galaxies selected from SDSS in terms of their size, surface brightness, luminosity,location on the fundamental plane, stellar mass, and local environment (Treu et al. 2006, 2009;Bolton et al. 2008a; Auger et al. 2009). This finding implies that the results from the SLACSsurvey can be applied to the overall population of velocity-dispersion-selected early-type galaxies.The strength of this method is its ability to take into account real selection functions with all theinherent complexity. This guarantees that one compares apples with apples, but does not solvethe problem of comparing with theoretical models. A “hybrid” approach consists of constructingsimple models starting from empirically-based information on the deflector and source populationsand combining it with lensing theory to compute the relevant selection function. This approach isextremely useful for developing an intuition for the process and computing approximate correctionfactors. For example, Oguri (2007) was able to explain the observed ratio of quadruply-imagedto doubly-imaged quasars in the CLASS sample in terms of magnification bias. The challengefor this approach is including a sufficiently accurate description of the physics and details of theobservations to infer quantitatively correct answers.
4. THE MASS STRUCTURE OF GALAXIES
The standard cosmological model, based on cold dark matter (CDM) and dark energy, repro-duces very well the observed structure of the Universe on supergalactic scales (e.g., Komatsu et al.2009, and references therein). At galaxy scales, DM and baryons interact to produce the observedvariety of galaxy properties. The situation is not so clear at small subgalactic scales, where po-tential conflicts between theory and observations have been suggested (e.g., Ellis & Silk 2009).Understanding the interplay between DM and baryons is crucial to make progress in developingand testing theories of galaxy formation at these scales. Gravitational lensing, by providing directand precise measurements of mass at galactic and subgalactic scales, is a fundamental tool foranswering a number of questions with profound implications on the existence and nature of DM.Do galaxies reside in DM halos? How do the properties of galaxies depend on those of their DMhalos? Are DM density profiles universal as predicted by simulations? These are the topics of thissection.
4.1. Luminous and Dark Matter in Early-Type Galaxies
4.1.1. Do early-type galaxies live in dark matter halos? It is commonly believed that all galaxieslive in DM halos. However, in the case of early-type galaxies, observational evidence is hard toobtain. The difficulty arises mostly from the paucity of mass tracers at radii much larger than theeffective radius Re—where DM dominates—and from the degeneracies inherent in interpretingprojected data in terms of a three-dimensional mass distribution for pressure-supported systems.Chief among these degeneracies is that between the total mass-density profile and the anisotropyof the pressure tensor (“mass-anisotropy” degeneracy, e.g., Treu & Koopmans 2002a).
Much progress in detecting DM halos has been achieved by studying the kinematics of stars,globular clusters, and cold and hot gas in nearby systems (e.g., Bertin & Stiavelli 1993, Humphreyet al. 2006). This type of study shows that DM halos are generally required to explain the dynamicsof massive early-type galaxies. Weak-lensing has been used to demonstrate the existence and tocharacterize the outer regions of DM halos for statistical samples of early-type galaxies out tointermediate redshifts (z ∼ 0.5, e.g., D.J. Lagattuta, C.D. Fassnacht, M.W. Auger, P.J. Marshall,M. Bradac, et al., submitted; Hoekstra et al. 2005, Gavazzi et al. 2007).
Strong lensing observations demonstrate the existence of DM halos around individual mas-sive early-type galaxies out to z ∼ 1 beyond any reasonable doubt, both by themselves and in
www.annualreviews.org • Strong Lensing by Galaxies 99
Ann
u. R
ev. A
stro
. Ast
roph
ys. 2
010.
48:8
7-12
5. D
ownl
oade
d fr
om w
ww
.ann
ualr
evie
ws.
org
by U
nive
rsity
of
Mar
ylan
d -
Col
lege
Par
k on
08/
07/1
2. F
or p
erso
nal u
se o
nly.
AA48CH04-Treu ARI 23 July 2010 15:22
IMF: initial massfunction
combination with other techniques (for early-type galaxies with σ � 200 km s−1 the case is muchless conclusive; future samples of low-mass deflectors may be needed to clarify matters). Oneargument is that the amount of mass inside the Einstein radius exceeds the stellar mass M∗. Thislatter quantity can be constrained in many ways. Assuming an initial mass function (IMF), stellarpopulation synthesis (SPS) models applied to photometric or spectroscopic data yield M∗ with anuncertainty of 0.1–0.2 dex. Alternatively, local dynamical studies of early-type galaxies (Gerhardet al. 2001, Cappellari et al. 2006) constrain the stellar mass-to-light ratio at present time, whichcan then be evolved back in time either using the measured evolution of the fundamental plane orother measurement of the star-formation history (e.g., Kochanek 1995, Treu & Koopmans 2004).
A particularly powerful combination for detecting DM halos is to use stellar kinematics of thelens galaxy to provide information on the distribution of mass in the high surface brightness regionswell within the effective radius and to use strong lensing to help remove the mass-anisotropydegeneracy (e.g., Treu & Koopmans 2004, Barnabe et al. 2009). A third method relies on assumingscaling relations to analyze lenses across a sample and reconstruct the mass-density profile for theensemble, which turns out to be more extended than expected if mass followed light and thereforeconsistent with DM (Rusin & Kochanek 2005, Bolton et al. 2008b). A fourth method exploitsmicrolensing statistics to demonstrate that point masses (i.e., stars) cannot contribute the totalityof the surface-mass density at the location of the multiple images (e.g., Pooley et al. 2009). A fifthmethod consists of measuring time delays between multiple images, determining angular-diameterdistances from independent cosmographic probes to infer the behavior of the mass-density profileat the location of the multiple images (Kochanek et al. 2006b).
4.1.2. What is the relative spatial distribution of luminous and dark matter? The efficiencywith which baryons condense inside halos to form stars, and their effect on the underlying DMdistribution, depend on the interplay between cooling and heating (e.g., from star formation andnuclear activity). Lensing can help us understand these processes by providing precise measure-ments of the fraction of total mass in the form of DM ( fDM) within a fixed projected radius,typically expressed in terms of a fraction of the effective radius (e.g., Jiang & Kochanek 2007).
Observationally, fDM is found to be non-negligible already at the effective radius (25 ± 6%Koopmans et al. 2006) and increasing toward larger radii (70 ± 10% at five effective radii, Treu& Koopmans 2004). Consistent results are obtained by a number of independent nonlensing tech-niques (e.g., Cappellari et al. 2006). In addition, fDM within a fixed fraction of the effective radiusis found to increase with galaxy stellar mass and velocity dispersion. For example, by comparinglensing masses with those inferred from SPS modeling of multicolor data, fDM inside the cylinderof projected radius equal to the Einstein radius increases from ∼25% to ∼75% in the range ofvelocity dispersion σ = 200–350 km s−1, or equivalently in the range of stellar mass between1011 and 1012 M (Auger et al. 2009; see also Figure 8). These numbers are based on a Salpeter(1955) IMF and are consistent with those inferred by local dynamical studies (e.g., Cappellari et al.2006). Adopting a Chabrier (2003) IMF changes the overall normalization, but not the global trend(Auger et al. 2009; see, however, Grillo et al. 2009 for a contrasting view).
Strong lensing studies also explain the origin of the so-called tilt of the fundamental plane (FP)(e.g., Ciotti, Lanzoni & Renzini 1996), the tight correlation between effective radius, effectivesurface brightness, and stellar velocity dispersion observed for early-type galaxies. By introducinga dimensional mass variable Mdim ≡ σ 2 Re/G, the FP can be cast in terms of an increasing effectivemass-to-light ratio with effective mass (the tilt). Exploiting strong lensing, a somewhat tighter massplane (MP) (Bolton et al. 2008b) relation can be obtained by replacing surface brightness withtotal surface mass. The MP is not tilted, implying that the tilt of the FP stems from an increase in
100 Treu
Ann
u. R
ev. A
stro
. Ast
roph
ys. 2
010.
48:8
7-12
5. D
ownl
oade
d fr
om w
ww
.ann
ualr
evie
ws.
org
by U
nive
rsity
of
Mar
ylan
d -
Col
lege
Par
k on
08/
07/1
2. F
or p
erso
nal u
se o
nly.

AA48CH04-Treu ARI 23 July 2010 15:22
f DM
(<R e ;
2D)
1.0
0.5
11.0 11.2 11.4 11.6 11.8 12.0
0
σSIE (km s–1)
f DM
(<R e ;
2D)
1.0
0.5
200 250 300 350
0
log M*/M
☉
Figure 8Dark matter fractioninside the cylinder ofprojected radiusequal to the Einsteinradius as inferredfrom stellarpopulation synthesismodeling ofmulticolor data andstrong gravitationallensing analysis ofthe SLACS sample(data from Augeret al. 2009).
fDM, with mass, and not in a systematic change, e.g., of the virial coefficient that connects Mdim tototal mass.
4.1.3. Mass-density profiles and the bulge-halo conspiracy. Another quantity of interest is theaverage logarithmic slope of the three-dimensional total mass-density profile d log ρtot/d log r ≡−γ ′. An isothermal mass model has γ ′ = 2. The total mass-density profile for a spherical modelis often expressed in terms of the equivalent circular velocity,
vc ≡√
GM (<r)r
, (10)
which facilitates comparison with the literature on spiral galaxies and on numerical simulations.For a spherical power-law density profile, γ ′ is simply related to the slope of the rotation curveby the relation d log vc /d log r = (2 − γ ′)/2. For this reason, an isothermal profile is sometimesreferred to as a flat rotation curve.
The basic result on this topic is that γ ′ ≈ 2, i.e., early-type lens galaxies have approximatelyisothermal mass-density profiles or close-to-flat equivalent rotation curves. This has been knownsince at least the early nineties, both on the basis of lensing studies (e.g., Kochanek 1995) andon local kinematics (e.g., Bertin & Stiavelli 1993, Gerhard et al. 2001, and references therein).However, in order to understand the mass structure of galaxies with a sufficient level of precisionto constrain formation models, we need to ask more detailed questions. What is the average γ ′
and its intrinsic scatter for the overall population of early-type galaxies? How does γ ′ depend onthe galactic radius or other global properties? Does it depend on the environment, as expected ifhalos were tidally truncated? Does γ ′ evolve with redshift? In addition, as we discuss in Section 6,determining the mass profiles of lens galaxies to high accuracy is essential for many applicationsto cosmography.
www.annualreviews.org • Strong Lensing by Galaxies 101
Ann
u. R
ev. A
stro
. Ast
roph
ys. 2
010.
48:8
7-12
5. D
ownl
oade
d fr
om w
ww
.ann
ualr
evie
ws.
org
by U
nive
rsity
of
Mar
ylan
d -
Col
lege
Par
k on
08/
07/1
2. F
or p
erso
nal u
se o
nly.

AA48CH04-Treu ARI 23 July 2010 15:22
log 10
(ρ)
log10 (r kpc –1)
01.02.0
1.02.0
1.02.0
1.02.0
1.02.0
0047 C0302 H1417 H1543 MG2016
–2
–4
0 0.5 1.0 1.5 0 0.5 1.0 1.5 0 0.5 1.0 1.5 0 0.5 1.0 1.5 0 0.5 1.0 1.5
Figure 9Mass-density profiles of lens galaxies inferred from a strong lensing and dynamical analysis. In addition tothe mass associated with the stars (red line), the data require a more extended mass component, identified asthe dark matter halo (blue line). Although neither component is a simple power law, the total mass profile isclose to isothermal, i.e., γ ′ = 2. The vertical dashed line identifies the location of the Einstein radius.(Figure from Treu & Koopmans 2004, reproduced by permission of the Am. Astron. Soc.)
In the past few years, the large number of lenses discovered and the high level of precisionattainable with lensing has enabled substantial breakthroughs. Joint lensing and dynamical studiesof the SLACS sample have shown that γ ′ = 2.08 ± 0.02 with an intrinsic scatter of less than 10%(Koopmans et al. 2009b). This result is valid in the sense of an average slope inside one effectiveradius or less, the typical size of the Einstein radius of SLACS lenses. For higher redshift deflectors,Einstein radii are typically larger than the effective radius and reach out to 5 Re. Although the highredshift samples with measured velocity dispersions are small, they seem to suggest a somewhatlarger intrinsic scatter around γ ′ = 2 (Treu & Koopmans 2004). No significant dependencyon galactic radius, global galaxy parameter, or redshift has been found so far based on lensingand dynamical analysis (Koopmans et al. 2009b). The small scatter around γ ′ = 2 is remarkableconsidering that neither the DM halo nor the stellar mass are well described by a simple power-lawprofile. Nevertheless, the two components add up to an isothermal profile (Figure 9). This effectis similar to the disk-halo conspiracy responsible for the flat rotation curves of spiral galaxies (vanAlbada & Sancisi 1986), and it has therefore been dubbed the “bulge-halo conspiracy.” Detaileddynamical studies of the two-dimensional velocity field of deflector galaxies in conjunction withstrong gravitational lensing confirm this picture to higher accuracy (Barnabe et al. 2009).
Similar and consistent results can be obtained directly from gravitational lens models, both forlensed sources covering a significant radial range (e.g., Dye & Warren 2005) or when a gravitationaltime delay has been measured and the cosmology is fixed by independent measurements (Kochaneket al. 2006b). An interesting case is that of the system SDSSJ0946+1006, where the presence oftwo multiply-imaged sources at different redshifts constrains the projected mass-density slope tobe γ ′ = 2.00 ± 0.03, based purely on lens modeling (Figure 10). The lack of central images alsoconstrains the slope of the total density profile to be steep (e.g., γ ′ = 2) in the central regionsof deflectors. It should be noted that lensing is mostly sensitive to the projected mass-densityslope at the location of the images, rather than the average inside the images. Therefore, a directcomparison with the lensing and dynamical results is only valid to the extent that a pure power-lawprofile is a good model for the data.
4.1.4. Are dark matter density profiles universal? Cosmological numerical simulations pre-dict that DM density profiles should be almost universal in their form (Navarro, Frenk & White
102 Treu
Ann
u. R
ev. A
stro
. Ast
roph
ys. 2
010.
48:8
7-12
5. D
ownl
oade
d fr
om w
ww
.ann
ualr
evie
ws.
org
by U
nive
rsity
of
Mar
ylan
d -
Col
lege
Par
k on
08/
07/1
2. F
or p
erso
nal u
se o
nly.

AA48CH04-Treu ARI 23 July 2010 15:22
a b
Double Einstein ring J0946 + 1006SDSSJ0946 + 1006
Strong lensing8
6
4
4 6 10 208
2
Light (baryons)
Radius (kpc)
Encl
osed
mas
s (1
011 M
☉)
Figure 10Double Einstein ring compound lens SDSSJ0946+1006.(a) Color composite Hubble Space Telescope image(Courtesy of M.W. Auger). Note the foreground main deflector in the center, the bright ring formed by theimages of the intermediate galaxy, and the fainter ring formed by the images of the background galaxy lensedby the two intervening objects. (b) Enclosed mass profile as inferred from the Einstein radii of the two rings(red solid points show that the error bars are smaller than the points). The enclosed mass increases moresteeply with radius than the enclosed light (solid blue line is rescaled by the best fit stellar mass-to-light ratio),indicating the presence of a more extended dark matter component. Even a “maximum bulge” solution(dotted blue line) cannot account for the mass at the outer Einstein radius.
1997, hereafter NFW). Simulated profiles are characterized by an inner slope d log ρDM /d log r =−γ ≈ −1. At the scales of spiral galaxies, low surface-brightness galaxies, and clusters of galax-ies, it has been shown that in a number of systems the observed profiles are shallower thanpredicted (i.e., γ < 1, e.g., Salucci et al. 2007, Sand et al. 2008). The discrepancy suggeststhat either the DM component or the effects of baryons on the underlying halos are poorlyunderstood.
In early-type galaxies the inner regions are completely dominated by stellar mass, makingthem particularly interesting systems for understanding the interplay between baryons and DM.Unfortunately, the dominance of baryons also makes the measurement more challenging. A jointlensing and dynamical analysis of 5 high-z lenses shows that γ is consistent with unity, albeit withlarge errors, and shallower slopes cannot be excluded (Treu & Koopmans 2004). Improving themeasurement will require larger samples of objects with good quality data and further constraintson the stellar mass-to-light ratio.
Alternatively, by imposing γ = 1 one can infer an absolute normalization of the stellar masscomponent and, thus, constrain the IMF of massive early-type galaxies to have a normalizationclose to that of a Salpeter IMF (Grillo et al. 2009, Treu et al. 2010). A joint lensing, dynami-cal, and stellar population analysis of the SLACS sample shows that massive early-type galaxiescannot have both a universal DM halo and universal IMF (Treu et al. 2010): Either the innerslope of the DM halo or the normalization of the IMF has to increase with deflector velocitydispersion.
www.annualreviews.org • Strong Lensing by Galaxies 103
Ann
u. R
ev. A
stro
. Ast
roph
ys. 2
010.
48:8
7-12
5. D
ownl
oade
d fr
om w
ww
.ann
ualr
evie
ws.
org
by U
nive
rsity
of
Mar
ylan
d -
Col
lege
Par
k on
08/
07/1
2. F
or p
erso
nal u
se o
nly.

AA48CH04-Treu ARI 23 July 2010 15:22
4.1.5. Implications for early-type galaxy formation. Massive early-type galaxies are simpledynamical systems with simple stellar populations. Yet, their formation and evolution is still farfrom being well understood. The standard CDM model postulates their formation via majormergers, but this is hard to reconcile with their uniformly old stellar populations—unless thereis some fine-tuned feedback mechanism that prevents star formation in the high-mass systems(see Renzini 2006, for a recent review)—and with the slow observed evolution of their stellarmass function since z ∼ 1. Recently, collisionless mergers not involving gas and star formation(and are therefore “dry”) have become increasingly popular as a possible mechanism of growth.Furthermore, dry mergers can grow galaxies in size faster than in velocity dispersion. Thereforethey have been suggested as a possible mechanism for the evolution of ultradense massive galaxiesat high redshift into the more diffuse ones found in the local Universe (van der Wel et al. 2009).
Strong lensing studies give us some direct information on the connection between baryons andDM, and therefore offer us new insights into this problem. The (nonevolving) isothermality of thetotal mass-density profile requires an early dissipative phase to steepen the NFW profiles predictedin CDM-only simulations. Alternatively, an initial collapse associated with incomplete violentrelaxation could have established the isothermality of the inner profiles. Either phenomenonmust have occurred well before z ∼ 1. After the initial formation, further growth by dry mergerspreserves the isothermal profile and tightness of the mass plane (Koopmans et al. 2006; Nipoti,Treu & Bolton 2009). However, dry mergers do not preserve the tight correlations between sizeand total mass and velocity dispersion and total mass (Nipoti, Treu & Bolton 2009). The observedtightness of the correlation limits the growth by dry mergers to have been at most a factor of twosince z ∼ 2, unless there is a large degree of fine tuning between orbital parameters of the mergerand location in the size-mass-velocity dispersion space. Therefore, it seems most likely that themajority of the mass assembly must have occurred during the initial dissipative phase associatedwith the dominant episode of star formation.
The other main strong lensing result, i.e., the correlation between DM fraction and velocitydispersion (stellar mass), provides us with another piece of the puzzle. Dry mergers increase fDM
(Nipoti, Treu & Bolton 2009), thus creating part of the trend. However, dry mergers cannotexplain the whole trend, which must be largely established early on through other means. Ascenario where the time since major initial collapse increases with present-day mass could explainthe trend in terms of the evolution of the density of the Universe with cosmic time (Thomas et al.2009). The correlation between present-day mass and epoch of major mass assembly could alsohelp explain the correlations between present-day mass, age, and chemical composition of thestellar populations (Treu et al. 2005).
It should be noted that the conclusions above hold only for the most massive early-type galaxies.At lower masses, evolution is certainly more recent, and other secular or environmentally drivenmechanisms could be responsible for forming early-type galaxies (e.g., Bundy, Treu & Ellis 2007).
4.2. Luminous and Dark Matter in Spiral Galaxies
Massive DM halos around local spiral galaxies are readily detected from the gas kinematics atlarge radii (van Albada & Sancisi 1986). The total gravitational potential can be reconstructedaccurately from the observed velocity field. However, decomposing the total mass distributioninto its baryonic and dark components for individual galaxies is still an unsolved problem, largelybecause the stellar mass-to-light ratio is uncertain by a factor of ∼2–3 for young and dusty stellarpopulations. In the distant Universe, the problem is compounded by observational difficulties: HI
becomes prohibitively expensive to detect; optical rotation curves can be measured out to z ∼ 1but are limited by cosmological surface brightness dimming as well as angular resolution. One
104 Treu
Ann
u. R
ev. A
stro
. Ast
roph
ys. 2
010.
48:8
7-12
5. D
ownl
oade
d fr
om w
ww
.ann
ualr
evie
ws.
org
by U
nive
rsity
of
Mar
ylan
d -
Col
lege
Par
k on
08/
07/1
2. F
or p
erso
nal u
se o
nly.

AA48CH04-Treu ARI 23 July 2010 15:22
JWST: James WebbSpace Telescope
approach consists of assuming that the baryonic component is maximally important, the so-calledmaximum-disk ansatz (van Albada & Sancisi 1986). However, it is not clear that disks are indeedmaximal. Indeed, submaximal disks seem to be suggested by a variety of arguments (e.g., Courteau& Rix 1999), even though the unknown IMF is a dominant source of uncertainty (Bell & de Jong2001). Understanding the relative mass in disks and halos is critical to formulate and test a robusttheory of disk-galaxy formation (e.g., Dutton et al. 2007).
Gravitational lensing provides a new tool for luminous and DM decomposition in spiral galax-ies. Two factors make lensing particularly useful in this respect. First, it measures the total projectedmass within a cylinder. This can then be combined with the enclosed mass in 3D inferred from diskkinematics to break the disk-halo degeneracy by exploiting the different radial dependency of thetwo components (e.g., Maller, Flores & Primack 1997). Secondly, gravitational lensing providesazimuthal information that also helps pin down the relative contribution of the two, especially ifthey are misaligned.
Strong lensing studies of spiral galaxies have shown encouraging results, although the impactof the conclusions is limited by the small size of current samples. For example, Trott et al. (2010)combined lensing constraints, high-resolution imaging data, and optical and radio kinematicsto decompose the mass profile of the Einstein Cross lens galaxy into its bulge, disk, and halocomponents (see also G. van de Venn, J. Falcon-Barroso, R.M. McDermid, M. Cappellari, B.W.Miller, et al., submitted). The mass-to-light ratio of the bulge is very well constrained (M/LB =6.6 ± 0.3 in solar units). Due to the unusually small Einstein radius of this system, the mass ofthe disk is less well constrained, although it is clearly submaximal, contributing 45 ± 11% ofrotational support at 2.2-scale lengths.
The situation is changing rapidly, due to progress in strong lensing searches. SLACS discoveredapproximately seven new bulge-dominated spiral lenses and an ongoing search based on a similarstrategy (SWELLS; HST-GO-11978) should find as many edge-on late-type spirals. Dedicatedsearches (e.g., Feron et al. 2009, Marshall et al. 2009) should discover tens of new systems in thenext few years. At variance with the smoothness of early-type galaxies, the small-scale structureof the surface brightness of the spiral lens due to dust and inhomogeneous stellar populationscomplicates the identification and modeling of multiply-imaged parts of the background source.High-resolution near-IR images with adaptive optics or with HST and James Webb Space Telescope( JWST), coupled with multicolor optical data, or in the radio, will be essential to make progresson this front (Figure 11).
5. SUBSTRUCTURE IN GALAXIES AND THE“EXCESS SUBHALOS” PROBLEM
5.1. Background
In the standard cosmology, DM halos host a hierarchy of subhalos, also known as DM substructure.The number of subhalos above a given mass scales approximately as the total mass of the parenthalo, and the logarithmic slope of the subhalo mass function is approximately dN/dMsub ∝ M −αsub
sub ,with αsub = 1.9 ± 0.1 (Diemand et al. 2008, Springel et al. 2008). Remarkably, the normalizeddistribution of substructure depends very little on the overall scale of the halo, therefore we wouldexpect approximately the same abundance of satellites around clusters and galaxies.
Although realistic simulations including baryons and nongravitational effects have yet to beperformed at this scale, it is currently believed that the statistical properties of the substructureinferred from N-body simulations should be robust enough to allow for a direct comparison with
www.annualreviews.org • Strong Lensing by Galaxies 105
Ann
u. R
ev. A
stro
. Ast
roph
ys. 2
010.
48:8
7-12
5. D
ownl
oade
d fr
om w
ww
.ann
ualr
evie
ws.
org
by U
nive
rsity
of
Mar
ylan
d -
Col
lege
Par
k on
08/
07/1
2. F
or p
erso
nal u
se o
nly.

AA48CH04-Treu ARI 23 July 2010 15:22
K-band Keck LGS-AO
a bB, V, I-band HST-WFPC2
1.5 arcsec
Figure 11Example of edge-on spiral lens system (zd = 0.063) discovered by the SWELLS Survey. Themultiply-imaged source (zs = 0.637) is visible in (a) the optical Hubble Space Telescope discovery image andreadily apparent in the (b) Keck near-IR image where the effects of dust are minimized. The combinedinformation at multiple wavelengths allows one to correct for dust and infer the stellar mass of the disk(Image credits: A. Dutton, P. Marshall, T. Treu).
observations (e.g., Kravtsov 2010, and references therein). For these reasons such a comparisonmay provide one of the most stringent and direct tests of the CDM paradigm at subgalactic scales.
At variance with the results of simulations, the abundance of luminous satellites observed aroundreal clusters and galaxies are very different. Whereas clusters of galaxies host thousands of galaxieswithin their own DM halos, fewer satellites are generally seen around galaxies. In particular, themass function of the luminous satellites of the Milky Way differs dramatically from that of thesubhalos of a typical simulated halo of comparable mass. At the high-mass end of the distribution(virial Msub ∼ 109 M) the observed number of satellites is comparable, or perhaps even slightlylarger, than expected. However, the mass function of the halos of the observed satellites is foundto be much shallower than that predicted for subhalos, resulting in a dramatic shortfall at lowermasses, i.e., below 108 M. This discrepancy between theory and observations has been knownfor more than a decade (Klypin et al. 1999, Moore et al. 1999) and has not been solved by therevolutionary discovery of low-luminosity satellites of the Milky Way by SDSS nor by advancesin numerical simulations. An up-do-date summary of the current state of the problem is given byKravtsov (2010).
5.2. Possible Solutions
There are two classes of possible explanations for the so-called excess subhalos problem (or “miss-ing satellites problem” if you are a theorist). One possible explanation is that substructure exists,but it is dark, i.e., subhalos do not form enough stars to be detected. This explanation impliesthat the conversion of baryons into stars is inefficient for small halos. It is hard to explain thisinefficiency with the known mechanisms of supernovae feedback or the effect of the UV ioniz-ing background (Kravtsov 2010). Alternatively, it is possible that subhalos are not as abundant aspredicted by numerical simulations. This explanation would imply a major revision of the stan-dard CDM paradigm, either reducing the amplitude of fluctuations on the scales of satellites orchanging the nature of DM from cold to warm (Miranda & Maccio 2007). Either explanation hasfar-reaching implications. In order to be viable, the first explanation requires a clear improvement
106 Treu
Ann
u. R
ev. A
stro
. Ast
roph
ys. 2
010.
48:8
7-12
5. D
ownl
oade
d fr
om w
ww
.ann
ualr
evie
ws.
org
by U
nive
rsity
of
Mar
ylan
d -
Col
lege
Par
k on
08/
07/1
2. F
or p
erso
nal u
se o
nly.
AA48CH04-Treu ARI 23 July 2010 15:22
in our understanding of galaxy formation. In its most extreme version, the second explanation mayrequire a rethinking of the paradigm.
Gravitational lensing provides a unique insight into this problem, because it is arguably theonly way to detect dark substructure, measure its mass function, and compare it with the predictionof CDM numerical simulations. Even if advances in theories of galaxy formation could explainthe luminosity function of Milky Way satellites, there would be still be a robust and falsifiableprediction of large numbers of darker satellites to be tested.
If the mass function of subhalos turns out to be different than that predicted by simulations,a major revision of the theory would be required, possibly requiring warm DM, although it isnot clear that would necessarily be compatible with all other constraints (see Kravtsov 2010, andreferences therein).
5.3. Flux Ratio Anomalies
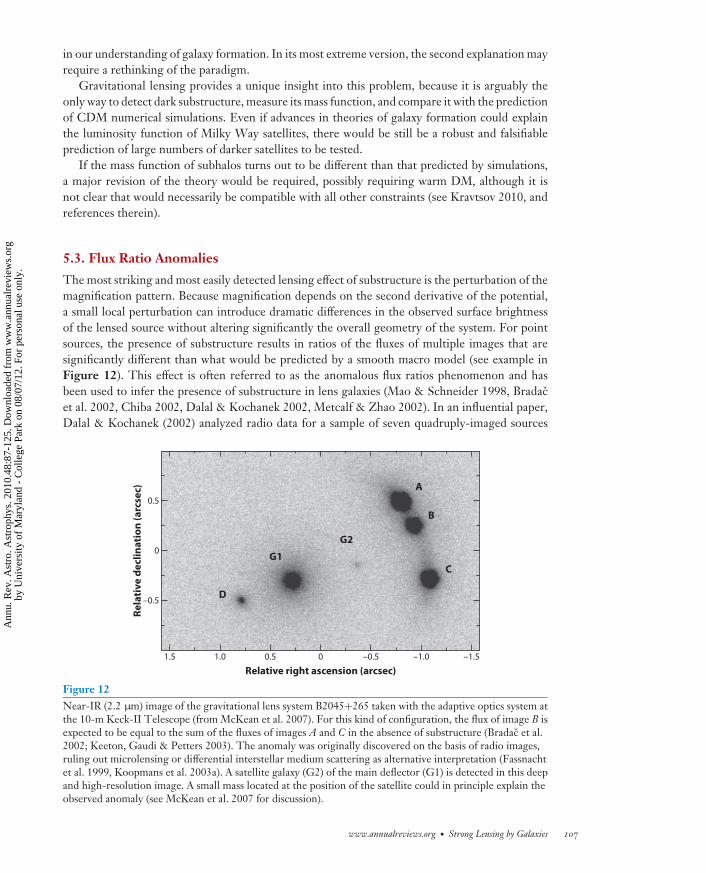
The most striking and most easily detected lensing effect of substructure is the perturbation of themagnification pattern. Because magnification depends on the second derivative of the potential,a small local perturbation can introduce dramatic differences in the observed surface brightnessof the lensed source without altering significantly the overall geometry of the system. For pointsources, the presence of substructure results in ratios of the fluxes of multiple images that aresignificantly different than what would be predicted by a smooth macro model (see example inFigure 12). This effect is often referred to as the anomalous flux ratios phenomenon and hasbeen used to infer the presence of substructure in lens galaxies (Mao & Schneider 1998, Bradacet al. 2002, Chiba 2002, Dalal & Kochanek 2002, Metcalf & Zhao 2002). In an influential paper,Dalal & Kochanek (2002) analyzed radio data for a sample of seven quadruply-imaged sources
Rela
tive
dec
linat
ion
(arc
sec)
–0.5
–0.50.5 0
Relative right ascension (arcsec)–1.01.0 –1.51.5
0.5
0
B
C
D
A
G1
G2
Figure 12Near-IR (2.2 μm) image of the gravitational lens system B2045+265 taken with the adaptive optics system atthe 10-m Keck-II Telescope (from McKean et al. 2007). For this kind of configuration, the flux of image B isexpected to be equal to the sum of the fluxes of images A and C in the absence of substructure (Bradac et al.2002; Keeton, Gaudi & Petters 2003). The anomaly was originally discovered on the basis of radio images,ruling out microlensing or differential interstellar medium scattering as alternative interpretation (Fassnachtet al. 1999, Koopmans et al. 2003a). A satellite galaxy (G2) of the main deflector (G1) is detected in this deepand high-resolution image. A small mass located at the position of the satellite could in principle explain theobserved anomaly (see McKean et al. 2007 for discussion).
www.annualreviews.org • Strong Lensing by Galaxies 107
Ann
u. R
ev. A
stro
. Ast
roph
ys. 2
010.
48:8
7-12
5. D
ownl
oade
d fr
om w
ww
.ann
ualr
evie
ws.
org
by U
nive
rsity
of
Mar
ylan
d -
Col
lege
Par
k on
08/
07/1
2. F
or p
erso
nal u
se o
nly.

AA48CH04-Treu ARI 23 July 2010 15:22
and reported the detection of a surface mass fraction in the form of substructure between 0.6%and 7%. This observed fraction appears to be even higher than the mass fraction in substructureat the Einstein radius predicted by simulations (Mao et al. 2004, Xu et al. 2009).
Substantial efforts have been devoted to investigating whether satellite-size halos are the mostlikely explanation of the observed flux ratio anomalies. Indeed, flux ratio anomalies could also arisefrom other effects such as microlensing—if the source is sufficiently compact—or a nonuniforminterstellar medium, which could variously affect light propagating along different paths. However,both contaminants are wavelength-dependent, whereas flux ratio anomalies due to the substructureare achromatic. Therefore, observations at multiple wavelengths, especially radio, narrow emissionlines, and mid-IR, can be used to show that the the anomalous flux ratios are effectively due tosubstructures on scales much larger than stars (e.g., Agol, Jones & Blaes 2000; Moustakas &Metcalf 2003; Kochanek & Dalal 2004). Angular structure in the macro model has been suggestedas a possible cause for flux ratio anomalies (Evans & Witt 2003). However, in the cases whenenough azimuthal information is available, it has been shown that the angular structure of lensgalaxies is fairly simple and well approximated by an ellipse (Yoo et al. 2006). Elegant argumentsbased on the local curvature of the time-delay surface near the multiple images have also beenused to show that anomalous flux ratios are indeed due to mass substructure (Kochanek & Dalal2004, Chen 2009). A final source of concern is potential contamination from substructure alongthe line of sight, which could mimic the effects of true galactic satellites (Chen, Kravtsov & Keeton2003; Chen 2009). Line-of-sight contamination is most likely not the main cause of the anomaliesobserved so far. However, it is clear that line-of-sight contamination needs to be better understoodand quantified in order to extract the maximum amount of information from this powerful tool.
An important question is whether the detected substructure is dark or luminous. In somecases (e.g., Koopmans et al. 2002; McKean et al. 2007; MacLeod, Kochanek & Agol 2009), ithas been shown that mass associated with luminous satellites can explain the observed anomalies.Whether luminous substructure can explain all the known anomalies is still a matter of debate(Chen 2009). On a case-by-case basis, the role of luminous satellites is difficult to quantify becausethey are hard to detect in the vicinity of the bright lensed quasars, where they would be mosteffective in introducing anomalies. In addition to high-resolution HST or adaptive optics images,an accurate determination of the luminosity function and spatial distribution of luminous satellitesof (nonlensing) massive galaxies may be a way to make progress. The challenge is to collect largeenough samples of nonlenses while carefully matching the selection process of the sample of lenses.It is important to stress that the detection of optical counterparts does not undermine the quest forsubstructure using gravitational lensing. Measuring the mass function of satellites—whether theyare visible or not—is essential to test the CDM paradigm. Comparing the satellite mass functionwith their luminosity function will only help in answering some of the questions related to themechanisms that regulate star formation.
The detection of substructure via anomalous flux ratios is an example of the power of gravita-tional lensing in measuring the distribution of mass in the Universe. However, the strong lensingstudies to date suffer from two fundamental limitations, which need to be overcome in order tomake progress. The first limitation is poor and uncertain statistics. Not only is the number ofsystems that can be used to study anomalous flux ratios tiny, but the selection function is poorlycharacterized. Therefore, the uncertainties are large and the results could be biased. The secondmajor limitation is the limited mass sensitivity achieved so far, which is only sufficient to probethe upper end of the mass function of subhalos.
Major improvements on both aspects are under way and significant progress is possible in thenext few years. One key factor is the increase in the number of known lenses, discovered with awell-defined selection algorithm, coupled with the increased capability for follow-up. In the next
108 Treu
Ann
u. R
ev. A
stro
. Ast
roph
ys. 2
010.
48:8
7-12
5. D
ownl
oade
d fr
om w
ww
.ann
ualr
evie
ws.
org
by U
nive
rsity
of
Mar
ylan
d -
Col
lege
Par
k on
08/
07/1
2. F
or p
erso
nal u
se o
nly.
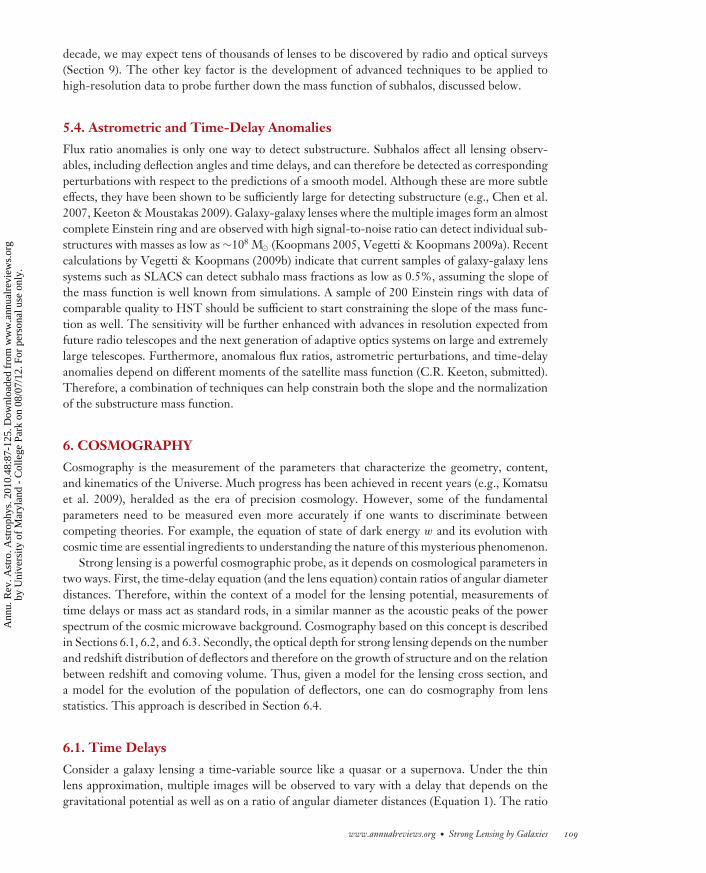
AA48CH04-Treu ARI 23 July 2010 15:22
decade, we may expect tens of thousands of lenses to be discovered by radio and optical surveys(Section 9). The other key factor is the development of advanced techniques to be applied tohigh-resolution data to probe further down the mass function of subhalos, discussed below.
5.4. Astrometric and Time-Delay Anomalies
Flux ratio anomalies is only one way to detect substructure. Subhalos affect all lensing observ-ables, including deflection angles and time delays, and can therefore be detected as correspondingperturbations with respect to the predictions of a smooth model. Although these are more subtleeffects, they have been shown to be sufficiently large for detecting substructure (e.g., Chen et al.2007, Keeton & Moustakas 2009). Galaxy-galaxy lenses where the multiple images form an almostcomplete Einstein ring and are observed with high signal-to-noise ratio can detect individual sub-structures with masses as low as ∼108 M (Koopmans 2005, Vegetti & Koopmans 2009a). Recentcalculations by Vegetti & Koopmans (2009b) indicate that current samples of galaxy-galaxy lenssystems such as SLACS can detect subhalo mass fractions as low as 0.5%, assuming the slope ofthe mass function is well known from simulations. A sample of 200 Einstein rings with data ofcomparable quality to HST should be sufficient to start constraining the slope of the mass func-tion as well. The sensitivity will be further enhanced with advances in resolution expected fromfuture radio telescopes and the next generation of adaptive optics systems on large and extremelylarge telescopes. Furthermore, anomalous flux ratios, astrometric perturbations, and time-delayanomalies depend on different moments of the satellite mass function (C.R. Keeton, submitted).Therefore, a combination of techniques can help constrain both the slope and the normalizationof the substructure mass function.
6. COSMOGRAPHY
Cosmography is the measurement of the parameters that characterize the geometry, content,and kinematics of the Universe. Much progress has been achieved in recent years (e.g., Komatsuet al. 2009), heralded as the era of precision cosmology. However, some of the fundamentalparameters need to be measured even more accurately if one wants to discriminate betweencompeting theories. For example, the equation of state of dark energy w and its evolution withcosmic time are essential ingredients to understanding the nature of this mysterious phenomenon.
Strong lensing is a powerful cosmographic probe, as it depends on cosmological parameters intwo ways. First, the time-delay equation (and the lens equation) contain ratios of angular diameterdistances. Therefore, within the context of a model for the lensing potential, measurements oftime delays or mass act as standard rods, in a similar manner as the acoustic peaks of the powerspectrum of the cosmic microwave background. Cosmography based on this concept is describedin Sections 6.1, 6.2, and 6.3. Secondly, the optical depth for strong lensing depends on the numberand redshift distribution of deflectors and therefore on the growth of structure and on the relationbetween redshift and comoving volume. Thus, given a model for the lensing cross section, anda model for the evolution of the population of deflectors, one can do cosmography from lensstatistics. This approach is described in Section 6.4.
6.1. Time Delays
Consider a galaxy lensing a time-variable source like a quasar or a supernova. Under the thinlens approximation, multiple images will be observed to vary with a delay that depends on thegravitational potential as well as on a ratio of angular diameter distances (Equation 1). The ratio
www.annualreviews.org • Strong Lensing by Galaxies 109
Ann
u. R
ev. A
stro
. Ast
roph
ys. 2
010.
48:8
7-12
5. D
ownl
oade
d fr
om w
ww
.ann
ualr
evie
ws.
org
by U
nive
rsity
of
Mar
ylan
d -
Col
lege
Par
k on
08/
07/1
2. F
or p
erso
nal u
se o
nly.
AA48CH04-Treu ARI 23 July 2010 15:22
H0
H0
w
w
ΩΛ
ΩΛ
w
30 50
0
0.4
0.8
70 90 110
30 50 70 90 110
–1.8 –1.0
–1.0
–0.8
–1.8
–0.2
–1.8 –1.0 –0.2
0.2 0.6 1.0
0.2 0.6 1.0
WMAPw + B1608 + 656
WMAPw
UNIFORMw + B1608 + 656
Figure 13Illustration of cosmography with gravitational time delays. The panels show two- and one-dimensionalposterior probability distribution functions for H0, w, and ��, assuming flatness. Red lines indicate limitsfrom cosmic microwave background (CMB) and blue lines represent limits obtained from a singlegravitational lens system with measured time delays (B1608+656), while black lines represent the jointconstraints. Note how the constraints from time delays are almost vertical in H0 and therefore help break thedegeneracy between w and H0 in the CMB data. Lensing constraints in the w − �� are broad and thereforenot shown for clarity. (Figure courtesy of S.H Suyu; data from Suyu et al. 2010.)
CMB: cosmicmicrowavebackground
of angular diameter distances is mostly sensitive to the Hubble Constant H0 (hereafter h in unitsof 100 km s−1 Mpc−1). However, time delays also contain non-negligible information about othercosmological parameters, especially if one considers a sample of deflectors and sources spanninga range of redshifts (e.g., Coe & Moustakas 2009). Therefore, although it is convenient to thinkin terms of the Hubble constant as the primary parameter, time delays provide constraints in themultidimensional cosmological parameter space. When combined with other cosmology probeslike the cosmic microwave background (CMB) power spectrum, time delays are very effective atbreaking degeneracies such as that between H0 and w (Figure 13).
From a practical point of view, cosmography with time delays can be broken into two separateproblems: measuring time delays and modeling the lensing potential, including matter along theline of sight. Uncertainties in these two terms dominate the error budget and they are independent.Therefore, in order to measure H0 to 1% accuracy from one lens system, one needs to knowboth quantities with subpercent accuracy. Or, for a sample of N lenses, one needs unbiasedmeasurements with approximately half
√N % uncertainty on both quantities.
6.1.1. Measuring time delays. Measuring time delays requires properly sampled light curvesof duration significantly longer than the time delay between multiple images. Once an
110 Treu
Ann
u. R
ev. A
stro
. Ast
roph
ys. 2
010.
48:8
7-12
5. D
ownl
oade
d fr
om w
ww
.ann
ualr
evie
ws.
org
by U
nive
rsity
of
Mar
ylan
d -
Col
lege
Par
k on
08/
07/1
2. F
or p
erso
nal u
se o
nly.
AA48CH04-Treu ARI 23 July 2010 15:22
approximate time delay is known, the measurement can generally be refined by adapting themonitoring strategy, e.g., with dense sampling triggered after an event on the leading image.Typical time delays for galaxy lens systems are in the range of weeks to months (with tails on bothends out to hours to years), and minimum detectable amplitudes from the ground are of order∼5%, limited by photometric accuracy for crowded sources and microlensing (see Section 7.3).Thus, accurate time delays typically require several seasons of dedicated monitoring effort.
After the first “heroic” campaigns of the 1990s and early 2000s (see Schneider, Kochanek &Wambsganss 2006 for a review), which yielded of order 10 time delays, several groups are nowtrying to take this effort to the next level with the help of queue mode scheduling and robotictelescopes. A recent summary of published time-delay measurements is given by Jackson (2007).Two new time delays have been published since then ( J1206+4332 and J2033−4723) (Vuissozet al. 2008; Paraficz, Hjorth & Elıasdottir 2009). Taking the published time-delay uncertaintiesat face value, the present sample could in principle be combined for a total error budget on H0
a little less than 1%. As is discussed in Section 9, time-domain astronomy is a rapidly growingfield and it is likely that many of the logistical problems faced by time-delay hunters so far will besolved in the next decade.
6.1.2. Determination of the lensing potential. We now turn to errors associated with thelocal lensing potential under the single screen approximation (matter along the line of sightand associated uncertainties will be described in Section 6.1.3). At fixed image configuration,time delays depend to first approximation on the effective slope of the mass distribution in theannular region between the multiple images (see Saha & Williams 2006; Schneider, Kochanek &Wambsganss 2006; and references therein for discussion). For generic power-law models, at fixedlensing observables, the inferred H0 scales as H0(γ ′) ≈ (γ ′ − 1)H0(γ ′ = 2). For many systems,especially doubly-imaged point sources, the lensing potential is highly uncertain and dominatesthe error budget. Unaccounted-for uncertainties in the mass model are the main culprits for thereported discrepancies between time-delay determinations of H0 as large as ∼30% (e.g., Treu &Koopmans 2002b).
It is clear that some additional information is needed to bring the error budget on the lens mod-eling in line with that from time delays. One approach consists of asserting some prior knowledgeof the mass distribution in the deflectors and applying it to the analysis of a sample of systems.Because the effective slope is poorly constrained by lens data for point-like sources without ad-ditional information, the results depend critically on the prior. Following this approach, Oguri(2007) modeled 16 systems with power-law models assuming a Gaussian prior on γ ′ centered on2 and width 0.15, obtaining h = 0.68 ± 0.08 (the large systematic error attempts to reflect thelarge dispersion from system to system; however, it may also be due to the inclusion of systemswith questionable redshift time delay, or embedded in a complex cluster potential, which carriessubstantial additional modeling uncertainties). The prior on γ ′ is plausible but not strictly justified,because there are no independent measurements for the sample. For example, just changing themean of the prior to 〈γ ′〉 = 2.085+0.025
−0.018 ± 0.1, as found for the SLACS sample, would increasethe estimate of H0 by 8%, with an additional systematic uncertainty of 10%. A very similar ap-proach is that by Coles (2008), who imposes geometric priors to his pixelized mass reconstructionsand obtains h = 0.71+0.06
−0.08 from 11 systems. Although it would be useful to draw samples fromthe Coles (2008) prior and measure the effective distribution of γ ′, it appears that his smooth-ness and steepness constraints create a distribution of effective slopes similar to that of Oguri(2007), explaining the agreement. These results are encouraging. However, they illustrate thechallenge of reaching 1% accuracy using this methodology. One needs to have sufficient external
www.annualreviews.org • Strong Lensing by Galaxies 111
Ann
u. R
ev. A
stro
. Ast
roph
ys. 2
010.
48:8
7-12
5. D
ownl
oade
d fr
om w
ww
.ann
ualr
evie
ws.
org
by U
nive
rsity
of
Mar
ylan
d -
Col
lege
Par
k on
08/
07/1
2. F
or p
erso
nal u
se o
nly.
AA48CH04-Treu ARI 23 July 2010 15:22
knowledge of the distribution of mass in the sample of galaxies with measured time delays toconstruct a sufficiently accurate prior.
A more direct approach is to extract additional information for the very systems with measuredtime delays using ancillary data in addition to those available for the multiply-imaged point sources.In Bayesian terms, this means making the likelihood more constraining so as to reduce the relativeimportance of the prior. Following this approach, Wucknitz, Biggs & Browne (2004) modeledthe extended radio structure around the lensed quasar in B0218+357 to infer γ ′ = 1.96 ±0.02 and h = 0.78 ± 0.03. Koopmans et al. (2003b) modeled B1608+656 using the measuredstellar velocity dispersion and the HST images of the lensed host galaxy to measure γ ′ and inferh = 0.75+0.07
−0.06 ± 0.03, fixing �m = 0.3 and �� = 0.7 and negelecting uncertainties due to the mass-sheet degeneracy (discussed in the next section). A recent analysis of improved Keck and HST dataof B1608+656 by Suyu et al. (2010) using more general pixelated models for the potential and thesource infers h = 0.706 ± 0.031 for the same cosmology as Koopmans et al. (2003b), includinguncertainties related to the mass-sheet degeneracy. This result shows that modeling errors canbe reduced to a few percent per lens system if sufficient observational constraints are available.If the other cosmological parameters are allowed to vary, one obtains the constraints shown inFigure 13. The information from time delays is particularly powerful when combined to theWMAP5 results (Komatsu et al. 2009), improving them from h = 0.74+0.15
−0.14 and w = −1.06+0.41−0.42
to h = 0.697+0.049−0.050 and w = −0.94+0.17
−0.19 for a flat cosmology. The results from a single lens arecomparable with those from the local distance ladder method (h = 0.742 ± 0.036 and w =−1.12 ± 0.12 in combination with WMAP5; Riess et al. 2009) in terms of precision, althoughthey are based on completely different physics and assumptions and subject to different systematicerrors.
6.1.3. Mass along the line of sight and the mass-sheet degeneracy. The final and per-haps limiting factor at this point is the uncertainty owing to the unknown distribution of massalong the line of sight, i.e., deviations from the single-screen approximation. On the one hand,massive galaxies are typically found in groups. Group members and the common group halo con-tribute additional shear and convergence at the location of the main deflector. On the other hand,the “cone” between us (the observer) and source may be over or underdense, thus perturbingthe time delays with respect to those expected in a perfectly smooth and isotropic universe. Botheffects can be thought to first approximation as equivalent to adding an external convergence κext
at the location of the deflector (which can be negative if the line of sight is underdense).Due to the mass-sheet degeneracy, κext is undetectable from dimensionless lensing observables.
However, if we ignored its presence and make the standard assumption of vanishing convergenceaway from the lens to break the mass-sheet degeneracy, we would infer a biased value of H0 by afactor 1/ (1 − κext) (e.g., Schneider, Kochanek & Wambsganss 2006).
Independent measurements of mass, such as stellar velocity dispersion, help break the degener-acy because they constrain the local mass distribution. An unknown κext leads to an overestimate ofthe lensing mass and therefore alters the inferred γ ′ from comparison with kinematics, counterbal-ancing the effects on H0, but not exactly. Measurements of the local environment (e.g., Fassnachtet al. 2006, Momcheva et al. 2006, Auger et al. 2007) also help, although the limiting factor isthe precision with which mass can be associated with visible tracers. A third approach consistsof inferring the distribution of effective κext from high-resolution numerical simulations (Hilbertet al. 2007). The challenge of this third approach is producing realistic simulations at kiloparsecscales relevant for strong lensing and understanding the selection function of the observed sam-ples well enough to select simulated samples in the same way. In the case of B1608+656, the totaluncertainty can be brought to 5% using a combination of the three approaches (Suyu et al. 2010).
112 Treu
Ann
u. R
ev. A
stro
. Ast
roph
ys. 2
010.
48:8
7-12
5. D
ownl
oade
d fr
om w
ww
.ann
ualr
evie
ws.
org
by U
nive
rsity
of
Mar
ylan
d -
Col
lege
Par
k on
08/
07/1
2. F
or p
erso
nal u
se o
nly.
AA48CH04-Treu ARI 23 July 2010 15:22
Analyzing a number of systems in similar detail will help uncover whether there are any residualsignificant biases.
6.2. Lenses as Standard Masses
Lensing studies indicate that the ratio fSIE between stellar velocity dispersion measured within astandard spectroscopic aperture and the normalization of the best fit SIE model σ SIE is close tounity (1.019 ± 0.08 for the SLACS sample for a concordance cosmology, Bolton et al. 2008b),consistent with our general understanding of the mass distribution of early-type galaxies in thelocal Universe. If fSIE is known sufficiently well—independent of cosmology—lens galaxies couldeffectively be used as standard masses plugging measurements of Einstein radius and stellar velocitydispersion into the SIE version of Equation 9 (Grillo, Lombardi & Bertin 2008). Note that H0
cancels out in the ratio of angular diameter distances. Unfortunately, our current understandingof the mass structure of deflectors and of the distribution of matter along the line of sight isnot sufficient for accurate cosmography (Schwab, Bolton & Rappaport 2010). In some sense, thesituation is similar to that of time-delay cosmography, and similar methodologies could be appliedto overcome the limitations. The advantage of this method over time delays is that it can be appliedto any lens regardless of the presence of a variable source. The disadvantage is that the sensitivityof the angular diameter distance ratio on cosmological parameters is weak.
6.3. Compound Lenses
The Einstein radius of a gravitational lens depends on the mass enclosed and on ratios of angulardiameter distances. For systems with multiple sets of multiple images, such as SDSSJ0946+1006(Figure 10), one can solve for both the mass distribution and cosmography provided that enoughinformation is available to constrain the distribution of mass in the region between the Einsteinrings. An additional complication is given by the mass associated with the inner ring, whichacts as an extra deflector, making these systems compound lenses for the background sourceresponsible for the outer ring. Gavazzi et al. (2008) calculate that a sample of 50 systems likeSDSSJ0946+1006—expected for future large lens surveys—should constrain the equation of stateof dark energy w to about 10% precision. As in the cases discussed above, the issue is whethersystematics associated with modeling the deflector itself or the structure along the line of sightcan be controlled with sufficient accuracy. High-quality spatially resolved kinematic informationshould help constrain the mass model of the main foreground deflector and of the inner ring.
6.4. Lens Statistics
For a given source population, the fraction of strongly lensed systems (i.e., the optical depth)depends on the cross section of the deflectors and on the abundance of deflectors. Thus, measuringthe abundance of strongly lensed systems constrains the intervening cosmic volume. This is theessence of lens statistics as a tool for cosmography, although quantities such as the distributionof Einstein radii and source redshifts also contain cosmographic information. Note that lens-driven surveys are not nearly as sensitive as source-driven surveys (see Schneider, Kochanek &Wambsganss 2006, and references therein for a theoretical description).
The state of the art of this cosmographic application is the analysis of 11 CLASS and 16SQLS samples (Chae 2007, Oguri et al. 2008), which yield rather weak bounds on cosmologicalparameters (e.g., w = −1.1 ± 0.6+0.3
−0.5 Oguri et al. 2008). Even though precision can certainly beimproved by increasing sample size, the ultimate limit is set by systematic uncertainties. Accuratecosmography from strong lensing statistics requires accurate knowledge of (a) the mass structure
www.annualreviews.org • Strong Lensing by Galaxies 113
Ann
u. R
ev. A
stro
. Ast
roph
ys. 2
010.
48:8
7-12
5. D
ownl
oade
d fr
om w
ww
.ann
ualr
evie
ws.
org
by U
nive
rsity
of
Mar
ylan
d -
Col
lege
Par
k on
08/
07/1
2. F
or p
erso
nal u
se o
nly.
AA48CH04-Treu ARI 23 July 2010 15:22
and shape of deflectors to compute cross sections (b) the contribution to the cross section fromlarge-scale structures (c) the number density of deflectors (d ) the source luminosity function; and(e) the survey selection function. These quantities need to be known as a function of redshift. Inconclusion, lens statistics poses three additional challenges (c–e) over those in common with othercosmographic applications.
6.5. Is Lensing Competitive?
The studies mentioned in this Section show that cosmography with strong lensing gives results inagreement with independent probes, reinforcing the so-called concordance cosmology. However,the ultimate test for a method is when it breaks new ground in terms of precision, and the resultis then confirmed independently. In my view, time delays are the cosmographic application thatstand the best chance of doing this for three reasons. First, two out of three major problems(time-delay measurement and local mass model) have been solved, and progress on the third(external convergence) is being made. Second, the inferred constraints are well suited to breakdegeneracies inherent to other methods such as the CMB power spectrum. Third, time delayscan be measured for a number of lenses using relatively small-ground based telescopes or willcome for free from future synoptic telescopes. Fourth, the method is completely independentof the local distance ladder method and therefore provides a valuable independent test on itssystematic uncertainties (like calibration and metallicity dependency of the cepheid-luminosityrelation). Lenses as standard masses and compound lenses seem to be valuable cosmographic toolsif they can be applied efficiently with limited observational resources, perhaps “piggy-backing” onother studies (Section 9).
What is certainly very exciting and unique is the “inverse” application of cosmographic appli-cations: learning about galaxy structure and evolution on the basis of accurate cosmography fromother probes. As mentioned in Section 4, time delays, the combination of lensing and dynamics,and compound lenses have all been demonstrated to provide unique insights into the structure ofdistant galaxies, which cannot be obtained in any other way. This is also true for lens statistics,which can be used to determine the growth of the galaxy mass function in a unique way once themass structure of each galaxy is understood from the other means discussed above (Mitchell et al.2005, Chae 2007).
7. LENSES AS COSMIC TELESCOPES
In a typical galaxy-scale strong lens system, the background source is magnified by an order ofmagnitude. Exploiting this effect, lensed galaxies at intermediate and high redshift can be studiedwith the same level of detail as nonlensed galaxies in the local Universe (Section 7.1). Furthermore,the host galaxies of bright AGN are “stretched away” from the wings of the point-spread function,enabling precise measurements of their luminosity and size and, ultimately, of the cosmic evolutionof the relation between host galaxy and central black hole (Section 7.2). Finally, microlensing bystars provides us with unique spatial information on the scale of the accretion disk, which is ordersof magnitudes smaller than anything that can be resolved from the ground at any wavelength(Section 7.3).
7.1. Small and Faint Galaxies
The resolution of HST and the sensitivity of radio interferometers mean that we know very littleabout the distant (z 0.1) Universe on scales below ∼1 kpc. Indeed, even in the nearby Universe
114 Treu
Ann
u. R
ev. A
stro
. Ast
roph
ys. 2
010.
48:8
7-12
5. D
ownl
oade
d fr
om w
ww
.ann
ualr
evie
ws.
org
by U
nive
rsity
of
Mar
ylan
d -
Col
lege
Par
k on
08/
07/1
2. F
or p
erso
nal u
se o
nly.
AA48CH04-Treu ARI 23 July 2010 15:22
(z ∼ 0.1), large ground-based surveys such as SDSS do not provide much subkiloparsec-scaleinformation. Yet, we know from the local volume that small and faint galaxies are an essentialingredient of the Universe, acting as building blocks of more massive systems. Only with theaid of gravitational lensing can we resolve subkiloparsec scales and determine the morphologyand size (Marshall et al. 2007) and kinematics of small galaxies as well as trace the location ofstar formation and the pattern of chemical abundances (Riechers et al. 2008, Stark et al. 2008).Furthermore, flux magnification enables detailed spectroscopic studies that would be prohibitivein the absence of lensing (Stark et al. 2008). These pilot studies show that intrinsic properties canbe robustly recovered via lens modeling. The rapid increase in the number of known lenses shouldsoon provide the large statistical samples needed for high-impact studies.
7.2. Host Galaxies of Lensed Active Nuclei
In the local Universe, massive galaxies are found to harbor central supermassive black holes.Remarkably, the mass of the black hole correlates with kiloparsec-scale properties of the hostbulge, such as velocity dispersion, luminosity, and stellar mass (e.g., Gultekin et al. 2009). Thisfamily of correlations has been interpreted as evidence that black hole growth and energy feedbackfrom AGN play an important role in galaxy formation and evolution (e.g., Hopkins, Murray &Thompson 2009). However, the physics of the interaction as well as the relative timing of galaxyformation and black hole growth are poorly understood. Although the local relations are animportant constraint, observing their cosmic evolution is necessary to answer some fundamentalquestions. Are the local relations only the end point of evolution, or are they established early on?Which comes first, the black hole or the host bulge?
It is challenging to answer these questions observationally. Direct dynamical black hole massmeasurements can only be done in the very local Universe. At intermediate and high-z redshift,one needs to rely on indirect methods such as the empirically calibrated relation with continuumluminosity and line width observed for type-1 AGN. However, the presence of bright luminouspoint sources hampers the study of the host galaxy (Treu et al. 2007, Jahnke et al. 2009). Stronglensing helps by stretching the host galaxy of distant lensed quasars primarily along the tangentialdirection (Figure 14). Of course, the quasar is also magnified, but one generally wins because thesurface brightness of the point-spread function falls off more rapidly. Using this method, Penget al. (2006) showed that the bulges of host galaxies of distant quasars are more luminous thanexpected based on the local relation, consistent with a scenario where bulge formation predatesblack hole growth, at least for some objects. Similar results have been found for nonlensed AGN(Treu et al. 2007). However, without the aid of lensing, studies have been limited to lower redshiftsand lower luminosity AGNs.
7.3. Structure of Active Galactic Nuclei
Understanding the physics of accretion disks and the regions surrounding supermassive blackholes is essential to explain the AGN phenomenon with all its implications for galaxy formationand evolution. However, the scales involved are extremely small by astronomical standards (for atypical 109 M black hole, the Schwarzschild radius is ≈3 × 1014 cm and the broad line region is∼1017−18 cm), and therefore impossible to resolve with conventional imaging techniques.
Microlensing is perhaps the only tool capable of probing the small scales of the accretion disk.The Einstein radius of a star of mass Ms (Figure 4), corresponds to approximately 4×10¹⁶
√Ms /M
cm ≈ 0.01√
Ms /M pc when projected at the redshift of a typical lensed quasar (zd = 0.5, zs = 2)(Schneider, Kochanek & Wambsganss 2006). The inner parts of the accretion disk will be smaller
www.annualreviews.org • Strong Lensing by Galaxies 115
Ann
u. R
ev. A
stro
. Ast
roph
ys. 2
010.
48:8
7-12
5. D
ownl
oade
d fr
om w
ww
.ann
ualr
evie
ws.
org
by U
nive
rsity
of
Mar
ylan
d -
Col
lege
Par
k on
08/
07/1
2. F
or p
erso
nal u
se o
nly.
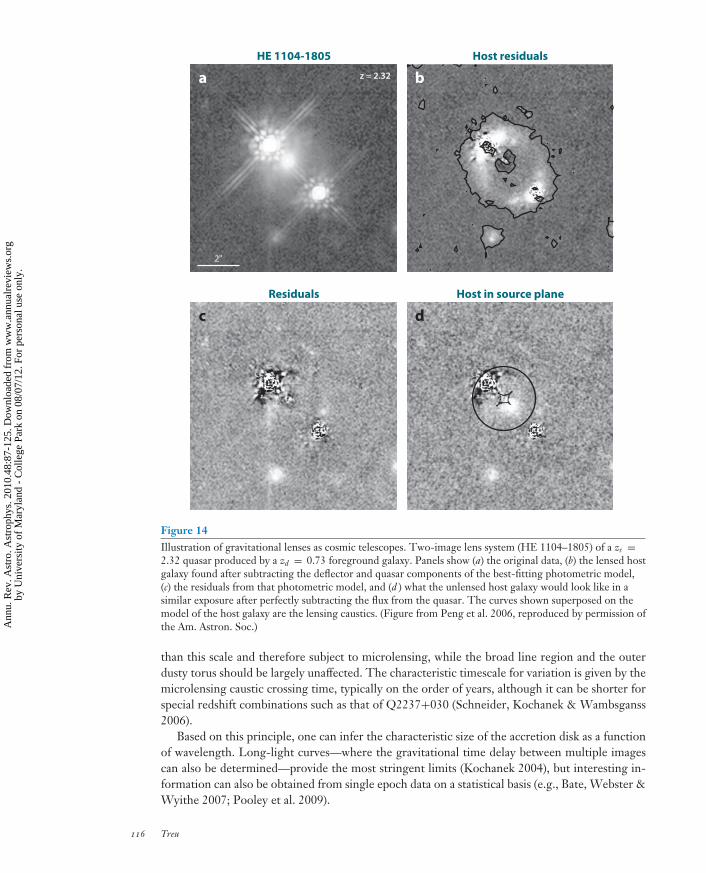
AA48CH04-Treu ARI 23 July 2010 15:22
a b
c dResiduals Host in source plane
2"
z = 2.32
HE 1104-1805 Host residuals
Figure 14Illustration of gravitational lenses as cosmic telescopes. Two-image lens system (HE 1104–1805) of a zs =2.32 quasar produced by a zd = 0.73 foreground galaxy. Panels show (a) the original data, (b) the lensed hostgalaxy found after subtracting the deflector and quasar components of the best-fitting photometric model,(c) the residuals from that photometric model, and (d ) what the unlensed host galaxy would look like in asimilar exposure after perfectly subtracting the flux from the quasar. The curves shown superposed on themodel of the host galaxy are the lensing caustics. (Figure from Peng et al. 2006, reproduced by permission ofthe Am. Astron. Soc.)
than this scale and therefore subject to microlensing, while the broad line region and the outerdusty torus should be largely unaffected. The characteristic timescale for variation is given by themicrolensing caustic crossing time, typically on the order of years, although it can be shorter forspecial redshift combinations such as that of Q2237+030 (Schneider, Kochanek & Wambsganss2006).
Based on this principle, one can infer the characteristic size of the accretion disk as a functionof wavelength. Long-light curves—where the gravitational time delay between multiple imagescan also be determined—provide the most stringent limits (Kochanek 2004), but interesting in-formation can also be obtained from single epoch data on a statistical basis (e.g., Bate, Webster &Wyithe 2007; Pooley et al. 2009).
116 Treu
Ann
u. R
ev. A
stro
. Ast
roph
ys. 2
010.
48:8
7-12
5. D
ownl
oade
d fr
om w
ww
.ann
ualr
evie
ws.
org
by U
nive
rsity
of
Mar
ylan
d -
Col
lege
Par
k on
08/
07/1
2. F
or p
erso
nal u
se o
nly.

AA48CH04-Treu ARI 23 July 2010 15:22
The inferred absolute size of the accretion disk can be known up to a factor of order unity,which depends on 〈Ms〉 and on the relative transverse speeds between the stars, the deflector, andthe source. However, the slope of the relation between accretion disk temperature and size isindependent of that factor and can thus be determined more precisely. Current results indicatethat the accretion disk is approximately the size expected for Shakura & Sunyaev (1973) models,although discrepancies on the order of a factor of a few have been reported (Pooley et al. 2007).Assuming that the size scales as λ1/η, η is found to be in the range of 0.5–1, whereas η = 0.75 isexpected for a Shakura & Sunyaev (1973) model (see also Eigenbrod et al. 2008 and Poindexter,Morgan & Kochanek 2008). Long wavelength data imply the presence of a second spectral com-ponent, consistent with the hypothesis of a dusty torus of size much larger than the microlensingscale (Agol et al. 2009).
These first exciting results are just the beginning, because very few light curves obtained sofar are long enough to harness the full power of microlensing. With the rapid development oftime-domain astronomy predicted for the next decade, multiwavelength monitoring campaignsof several years for tens of objects should become feasible (Section 9).
7.4. Cosmic Telescopes and Human Telescopes
I have described how strong lensing provides a unique opportunity to study sources that aretoo faint or too small to be studied otherwise, from quasar host galaxies to microarcsecond-sizeaccretion disks.
Unfortunately, the use of galaxies (and clusters) as cosmic telescopes is often more contentiousthan it should be. One frequent critique is that source reconstruction is difficult and inherentlyuncertain. This is a false perception. The brief discussion in Section 2 and the references listedtherein provide ample documentation that lens modeling is now a mature field with very well-understood uncertainties and capable of delivering results that are well reproduced by independentanalyses. Lens modeling at cluster scales is more complex owing to the larger dynamic range in thedata and the more inhomogeneous mass distribution. Nevertheless, robust results can be obtainedalso for clusters, provided that enough information is available.
Another frequent critique is that surveys using cosmic telescopes are inefficient compared toblank fields because of magnification bias. This is true for sources with number counts in fluxunits (dN/dF) flatter than F−1. However, when probing the bright end of the luminosity functionof any population—where number density falls off exponentially—lensing is just unbeatable: Thebrighter of any class of distant astronomical objects will inevitably be gravitationally lensed. Cosmictelescopes and blank surveys are complementary to fully characterize a source population and itsphysical properties.
8. SEARCHES FOR GRAVITATIONAL LENSES
The strong lensing applications covered in this review span a broad range of astrophysical phe-nomena that are both observational and theoretical challenges. However, they all share a commonlimitation: the relatively small number of systems to which they can be applied. Although thereare about 200 known systems, they are not all suitable for all applications. Studies must rely on atmost a few tens of cases to infer results of general interest.
Fortunately, a number of large surveys are expected to take place in the next decade, providingan ideal dataset to mine for rare objects such as strong lenses. The challenge will be in developingfast and robust algorithms to find new lenses, and then in mustering the resources and the brainpower needed to follow up and study them (Section 9).
www.annualreviews.org • Strong Lensing by Galaxies 117
Ann
u. R
ev. A
stro
. Ast
roph
ys. 2
010.
48:8
7-12
5. D
ownl
oade
d fr
om w
ww
.ann
ualr
evie
ws.
org
by U
nive
rsity
of
Mar
ylan
d -
Col
lege
Par
k on
08/
07/1
2. F
or p
erso
nal u
se o
nly.
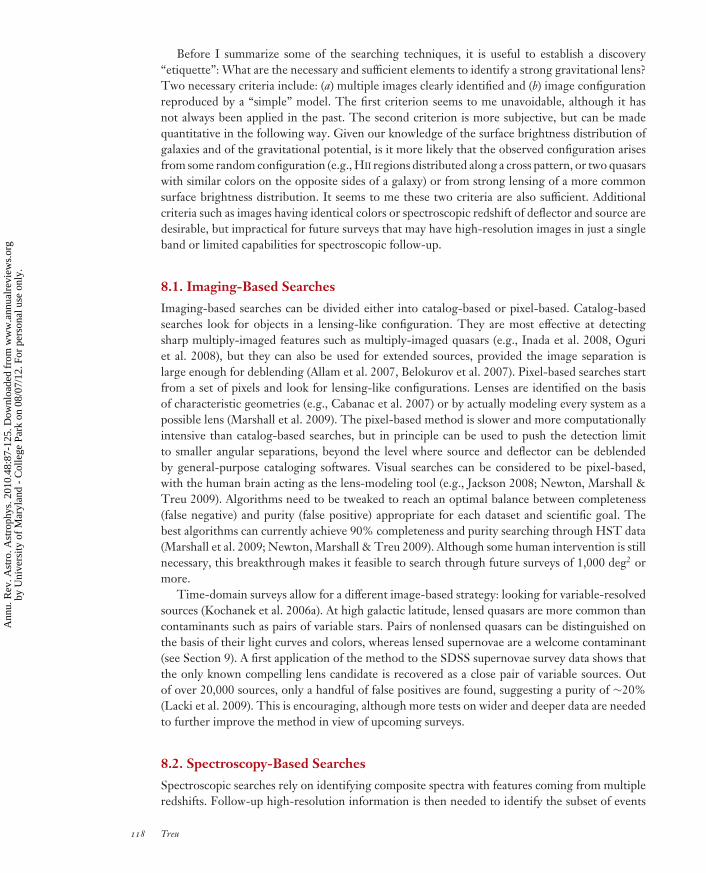
AA48CH04-Treu ARI 23 July 2010 15:22
Before I summarize some of the searching techniques, it is useful to establish a discovery“etiquette”: What are the necessary and sufficient elements to identify a strong gravitational lens?Two necessary criteria include: (a) multiple images clearly identified and (b) image configurationreproduced by a “simple” model. The first criterion seems to me unavoidable, although it hasnot always been applied in the past. The second criterion is more subjective, but can be madequantitative in the following way. Given our knowledge of the surface brightness distribution ofgalaxies and of the gravitational potential, is it more likely that the observed configuration arisesfrom some random configuration (e.g., HII regions distributed along a cross pattern, or two quasarswith similar colors on the opposite sides of a galaxy) or from strong lensing of a more commonsurface brightness distribution. It seems to me these two criteria are also sufficient. Additionalcriteria such as images having identical colors or spectroscopic redshift of deflector and source aredesirable, but impractical for future surveys that may have high-resolution images in just a singleband or limited capabilities for spectroscopic follow-up.
8.1. Imaging-Based Searches
Imaging-based searches can be divided either into catalog-based or pixel-based. Catalog-basedsearches look for objects in a lensing-like configuration. They are most effective at detectingsharp multiply-imaged features such as multiply-imaged quasars (e.g., Inada et al. 2008, Oguriet al. 2008), but they can also be used for extended sources, provided the image separation islarge enough for deblending (Allam et al. 2007, Belokurov et al. 2007). Pixel-based searches startfrom a set of pixels and look for lensing-like configurations. Lenses are identified on the basisof characteristic geometries (e.g., Cabanac et al. 2007) or by actually modeling every system as apossible lens (Marshall et al. 2009). The pixel-based method is slower and more computationallyintensive than catalog-based searches, but in principle can be used to push the detection limitto smaller angular separations, beyond the level where source and deflector can be deblendedby general-purpose cataloging softwares. Visual searches can be considered to be pixel-based,with the human brain acting as the lens-modeling tool (e.g., Jackson 2008; Newton, Marshall &Treu 2009). Algorithms need to be tweaked to reach an optimal balance between completeness(false negative) and purity (false positive) appropriate for each dataset and scientific goal. Thebest algorithms can currently achieve 90% completeness and purity searching through HST data(Marshall et al. 2009; Newton, Marshall & Treu 2009). Although some human intervention is stillnecessary, this breakthrough makes it feasible to search through future surveys of 1,000 deg2 ormore.
Time-domain surveys allow for a different image-based strategy: looking for variable-resolvedsources (Kochanek et al. 2006a). At high galactic latitude, lensed quasars are more common thancontaminants such as pairs of variable stars. Pairs of nonlensed quasars can be distinguished onthe basis of their light curves and colors, whereas lensed supernovae are a welcome contaminant(see Section 9). A first application of the method to the SDSS supernovae survey data shows thatthe only known compelling lens candidate is recovered as a close pair of variable sources. Outof over 20,000 sources, only a handful of false positives are found, suggesting a purity of ∼20%(Lacki et al. 2009). This is encouraging, although more tests on wider and deeper data are neededto further improve the method in view of upcoming surveys.
8.2. Spectroscopy-Based Searches
Spectroscopic searches rely on identifying composite spectra with features coming from multipleredshifts. Follow-up high-resolution information is then needed to identify the subset of events
118 Treu
Ann
u. R
ev. A
stro
. Ast
roph
ys. 2
010.
48:8
7-12
5. D
ownl
oade
d fr
om w
ww
.ann
ualr
evie
ws.
org
by U
nive
rsity
of
Mar
ylan
d -
Col
lege
Par
k on
08/
07/1
2. F
or p
erso
nal u
se o
nly.
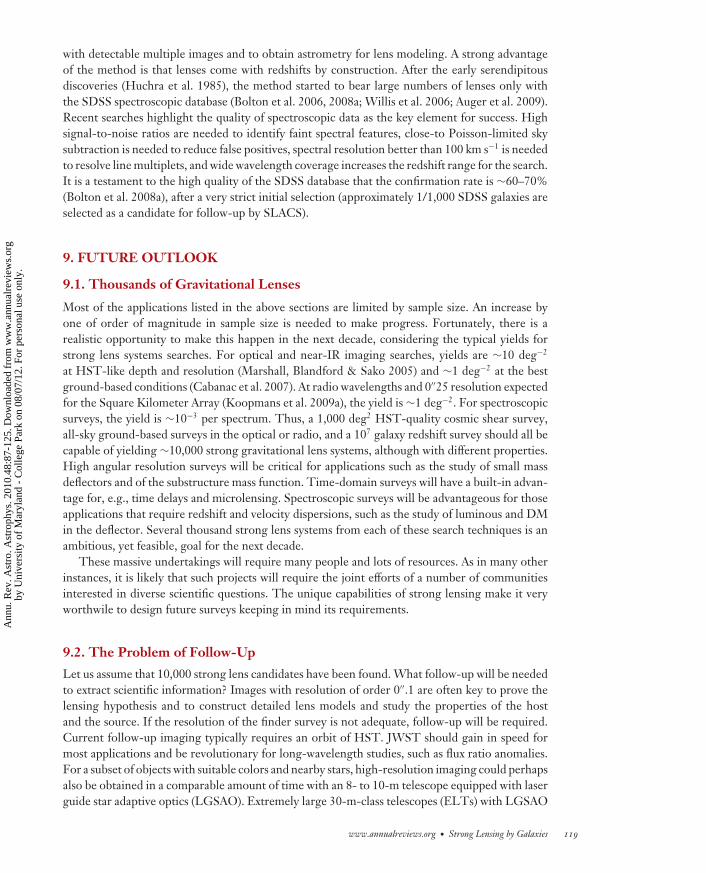
AA48CH04-Treu ARI 23 July 2010 15:22
with detectable multiple images and to obtain astrometry for lens modeling. A strong advantageof the method is that lenses come with redshifts by construction. After the early serendipitousdiscoveries (Huchra et al. 1985), the method started to bear large numbers of lenses only withthe SDSS spectroscopic database (Bolton et al. 2006, 2008a; Willis et al. 2006; Auger et al. 2009).Recent searches highlight the quality of spectroscopic data as the key element for success. Highsignal-to-noise ratios are needed to identify faint spectral features, close-to Poisson-limited skysubtraction is needed to reduce false positives, spectral resolution better than 100 km s−1 is neededto resolve line multiplets, and wide wavelength coverage increases the redshift range for the search.It is a testament to the high quality of the SDSS database that the confirmation rate is ∼60–70%(Bolton et al. 2008a), after a very strict initial selection (approximately 1/1,000 SDSS galaxies areselected as a candidate for follow-up by SLACS).
9. FUTURE OUTLOOK
9.1. Thousands of Gravitational Lenses
Most of the applications listed in the above sections are limited by sample size. An increase byone of order of magnitude in sample size is needed to make progress. Fortunately, there is arealistic opportunity to make this happen in the next decade, considering the typical yields forstrong lens systems searches. For optical and near-IR imaging searches, yields are ∼10 deg−2
at HST-like depth and resolution (Marshall, Blandford & Sako 2005) and ∼1 deg−2 at the bestground-based conditions (Cabanac et al. 2007). At radio wavelengths and 0′′25 resolution expectedfor the Square Kilometer Array (Koopmans et al. 2009a), the yield is ∼1 deg−2. For spectroscopicsurveys, the yield is ∼10−3 per spectrum. Thus, a 1,000 deg2 HST-quality cosmic shear survey,all-sky ground-based surveys in the optical or radio, and a 107 galaxy redshift survey should all becapable of yielding ∼10,000 strong gravitational lens systems, although with different properties.High angular resolution surveys will be critical for applications such as the study of small massdeflectors and of the substructure mass function. Time-domain surveys will have a built-in advan-tage for, e.g., time delays and microlensing. Spectroscopic surveys will be advantageous for thoseapplications that require redshift and velocity dispersions, such as the study of luminous and DMin the deflector. Several thousand strong lens systems from each of these search techniques is anambitious, yet feasible, goal for the next decade.
These massive undertakings will require many people and lots of resources. As in many otherinstances, it is likely that such projects will require the joint efforts of a number of communitiesinterested in diverse scientific questions. The unique capabilities of strong lensing make it veryworthwile to design future surveys keeping in mind its requirements.
9.2. The Problem of Follow-Up
Let us assume that 10,000 strong lens candidates have been found. What follow-up will be neededto extract scientific information? Images with resolution of order 0′′.1 are often key to prove thelensing hypothesis and to construct detailed lens models and study the properties of the hostand the source. If the resolution of the finder survey is not adequate, follow-up will be required.Current follow-up imaging typically requires an orbit of HST. JWST should gain in speed formost applications and be revolutionary for long-wavelength studies, such as flux ratio anomalies.For a subset of objects with suitable colors and nearby stars, high-resolution imaging could perhapsalso be obtained in a comparable amount of time with an 8- to 10-m telescope equipped with laserguide star adaptive optics (LGSAO). Extremely large 30-m-class telescopes (ELTs) with LGSAO
www.annualreviews.org • Strong Lensing by Galaxies 119
Ann
u. R
ev. A
stro
. Ast
roph
ys. 2
010.
48:8
7-12
5. D
ownl
oade
d fr
om w
ww
.ann
ualr
evie
ws.
org
by U
nive
rsity
of
Mar
ylan
d -
Col
lege
Par
k on
08/
07/1
2. F
or p
erso
nal u
se o
nly.

AA48CH04-Treu ARI 23 July 2010 15:22
should be able to gain a substantial factor in speed and resolution. Radio follow-up of extendedsources at high resolution with VLA requires on the order of 1 hour per lens. The Atacama LargeMillimiter/Submillimiter Array (ALMA) should be an improvement both in speed and resolution.Even following up a thousand lenses will thus require thousands of hours of telescope time, maybe afew hundreds with JWST, ELTs, and ALMA in combination. This may be feasible, but not trivial,making high-resolution imaging a likely bottle neck. Multiplexing is unlikely to be an option giventhe rarity of these objects on the sky, although multiplexing with different astronomical targets iscertainly a desirable option. Even higher resolution images (0′′.01) are within reach with extremeadaptive optics on extremely large telescopes and will certainly be beneficial for pushing some ofthe lensing applications. For example, that kind of resolution could push the detection of DMsubstructure in distant galaxies in the 107-M regime typical of the least massive luminous MilkyWay satellites currently known, where the discrepancy with theory is currently strongest (Kravtsov2010).
Spectroscopic follow-up to gather redshifts is a problem of possibly even greater magnitude,considering that redshifts for many of the sources cannot be measured even spending hours on thelargest telescopes (Ofek et al. 2006). For the fainter sources, photometric redshifts may be the onlyoption. Coordination with redshift surveys—such as those proposed to measure baryonic acousticoscillations—will help in measuring redshifts as well as in spectroscopic searches, although theywill also require high angular resolution follow-up.
Monitoring campaigns of thousands of lensed AGNs are out of the question at the moment,but could be a natural byproduct of future synoptic surveys. Some of the most demanding time-domain applications, such as detection of time-delay anomalies, could be beyond the reach ofground-based monitoring tools and require a dedicated space mission (Moustakas et al. 2008).
In parallel with discovery efforts, careful thought must be put into planning follow-up efforts.First, ways to extract as much information as possible from the discovery images themselves mustbe found. Second, follow-up efforts should be coordinated as much as possible with those ofother science cases to find common paths and synergies. Last but not least, brain power couldbe another serious limitation. Currently, accurate and reliable lens models require several daysof expert human brain activity. This will not be possible when samples will consist of tens ofthousands of systems.
9.3. Unusual Lensing Applications in an Era of Abundance
I conclude with four examples of strong lensing applications that require very rare conditions andtherefore need, in order to become viable, the large samples expected in the next decade.
Lensed supernovae Ia are extremely valuable because their standard luminosity constrains theabsolute magnification and therefore breaks the mass-sheet degeneracy. For typical rates, we expectof order one could be found monitoring known lenses for several years. However, a ground-basedtime-domain survey covering most of the sky is expected to find of order a hundred lensed typeIas (Oguri & Marshall 2010).
Compound lenses are potentially powerful cosmographic probes, but there is currently onlyone such system known at galaxy scales (Gavazzi et al. 2008). Some 1,000-degree−2 field surveysat HST-like resolution should be able to find tens of systems like SDSSJ0946+1006, potentiallyconstraining w to the 10% level (Gavazzi et al. 2008).
Strong lensing is one of the few tools capable of measuring the mass of quiescent black holesat cosmological distances, though their gravity affects the properties of central images (Mao,Witt & Koopmans 2001). Detecting the central image—which is generally highly demagnified—is usually beyond reach with current instrumentation (see however Winn, Rusin & Kochanek
120 Treu
Ann
u. R
ev. A
stro
. Ast
roph
ys. 2
010.
48:8
7-12
5. D
ownl
oade
d fr
om w
ww
.ann
ualr
evie
ws.
org
by U
nive
rsity
of
Mar
ylan
d -
Col
lege
Par
k on
08/
07/1
2. F
or p
erso
nal u
se o
nly.

AA48CH04-Treu ARI 23 July 2010 15:22
2004). However, this application may become practical with future facilities, especially at radiowavelengths where the contrast between deflector and source is more favorable.
Finally, with future samples of 104 lenses, rare examples of “catastrophes” should be identifiable(Orban de Xivry & Marshall 2009). These are very special lensing configurations characterizedby specific constraints on the gravitational potential and its derivatives, and they occur only forvery specific source position and redshift (see Petters, Levine & Wambsganss 2001 and Schneider,Ehlers & Falco 1992 for details). The identification of examples of catastrophes is interesting fortwo reasons. First, catastrophes often lead to extreme magnification factors, up to ∼100, makingthem extraordinary cosmic telescopes. Second, the unusual geometry of multiple images can giveremarkably strong constraints on the mass distribution of the deflector (Orban de Xivry & Marshall2009).
SUMMARY POINTS
1. Massive early-type galaxies are surrounded by dark matter halos that are spatially moreextended than the luminous component. The fraction of mass in the form of dark matterinside the effective radius increases with galaxy stellar mass.
2. The total mass-density profile of massive early-type galaxies is approximately isothermalin the innermost ∼10 kpc, i.e., the logarithmic slope γ ′ equals 2 within 10%.
3. Precise gravitational time delays for a single system can be used to measure the HubbleConstant to 5% precision, provided that enough information is available to constrain thelocal gravitational potential and to break the mass-sheet degeneracy. Time delays breakthe degeneracy between h and w in the analysis of cosmic microwave background data.Combining the constraints from the lens system B1608+656 and those from WMAP5yields h = 0.697+0.049
−0.050 and w = −0.94+0.17−0.19 assuming flatness.
4. The host galaxies of distant luminous quasars appear to be underluminous in comparisonwith local galaxies hosting black holes of the same mass. This may indicate that in thismass range black holes complete their growth before their host galaxy.
5. Microlensing results indicate that the size of an accretion disk and its dependency ontemperature is in broad agreement with the predictions of models proposed by Shakura& Sunyaev (1973). Moreover, mid-IR microlensing studies are consistent with a presenceof an unresolved dusty region that is larger than the accretion disk.
FUTURE ISSUES
1. How do luminous and dark matter density profiles depend on galaxy mass, type, andcosmic time?
2. Are dark matter density profiles universal, as predicted by cold dark matter numericalsimulations?
3. Is the mass function of substructure in agreement with the predictions of cold dark matternumerical simulations?
4. How are density profiles and the substructure mass function influenced by the presenceof baryons?
www.annualreviews.org • Strong Lensing by Galaxies 121
Ann
u. R
ev. A
stro
. Ast
roph
ys. 2
010.
48:8
7-12
5. D
ownl
oade
d fr
om w
ww
.ann
ualr
evie
ws.
org
by U
nive
rsity
of
Mar
ylan
d -
Col
lege
Par
k on
08/
07/1
2. F
or p
erso
nal u
se o
nly.
AA48CH04-Treu ARI 23 July 2010 15:22
5. Is dark energy the cosmological constant (w = −1)? If not, how does the equation ofstate evolve with cosmic time?
6. How can we find and exploit larger samples of strong gravitational lens systems?
DISCLOSURE STATEMENT
The author is not aware of any affiliations, memberships, funding, or financial holdings that mightbe perceived as affecting the objectivity of this review.
ACKNOWLEDGMENTS
I am grateful to Matt Auger, Marusa Bradac, Brendon Brewer, Chris Fassnacht, Raphael Gavazzi,Leon Koopmans, Phil Marshall, Elisabeth Newton, Anna Nierenberg, Carlo Nipoti, Andrea Ruff,Anna Pancoast, and Sherry Suyu for helpful comments on early drafts of this review. I would liketo thank in particular Richard Ellis for his many insightful comments and advice about this reviewand throughout the past decade. I am also grateful to Roger Blandford for his scientific input andfeedback as editor. Finally, I would like to acknowledge enlightening conversations with manypeople including Giuseppe Bertin, Chris Kochaneck, Jean-Paul Kneib, Paul Schechter, PeterSchneider, and Joachim Wambsganss. Financial support from the Sloan and Packard Foundationsis gratefully acknowledged.
LITERATURE CITED
Agol E, Gogarten SM, Gorjian V, Kimball A. 2009. Ap. J. 697:1010–19Agol E, Jones B, Blaes O. 2000. Ap. J. 545:657–63Allam SS, Tucker DL, Lin H, Diehl HT, Annis J, et al. 2007. Ap. J. Lett. 662:L51–54Auger MW, Fassnacht CD, Abrahamse AL, Lubin LM, Squires GK. 2007. Astron. J. 134:668–79Auger MW, Treu T, Bolton AS, Gavazzi R, Koopmans LVE, et al. 2009. Ap. J. 705:1099–115Barnabe M, Czoske O, Koopmans LVE, Treu T, Bolton AS, Gavazzi R. 2009. MNRAS 399:21–36Bate NF, Webster RL, Wyithe JSB. 2007. MNRAS 381:1591–96Bell EF, de Jong RS. 2001. Ap. J. 550:212–29Belokurov V, Evans NW, Moiseev A, King LJ, Hewett PC, et al. 2007. Ap. J. Lett. 671:L9–12Bertin G, Stiavelli M. 1993. Rep. Prog. Phys. 56:493–556Blandford RD, Narayan R. 1992. Annu. Rev. Astron. Astrophys. 30:311–58Bolton AS, Burles S, Koopmans LVE, Treu T, Gavazzi R, et al. 2008a. Ap. J. 682:964–84Bolton AS, Burles S, Koopmans LVE, Treu T, Moustakas LA. 2006. Ap. J. 638:703–24Bolton AS, Treu T, Koopmans LVE, Gavazzi R, Moustakas LA, et al. 2008b. Ap. J. 684:248–59Bradac M, Schneider P, Steinmetz M, Lombardi M, King LJ, Porcas R. 2002. Astron. Astrophys. 388:373–82Brewer BJ, Lewis GF. 2006. Ap. J. 637:608–19Browne IWA, Wilkinson PN, Jackson NJF, Myers ST, Fassnacht CD, et al. 2003. MNRAS 341:13–32Bundy K, Treu T, Ellis RS. 2007. Ap. J. Lett. 665:L5–8Cabanac RA, Alard C, Dantel-Fort M, Fort B, Gavazzi R, et al. 2007. Astron. Astrophys. 461:813–21Cappellari M, Bacon R, Bureau M, Damen MC, Davies RL, et al. 2006. MNRAS 366:1126–50Chabrier G. 2003. Publ. Astron. Soc. Pac. 115:763–95Chae KH. 2007. Ap. J. Lett. 658:L71–74Chen J. 2009. Astron. Astrophys. 498:49–60Chen J, Kravtsov AV, Keeton CR. 2003. Ap. J. 592:24–31Chen J, Rozo E, Dalal N, Taylor JE. 2007. Ap. J. 659:52–68
122 Treu
Ann
u. R
ev. A
stro
. Ast
roph
ys. 2
010.
48:8
7-12
5. D
ownl
oade
d fr
om w
ww
.ann
ualr
evie
ws.
org
by U
nive
rsity
of
Mar
ylan
d -
Col
lege
Par
k on
08/
07/1
2. F
or p
erso
nal u
se o
nly.
AA48CH04-Treu ARI 23 July 2010 15:22
Chiba M. 2002. Ap. J. 565:17–23Ciotti L, Lanzoni B, Renzini A. 1996. MNRAS 282:1–12Coe D, Moustakas LA. 2009. Ap. J. 706:45–59Coles J. 2008. Ap. J. 679:17–24Courbin F, Saha P, Schechter PL. 2002. Lect. Notes Phys. 608:1–54Courteau S, Rix HW. 1999. Ap. J. 513:561–71Dalal N, Kochanek CS. 2002. Ap. J. 572:25–33Diemand J, Kuhlen M, Madau P, Zemp M, Moore B, et al. 2008. Nature 454:735–38Dutton AA, van den Bosch FC, Dekel A, Courteau S. 2007. Ap. J. 654:27–52Dye S, Warren SJ. 2005. Ap. J. 623:31–41Eigenbrod A, Courbin F, Sluse D, Meylan G, Agol E. 2008. Astron. Astrophys. 480:647–61Ellis R, Silk J. 2009. In Structure Formation in the Universe, ed. P Chabrier, pp. 133–59. Cambridge, UK:
Cambridge Univ. PressEvans NW, Witt HJ. 2003. MNRAS 345:1351–64Falco EE. 2005. N. J. Phys. 7:200Falco EE, Gorenstein MV, Shapiro II. 1985. Ap. J. Lett. 289:L1–4Fassnacht CD, Blandford RD, Cohen JG, Matthews K, Pearson TJ, et al. 1999. Astron. J. 117:658–70Fassnacht CD, Gal RR, Lubin LM, McKean JP, Squires GK, Readhead ACS. 2006. Ap. J. 642:30–38Faure C, Kneib JP, Covone G, Tasca L, Leauthaud A, et al. 2008. Ap. J. Suppl. 176:19–38Feron C, Hjorth J, McKean JP, Samsing J. 2009. Ap. J. 696:1319–38Gavazzi R, Treu T, Koopmans LVE, Bolton AS, Moustakas LA, et al. 2008. Ap. J. 677:1046–59Gavazzi R, Treu T, Rhodes JD, Koopmans LVE, Bolton AS, et al. 2007. Ap. J. 667:176–90Gerhard O, Kronawitter A, Saglia RP, Bender R. 2001. Astron. J. 121:1936–51Grillo C, Gobat R, Lombardi M, Rosati P. 2009. Astron. Astrophys. 501:461–74Grillo C, Lombardi M, Bertin G. 2008. Astron. Astrophys. 477:397–406Gultekin K, Richstone DO, Gebhardt K, Lauer TR, Tremaine S, et al. 2009. Ap. J. 698:198–221Hilbert S, White SDM, Hartlap J, Schneider P. 2007. MNRAS 382:121–32Hoekstra H, Hsieh BC, Yee HKC, Lin H, Gladders MD. 2005. Ap. J. 635:73–85Hopkins PF, Murray N, Thompson TA. 2009. MNRAS 398:303–11Huchra J, Gorenstein M, Kent S, Shapiro I, Smith G, et al. 1985. Astron. J. 90:691–96Humphrey PJ, Buote DA, Gastaldello F, Zappacosta L, Bullock JS, et al. 2006. Ap. J. 646:899–918Inada N, Oguri M, Becker RH, Shin MS, Richards GT, et al. 2008. Astron. J. 135:496–511Jackson N. 2007. Living Rev. Relativ. 10:4Jackson N. 2008. MNRAS 389:1311–18Jahnke K, Bongiorno A, Brusa M, Capak P, Cappelluti N, et al. 2009, Ap. J. Lett. 706:L215–20Jiang G, Kochanek CS. 2007. Ap. J. 671:1568–78Keeton CR, Gaudi BS, Petters AO. 2003. Ap. J. 598:138–61Keeton CR, Moustakas LA. 2009. Ap. J. 699:1720–31Klypin A, Kravtsov AV, Valenzuela O, Prada F. 1999. Ap. J. 522:82–92Kochanek CS. 1995. Ap. J. 445:559–77Kochanek CS. 2004. Ap. J. 605:58–77Kochanek CS, Dalal N. 2004. Ap. J. 610:69–79Kochanek CS, Mochejska B, Morgan ND, Stanek KZ. 2006a. Ap. J. Lett. 637:L73–76Kochanek CS, Morgan ND, Falco EE, McLeod BA, Winn JN, et al. 2006b. Ap. J. 640:47–61Kolatt TS, Bartelmann M. 1998. MNRAS 296:763–72Komatsu E, Dunkley J, Nolta MR, Bennett CL, Gold B, et al. 2009. Ap. J. Suppl. 180:330–76Koopmans LVE. 2005. MNRAS 363:1136–44Koopmans LVE, Barnabe M, Bolton A, Bradac M, Ciotti L, et al. 2009a. Astro2010: Astron. Astrophys. Decadal
Survey, Sci. White. Pap. No. 159Koopmans LVE, Biggs A, Blandford RD, Browne IWA, Jackson NJ, et al. 2003a. Ap. J. 595:712–18Koopmans LVE, Bolton A, Treu T, Czoske O, Auger MW, et al. 2009b. Ap. J. Lett. 703:L51–54Koopmans LVE, Garrett MA, Blandford RD, Lawrence CR, Patnaik AR, Porcas RW. 2002. MNRAS 334:39–
47
www.annualreviews.org • Strong Lensing by Galaxies 123
Ann
u. R
ev. A
stro
. Ast
roph
ys. 2
010.
48:8
7-12
5. D
ownl
oade
d fr
om w
ww
.ann
ualr
evie
ws.
org
by U
nive
rsity
of
Mar
ylan
d -
Col
lege
Par
k on
08/
07/1
2. F
or p
erso
nal u
se o
nly.

AA48CH04-Treu ARI 23 July 2010 15:22
Koopmans LVE, Treu T, Bolton AS, Burles S, Moustakas LA. 2006. Ap. J. 649:599–615Koopmans LVE, Treu T, Fassnacht CD, Blandford RD, Surpi G. 2003b. Ap. J. 599:70–85Kormann R, Schneider P, Bartelmann M. 1994. Astron. Astrophys. 284:285–99Kravtsov AV. 2010. Adv. Astron. 2010:281913Lacki BC, Kochanek CS, Stanek KZ, Inada N, Oguri M. 2009. Ap. J. 698:428–38MacLeod CL, Kochanek CS, Agol E. 2009. Ap. J. 699:1578–83Maller AH, Flores RA, Primack JR. 1997. Ap. J. 486:681–86Mandelbaum R, van de Ven G, Keeton CR. 2009. MNRAS 398:635–57Mao S, Jing Y, Ostriker JP, Weller J. 2004. Ap. J. Lett. 604:L5–8Mao S, Schneider P. 1998. MNRAS 295:587–94Mao S, Witt HJ, Koopmans LVE. 2001. MNRAS 323:301–7Marshall P. 2006. MNRAS 372:1289–98Marshall P, Blandford R, Sako M. 2005. N. Astron. Rev. 49:387–91Marshall PJ, Hogg DW, Moustakas LA, Fassnacht CD, Bradac M, et al. 2009. Ap. J. 694:924–42Marshall PJ, Treu T, Melbourne J, Gavazzi R, Bundy K, et al. 2007. Ap. J. 671:1196–211McKean JP, Koopmans LVE, Flack CE, Fassnacht CD, Thompson D, et al. 2007. MNRAS 378:109–18Metcalf RB, Zhao H. 2002. Ap. J. Lett. 567:L5–8Miranda M, Maccio AV. 2007. MNRAS 382:1225–32Mitchell JL, Keeton CR, Frieman JA, Sheth RK. 2005. Ap. J. 622:81–98Momcheva I, Williams K, Keeton C, Zabludoff A. 2006. Ap. J. 641:169–89Moore B, Ghigna S, Governato F, Lake G, Quinn T, et al. 1999. Ap. J. Lett. 524:L19–22Moustakas LA, Bolton AJ, Booth JT, Bullock JS, Cheng E, et al. 2008. In Proc. SPIE. Soc. Photo-Opt. Eng. Space
Telesc. Instrum. 2008: Opt., Infrared, and Millim., Vol. 7010, ed. JM Oschmann Jr., MWM de Graauw,HA MacEwen, pp. 70101B-70101B-11. Bellingham, WA: SPIE
Moustakas LA, Marshall P, Newman JA, Coil AL, Cooper MC, et al. 2007. Ap. J. Lett. 660:L31–34Moustakas LA, Metcalf RB. 2003. MNRAS 339:607–15Navarro JF, Frenk CS, White SDM. 1997. Ap. J. 490:493–508Newton ER, Marshall PJ, Treu T. 2009. Ap. J. 696:1125–41Nipoti C, Treu T, Bolton AS. 2009. Ap. J. 703:1531–44Ofek EO, Maoz D, Rix HW, Kochanek CS, Falco EE. 2006. Ap. J. 641:70–77Oguri M. 2007. N. J. Phys. 9:442Oguri M, Inada N, Pindor B, Strauss MA, Richards GT, et al. 2006. Astron. J. 132:999–1013Oguri M, Inada N, Strauss MA, Kochanek CS, Richards GT, et al. 2008. Astron. J. 135:512–19Oguri M, Marshall PJ. 2010. MNRAS In press (arXiv 1001.2037)Orban de Xivry G, Marshall P. 2009. MNRAS 399:2–20Paraficz D, Hjorth J, Elıasdottir A. 2009. Astron. Astrophys. 499:395–408Peng CY, Impey CD, Rix HW, Kochanek CS, Keeton CR, et al. 2006. Ap. J. 649:616–34Petters AO, Levine H, Wambsganss J. 2001. Singularity Theory and Gravitational Lensing. Boston: BirkhauserPoindexter S, Morgan N, Kochanek CS. 2008. Ap. J. 673:34–38Pooley D, Blackburne JA, Rappaport S, Schechter PL. 2007. Ap. J. 661:19–29Pooley D, Rappaport S, Blackburne J, Schechter PL, Schwab J, Wambsganss J. 2009. Ap. J. 697:1892–900Refregier A. 2003. Annu. Rev. Astron. Astrophys. 41:645–68Renzini A. 2006. Annu. Rev. Astron. Astrophys. 44:141–92Riechers DA, Walter F, Brewer BJ, Carilli CL, Lewis GF, et al. 2008. Ap. J. 686:851–58Riess AG, Macri L, Casertano S, Sosey M, Lampeitl H, et al. 2009. Ap. J. 699:539–63Rusin D, Kochanek CS. 2005. Ap. J. 623:666–82Saha P, Williams LLR. 2004. Astron. J. 127:2604–16Saha P, Williams LLR. 2006. Ap. J. 653:936–41Salpeter EE. 1955. Ap. J. 121:161–67Salucci P, Lapi A, Tonini C, Gentile G, Yegorova I, Klein U. 2007. MNRAS 378:41–47Sand DJ, Treu T, Ellis RS, Smith GP, Kneib JP. 2008. Ap. J. 674:711–27Schneider P, Ehlers J, Falco EE. 1992. Gravitational Lenses. Berlin: Springer-Verlag, 560 pp.
124 Treu
Ann
u. R
ev. A
stro
. Ast
roph
ys. 2
010.
48:8
7-12
5. D
ownl
oade
d fr
om w
ww
.ann
ualr
evie
ws.
org
by U
nive
rsity
of
Mar
ylan
d -
Col
lege
Par
k on
08/
07/1
2. F
or p
erso
nal u
se o
nly.

AA48CH04-Treu ARI 23 July 2010 15:22
Schneider P, Kochanek CS, Wambsganss J. 2006. Gravitational Lensing: Strong, Weak and Micro: Saas-FeeAdvanced Courses 33. Berlin: Springer-Verlag
Schwab J, Bolton AS, Rappaport SA. 2010. Ap. J. 708:750–57Shakura NI, Sunyaev RA. 1973. Astron. Astrophys. 24:337–55Springel V, Wang J, Vogelsberger M, Ludlow A, Jenkins A, et al. 2008. MNRAS 391:1685–711Stark DP, Swinbank AM, Ellis RS, Dye S, Smail IR, Richard J. 2008. Nature 455:775–77Suyu SH, Marshall PJ, Auger MW, Hilbert S, Blandford RD, et al. 2010. Ap. J. 711:201–21Suyu SH, Marshall PJ, Hobson MP, Blandford RD. 2006. MNRAS 371:983–98Thomas J, Saglia RP, Bender R, Thomas D, Gebhardt K, et al. 2009. Ap. J. 691:770–82Treu T, Auger M, Koopmans LVE, Gavazzi R, Marshall PJ, et al. 2010. Ap. J. 709:1195–202Treu T, Ellis RS, Liao TX, van Dokkum PG, Tozzi P, et al. 2005. Ap. J. 633:174–97Treu T, Gavazzi R, Gorecki A, Marshall PJ, Koopmans LVE, et al. 2009. Ap. J. 690:670–82Treu T, Koopmans LVE. 2002a. Ap. J. 575:87–94Treu T, Koopmans LVE. 2002b. MNRAS 337:L6–10Treu T, Koopmans LVE. 2004. Ap. J. 611:739–60Treu T, Koopmans LVE, Bolton AS, Burles S, Moustakas LA. 2006. Ap. J. 640:662–72Treu T, Woo JH, Malkan MA, Blandford RD. 2007. Ap. J. 667:117–30Trott CM, Treu T, Koopmans LVE, Webster RL. 2010. MNRAS. 501:1540–51van Albada TS, Sancisi R. 1986. Philos. Trans. R. Soc. Lond. Ser. A 320:447–64van der Wel A, Bell EF, van den Bosch FC, Gallazzi A, Rix HW. 2009. Ap. J. 698:1232–43Vegetti S, Koopmans LVE. 2009a. MNRAS 392:945–63Vegetti S, Koopmans LVE. 2009b. MNRAS 400:1583–92Vuissoz C, Courbin F, Sluse D, Meylan G, Chantry V, et al. 2008. Astron. Astrophys. 488:481–90Warren SJ, Dye S. 2003. Ap. J. 590:673–82Willis JP, Hewett PC, Warren SJ, Dye S, Maddox N. 2006. MNRAS 369:1521–28Winn JN, Rusin D, Kochanek CS. 2004. Nature 427:613–15Wucknitz O, Biggs AD, Browne IWA. 2004. MNRAS 349:14–30Xu DD, Mao S, Wang J, Springel V, Gao L, et al. 2009. MNRAS 398:1235–53Yoo J, Kochanek CS, Falco EE, McLeod BA. 2006. Ap. J. 642:22–29
www.annualreviews.org • Strong Lensing by Galaxies 125
Ann
u. R
ev. A
stro
. Ast
roph
ys. 2
010.
48:8
7-12
5. D
ownl
oade
d fr
om w
ww
.ann
ualr
evie
ws.
org
by U
nive
rsity
of
Mar
ylan
d -
Col
lege
Par
k on
08/
07/1
2. F
or p
erso
nal u
se o
nly.

AR421-FM ARI 16 July 2010 18:40
Annual Review ofAstronomy andAstrophysics
Volume 48, 2010Contents
Searching for InsightDonald Lynden-Bell � � � � � � � � � � � � � � � � � � � � � � � � � � � � � � � � � � � � � � � � � � � � � � � � � � � � � � � � � � � � � � � � � � � � � � � � � � � � 1
Cosmic SilicatesThomas Henning � � � � � � � � � � � � � � � � � � � � � � � � � � � � � � � � � � � � � � � � � � � � � � � � � � � � � � � � � � � � � � � � � � � � � � � � � � � � � �21
The Birth Environment of the Solar SystemFred C. Adams � � � � � � � � � � � � � � � � � � � � � � � � � � � � � � � � � � � � � � � � � � � � � � � � � � � � � � � � � � � � � � � � � � � � � � � � � � � � � � � � �47
Strong Lensing by GalaxiesTommaso Treu � � � � � � � � � � � � � � � � � � � � � � � � � � � � � � � � � � � � � � � � � � � � � � � � � � � � � � � � � � � � � � � � � � � � � � � � � � � � � � � � �87
Reionization and Cosmology with 21-cm FluctuationsMiguel F. Morales and J. Stuart B. Wyithe � � � � � � � � � � � � � � � � � � � � � � � � � � � � � � � � � � � � � � � � � � � � � � � 127
Interstellar Dust in the Solar SystemIngrid Mann � � � � � � � � � � � � � � � � � � � � � � � � � � � � � � � � � � � � � � � � � � � � � � � � � � � � � � � � � � � � � � � � � � � � � � � � � � � � � � � � � 173
The Inner Regions of Protoplanetary DisksC.P. Dullemond and J.D. Monnier � � � � � � � � � � � � � � � � � � � � � � � � � � � � � � � � � � � � � � � � � � � � � � � � � � � � � � � � � 205
Physical Processes in Magnetically Driven Flares on the Sun, Stars,and Young Stellar ObjectsArnold O. Benz and Manuel Gudel � � � � � � � � � � � � � � � � � � � � � � � � � � � � � � � � � � � � � � � � � � � � � � � � � � � � � � � � 241
Local Helioseismology: Three-Dimensional Imagingof the Solar InteriorLaurent Gizon, Aaron C. Birch, and Henk C. Spruit � � � � � � � � � � � � � � � � � � � � � � � � � � � � � � � � � � � � 289
A Universal Stellar Initial Mass Function? A Critical Look at VariationsNate Bastian, Kevin R. Covey, and Michael R. Meyer � � � � � � � � � � � � � � � � � � � � � � � � � � � � � � � � � � � � 339
Smoothed Particle Hydrodynamics in AstrophysicsVolker Springel � � � � � � � � � � � � � � � � � � � � � � � � � � � � � � � � � � � � � � � � � � � � � � � � � � � � � � � � � � � � � � � � � � � � � � � � � � � � � � 391
Young Massive Star ClustersSimon F. Portegies Zwart, Stephen L.W. McMillan, and Mark Gieles � � � � � � � � � � � � � � � � � � 431
xi
Ann
u. R
ev. A
stro
. Ast
roph
ys. 2
010.
48:8
7-12
5. D
ownl
oade
d fr
om w
ww
.ann
ualr
evie
ws.
org
by U
nive
rsity
of
Mar
ylan
d -
Col
lege
Par
k on
08/
07/1
2. F
or p
erso
nal u
se o
nly.

AR421-FM ARI 16 July 2010 18:40
Dark Matter Candidates from Particle Physics and Methodsof DetectionJonathan L. Feng � � � � � � � � � � � � � � � � � � � � � � � � � � � � � � � � � � � � � � � � � � � � � � � � � � � � � � � � � � � � � � � � � � � � � � � � � � � � 495
Molecular Clouds in Nearby GalaxiesYasuo Fukui and Akiko Kawamura � � � � � � � � � � � � � � � � � � � � � � � � � � � � � � � � � � � � � � � � � � � � � � � � � � � � � � � � 547
The Ages of StarsDavid R. Soderblom � � � � � � � � � � � � � � � � � � � � � � � � � � � � � � � � � � � � � � � � � � � � � � � � � � � � � � � � � � � � � � � � � � � � � � � � � 581
Exoplanet AtmospheresSara Seager and Drake Deming � � � � � � � � � � � � � � � � � � � � � � � � � � � � � � � � � � � � � � � � � � � � � � � � � � � � � � � � � � � 631
The Hubble ConstantWendy L. Freedman and Barry F. Madore � � � � � � � � � � � � � � � � � � � � � � � � � � � � � � � � � � � � � � � � � � � � � � � � 673
Indexes
Cumulative Index of Contributing Authors, Volumes 37–48 � � � � � � � � � � � � � � � � � � � � � � � � � � � 711
Cumulative Index of Chapter Titles, Volumes 37–48 � � � � � � � � � � � � � � � � � � � � � � � � � � � � � � � � � � � � 714
Errata
An online log of corrections to Annual Review of Astronomy and Astrophysics articles maybe found at http://astro.annualreviews.org/errata.shtml
xii Contents
Ann
u. R
ev. A
stro
. Ast
roph
ys. 2
010.
48:8
7-12
5. D
ownl
oade
d fr
om w
ww
.ann
ualr
evie
ws.
org
by U
nive
rsity
of
Mar
ylan
d -
Col
lege
Par
k on
08/
07/1
2. F
or p
erso
nal u
se o
nly.