Strong Evidence for Pattern Separation in Human … · 2004; Davachi, 2006). To avoid confusing...
11
Behavioral/Cognitive Strong Evidence for Pattern Separation in Human Dentate Gyrus X David Berron, 1,2 X Hartmut Schu ¨tze, 1 X Anne Maass, 1,2 X Arturo Cardenas-Blanco, 2 X Hugo J. Kuijf, 3 Dharshan Kumaran, 4 * and Emrah Du ¨zel 1,2,4 * 1 Institute of Cognitive Neurology and Dementia Research, Otto-von-Guericke-University Magdeburg, 39120 Magdeburg, Germany, 2 German Center for Neurodegenerative Diseases, Site Magdeburg, 39120 Magdeburg, Germany, 3 Image Sciences Institute, University Medical Center Utrecht, 3584 CX Utrecht, The Netherlands, and 4 University College London, Institute of Cognitive Neuroscience, London WC1N 3AR, United Kingdom The hippocampus is proposed to be critical in distinguishing between similar experiences by performing pattern separation comput- ations that create orthogonalized representations for related episodes. Previous neuroimaging studies have provided indirect evidence that the dentate gyrus (DG) and CA3 hippocampal subregions support pattern separation by inferring the nature of underlying repre- sentations from the observation of novelty signals. Here, we use ultra-high-resolution fMRI at 7 T and multivariate pattern analysis to provide compelling evidence that the DG subregion specifically sustains representations of similar scenes that are less overlapping than in other hippocampal (e.g., CA3) and medial temporal lobe regions (e.g., entorhinal cortex). Further, we provide evidence that novelty signals within the DG are stimulus specific rather than generic in nature. Our study, in providing a mechanistic link between novelty signals and the underlying representations, constitutes the first demonstration that the human DG performs pattern separation. Key words: 7 T fMRI; hippocampal subfields; medial temporal lobe; memory; MVPA; pattern separation Introduction The hippocampus (HC) is widely acknowledged to be critical to episodic memory (Cohen and Eichenbaum, 1993; Eichenbaum, 2004; Davachi, 2006). To avoid confusing memories for similar experiences, the HC should assign distinct neuronal codes to related episodes. This process, often referred to as pattern sepa- ration, is generally viewed to be a critical computation performed by an episodic memory system, specifically, the dentate gyrus (DG) subregion of the HC (Marr, 1971; O’Reilly and McClelland, 1994; Rolls and Treves, 1994; Norman and O’Reilly, 2003). Al- though empirical evidence demonstrates that the hippocampal DG region in rodents supports pattern separated representations (Leutgeb et al., 2007; McHugh et al., 2007; Colgin et al., 2008; Neunuebel and Knierim, 2014; Lee et al., 2015), previous studies in humans have provided only indirect evidence for a role for the DG in this process (Bakker et al., 2008; Lacy et al., 2011; Azab et al., 2014; Reagh and Yassa, 2014; Kyle et al., 2015) and lacked the anatomical resolution to distinguish between DG and CA3. Specifically, a previous study used an fMR adaptation para- digm to show that items that were similar to those previously experienced (“lures”) elicited elevated levels of activity in DG/ CA3 (i.e., comparable to that elicited by the initial presentation) compared with exact repetitions of the item (Bakker et al., 2008; also see follow-up studies: Yassa et al., 2010, 2011; Lacy et al., Received Feb. 7, 2016; revised May 22, 2016; accepted May 26, 2016. Author contributions: D.B., H.S., D.K., and E.D. designed research; D.B. performed research; H.S., A.M., A.C.-B., and H.K. contributed unpublished reagents/analytic tools; D.B. analyzed data; D.B., D.K., and E.D. wrote the paper. We thank the Leibniz Institute for Neurobiology (LIN) for access to the 7T scanner and Michael Hanke, Martin Chadwick, and Yi Chen for helpful discussions with respect to the MVPA. The authors declare no competing financial interests. *D.K. and E.D. are co-senior authors. Correspondence should be addressed to David Berron, Institute of Cognitive Neurology and Dementia Research, Otto-von-Guericke University Magdeburg, House 64, Leipziger Str. 44, 39120 Magdeburg, Germany. E-mail: [email protected]. DOI:10.1523/JNEUROSCI.0518-16.2016 Copyright © 2016 the authors 0270-6474/16/367569-11$15.00/0 Significance Statement A fundamental property of an episodic memory system is the ability to minimize interference between similar episodes. The dentate gyrus (DG) subregion of the hippocampus is widely viewed to realize this function through a computation referred to as pattern separation, which creates distinct nonoverlapping neural codes for individual events. Here, we leveraged 7 T fMRI to test the hypothesis that this region supports pattern separation. Our results demonstrate that the DG supports representations of similar scenes that are less overlapping than those in neighboring subregions. The current study therefore is the first to offer compelling evidence that the human DG supports pattern separation by obtaining critical empirical data at the representational level: the level where this computation is defined. The Journal of Neuroscience, July 20, 2016 • 36(29):7569 –7579 • 7569
Transcript of Strong Evidence for Pattern Separation in Human … · 2004; Davachi, 2006). To avoid confusing...
Behavioral/Cognitive
Strong Evidence for Pattern Separation in HumanDentate Gyrus
X David Berron,1,2 X Hartmut Schutze,1 X Anne Maass,1,2 X Arturo Cardenas-Blanco,2 X Hugo J. Kuijf,3
Dharshan Kumaran,4* and Emrah Duzel1,2,4*1Institute of Cognitive Neurology and Dementia Research, Otto-von-Guericke-University Magdeburg, 39120 Magdeburg, Germany, 2German Center forNeurodegenerative Diseases, Site Magdeburg, 39120 Magdeburg, Germany, 3Image Sciences Institute, University Medical Center Utrecht, 3584 CX Utrecht,The Netherlands, and 4University College London, Institute of Cognitive Neuroscience, London WC1N 3AR, United Kingdom
The hippocampus is proposed to be critical in distinguishing between similar experiences by performing pattern separation comput-ations that create orthogonalized representations for related episodes. Previous neuroimaging studies have provided indirect evidencethat the dentate gyrus (DG) and CA3 hippocampal subregions support pattern separation by inferring the nature of underlying repre-sentations from the observation of novelty signals. Here, we use ultra-high-resolution fMRI at 7 T and multivariate pattern analysis toprovide compelling evidence that the DG subregion specifically sustains representations of similar scenes that are less overlapping thanin other hippocampal (e.g., CA3) and medial temporal lobe regions (e.g., entorhinal cortex). Further, we provide evidence that noveltysignals within the DG are stimulus specific rather than generic in nature. Our study, in providing a mechanistic link between noveltysignals and the underlying representations, constitutes the first demonstration that the human DG performs pattern separation.
Key words: 7 T fMRI; hippocampal subfields; medial temporal lobe; memory; MVPA; pattern separation
IntroductionThe hippocampus (HC) is widely acknowledged to be critical toepisodic memory (Cohen and Eichenbaum, 1993; Eichenbaum,2004; Davachi, 2006). To avoid confusing memories for similarexperiences, the HC should assign distinct neuronal codes torelated episodes. This process, often referred to as pattern sepa-
ration, is generally viewed to be a critical computation performedby an episodic memory system, specifically, the dentate gyrus(DG) subregion of the HC (Marr, 1971; O’Reilly and McClelland,1994; Rolls and Treves, 1994; Norman and O’Reilly, 2003). Al-though empirical evidence demonstrates that the hippocampalDG region in rodents supports pattern separated representations(Leutgeb et al., 2007; McHugh et al., 2007; Colgin et al., 2008;Neunuebel and Knierim, 2014; Lee et al., 2015), previous studiesin humans have provided only indirect evidence for a role for theDG in this process (Bakker et al., 2008; Lacy et al., 2011; Azab etal., 2014; Reagh and Yassa, 2014; Kyle et al., 2015) and lacked theanatomical resolution to distinguish between DG and CA3.
Specifically, a previous study used an fMR adaptation para-digm to show that items that were similar to those previouslyexperienced (“lures”) elicited elevated levels of activity in DG/CA3 (i.e., comparable to that elicited by the initial presentation)compared with exact repetitions of the item (Bakker et al., 2008;also see follow-up studies: Yassa et al., 2010, 2011; Lacy et al.,
Received Feb. 7, 2016; revised May 22, 2016; accepted May 26, 2016.Author contributions: D.B., H.S., D.K., and E.D. designed research; D.B. performed research; H.S., A.M., A.C.-B.,
and H.K. contributed unpublished reagents/analytic tools; D.B. analyzed data; D.B., D.K., and E.D. wrote the paper.We thank the Leibniz Institute for Neurobiology (LIN) for access to the 7T scanner and Michael Hanke, Martin
Chadwick, and Yi Chen for helpful discussions with respect to the MVPA.The authors declare no competing financial interests.*D.K. and E.D. are co-senior authors.Correspondence should be addressed to David Berron, Institute of Cognitive Neurology and Dementia Research,
Otto-von-Guericke University Magdeburg, House 64, Leipziger Str. 44, 39120 Magdeburg, Germany. E-mail:[email protected].
DOI:10.1523/JNEUROSCI.0518-16.2016Copyright © 2016 the authors 0270-6474/16/367569-11$15.00/0
Significance Statement
A fundamental property of an episodic memory system is the ability to minimize interference between similar episodes. Thedentate gyrus (DG) subregion of the hippocampus is widely viewed to realize this function through a computation referred to aspattern separation, which creates distinct nonoverlapping neural codes for individual events. Here, we leveraged 7 T fMRI to testthe hypothesis that this region supports pattern separation. Our results demonstrate that the DG supports representations ofsimilar scenes that are less overlapping than those in neighboring subregions. The current study therefore is the first to offercompelling evidence that the human DG supports pattern separation by obtaining critical empirical data at the representationallevel: the level where this computation is defined.
The Journal of Neuroscience, July 20, 2016 • 36(29):7569 –7579 • 7569
2011; Bakker et al., 2012). Although this lure-associated noveltysignal was used to infer the existence of pattern-separated repre-sentations for the original and lure item in the DG/CA3 region,there is an alternative possibility that cannot be discounted:that these novelty signals may reflect the output of a match–mismatch process in which the lure item triggers pattern com-pletion of the original stored item and a resultant mismatchsignal (Kumaran and Maguire, 2009). Therefore, these previ-ous studies do not necessarily imply a role for the humanDG/CA3 in pattern separation.
The current study, therefore, was configured to provide amore definitive test of the hypothesis that the human DG per-forms pattern separation. First, we were able to distinguish be-tween the DG and CA3 subregions by obtaining high-field fMRIdata at 7 T with a functional resolution of 0.8 � 0.8 � 0.8 mm(corresponding to a volume of 0.51 mm 3) covering the wholemedial temporal lobe (MTL) memory system including the HC,entorhinal cortex (EC), perirhinal cortex (PRC), and parahip-pocampal cortex (PHC). In contrast, previous fMRI studies ofthe MTL that investigated pattern separation relied on 3 T fMRIand isotropic voxel sizes up to 1.5 mm (corresponding to a vol-ume of 3.375 mm 3; Bakker et al., 2008; Carr et al., 2010). Second,we used multivariate fMRI methods to investigate whether theDG performs pattern separation, an analytic technique that isparticularly appropriate given that this computation is defined atthe level of the underlying representations (Treves and Rolls,1994; McClelland et al., 1995; Norman and O’Reilly, 2003;Haynes and Rees, 2006; Davis and Poldrack, 2013; Haynes, 2015;Knierim and Neunuebel, 2016). Strong evidence for patternseparation would require the demonstration that multivoxel ac-tivity patterns for similar stimuli in the DG were more distinctthan in regions upstream the HC such as the EC, PRC, and PHC.To optimize our paradigm for multivariate pattern analysis(MVPA), we used a modified repetition suppression paradigmthat included only two stimuli (A,B) (cf. Bakker et al., 2008 thatused trial-unique stimuli). The stimuli constituted very similarversions of the same spatial environment inspired by A-B-B-Atype paradigms used in nonhuman primate studies in which rep-etition suppression responses are observed even with highly fa-miliar stimuli (Miller and Desimone, 1994; Holscher and Rolls,2002). In addition, this allowed us to investigate whether the DGgenerates stimulus specific novelty responses that can be relatedto the underlying representations detected by MVPA analysis.
Materials and MethodsSubjectsTwenty young subjects (11 male, recruited at the campus of the Otto-von-Guericke University Magdeburg, mean age 27.6 � 4 years, range �21–35) participated in the experiment. Subjects were screened for knownmetabolic disorders and neurologic or psychiatric history and excludedfrom further examination in case of incidents reported during historytaking. All subjects had normal or corrected to normal vision and wereright handed. One subject was discarded from further analyses due to toomany incorrect responses (19% incorrect). The study was conducted anddesigned in accordance with the Declaration of Helsinki (Williams,2008) and all subjects gave informed and written consent for their par-ticipation in accordance with ethic and data security guidelines of theOtto-von-Guericke University Magdeburg. The study was approved bythe local ethics committee.
Task and designBefore scanning subjects had to complete a 4 min training and stimulusfamiliarization phase outside of the scanner (10 stimulus sequences).During the following fMRI session, the same two stimuli (A and B; Fig. 1)were presented in short sequences consisting of three to five stimulus
presentations. Sequences were presented in an event-related design. Eachstimulus was presented for 2 s and stimuli were separated by a presenta-tion of a scrambled noise picture for 3.5 s (�1 s) to prevent an afterimageor pop-out effects. Sequences were separated by a presentation of afixation star for 4.5 s. Subjects had to indicate the third occurrence of thefirst item seen in a sequence via button press with their right index finger.This provided a behavioral measure of mnemonic discriminationperformance.
For the fMRI analysis, we focused only on the first and second stimuluspresentation within each sequence to counterbalance stimuli and to ex-clude the motor response. All sequences were counterbalanced in termsof stimulus A and B. In addition, the length and order of the sequenceswas counterbalanced between stimulus A and B repetitions and lures (seeFig. 1 for example sequences). We presented 32 sequences in each of thefour runs. This resulted in a total of 128 sequences. Although, in half ofthe sequences, the first stimulus was repeated (repetitions), in the otherhalf, there was a change of the stimulus within the first two stimuluspresentations (lures). Therefore, we could include 128 first presenta-tions, 64 repetitions, and 64 lures in the subsequent fMRI analyses.
Immediately after the scanning procedure, there was a postscan de-briefing in which we asked subjects to draw both stimuli in as detailed amanner as possible. This was done to make sure that all subjects were notonly aware of the difference between both stimuli, but that they also hada detailed representation of the whole living room scene.
StimuliThe stimuli consisted of two colored computer-generated (3ds Max;Autodesk) and isoluminant images. The images showed two similar ver-sions of the same living room with a size of 800 � 600 pixels (Fig. 1). Ascrambled “noise” picture with identical dimensions was shown betweenthe images. The fixation target was a black image with identical dimen-sions and a white fixation star in the center. Stimuli were projected ontothe center of a screen and the participants watched them through a mir-ror mounted on the head coil, subtending a visual angle of ��3° � �2°.
MRIMRI data were acquired using a 7 T MR system (Siemens). A 32-channelhead coil was used. The same scanning protocol was used as previouslyreported in a high-resolution fMRI study on the MTL (Maass et al.,2014). Furthermore, task residuals from the data of the recent study wereused for functional connectivity analyses of MTL regions previously(Maass et al., 2015). Before the fMRI session, a whole head MP-RAGEvolume (TE � 2.8 ms, TR � 2500 ms, TI � 1050 ms, flip angle � 5°,resolution 0.6 mm isometric) was acquired. Subsequently, the four fMRIsessions were run (see “fMRI data acquisition” section), followed by theacquisition of a high-resolution partial structural volume (T2*-weightedimaging, TE � 18.5 ms, TR � 680 ms, resolution 0.33 mm � 0.33 mm, 45slices, slice thickness 1.5 mm � 25% gap, FOV 212 mm � 179 mm,matrix 640 � 540), with a slice alignment orthogonal to the HC mainaxis. Total MRI duration was �100 min.
fMRI data acquisitionEach subject’s fMRI scan consisted of 1600 volumes, each comprising28 T2*-weighted echo planar slices with a resolution of 0.8 � 0.8 mm(TE � 22 ms, TR � 2000 ms, slice thickness 0.8 mm, FOV 205 mm,matrix 256 � 256, parallel imaging with grappa factor 4) in 4 sessionsof 13.5 min.
The slices were acquired in an odd– even interleaved fashion orientedparallel to the HC long axis. EPI volumes were distortion corrected usinga point spread function mapping method (Zaitsev et al., 2004) and mo-tion corrected during the online reconstruction.
fMRI data analysesUnivariate analysis. fMRI data preprocessing and statistical modelingwas done using SPM8 (Wellcome Trust Centre for Neuroimaging, Uni-versity College London) and FSL (Centre for Functional Magnetic Res-onance Imaging of the Brain, University of Oxford). Raw image datawere converted to NIfTI images while preserving the original image pa-rameters. Because the data were already corrected for distortions and formotion (see “fMRI data acquisition” section), the preprocessing in-
7570 • J. Neurosci., July 20, 2016 • 36(29):7569 –7579 Berron et al. • Strong Evidence for Pattern Separation in Human DG
cluded only slice timing correction and smoothing with a 2 mm full-width half-maximum Gaussian kernel (FWHM). A 2 mm smoothingkernel was used because it provides a good compromise between highsensitivity and high specificity, as we reported previously (Maass et al.,2014). Coregistration of the functional and structural images was doneusing boundary-based registration on a white matter segmentation of thestructural MPRAGE image using FSL (Greve and Fischl, 2009).
To model the functional data, delta functions defined by the onset of astimulus on a trial-by-trial basis were convolved with a hemodynamicresponse function (HRF) and its first temporal derivative. First- andsecond-level data were analyzed using a mixed-effect general linearmodel (GLM) approach (Worsley and Friston, 1995) and experimentalconditions were entered into the GLM as separate regressors for firstpresentations, repetitions, and lures for A and B stimuli, respectively. Anadditional regressor for all other trials, as well as a regressor includingmotor responses, was entered into the GLM. Furthermore, six motioncorrection parameters were added as regressors of no interest to mini-mize false-positive activations due to task-correlated motion (Johnstoneet al., 2006). In total, this resulted in 16 conditions for each of the foursessions.
To assess differences in activity, two types of contrasts were calculated.First, we contrasted all first presentations to repetitions (first � repeti-tions) to capture activation due to the immediate repetition of a stimulus(repetition suppression). Conversely, we contrasted lures to repetitions(lures � repetitions) to identify voxels that show less repetition suppres-sion to lures compared with repetitions. All models were calculated innative space.
Cross-participant alignment for univariate group analyses. To visualizeand compare group activity levels in the HC, we created a sample specifictemplate for optimal cross-participant alignment of the functional data(Avants et al., 2010, 2011) using Region-of-Interest Advanced Normal-ization Tools (ROI-ANTs; Klein et al., 2009). This nonlinear diffeomor-
phic mapping procedure optimizes regional alignment (based onanatomically defined ROIs) across subjects. The sample-specific tem-plate was constructed based on coregistered individual MP-RAGE im-ages of all 19 subjects. For subsequent ROI-based alignment, regions inthe hippocampal head and body, as well as in the EC, PRC, and PHC,were segmented on specific slices on the T1 template. We then appliedthe expectation-based point set registration to register the individualMP-RAGE images to the T1 template based on the labeled point sets(� MTL ROIs). Each participant’s contrast image for lures � repetitionsand firsts � repetitions was then aligned to the sample-specific templatespace. Finally, the aligned contrast images were submitted to a second-level group analysis in SPM (one-sample t test).
Simulation of type-1 error rates. To determine the probability of false-positive clusters (type 1 error) for a given smoothness, voxelwise thresh-old ( p � 0.005), and cluster size, we used 3dClustSim implemented inAFNI (http://afni.nimh.nih.gov/afni/). These analyses were restricted tothe bilateral HC because our hypotheses were specifically focused onneural processing within the subfields of the HC. 3dClustSim computesthe cluster size threshold at chosen values for the � significance level andvoxelwise threshold (� � Prob(Cluster � given size)). 3dClustSim re-quires an estimate of the spatial correlation across voxels, which wasdetermined in SPM with respect to the applied smoothing kernel of 2 mm(FWHM � 2.5 � 2.8 � 2.1 mm 3). For visualization, second-level resultmaps were thresholded at pvoxel level � 0.005 and a cluster size of 35voxels. The type 1 error rates of the resulting clusters are listed in Table 1.
MVPA. Raw image data were converted to NIfTI images while preserv-ing the original image parameters. The preprocessing included only slicetiming correction (SPM8). We avoided spatial smoothing to keep thehigh-resolution and fine-grained structure of activity. All models werecalculated in native space.
We estimated trial-by-trial activation patterns using an effective ap-proach for rapid event-related designs (Mumford et al., 2012). We ob-
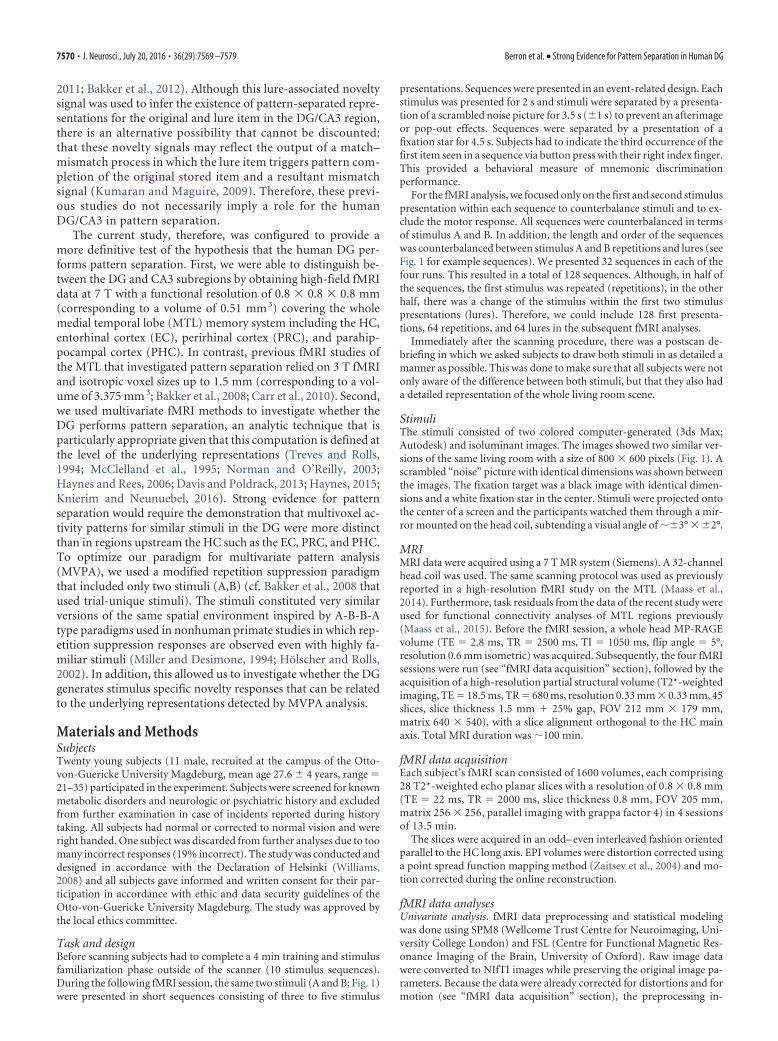
Figure 1. Experimental paradigm. Stimuli A and B were presented in short sequences (three to five stimuli; a–d show selected examples). Subjects were instructed to indicate the third occurrenceof the first item seen in a sequence via button press. In half of the sequences, there was a repetition of identical stimuli in the beginning (repetition trials; a, b). In the other half, stimuli changed inthe very beginning (lure trials; c, d). We included only the first and second stimulus in further analyses as indicated by the blue line. R indicates the appropriate response for each example sequence.We refer to the first stimulus in each sequence as “first presentation” although only the two scenes displayed in the figure were used in the entire experiment and therefore each scene was highlyfamiliar. Note that the length and order of the sequences was counterbalanced between stimulus A and B repetitions and lures.
Berron et al. • Strong Evidence for Pattern Separation in Human DG J. Neurosci., July 20, 2016 • 36(29):7569 –7579 • 7571
tained each trial’s estimate through a GLM including a regressor for thattrial as well as another regressor for all other trials. The first derivative ofthe HRF was included in the model to take individual onset variations ofthe HRF into account. This process was repeated for each stimulus andresulted in 256 separate GLMs. Therefore, we could include 128 firstpresentations, 64 repetitions, and 64 lures as samples in the multivariateclassification procedure. There were no missing trials and the data werebalanced in terms of samples for stimulus A and B for every run.
For our main analysis, we did not remove the mean pattern (“cocktailblank removal”; Op de Beeck, 2010) or the mean value of the ROI (“meancentering”; Coutanche, 2013) from our multivoxel patterns before ourMVPA because recent studies have highlighted the negative effects ofmean pattern removal (e.g., inducing negative correlations; Garrido etal., 2013; Walther et al., 2015), but also argue against the removal of themean value (Davis and Poldrack, 2013).
Trial estimates (64 per session, 256 in total) were analyzed for multi-variate effects using PyMVPA 2.2.0 (Hanke et al., 2009). Each sampleconsisted of the � estimate of a specific trial as well as its first derivative.Independent data chunks were defined by each of the four sessions. Forthe purpose of evaluation of classification validity, a leave-one-run-outcross-validation was performed. In each of the four validation steps, alinear support vector machine (Chang and Lin, 2011) was trained on thedata of three runs and tested on the remaining run. We followed ananatomical feature selection approach (see “Segmentation of subregionsin the MTL” section). Therefore, the analysis was done for each condition(first presentations, repetitions, and lures), hippocampal subregion(subiculum, CA1, CA2/3, and DG) and subject. In a second analysis, thiswas also done for the EC, PRC, and PHC. Because the regions in theanterior MTL are more affected by signal dropouts, this analysis wasdone separately and excluded four subjects with dropouts in the EC orPRC. Accuracy of the validation step was calculated as the proportion ofthe samples that were classified correctly. Overall classification accuracywas defined as the mean accuracy of all four validation steps. There weremore trial estimates for first presentations (128) compared with repeti-tions and lures (64). To parallel the analysis, we randomly chose 64 firstpresentations that were balanced between stimulus A and B, as well as runone to four. This procedure was repeated 100 times and decoding accu-racies were averaged across all permutations.
Group analysis. Results were first tested for significance using one-sample t tests and permutation testing was also applied. We averaged theaccuracy of all subjects to get the “true” group accuracy value. In a secondstep, we relabeled the samples of the training set 1000 times and testedthem on the testing set using the same leave-one-run-out cross-validation scheme as before. This was to generate the individual nulldistributions that we used to calculate 1000 group means. Finally, weused the 1000 group means to generate the group null distribution. Bycomparing the “true” group accuracy value, we could identify the rankand thus the p-value (1000 permutations allow for p � 0.001) of the truegroup accuracy value (Nichols and Holmes, 2002). We used a 3 � 4repeated-measures ANOVA with the within-subject factors condition(first presentations, repetitions, and lures) and subfield (subiculum,CA1, CA2-3, and DG) to test whether there are significant differences inclassifier performance across task conditions and hippocampal subfields.
Greenhouse–Geisser correction was used to correct for violations ofsphericity.
Segmentation of subregions in the MTLFor each subject, ROIs for the subfields of the HC were traced manuallyon the high-resolution T2*-weighted images acquired orthogonal to thelong axis of the HC (Fig. 2 A, B). The coregistered T1-weighted MPRAGEimages provided additional information due to different contrast, lowerslice thickness, and less susceptibility artifacts. This was the case espe-cially in the anterior MTL, including the PRC and EC. Therefore, the EC,PRC, and PHC were labeled manually only on the high-resolution T1-weighted MPRAGE images. All ROIs were coregistered and resliced tothe mean functional image. Finally, segmented masks were verified andadjusted (if necessary) on the mean functional images (see Fig. 2C for theoverlay of masks on a mean EPI).
ROIs were identified in bilateral MTL and traced on consecutive cor-onal slices. Segmentation was performed for each hemisphere separatelyusing a freehand spline drawing tool based on MeVisLab (MeVis MedicalSolutions). This tool provided a user-friendly interface for spline draw-ing and editing, with which the outer borders of the ROIs were tracedclosely. The freehand drawing technique offers a higher accuracy than
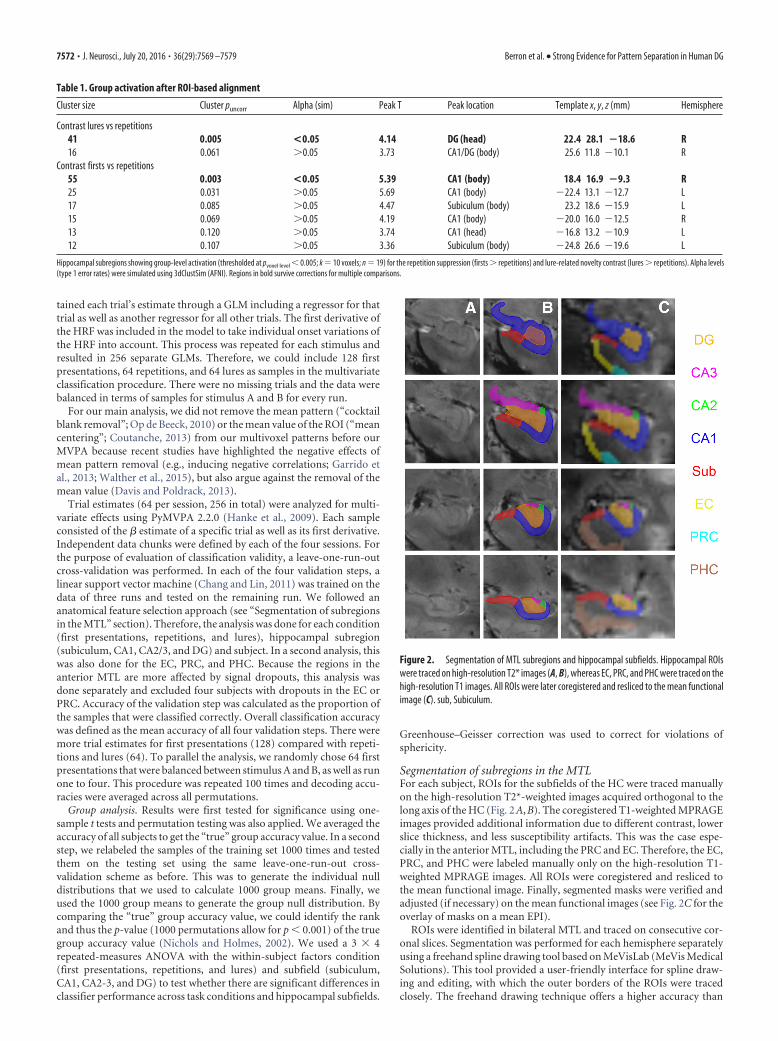
Table 1. Group activation after ROI-based alignment
Cluster size Cluster puncorr Alpha (sim) Peak T Peak location Template x, y, z (mm) Hemisphere
Contrast lures vs repetitions41 0.005 <0.05 4.14 DG (head) 22.4 28.1 �18.6 R16 0.061 �0.05 3.73 CA1/DG (body) 25.6 11.8 10.1 R
Contrast firsts vs repetitions55 0.003 <0.05 5.39 CA1 (body) 18.4 16.9 �9.3 R25 0.031 �0.05 5.69 CA1 (body) 22.4 13.1 12.7 L17 0.085 �0.05 4.47 Subiculum (body) 23.2 18.6 15.9 L15 0.069 �0.05 4.19 CA1 (body) 20.0 16.0 12.5 R13 0.120 �0.05 3.74 CA1 (head) 16.8 13.2 10.9 L12 0.107 �0.05 3.36 Subiculum (body) 24.8 26.6 19.6 L
Hippocampal subregions showing group-level activation (thresholded at pvoxel level � 0.005; k � 10 voxels; n � 19) for the repetition suppression (firsts � repetitions) and lure-related novelty contrast (lures � repetitions). Alpha levels(type 1 error rates) were simulated using 3dClustSim (AFNI). Regions in bold survive corrections for multiple comparisons.
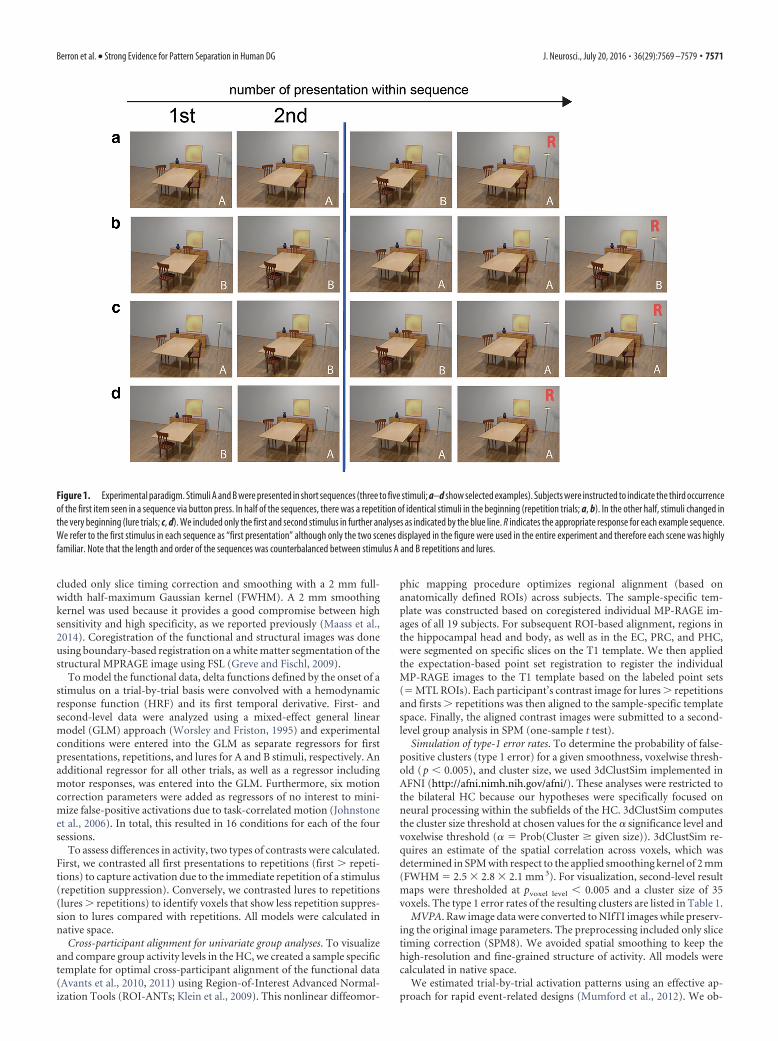
Figure 2. Segmentation of MTL subregions and hippocampal subfields. Hippocampal ROIswere traced on high-resolution T2* images (A, B), whereas EC, PRC, and PHC were traced on thehigh-resolution T1 images. All ROIs were later coregistered and resliced to the mean functionalimage (C). sub, Subiculum.
7572 • J. Neurosci., July 20, 2016 • 36(29):7569 –7579 Berron et al. • Strong Evidence for Pattern Separation in Human DG

conventional voxel-by-voxel drawing techniques. The outer border con-tours were converted to NIfTI images for further processing (Wisse et al.,2012; Kuijf, 2013).
Subfields in the head and body of the HC were traced according to therecently published protocol for hippocampal subfield segmentation at 7T (Wisse et al., 2012). The hippocampal head and body was divided intothe subiculum, CA1, CA2, CA3, and DG. For further analyses, the CA2was collapsed with CA3 to a combined CA2-3 region.
An important aim in our study was to separate the DG and CA3functionally. The Wisse et al. (2012) protocol is the only segmentationprotocol that enables the division of these subfields on 7 T MRI data.However, it has to be noted that the suggested boundary between CA3and DG slightly underestimates CA3 because it does not include the partof CA3 that is folded within DG. Because this boundary was not visible onour T2*-weighted images, we relied on the geometrical boundary sug-gested by the protocol because it can be identified and replicated acrosssubjects reliably. The hippocampal tail was not delineated.
Tracing of the EC started anteriorly at the level of the amygdala, mov-ing caudally along the parahippocampal gyrus. In the anterior part, theEC borders the amygdala nuclei medially (Fischl et al., 2009). As soon asthe gyrus ambiens disappears and the hippocampal fissure opens, the ECborders the parasubiculum medially. Laterally, the EC borders the PRC.The opening of the collateral sulcus typically coincides with the lateralborder of the EC and was therefore chosen as the lateral boundary. Con-trary to other protocols for the EC and PRC (Insausti et al., 1998), thepart of the EC within medial banks of the collateral sulcus that dependson the depth of the collateral sulcus was not segmented because thisborder shows remarkable within- and between-subject variability and isalso sometimes difficult to identify due to partially occurring susceptibil-ity artifacts.
The PRC was defined as the region between the medial and lateraledges of the collateral sulcus (covering medial and lateral banks). Seg-mentation of the PHC started one slice after the disappearance of thecollateral sulcus directly posterior to PRC and EC. Labeling was contin-ued posteriorly, ending on the last slice, where the inferior and superiorcolliculi were jointly visible. The PHC was delineated as the region be-tween subiculum (medial border) and the deepest point of the collateralsulcus (Zeineh et al., 2001) (see Fig. 2C for examples).
ResultsBehavioral performanceDuring the memory task, subjects saw sequences with severalpresentations of the same two stimuli (A and B; Fig. 1). Their taskwas to indicate the third occurrence of the first stimulus seen in asequence via button press. Given this, the subjects were requiredto distinguish between the two similar stimuli in each of thesequences. To assess subjects’ behavioral performance, button
presses were evaluated. Missed or invalid button presses werecounted as incorrect responses. The average incorrect rate was2% (corresponding to 3 false sequences), indicating that sub-jects were highly accurate in discriminating between the sim-ilar scenes. After the MRI session, subjects were asked to drawboth scenes in as detailed a manner as possible. These debrief-ings confirmed the results and showed that all of the remain-ing 19 subjects had a highly detailed memory for the wholeindoor scene.
DG shows less repetition suppression for lures comparedwith repetitionsThe sequences that were used in the task consisted of presenta-tions of the same two stimuli. Both stimuli (A and B) had thesame probability to be the first stimulus (target) in a given se-quence. The second stimulus within a sequence could be either arepetition of the first one or a presentation of the other stimulus.We refer to the presentation of the other stimulus as a lure trialand to the exact repetition of a stimulus as a repetition trial. Notethat, in contrast to earlier studies, being a lure or a repetitionstimulus was independent of the identity of the stimulus. Thisdepended only on the position within the sequence.
Two different contrasts were analyzed. First, we assessedwhich regions show repetition suppression by comparing all firstpresentations within each sequence (the first stimulus of eachsequence) with repetitions (first � repetitions). Second, we con-trasted all lure trials against repetitions (lures � repetitions). Toassess the regions that were significantly activated across subjects,we calculated second-level group activation maps after cross-participant alignment using ROI-ANTS (see Materials and Meth-ods). Activated clusters were identified within bilateral HC(small-volume correction: pvoxel-level � 0.005 and pcluster� 0.05;see Materials and Methods for details). Higher activation in firstpresentations compared with repetitions was found in the rightCA1 (Fig. 3A, Table 1). However, there were no voxels thatshowed significant repetition enhancement (i.e., repetition �first). We did observe significantly higher activation for lure trialscompared with repetitions in the DG of the right anterior HC(Fig. 3A, Table 1). Additional activation clusters in the subicu-lum, CA1, and CA1/DG that did not survive multiple compari-sons can be found in Table 1. For completeness, we also show the� estimates across all conditions from all anatomical ROIs thatcan be found in Figure 4.
Figure 3. Univariate group results. A, Custer in CA1 (top row) shows significantly more activity in first presentations compared with repetitions. However, the cluster in the anterior DG(bottom row) shows significantly higher activation in lures compared with repetitions. Both clusters are in the right HC. Results are small-volume corrected for the bilateral HC ( pvoxel-level � 0.005and pcluster � 0.05). Images on the right show a coronal view and those on the left show a sagittal view. B, Beta estimates extracted from clusters in DG (left) and CA1 (right). Error bars indicate SEM.C, Stimulus-specific novelty contrasts. Clusters of activity resulting from lure-related novelty contrasts of individual stimuli. A, Lure A � repetition A; B, lure B � repetition B. C, sagittal view. Resultsare illustrated on the group T1 template ( pvoxel-level � 0.005, k � 10 voxels).
Berron et al. • Strong Evidence for Pattern Separation in Human DG J. Neurosci., July 20, 2016 • 36(29):7569 –7579 • 7573

We extracted mean � estimates for the significantly activatedclusters on the group level in the right CA1 and DG. Mean activitywithin these clusters is shown for first presentations, repetitions,and lures in Figure 3B.
An exploratory analysis was done to further investigate thenature of the novelty signal related to lures and determinewhether there are distinct novelty signals for the two differentstimuli. As mentioned previously, this was only possible due tothe use of few stimuli in our paradigm (cf. trial unique stimuliin Bakker et al., 2008). Therefore, we calculated the individualcontrasts for stimulus A and B (lure A � repetition A and lureB � repetition B). The different contrasts yielded two spatiallyrelated but distinct clusters in the anterior DG. Although nei-ther cluster (cluster A: pvoxel-level � 0.005 (unc), k � 10 voxels;cluster B: pvoxel-level � 0.005 (unc), k � 30 voxels; Figure 3C)survived multiple comparisons, interestingly, the two result-ing clusters were entirely nonoverlapping (i.e., the two clustersdid not share any voxels in common).
DG but not other subregions contains representationalstimulus informationTo assess the fine-grained activity patterns for A and B stimuli, amultivariate classifier (linear CSVMC) was trained on the A andB stimulus trials from three runs. Classifier performance was thentested on the unseen portion of trials corresponding to the left-out run (see Materials and Methods). This analysis was per-formed separately for first presentation, repetition, and luretrials. Each classifier yielded an accuracy value for each condition(first presentation, repetition, and lure trials) and hippocampalsubfield (subiculum, CA1, CA2/CA3, DG) for each participant(Fig. 5A). For every analysis, a comparison between the accura-cies in the left and right hemisphere was conducted using 2 � 4repeated-measures ANOVAs with the within-subject factorshemisphere and subfield. None of these tests demonstrated any
significant hemispheric differences, so all results reported are col-lapsed across hemispheres.
Mean group classifier accuracies were tested for signifi-cance using nonparametric permutation testing as well as one-sample t tests (see Materials and Methods). Mean groupclassification performance in the top 1% of the random per-mutations indicated above-chance accuracy (at p � 0.001). Itwas not possible to decode stimulus identity from first presen-tations or repetition trials with accuracies significantly abovechance. Classifier accuracies derived from lure trials were sig-nificantly different from chance level (50%) only in DG (M �57.2%, SEM � 1.6, permutation testing: p � 0.001, t test:t(18) � 4.6, p � 0.001) (corrected for multiple comparisonsusing Holm’s sequentially rejective Bonferroni correctionwith an initial critical � of p � 0.004).
To test whether classifier performance is significantly differ-ent within the 4 hippocampal subregions across the 3 task condi-tions, we performed a 3 � 4 repeated-measures ANOVA with thewithin-subject factors condition (first presentation, repetition,and lure trials) and subfield (subiculum, CA1, CA2-3, and DG).This ANOVA revealed a significant main effect for the factorcondition (F(1.2,21.6) � 4.2, p � 0.047, Greenhouse–Geisser cor-rected) and a significant condition � subfield interaction(F(3.29,59.15) � 4.4, p � 0.006, Greenhouse–Geisser corrected).This was due to significantly higher classification accuracy duringlure trials in DG (M � 57.2, SEM � 1.6) compared with thesubiculum (M � 51, SEM � 1.5, t(18) � 2.5, p � 0.02), CA1(M � 48.8, SEM � 1.9, t(18) � 3.7, p � 0.002), and CA2-3 (M �51.7, SEM � 1.5, t(18) � 2.4, p � 0.03). Furthermore, classifi-cation accuracy was higher in DG during lure trials (M � 57.2,SEM � 1.6) compared with first presentation trials (M � 49.4,SEM � 0.8, t(18) � 5.3, p � 0.000) and repetition trials (M �48.6, SEM � 2.4, t(18) � 3, p � 0.008, corrected by usingHolm’s sequentially rejective Bonferroni correction, with an ini-
Figure 4. Beta estimates across MTL regions. Beta estimates were extracted for each MTL region and hippocampal subfield for first presentations, repetitions, and lures.
7574 • J. Neurosci., July 20, 2016 • 36(29):7569 –7579 Berron et al. • Strong Evidence for Pattern Separation in Human DG
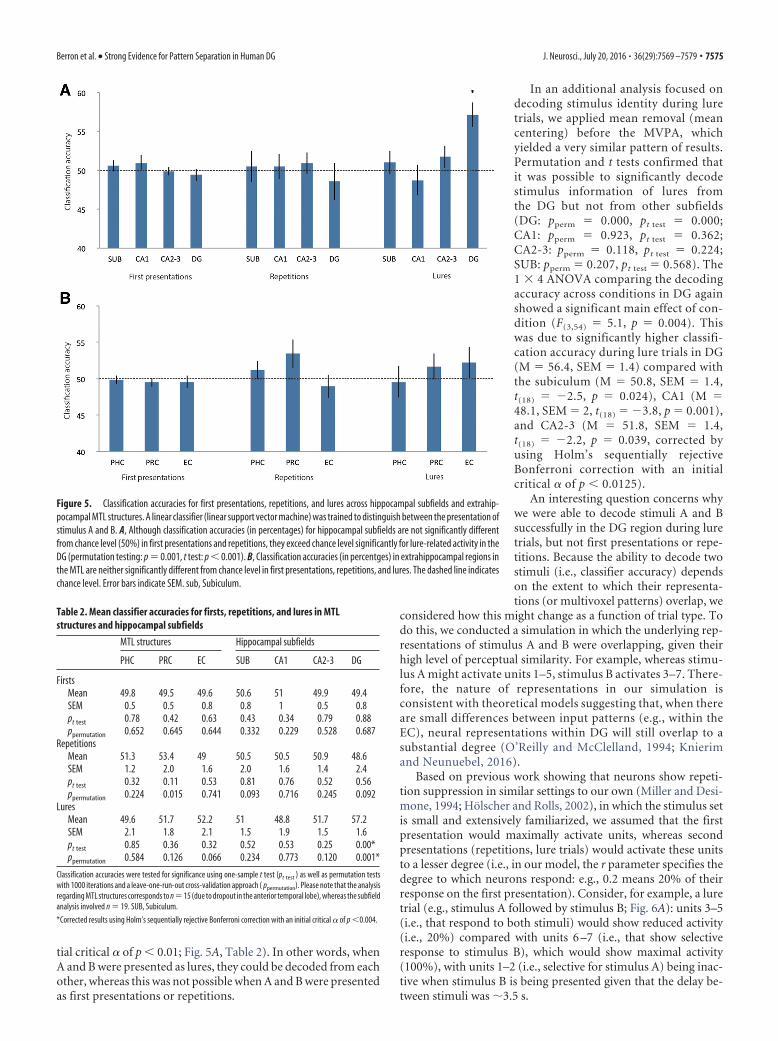
tial critical � of p � 0.01; Fig. 5A, Table 2). In other words, whenA and B were presented as lures, they could be decoded from eachother, whereas this was not possible when A and B were presentedas first presentations or repetitions.
In an additional analysis focused ondecoding stimulus identity during luretrials, we applied mean removal (meancentering) before the MVPA, whichyielded a very similar pattern of results.Permutation and t tests confirmed thatit was possible to significantly decodestimulus information of lures fromthe DG but not from other subfields(DG: pperm � 0.000, pt test � 0.000;CA1: pperm � 0.923, pt test � 0.362;CA2-3: pperm � 0.118, pt test � 0.224;SUB: pperm � 0.207, pt test � 0.568). The1 � 4 ANOVA comparing the decodingaccuracy across conditions in DG againshowed a significant main effect of con-dition (F(3,54) � 5.1, p � 0.004). Thiswas due to significantly higher classifi-cation accuracy during lure trials in DG(M � 56.4, SEM � 1.4) compared withthe subiculum (M � 50.8, SEM � 1.4,t(18) � 2.5, p � 0.024), CA1 (M �48.1, SEM � 2, t(18) � 3.8, p � 0.001),and CA2-3 (M � 51.8, SEM � 1.4,t(18) � 2.2, p � 0.039, corrected byusing Holm’s sequentially rejectiveBonferroni correction with an initialcritical � of p � 0.0125).
An interesting question concerns whywe were able to decode stimuli A and Bsuccessfully in the DG region during luretrials, but not first presentations or repe-titions. Because the ability to decode twostimuli (i.e., classifier accuracy) dependson the extent to which their representa-tions (or multivoxel patterns) overlap, we
considered how this might change as a function of trial type. Todo this, we conducted a simulation in which the underlying rep-resentations of stimulus A and B were overlapping, given theirhigh level of perceptual similarity. For example, whereas stimu-lus A might activate units 1–5, stimulus B activates 3–7. There-fore, the nature of representations in our simulation isconsistent with theoretical models suggesting that, when thereare small differences between input patterns (e.g., within theEC), neural representations within DG will still overlap to asubstantial degree (O’Reilly and McClelland, 1994; Knierimand Neunuebel, 2016).
Based on previous work showing that neurons show repeti-tion suppression in similar settings to our own (Miller and Desi-mone, 1994; Holscher and Rolls, 2002), in which the stimulus setis small and extensively familiarized, we assumed that the firstpresentation would maximally activate units, whereas secondpresentations (repetitions, lure trials) would activate these unitsto a lesser degree (i.e., in our model, the r parameter specifies thedegree to which neurons respond: e.g., 0.2 means 20% of theirresponse on the first presentation). Consider, for example, a luretrial (e.g., stimulus A followed by stimulus B; Fig. 6A): units 3–5(i.e., that respond to both stimuli) would show reduced activity(i.e., 20%) compared with units 6 –7 (i.e., that show selectiveresponse to stimulus B), which would show maximal activity(100%), with units 1–2 (i.e., selective for stimulus A) being inac-tive when stimulus B is being presented given that the delay be-tween stimuli was �3.5 s.
Figure 5. Classification accuracies for first presentations, repetitions, and lures across hippocampal subfields and extrahip-pocampal MTL structures. A linear classifier (linear support vector machine) was trained to distinguish between the presentation ofstimulus A and B. A, Although classification accuracies (in percentages) for hippocampal subfields are not significantly differentfrom chance level (50%) in first presentations and repetitions, they exceed chance level significantly for lure-related activity in theDG (permutation testing: p � 0.001, t test: p � 0.001). B, Classification accuracies (in percentges) in extrahippocampal regions inthe MTL are neither significantly different from chance level in first presentations, repetitions, and lures. The dashed line indicateschance level. Error bars indicate SEM. sub, Subiculum.
Table 2. Mean classifier accuracies for firsts, repetitions, and lures in MTLstructures and hippocampal subfields
MTL structures Hippocampal subfields
PHC PRC EC SUB CA1 CA2-3 DG
FirstsMean 49.8 49.5 49.6 50.6 51 49.9 49.4SEM 0.5 0.5 0.8 0.8 1 0.5 0.8pt test 0.78 0.42 0.63 0.43 0.34 0.79 0.88ppermutation 0.652 0.645 0.644 0.332 0.229 0.528 0.687
RepetitionsMean 51.3 53.4 49 50.5 50.5 50.9 48.6SEM 1.2 2.0 1.6 2.0 1.6 1.4 2.4pt test 0.32 0.11 0.53 0.81 0.76 0.52 0.56ppermutation 0.224 0.015 0.741 0.093 0.716 0.245 0.092
LuresMean 49.6 51.7 52.2 51 48.8 51.7 57.2SEM 2.1 1.8 2.1 1.5 1.9 1.5 1.6pt test 0.85 0.36 0.32 0.52 0.53 0.25 0.00*ppermutation 0.584 0.126 0.066 0.234 0.773 0.120 0.001*
Classification accuracies were tested for significance using one-sample t test (pt test ) as well as permutation testswith 1000 iterations and a leave-one-run-out cross-validation approach ( ppermutation). Please note that the analysisregarding MTL structures corresponds to n�15 (due to dropout in the anterior temporal lobe), whereas the subfieldanalysis involved n � 19. SUB, Subiculum.
*Corrected results using Holm’s sequentially rejective Bonferroni correction with an initial critical � of p �0.004.
Berron et al. • Strong Evidence for Pattern Separation in Human DG J. Neurosci., July 20, 2016 • 36(29):7569 –7579 • 7575
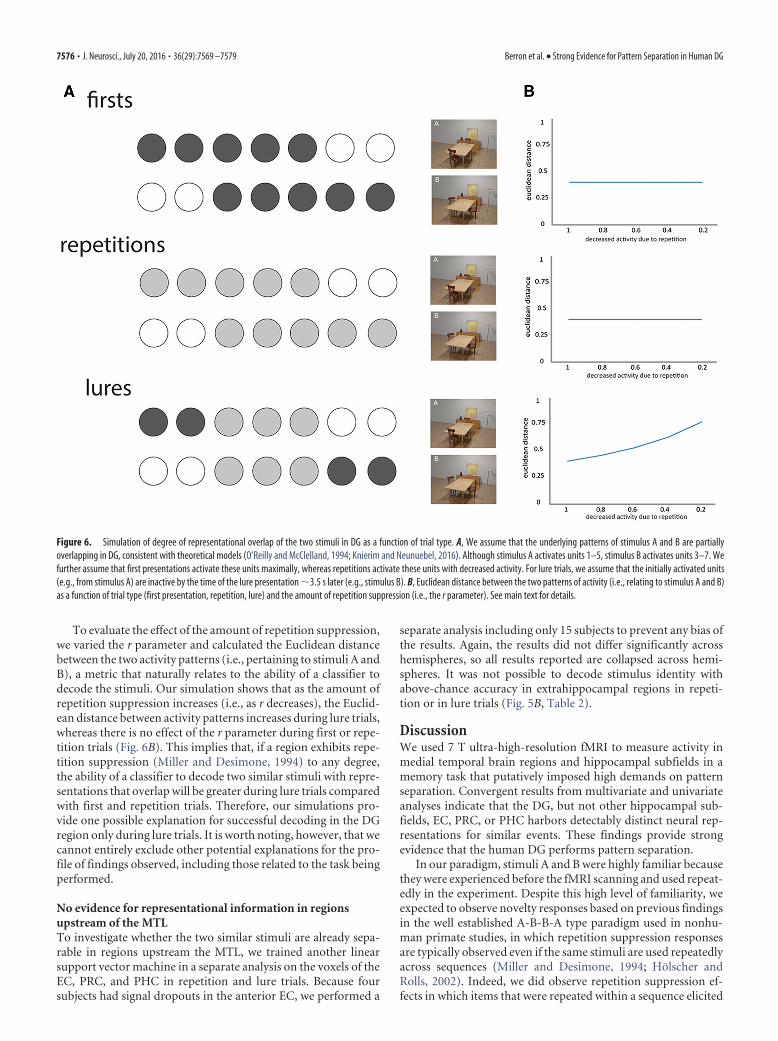
To evaluate the effect of the amount of repetition suppression,we varied the r parameter and calculated the Euclidean distancebetween the two activity patterns (i.e., pertaining to stimuli A andB), a metric that naturally relates to the ability of a classifier todecode the stimuli. Our simulation shows that as the amount ofrepetition suppression increases (i.e., as r decreases), the Euclid-ean distance between activity patterns increases during lure trials,whereas there is no effect of the r parameter during first or repe-tition trials (Fig. 6B). This implies that, if a region exhibits repe-tition suppression (Miller and Desimone, 1994) to any degree,the ability of a classifier to decode two similar stimuli with repre-sentations that overlap will be greater during lure trials comparedwith first and repetition trials. Therefore, our simulations pro-vide one possible explanation for successful decoding in the DGregion only during lure trials. It is worth noting, however, that wecannot entirely exclude other potential explanations for the pro-file of findings observed, including those related to the task beingperformed.
No evidence for representational information in regionsupstream of the MTLTo investigate whether the two similar stimuli are already sepa-rable in regions upstream the MTL, we trained another linearsupport vector machine in a separate analysis on the voxels of theEC, PRC, and PHC in repetition and lure trials. Because foursubjects had signal dropouts in the anterior EC, we performed a
separate analysis including only 15 subjects to prevent any bias ofthe results. Again, the results did not differ significantly acrosshemispheres, so all results reported are collapsed across hemi-spheres. It was not possible to decode stimulus identity withabove-chance accuracy in extrahippocampal regions in repeti-tion or in lure trials (Fig. 5B, Table 2).
DiscussionWe used 7 T ultra-high-resolution fMRI to measure activity inmedial temporal brain regions and hippocampal subfields in amemory task that putatively imposed high demands on patternseparation. Convergent results from multivariate and univariateanalyses indicate that the DG, but not other hippocampal sub-fields, EC, PRC, or PHC harbors detectably distinct neural rep-resentations for similar events. These findings provide strongevidence that the human DG performs pattern separation.
In our paradigm, stimuli A and B were highly familiar becausethey were experienced before the fMRI scanning and used repeat-edly in the experiment. Despite this high level of familiarity, weexpected to observe novelty responses based on previous findingsin the well established A-B-B-A type paradigm used in nonhu-man primate studies, in which repetition suppression responsesare typically observed even if the same stimuli are used repeatedlyacross sequences (Miller and Desimone, 1994; Holscher andRolls, 2002). Indeed, we did observe repetition suppression ef-fects in which items that were repeated within a sequence elicited
Figure 6. Simulation of degree of representational overlap of the two stimuli in DG as a function of trial type. A, We assume that the underlying patterns of stimulus A and B are partiallyoverlapping in DG, consistent with theoretical models (O’Reilly and McClelland, 1994; Knierim and Neunuebel, 2016). Although stimulus A activates units 1–5, stimulus B activates units 3–7. Wefurther assume that first presentations activate these units maximally, whereas repetitions activate these units with decreased activity. For lure trials, we assume that the initially activated units(e.g., from stimulus A) are inactive by the time of the lure presentation �3.5 s later (e.g., stimulus B). B, Euclidean distance between the two patterns of activity (i.e., relating to stimulus A and B)as a function of trial type (first presentation, repetition, lure) and the amount of repetition suppression (i.e., the r parameter). See main text for details.
7576 • J. Neurosci., July 20, 2016 • 36(29):7569 –7579 Berron et al. • Strong Evidence for Pattern Separation in Human DG
reduced neural responses (cf. first presentations) in CA1. How-ever, increased responses related to lure stimuli (cf. exact repeti-tions) were found exclusively in the DG. We refer to the activityincrease for lures as “novelty” because, in any given short se-quence, they appeared for the first time. Therefore, unlikeprevious studies (Bakker et al., 2008; Lacy et al., 2011), thiswithin-sequence “novelty” was not related to the use of trialunique stimuli, but rather to the first appearance in a sequence.
As mentioned previously, the lure-related novelty responsesthat we observed in the DG (and in DG/CA3 in Bakker et al.,2008) do not alone provide sufficient evidence to justify the in-ference of the operation of pattern separation computations inthis region because they are also consistent with the hypothesisthat they reflect generic novelty signals produced by a match–mismatch process (Kumaran and Maguire, 2009). Importantly,we provide two lines of evidence to bolster the validity of aninference about pattern separation from such novelty responses.First, our results suggest that novelty responses for different lures(A and B) were topographically distinct in right anterior DG asdetermined by nonoverlapping subsets of voxels, as would bepredicted by idealized models of pattern separation (McClellandet al., 1995; Norman and O’Reilly, 2003) in which even very sim-ilar stimuli are represented by orthogonal representations. Nota-bly, we were able to achieve this through a paradigm optimized todetect this effect through the use of only two stimuli (cf. trialunique in Bakker et al., 2008) and ultra-high-resolution fMRI.
Second, our study also afforded the unique opportunity tocombine MVPA with univariate analyses to characterize the linkbetween these lure-related novelty responses and the underlyingrepresentations of the two stimuli. MVPA allowed us to deter-mine whether fine-grained patterns of distributed voxels within aregion represent discriminative information (Norman et al.,2006; Sapountzis et al., 2010; Jimura and Poldrack, 2012). ThisMVPA analysis revealed representational stimulus informationselectively in DG, but not in CA2-3 or CA1. Decoding accuracieswere not only significantly higher in DG compared with anyother hippocampal subregion, it was also not possible to signifi-cantly decode stimulus information in regions upstream theMTL such as the EC, PRC, or PHC. These results, therefore,demonstrate that representations for similar stimuli overlap inneocortical regions but are less overlapping in the DG (McClel-land et al., 1995; O’Reilly et al., 2014).
The accuracies of the multivariate classifier were significantlyhigher in DG during lure trials compared with first presentationsand repetitions. In other words, when A and B were presented aslures, they could be decoded from each other, whereas this wasnot possible when presented as first presentations or repetitions.Our simulation (Fig. 6) provides a mechanistic account for theseeffects by showing that, for a region that shows repetition sup-pression, the ability of a classifier to distinguish activity patterns ishigher in lure trials (cf. first presentations, repetitions). Althoughthe DG region tended to show repetition suppression (Fig. 4), thiswas not significant at the statistical threshold used. However,given that our model shows that enhanced decodability is a con-tinuous function of the degree to which the region shows repeti-tion suppression (i.e., the r parameter in our model: Fig. 6), oursimulations support one potential reason that successful decod-ing was possible in the DG region only during lure trials.
Together with the results of the univariate analyses, our find-ings suggest that, at least in our paradigm, lure-related noveltyresponses do indeed reflect neural representations that are pat-tern separated in DG. Further, the combination of univariateresults and successful multivariate decoding demonstrate that
stimulus representations in the DG are both stable (i.e., acrossrepetitions) and dynamic (i.e., show lure-related novelty re-sponses). Although this result provides novel evidence about thenature of representations within the human DG, it does not nec-essarily arbitrate between models that include the potential forlearning within connections between the EC and DG (Treves andRolls, 1992), in contrast to those that favor fixed random projec-tions between these two regions (O’Reilly and McClelland, 1994).
Interestingly, we did not find lure-related novelty responses orsignificant stimulus information at the multivariate level in theCA3 region, the main target of projections from the DG. Thereare several potential explanations for our findings: first, our re-sults parallel previous neurophysiological evidence showing thatthe correlation between population activity recorded while therat experienced two very similar environments was considerablylower in DG than in CA3 (Leutgeb et al., 2007) under conditionsthat have parallels with our paradigm (i.e., the two environmentswere highly similar, akin to stimulus A and B in our experiment,which differed by the location of only two objects). Interestingly,in the Leutgeb et al. (2007) study, this difference between DG andCA3 disappeared as the environments morphed into more dis-similar shapes, when representations in both subregions wereeffectively decorrelated between the two environments. Second,from an anatomical perspective, a degree of reduction of theorthogonality of representations in CA3 (cf. DG) would be ex-pected based on the convergent nature of anatomical projectionsfrom DG to CA3 (Treves and Rolls, 1994). Third, recent evidencesuggests that the rodent CA3 may be functionally divided intoproximal and distal regions as a function of their proximity to theDG, with the functional (i.e., in terms of pattern separation) andanatomical (i.e., in terms of amount of recurrent excitatory con-nections) properties of the proximal CA3 being more akin to theDG. Given that we effectively collapsed across proximal and distalCA3 regions, one would predict, based on recent evidence, thatrepresentations in CA3 would be less pattern separated than DG(Lee et al., 2015).
Our findings, therefore, are highly consistent with previousstudies in rodents (Leutgeb et al., 2007; Neunuebel and Knierim,2014; Lee et al., 2015). It is important to note, however, that DGand CA3 are functionally embedded into a distributed networkof brain regions that comprise other hippocampal subfields aswell as extrahippocampal MTL structures. To understand thenetwork-level organization of pattern separation, it is necessaryto simultaneously investigate activity in all of these regions andthereby to determine whether pattern separation is limited toDG/CA3. fMRI allows such coverage and therefore offers thepotential to provide a comprehensive understanding of thenetwork-level organization of pattern separation processes.
fMRI studies showed that patterns of activity across the HCcan reliably distinguish between different episodic events even ifthey were highly similar (Chadwick et al., 2011; Bonnici et al.,2012b). Hippocampal activity patterns of very similar sceneswere also more distinct within the HC compared with regionsupstream of the MTL (Bonnici et al., 2012b). These studies,therefore, provide evidence that the HC as a whole supports pat-tern separation, but do not localize this computation to any sub-region. Although a recent study presented evidence thatmultivariate voxel patterns of two similar environments weremore distinct in DG/CA3 compared with CA1, the interpretationof this finding is complicated because this analysis did not involvea direct comparison of the representations of the two similarenvironments in DG/CA3 and CA1. Instead, a “remapping” in-dex was computed (Kyle et al., 2015) by comparing the represen-
Berron et al. • Strong Evidence for Pattern Separation in Human DG J. Neurosci., July 20, 2016 • 36(29):7569 –7579 • 7577
tational similarity of each environment to itself (i.e., measure ofconsistency) with its average representational similarity to allother environments. Further, this study was not able to localizetheir effects to the DG region specifically, as in our study. Oneother study showed that it is possible to decode representations ofsimilar scenes from hippocampal subfields (Bonnici et al., 2012a)and accuracy of decoding was not significantly different betweensubfields. Compared with these previous MVPA studies at 3 T,our ultra-high-resolution fMRI at 7 T provided us with an op-portunity to search for representations at a 6- to 7-fold smallerscale. A single voxel in our study would contain �30,000 granuleneurons, whereas this would have been 200,000 per voxel in ear-lier high-resolution studies at 3 T (Boldrini et al., 2013). Ourmethodology therefore was critical in demonstrating that repre-sentations of very similar events are indeed less overlapping inDG compared with CA1, CA2-3, and the subiculum.
To summarize, we used ultra-high-resolution 7 T fMRI incombination with a novel paradigm and MVPA to investigate therepresentation of similar stimuli within human hippocampalsubfields. Our MVPA results provide evidence that the represen-tations of highly similar scenes are less overlapping in the DGcompared with CA2-3 and other hippocampal subfields, as wellas the EC, PRC, and PHC. Further, we demonstrate a mechanisticlink between the genesis of lure-related novelty signals in ourparadigm and the underlying stimulus representations in DG.Together, our results provide strong evidence that the human DGplays a unique role in pattern separation and suggest that stimu-lus representations within the DG are both stable and dynamicacross time.
ReferencesAvants BB, Tustison NJ, Song G, Cook PA, Klein A, Gee JC (2011) A repro-
ducible evaluation of ANTs similarity metric performance in brain imageregistration. Neuroimage 54:2033–2044. CrossRef Medline
Avants BB, Yushkevich P, Pluta J, Minkoff D, Korczykowski M, Detre J, GeeJC (2010) The optimal template effect in hippocampus studies of dis-eased populations. Neuroimage 49:2457–2466. CrossRef Medline
Azab M, Stark SM, Stark CE (2014) Contributions of human hippocampalsubfields to spatial and temporal pattern separation. Hippocampus 24:293–302. CrossRef Medline
Bakker A, Kirwan CB, Miller M, Stark CE (2008) Pattern separation in thehuman hippocampal CA3 and dentate gyrus. Science 319:1640 –1642.CrossRef Medline
Bakker A, Krauss GL, Albert MS, Speck CL, Jones LR, Stark CE, Yassa MA,Bassett SS, Shelton AL, Gallagher M (2012) Reduction of hippocampalhyperactivity improves cognition in amnestic mild cognitive impairment.Neuron 74:467– 474. CrossRef Medline
Boldrini M, Santiago AN, Hen R, Dwork AJ, Rosoklija GB, Tamir H, ArangoV, John Mann J (2013) Hippocampal granule neuron number and den-tate gyrus volume in antidepressant-treated and untreated major depres-sion. Neuropsychopharmacology 38:1068 –1077. CrossRef Medline
Bonnici HM, Chadwick MJ, Kumaran D, Hassabis D, Weiskopf N, MaguireEA (2012a) Multi-voxel pattern analysis in human hippocampal sub-fields. Front Hum Neurosci 6:290. Medline
Bonnici HM, Kumaran D, Chadwick MJ, Weiskopf N, Hassabis D, MaguireEA (2012b) Decoding representations of scenes in the medial temporallobes. Hippocampus 22:1143–1153. CrossRef Medline
Carr VA, Rissman J, Wagner AD (2010) Imaging the human medial tem-poral lobe with high-resolution fMRI. Neuron 65:298 –308. CrossRefMedline
Chadwick MJ, Hassabis D, Maguire EA (2011) Decoding overlapping mem-ories in the medial temporal lobes using high-resolution fMRI. LearnMem 18:742–746. CrossRef Medline
Chang CC, Lin CJ (2011) LIBSVM: a library for support vector machines.ACM Transactions on Intelligent Systems and Technology 27:1–27.
Cohen N, Eichenbaum H (1993) Memory, amnesia and the hippocampalsystem. Cambridge, MA: MIT.
Colgin LL, Moser EI, Moser MB (2008) Understanding memory through
hippocampal remapping. Trends Neurosci 31:469 – 477. CrossRefMedline
Coutanche MN (2013) Distinguishing multi-voxel patterns and mean acti-vation: why, how, and what does it tell us? Cogn Affect Behav Neurosci13:667– 673. CrossRef Medline
Davachi L (2006) Item, context and relational episodic encoding in humans.Curr Opin Neurobiol 16:693–700. Medline
Davis T, Poldrack RA (2013) Measuring neural representations with fMRI:practices and pitfalls. Ann NY Acad Sci 1296:108 –134. CrossRef Medline
Eichenbaum H (2004) Hippocampus cognitive processes and neuralrepresentations that underlie declarative memory. Neuron 44:109 –120. CrossRef Medline
Fischl B, Stevens AA, Rajendran N, Yeo BT, Greve DN, Van Leemput K,Polimeni JR, Kakunoori S, Buckner RL, Pacheco J, Salat DH, Melcher J,Frosch MP, Hyman BT, Grant PE, Rosen BR, van der Kouwe AJ, WigginsGC, Wald LL, Augustinack JC (2009) Predicting the location of entorhi-nal cortex from MRI. Neuroimage 47:8 –17. CrossRef Medline
Garrido L, Vaziri-Pashkam M, Nakayama K, Wilmer J (2013) The conse-quences of subtracting the mean pattern in fMRI multivariate correlationanalyses. Front Neurosci 7:174. Medline
Greve DN, Fischl B (2009) Accurate and robust brain image alignmentusing boundary-based registration. Neuroimage 48:63–72. CrossRefMedline
Hanke M, Halchenko YO, Sederberg PB, Hanson SJ, Haxby JV, Pollmann S(2009) PyMVPA: A python toolbox for multivariate pattern analysis offMRI data. Neuroinformatics 7:37–53. CrossRef Medline
Haynes JD (2015) A primer on pattern-based approaches to fMRI: princi-ples, pitfalls, and perspectives. Neuron 87:257–270. CrossRef Medline
Haynes JD, Rees G (2006) Decoding mental states from brain activity inhumans. Nat Rev Neurosci 7:523–534. CrossRef Medline
Holscher C, Rolls ET (2002) Perirhinal cortex neuronal activity is actively related toworking memory in the macaque. Neural Plast 9:41–51. CrossRef Medline
Insausti R, Juottonen K, Soininen H, Insausti AM, Partanen K, Vainio P,Laakso MP, Pitkanen A (1998) MR volumetric analysis of the humanentorhinal, perirhinal, and temporopolar cortices. Am J Neuroradiol 19:659 – 671. Medline
Jimura K, Poldrack RA (2012) Analyses of regional-average activation andmultivoxel pattern information tell complementary stories. Neuropsy-chologia 50:544 –552. CrossRef Medline
Johnstone T, Ores Walsh KS, Greischar LL, Alexander AL, Fox AS, DavidsonRJ, Oakes TR (2006) Motion correction and the use of motion covari-ates in multiple-subject fMRI analysis. Hum Brain Mapp 27:779 –788.CrossRef Medline
Klein A, Andersson J, Ardekani BA, Ashburner J, Avants B, Chiang MC,Christensen GE, Collins DL, Gee J, Hellier P, Song JH, Jenkinson M,Lepage C, Rueckert D, Thompson P, Vercauteren T, Woods RP, Mann JJ,Parsey RV (2009) Evaluation of 14 nonlinear deformation algorithmsapplied to human brain MRI registration. Neuroimage 46:786 – 802.CrossRef Medline
Knierim JJ, Neunuebel JP (2016) Tracking the flow of hippocampal compu-tation: Pattern separation, pattern completion, and attractor dynamics.Neurobiol Learn Mem 129:38 – 49. CrossRef Medline
Kuijf HJ (2013) Image processing techniques for quantification and assess-ment of brain MRI (doctoral dissertation). Utrecht University: Utrecht,ISBN: 978-90-393-6037-8.
Kumaran D, Maguire EA (2009) Novelty signals: a window into hippocam-pal information processing. Trends Cogn Sci 13:47–54. CrossRef Medline
Kyle C, Stokes J, Lieberman J, Hassan A, Ekstrom A (2015) Successful re-trieval of competing spatial environments in humans involves hippocam-pal pattern separation mechanisms. eLife 4:pii:e10499. CrossRef Medline
Lacy JW, Yassa MA, Stark SM, Muftuler LT, Stark CE (2011) Distinct pat-tern separation related transfer functions in human CA3/dentate and CA1revealed using high-resolution fMRI and variable mnemonic similarity.Learn Mem 18:15–18. Medline
Lee H, Wang C, Deshmukh SS, Knierim JJ (2015) Neural population evi-dence of functional heterogeneity along the CA3 transverse axis: patterncompletion versus pattern separation. Neuron 87:1093–1105. CrossRefMedline
Leutgeb JK, Leutgeb S, Moser MB, Moser EI (2007) Pattern separation inthe dentate gyrus and CA3 of the hippocampus. Science 315:961–966.CrossRef Medline
Maass A, Schutze H, Speck O, Yonelinas A, Tempelmann C, Heinze HJ,
7578 • J. Neurosci., July 20, 2016 • 36(29):7569 –7579 Berron et al. • Strong Evidence for Pattern Separation in Human DG
Berron D, Cardenas-Blanco A, Brodersen KH, Stephan KE, Duzel E(2014) Laminar activity in the hippocampus and entorhinal cortex re-lated to novelty and episodic encoding. Nat Commun 5:5547. CrossRefMedline
Maass A, Berron D, Libby LA, Ranganath C, Duzel E (2015) Functionalsubregions of the human entorhinal cortex. eLife 4.
Marr D (1971) Simple memory: a theory for archicortex. Philos Trans R SocLond B Biol Sci 262:23– 81. CrossRef Medline
McClelland JL, McNaughton BL, O’Reilly RC (1995) Why there are com-plementary learning systems in the hippocampus and neocortex: Insightsfrom the successes and failures of connectionist models of learning andmemory. Psychol Rev 102:419 – 457. CrossRef Medline
McHugh TJ, Jones MW, Quinn JJ, Balthasar N, Coppari R, Elmquist JK,Lowell BB, Fanselow MS, Wilson MA, Tonegawa S (2007) Dentate gyrusNMDA receptors mediate rapid pattern separation in the hippocampalnetwork. Science 317:94 –99. CrossRef Medline
Miller EK, Desimone R (1994) Parallel neuronal mechanisms for short-term memory. Science 263:520 –522. CrossRef Medline
Mumford JA, Turner BO, Ashby FG, Poldrack RA (2012) DeconvolvingBOLD activation in event-related designs for multivoxel pattern classifi-cation analyses. Neuroimage 59:2636 –2643. CrossRef Medline
Neunuebel JP, Knierim JJ (2014) CA3 retrieves coherent representationsfrom degraded input: direct evidence for CA3 pattern completion anddentate gyrus pattern separation. Neuron 81:416 – 427. CrossRef Medline
Nichols TE, Holmes AP (2002) Nonparametric permutation tests for func-tional neuroimaging: a primer with examples. Hum Brain Mapp 15:1–25.CrossRef Medline
Norman KA, O’Reilly RC (2003) Modeling hippocampal and neocorticalcontributions to recognition memory: a complementary-learning-systems approach. Psychol Rev 110:611– 646. CrossRef Medline
Norman KA, Polyn SM, Detre GJ, Haxby JV (2006) Beyond mind-reading:multi-voxel pattern analysis of fMRI data. Trends Cogn Sci 10:424 – 430.Medline
Op de Beeck HP (2010) Against hyperacuity in brain reading: spatialsmoothing does not hurt multivariate fMRI analyses? Neuroimage 49:1943–1948. CrossRef Medline
O’Reilly RC, McClelland JL (1994) Hippocampal conjunctive encoding,storage, and recall: avoiding a trade-off. Hippocampus 4:661– 682.CrossRef Medline
O’Reilly RC, Bhattacharyya R, Howard MD, Ketz N (2014) Complementarylearning systems. Cogn Sci 38:1229 –1248. CrossRef Medline
Reagh ZM, Yassa MA (2014) Object and spatial mnemonic interference dif-ferentially engage lateral and medial entorhinal cortex in humans. ProcNatl Acad Sci U S A 111:E4264 –E4273. CrossRef Medline
Rolls ET, Treves A (1994) Neural networks in the brain involved in memoryand recall. Prog Brain Res 102:335–341. CrossRef Medline
Sapountzis P, Schluppeck D, Bowtell R, Peirce JW (2010) A comparison offMRI adaptation and multivariate pattern classification analysis in visualcortex. Neuroimage 49:1632–1640. CrossRef Medline
Treves A, Rolls ET (1992) Computational constraints suggest the need fortwo distinct input systems to the hippocampal CA3 network. Hippocam-pus 2:189 –199. CrossRef Medline
Treves A, Rolls ET (1994) Computational analysis of the role of the hip-pocampus in memory. Hippocampus 4:374 –391. CrossRef Medline
Walther A, Nili H, Ejaz N, Alink A, Kriegeskorte N, Diedrichsen J (2015)Reliability of dissimilarity measures for multi-voxel pattern analysis.Neuroimage. In press.
Williams JR (2008) The Declaration of Helsinki and public health. BullWorld Health Organ 86:650 – 652. CrossRef Medline
Wisse LE, Gerritsen L, Zwanenburg JJ, Kuijf HJ, Luijten PR, Biessels GJ, GeerlingsMI (2012) Subfields of the hippocampal formation at 7 T MRI: in vivovolumetric assessment. Neuroimage 61:1043–1049. CrossRef Medline
Worsley KJ, Friston KJ (1995) Analysis of fMRI time-series revisited–again.Neuroimage 2:173–181. CrossRef Medline
Yassa MA, Stark SM, Bakker A, Albert MS, Gallagher M, Stark CE (2010)High-resolution structural and functional MRI of hippocampal CA3 anddentate gyrus in patients with amnestic mild cognitive impairment. Neu-roimage 51:1242–1252. CrossRef Medline
Yassa MA, Lacy JW, Stark SM, Albert MS, Gallagher M, Stark CE (2011)Pattern separation deficits associated with increased hippocampal CA3and dentate gyrus activity in nondemented older adults. Hippocampus21:968 –979. Medline
Zaitsev M, Hennig J, Speck O (2004) Point spread function mapping withparallel imaging techniques and high acceleration factors: fast, robust,and flexible method for echo-planar imaging distortion correction. MagnReson Med 52:1156 –1166. CrossRef Medline
Zeineh MM, Engel SA, Thompson PM, Bookheimer SY (2001) Unfoldingthe human hippocampus with high resolution structural and functionalMRI. Anat Rec 265:111–120. CrossRef Medline
Berron et al. • Strong Evidence for Pattern Separation in Human DG J. Neurosci., July 20, 2016 • 36(29):7569 –7579 • 7579