
Strong City Strong Nation - University of Toronto · Strong City, Strong Nation 1 The Toronto Board...
33
Strong City Strong Nation Securing Toronto’s Contribution to Canada June 2002 The Toronto Board of Trade www.bot.com
Transcript of Strong City Strong Nation - University of Toronto · Strong City, Strong Nation 1 The Toronto Board...
Strong CityStrong Nation
Securing Toronto’s
Contribution to Canada
June 2002The Toronto Board of Trade
www.bot.com
1711 6/11/02 10:49 AM Page 1

Table of Contents Acknowledgements .........................................................................................1 Strong City, Strong Nation..............................................................................3 Summary..........................................................................................................3
Toronto’s contribution is critical .................................................................................... 4 The Toronto Board of Trade solution ............................................................................. 4
Toronto – Canada’s economic core.................................................................5 A major contributor to Canadian prosperity ...................................................6
The city’s net revenues relative to the federal government ............................................ 7 The city’s net revenues relative to the provincial government ....................................... 8
The growing concern – Can Toronto keep contributing? .............................11 Ineffectiveness of Toronto’s revenue and governance models .....................14 Principles for a Toronto deal .........................................................................17 Achieving the principles – The Toronto Board of Trade solution................18
Immediate investment is needed in infrastructure ........................................................ 18 Toronto needs enhanced resources to meet local challenges........................................ 19 The city of Toronto needs a new governance model .................................................... 21
Conclusion.....................................................................................................23 APPENDIX: Revenue flow study data sources and methodology ...............24
Strong City, Strong Nation 1 The Toronto Board of Trade
June 2002
Acknowledgements Thank you to our Board of Directors and other business leaders listed below for their participation and contribution to Strong City, Strong Nation. Their time, expertise and input is greatly appreciated. Chris Ridabock Dale Richmond Chair Chair Toronto Board of Trade, 2001-2002 Toronto Board of Trade, 2002-2003 Tom Anselmi Senior Vice President, Business Maple Leaf Sports and Entertainment Ltd. Joe Berridge Partner Urban Strategies Inc. John Brooks President and CEO Toronto Hydro-Electric Systems Rob Brower GTA Managing Partner KPMG LLP Rick Byers Managing Director & Group Head, Government Investment Banking BMO Nesbitt Burns Inc. John Campbell President Brookfield Ventures Ltd. John Chang President, Client Solutions TELUS Bob Chisholm Vice Chairman The Bank of Nova Scotia
Eleanor Clitheroe President & CEO Hydro One Inc. Penny Collenette Vice President, Chairman's Office George Weston Ltd. Simone Desjardins Senior Vice President, Operations Business Development Bank of Canada Ashraf Dimitri Chairman & CEO Oasis Technology Ltd. Bill Downe CEO BMO Nesbitt Burns Don Drummond Senior Vice-President & Chief Economist TD Bank Financial Group William Duron Executive Chairman Key Media Ltd. Phil Evans Chairman Children’s Aid Foundation
Hershell Ezrin Chairman & CEO GPC International Victoria Foley President belladonna Communications Mark Foote President, Canadian Tire Retail Canadian Tire Corporation Ltd. Verlyn Francis Barrister and Solicitor David Fuller Managing Partner Fraser Milner Casgrain LLP Robert Fung Deputy Chairman Yorkton Securities Inc. Robert Gillespie Chairman & CEO GE Canada Paul Godfrey President & CEO Toronto Blue Jays Blake Goldring President AGF Management Ltd.

2 Strong City, Strong Nation The Toronto Board of Trade
June 2002
Geoff Harrison President O&Y Enterprises Brad Henderson Vice President TELUS National Systems Blake Hutcheson President CB Richard Ellis Robert Hutchison Partner Borden Ladner Gervais LLP Dieter Jentsch Managing Director & Head of Scotia Private Client Group The Bank of Nova Scotia Ed Kerwin Partner McCarthy Tetrault LLP Stephen Letwin Group Vice President, Distribution and Services Enbridge Inc. Carl Lovas President Ray & Berndtson/Lovas Stanley William MacKinnon Chairman & CEO KPMG LLP Kerrie MacPherson Managing Partner, Transaction Support Ernst & Young LLP Bruce McKelvey President & CEO CDI Education Corporation
David Mirvish President / Producer Mirvish Productions Gay Mitchell Executive Vice President, Ontario Royal Bank John Mueller Executive Vice President Marsh Canada Ltd. Ron Munkley Vice Chairman Head of Power & Utilities Group CIBC World Markets Courtney Pratt President & CEO Toronto Hydro Corporation Sheldon Rankin Chairman Marsh Canada Ltd. Ed Scheck Partner Hogg, Shain & Scheck LLP Darija Scott Managing Principal Scott Associates Architects Inc. Oskar Sigvaldason President Acres International Mark Smith Managing Director Johnston Smith International Nancy Smith Chair and CEO NextMedia
Ron Taylor Senior Vice President of National Consulting O&Y Enterprises Janice Tomlinson Chairman & President Chubb Insurance John Tory CEO Rogers Cable Inc. Les Viner Managing Partner Torys John Warren Chairman & CEO Borden Ladner Gervais LLP Bob Weese Vice President GE Canada Bob Wong Vice Chairman Leon Frazer and Associates Inc. Nigel Wright Vice President Onex Corporation Lawrence Zimmering President & CEO BDP Business Data Services
Strong City, Strong Nation 3 The Toronto Board of Trade
June 2002
Strong City, Strong Nation Summary
Toronto has found itself at the centre of a growing national debate on the future of Canadian cities. From coast to coast, politicians, public servants, local residents and businesses have been converging toward one conclusion: Canada’s cities are struggling for survival. This is at a time when global competitiveness is quarterbacked on thriving urban regions. It is essential that the fundamentals of Toronto – how it works, lives and grows – are strong and competitive. The Toronto Board of Trade believes these fundamentals are at risk, jeopardizing the future success of the city, region, and country. To address this, the Toronto Board of Trade created the CEO Forum on Urban Competitiveness. The group includes influential business decision makers responsible for investment decisions in both people and products in the city and region. Their confirmation of the decline in our city, and their increasing worry about its future, further validated the need for a strategy for change. Over the past year, the CEO Forum, supported by the work of the Board of Trade has reviewed Toronto’s competitive position and has quantified its contribution to senior governments. Based on the deliberations of the Forum, we have developed recommendations that we believe are viable and necessary actions for renewal. This report provides a short and longer-term plan to restore the health of Toronto. Every level of government has a crucial role to play. We recommend a two-stage plan to ensure Toronto’s competitiveness. First, immediate action must be taken to address Toronto’s crumbling infrastructure. We believe that a five-year agreement must be in place by the end of 2002. Second, the inefficient governance structure that precludes strong decision-making and limits prudent fiscal planning must be revamped. The province must immediately create a task force to develop a new governance model/structure for the city of Toronto; and finally, the city’s fiscal model must be reformed. Toronto’s governance structure requires an overhaul prior to the implementation of a new fiscal model. This is why as an interim step we recommend assistance from senior levels of government to stem the decline of the city’s aging and inadequate infrastructure. The report shows why restoration of the health of Toronto requires an immediate and longer-term solution and why the implementation of a solution is so critical to the health of the city and country.
4 Strong City, Strong Nation The Toronto Board of Trade
June 2002
Toronto’s contribution is critical Toronto’s past contribution to prosperity has afforded senior governments much needed fiscal resources to meet the priorities of all Canadians. Research contracted by the Board show Toronto’s wealth generation capabilities. An examination of both the outflow of revenues to senior governments and the corresponding expenditures made by senior governments back into Toronto confirm the magnitude and importance of Toronto’s contribution over time as well as on an annual basis. For the year 2000, it is estimated that the federal government collected $7.6 billion more from Toronto than it spent. The corresponding figure from the province of Ontario is estimated at $1.4 billion. The report shows the trends and estimates over a 20-year period. The report also illustrates some of the challenges faced by Toronto in some detail. It exposes the inadequacy and deterioration of the city’s infrastructure, shows the challenges of finding affordable housing, and the lack of growth in the city’s tax base relative to other areas. These and other factors point to a city struggling to maintain its competitive edge. The Toronto Board of Trade solution The city’s governance and revenue models are not suited to a city as large and diverse as Toronto. The city requires an effective and accountable governance structure before receiving access to existing or new revenue sources. Further, taxpayers have no appetite for an increased tax burden. The report makes the case for a new deal, a deal that is predicated on three principles: Principle 1: Toronto is a significant generator of prosperity for the region, the province
and the country and must continue to be so going forward. Principle 2: Toronto’s governance structure must be reformed to be effective and
accountable and reflect its status as the largest city in Canada. Principle 3: Toronto’s public finance model must provide the municipal government
with greater access to wealth created in the city in order to generate more wealth.
As an interim measure, the Board recommends immediate investment in the city’s infrastructure by establishing a five-year funding agreement between the city and senior governments. This funding agreement should be in place by the end of the year. Over the initial five-year period the Board calls for the development of a new public finance model. The province should immediately strike a task force to develop a new governance

Strong City, Strong Nation 5 The Toronto Board of Trade
June 2002
structure for the City of Toronto. While recognizing that Toronto requires a new public finance model, the two-stage plan is recommended to allow for a transformation of the city’s governance structure to ensure that it is both effective and accountable.
Toronto – Canada’s economic core Every country around the world has at least one or two major epicentres of economic, social and cultural activity. These centres are always urban and are the drivers of growth and prosperity. Toronto is Canada’s leading global competitor. It is the largest municipality in Canada and fourth largest in North America and is home to 2.5 million people. Toronto is the nucleus of a Toronto region that is adding 100,000 new people annually, with the Greater Toronto Area (GTA) as a whole one of the fastest growing regions (by population) in North America.1 The city’s Gross Domestic Product (GDP) estimated at $98 billion for 2001, is the single largest city contribution to GDP in the country. At one-tenth of Canada’s GDP, and one-fifth of Ontario’s, Toronto’s contribution is vital. Toronto is Canada’s head office city, with more than one-third of the Financial Post’s Top 500 companies. It has the largest concentration of head offices of any city in the country, representing a unique diversity of industry sectors. This diversity is reflected in the presence in Toronto of major North American industry clusters vital to the new economy. These clusters are the drivers of innovation and prosperity and are essential to the economic success of the city and country. Toronto is at the centre of a region with the largest biomedical and biotechnology cluster, and the second largest information technology and telecommunications cluster in North America – two leading-edge sectors of success in the new economy.2 The city is part of the manufacturing hub of Canada and is the centre of financial activity. Tourism in Toronto is a major industry, generating billions in economic activity and is seen as a major growth sector. Toronto is indeed more than just a geographical gateway to the country – it is the gateway to economic prosperity.
1 City of Toronto, Toronto at the Crossroads: Shaping our Future, July 2000. 2 Toronto Board of Trade, Toronto Business and Market Guide 2001: A Profile of Toronto and the Greater Toronto Area, 2000.
6 Strong City, Strong Nation The Toronto Board of Trade
June 2002
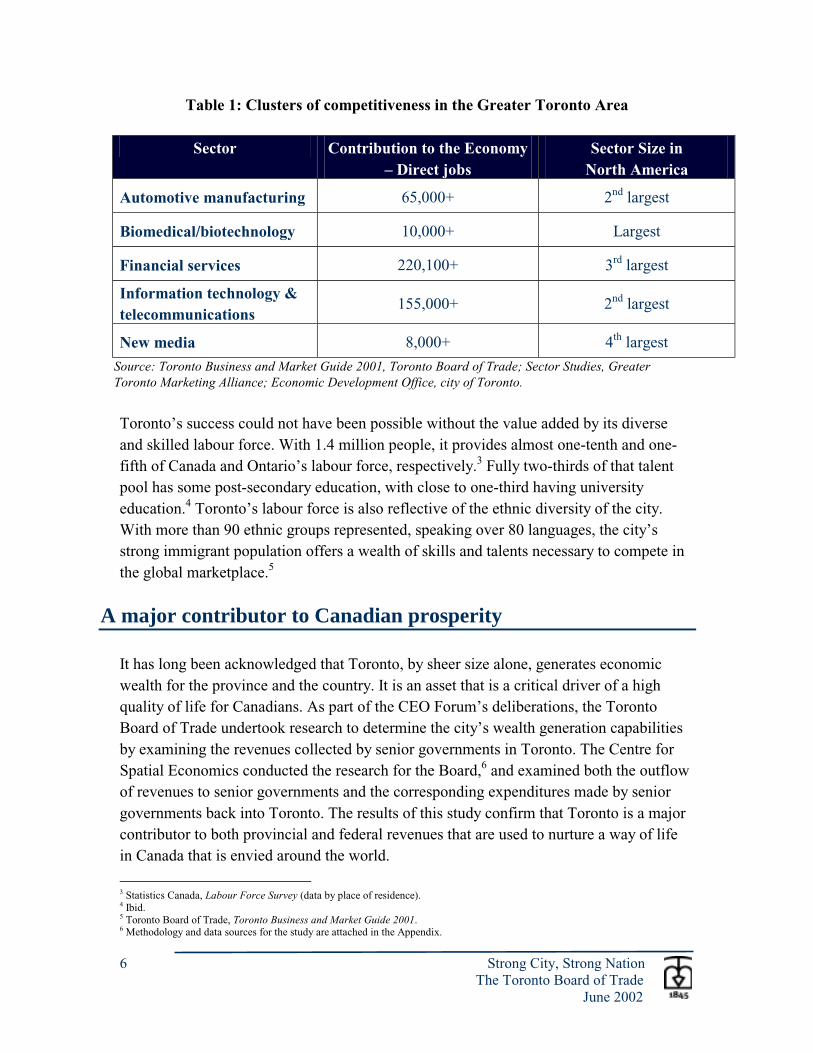
Table 1: Clusters of competitiveness in the Greater Toronto Area
Sector Contribution to the Economy – Direct jobs
Sector Size in North America
Automotive manufacturing 65,000+ 2nd largest
Biomedical/biotechnology 10,000+ Largest
Financial services 220,100+ 3rd largest
Information technology & telecommunications
155,000+ 2nd largest
New media 8,000+ 4th largest
Source: Toronto Business and Market Guide 2001, Toronto Board of Trade; Sector Studies, Greater Toronto Marketing Alliance; Economic Development Office, city of Toronto.
Toronto’s success could not have been possible without the value added by its diverse and skilled labour force. With 1.4 million people, it provides almost one-tenth and one-fifth of Canada and Ontario’s labour force, respectively.3 Fully two-thirds of that talent pool has some post-secondary education, with close to one-third having university education.4 Toronto’s labour force is also reflective of the ethnic diversity of the city. With more than 90 ethnic groups represented, speaking over 80 languages, the city’s strong immigrant population offers a wealth of skills and talents necessary to compete in the global marketplace.5
A major contributor to Canadian prosperity It has long been acknowledged that Toronto, by sheer size alone, generates economic wealth for the province and the country. It is an asset that is a critical driver of a high quality of life for Canadians. As part of the CEO Forum’s deliberations, the Toronto Board of Trade undertook research to determine the city’s wealth generation capabilities by examining the revenues collected by senior governments in Toronto. The Centre for Spatial Economics conducted the research for the Board,6 and examined both the outflow of revenues to senior governments and the corresponding expenditures made by senior governments back into Toronto. The results of this study confirm that Toronto is a major contributor to both provincial and federal revenues that are used to nurture a way of life in Canada that is envied around the world.
3 Statistics Canada, Labour Force Survey (data by place of residence). 4 Ibid. 5 Toronto Board of Trade, Toronto Business and Market Guide 2001. 6 Methodology and data sources for the study are attached in the Appendix.
Strong City, Strong Nation 7 The Toronto Board of Trade
June 2002
The city’s net revenues relative to the federal government From 1997 to 1999, the federal government collected an average of $17 billion per year from the city of Toronto (from its residents, businesses and local government) through various forms of revenue including direct taxes, indirect taxes, contributions to social insurance plans, investment income and transfer payments. Over that same period the federal government spent an average of $11.6 billion per year on the city of Toronto in the form of expenditures on goods and services, transfers to persons, transfers to businesses, transfers to other levels of government and interest payments on the public debt. These findings show that, on average during this time period, the city of Toronto contributed $5.4 billion more per year to Ottawa than was spent by Ottawa in Toronto. This positive return afforded the federal government the enhanced fiscal flexibility to meet national priorities. For the year 2000, it is estimated that the federal government collected $20 billion from the city and spent $12.4 billion in the city, for a net contribution to federal revenues of $7.6 billion. The estimates suggest that the federal government’s revenues from the city of Toronto exceeded its expenditures on the city in every year since 1981, without exception. In contrast the federal government spent significantly more on the rest of Canada (including the rest of Ontario) than it collected from the rest of Canada in each of the first 16 years covered by that period. Federal revenues from the rest of Canada exceeded federal spending on the rest of Canada only in the last four years of that two-decade period.7
7 For an assessment of the contribution of the entire province of Ontario to federal net revenues see the report Ontario’s Contribution to Federal Government Finances by Ernie Stokes of The Centre for Spatial Economics.
8 Strong City, Strong Nation The Toronto Board of Trade
June 2002
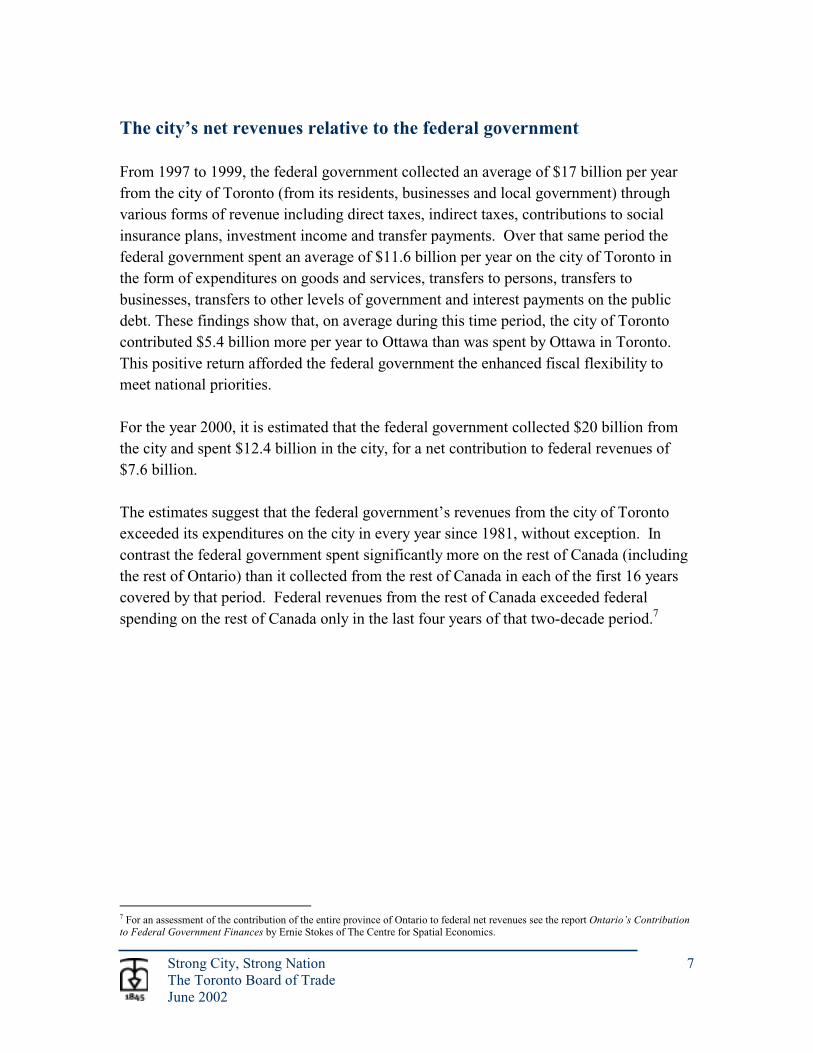
Chart 1: Net federal government revenues relative to the city of Toronto and the rest of Canada
1981 to 2000 ($Billions)
-45
-40
-35
-30
-25
-20
-15
-10
-5
0
5
10
15
1981 1983 1985 1987 1989 1991 1993 1995 1997 1999
Net Position With City of Toronto Net Position With Rest of Canada
Source: Statistics Canada and The Centre for Spatial Economics
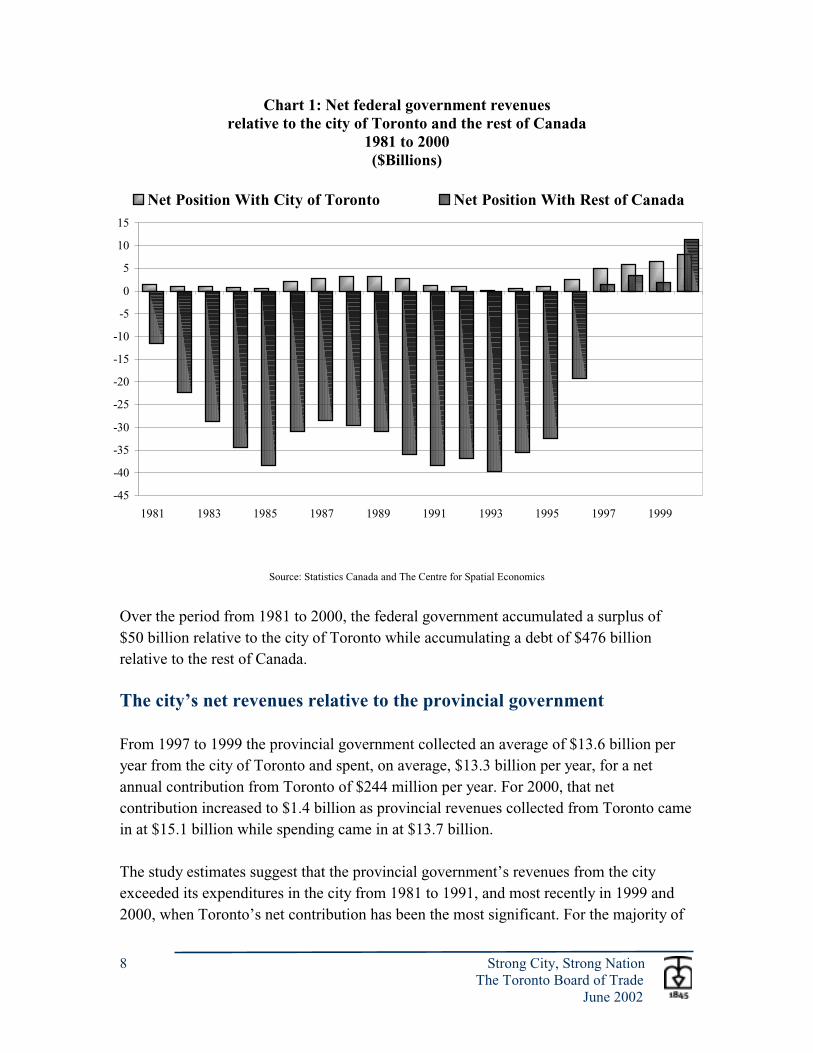
Over the period from 1981 to 2000, the federal government accumulated a surplus of $50 billion relative to the city of Toronto while accumulating a debt of $476 billion relative to the rest of Canada. The city’s net revenues relative to the provincial government From 1997 to 1999 the provincial government collected an average of $13.6 billion per year from the city of Toronto and spent, on average, $13.3 billion per year, for a net annual contribution from Toronto of $244 million per year. For 2000, that net contribution increased to $1.4 billion as provincial revenues collected from Toronto came in at $15.1 billion while spending came in at $13.7 billion. The study estimates suggest that the provincial government’s revenues from the city exceeded its expenditures in the city from 1981 to 1991, and most recently in 1999 and 2000, when Toronto’s net contribution has been the most significant. For the majority of

Strong City, Strong Nation 9 The Toronto Board of Trade
June 2002
the 1990s, however, Toronto was a net beneficiary. By comparison, the provincial government spent significantly more on the rest of Ontario than it collected from the rest of Ontario in each of the first 18 years covered by that period. Provincial revenue from the rest of Ontario exceeded its spending on the rest of Ontario in the last two years only.
Chart 2: Net provincial government revenues relative to the city of Toronto and the rest of Ontario
1981 to 2000 ($Billions)
-13
-10
-8
-5
-3
0
3
5
1981 1983 1985 1987 1989 1991 1993 1995 1997 1999
Net Position With City of Toronto Net Position With Rest of Ontario
Source: Statistics Canada and The Centre for Spatial Economics
Over the period from 1981 to 2000 the provincial government accumulated a debt of $4 billion relative to the city of Toronto while accumulating a debt of $60 billion relative to the rest of Ontario. The following table summarizes the estimates of federal and provincial revenues obtained from city taxpayers and federal and provincial spending in the city, on average, for the years 1997 to 1999 and for the year 2000.8
8 For a complete breakdown of revenues and expenditures, see Table 1 in the Appendix.

10 Strong City, Strong Nation The Toronto Board of Trade
June 2002
It is worth noting that on the revenue side, personal income taxes, corporate income taxes and indirect (sales) taxes are the major revenue categories, and that on the expenditure side, goods and services (mostly civil servant wages), transfers to persons and interest on the public debt are the major spending categories.
Table 2: Federal and provincial revenues and spending relative to the city of Toronto
($Millions)
Average Average Revenues and expenditures 1997-1999 1998-2000 2000 Total outflow of revenues 30,564 32,599 35,096 To federal government 16,987 18,318 20,040 To provincial government 13,577 14,281 15,056 Total spending in the city 24,909 25,480 26,061 By federal government 11,576 11,911 12,398 By provincial government 13,333 13,569 13,663 Net position of Toronto (5,655) (7,119) (9,035) With federal government (5,410) (6,407) (7,642) With provincial government (244) (713) (1,393)
Source: Statistics Canada and The Centre for Spatial Economics
These results clearly show that Toronto is a generator of wealth for both levels of government – in good times and in bad. Toronto’s contribution is not only important, but is necessary to maintain Canada’s standard of living. Protecting this ability to contribute, and stimulating Toronto’s ability to grow its contribution, will enhance the city and country’s overall prosperity.

Strong City, Strong Nation 11 The Toronto Board of Trade
June 2002
The growing concern – Can Toronto keep contributing? The Toronto Board of Trade believes strongly that Toronto must continue to be a major contributor to wealth generation in Ontario and in Canada. As the economic heartland and as the country’s largest city, Toronto rightly assumes this responsibility. While the city has continued to generate substantial wealth, even during difficult economic times, there are rising indicators that its future capacity to do so is constrained. If we continue to ignore these indicators, we place the future prosperity of Canada at risk. Our city, as the centre of a vital economic region, competes with some 300 international city regions for investment every day. The war for talent and the fight for capital will be won by the cities that are best able to leverage their competitive advantages and maximize their local assets. Is Toronto a healthy city that can compete globally? Consider the following: Few Toronto Board of Trade members say Toronto is competitive
Chart 3: Competitiveness of Toronto vs. other cities
Source: The Toronto Board of Trade
• Barely a quarter of total respondents to a Board of Trade survey stated that Toronto was more competitive than cities in the United States, and only slightly more felt Toronto was more competitive globally.9
9 The Toronto Board of Trade, Perceptions of Toronto’s Competitiveness: A Survey of Senior Executives, September 2001.
0
10
20
30
40
50
60
% responding more
competitive
vs. CanadianCities
vs. U.S. Cities vs. GlobalCities
12 Strong City, Strong Nation The Toronto Board of Trade
June 2002
Infrastructure is inadequate and deteriorating • Sixty-eight per cent of the city’s infrastructure was built before 1970.10 • The Toronto Transit Commission’s 10-year capital plan, announced in 1999, called
for annual expenditures of $340 million just to accommodate current ridership. Additional investment would be needed to grow the system. The city’s budget for 2002 allocates a gross capital budget of $276 million to the TTC, 20 per cent less than the Commission estimated it needed under its earlier capital plan.
• Seventy per cent of the region’s roadways are congested during peak periods,11 costing the economy $2 billion annually.12
• In a Toronto Board of Trade survey of senior executives, the state of Toronto’s infrastructure was cited as the top competitive disadvantage, just ahead of taxes.13
Access to affordable housing is severely constrained • Toronto’s vacancy rates have been consistently below one per cent for more than five
years.14 • Costs of rental accommodation have been rapidly outpacing inflation. The costs for a
one-bedroom apartment in Toronto show annual increases of more than six per cent in the years since 1997.15
• Overall availability of rental units is diminishing. The city of Toronto states that since 2000, Toronto has had a net loss of 431 rental units to demolition. By contrast, in 2001, the city estimates only 39 new rental units were built.
Toronto is failing to attract visitors • Even with the Canadian dollar at all time lows, Toronto has been unable to maintain
its tourism market share. While competitor cities in the United States saw 5-10 per cent annual increases in visitors, Toronto managed only a 1.5 per cent increase.16
• The most profitable segment for the tourism industry – overnight leisure visitors – has been in decline in Toronto for three of the past four years.17
10 City of Toronto, An Assessment of City of Toronto’s Financial Condition, January 2001. 11 The Toronto Board of Trade, A Strategy for Rail-Based Transit in the GTA, July 2001. 12 Greater Toronto Services Board, Removing Roadblocks: GTSB Strategic Transportation Plan, January 2000. 13 The Toronto Board of Trade, Perceptions of Toronto’s Competitiveness: A Survey of Senior Executives. 14 Canada Mortgage and Housing Corporation, Rental Market Reports. 15 Estimates provided by the Canada Mortgage and Housing Corporation. 16 Cameron Hawkins & Associates/The Tourism Company, Tourism Investment Study Final Report, prepared for the City of Toronto and the province of Ontario, December 2001. 17 Ibid.
Strong City, Strong Nation 13 The Toronto Board of Trade
June 2002
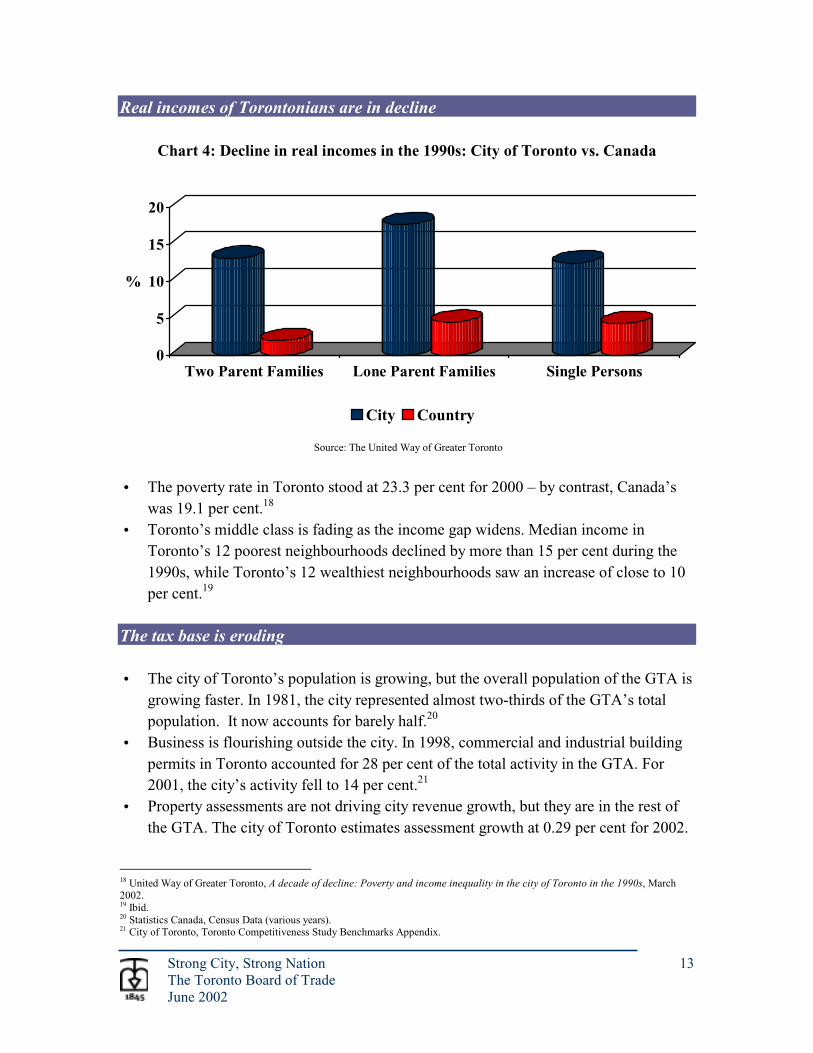
Real incomes of Torontonians are in decline
Chart 4: Decline in real incomes in the 1990s: City of Toronto vs. Canada
0
5
10
15
20
%
Two Parent Families Lone Parent Families Single Persons
City Country
Source: The United Way of Greater Toronto
• The poverty rate in Toronto stood at 23.3 per cent for 2000 – by contrast, Canada’s
was 19.1 per cent.18 • Toronto’s middle class is fading as the income gap widens. Median income in
Toronto’s 12 poorest neighbourhoods declined by more than 15 per cent during the 1990s, while Toronto’s 12 wealthiest neighbourhoods saw an increase of close to 10 per cent.19
The tax base is eroding • The city of Toronto’s population is growing, but the overall population of the GTA is
growing faster. In 1981, the city represented almost two-thirds of the GTA’s total population. It now accounts for barely half.20
• Business is flourishing outside the city. In 1998, commercial and industrial building permits in Toronto accounted for 28 per cent of the total activity in the GTA. For 2001, the city’s activity fell to 14 per cent.21
• Property assessments are not driving city revenue growth, but they are in the rest of the GTA. The city of Toronto estimates assessment growth at 0.29 per cent for 2002.
18 United Way of Greater Toronto, A decade of decline: Poverty and income inequality in the city of Toronto in the 1990s, March 2002. 19 Ibid. 20 Statistics Canada, Census Data (various years). 21 City of Toronto, Toronto Competitiveness Study Benchmarks Appendix.

14 Strong City, Strong Nation The Toronto Board of Trade
June 2002
By contrast, Peel and Halton regions are forecasting assessment growth rates of 3.63 per cent and 4.1 per cent, respectively.22
• Toronto has lost eight per cent of the Financial Post’s Top 500 companies head offices from 1987-2000.23
These indicators certainly point to a city struggling to maintain its competitive edge. What remains unclear is how much longer and at what rate Toronto can continue to produce and to contribute to Ontario and to Canada in the face of such mounting challenges.
Ineffectiveness of Toronto’s revenue and governance models
A further complication is the city’s limited ability to generate enough cash flow to meet these challenges head on. Toronto, as with other municipalities in Ontario, relies heavily on the property tax system as a source of funding. While it is a stable source of revenue, it is not one that expands with economic booms, nor does it provide a robust stream of funds during strained fiscal times.
Chart 5: Comparison of municipal revenue sources
22 City of Toronto, CAOs and Commissioners Recommended 2002 Budget, January 2002. 23 Toronto Board of Trade calculation.
State Funding29%
Property Taxes18%
Sales Tax12%
Income & Other Taxes
13%
Other7%
Federal Funding
7%
User Charges14%
User Charges
20%
Provincial Grants21%
Property Taxes45%
Other14%
Toronto’s Revenue Sources Revenue Sources for 38 Largest Cities in United States
Source: Economic Development Office, city of Toronto

Strong City, Strong Nation 15 The Toronto Board of Trade
June 2002
Moreover, with the city currently levying the second highest rate of property taxes on business in major cities in North America,24 there is no flexibility to increase rates. Our existing business property taxes are already disproportionately high, stifling investment in Toronto. Over the past decade, while federal and provincial revenues were escalating, Toronto’s revenue growth lagged behind. The city government did not benefit proportionately from the wealth generated in Toronto. This is important to note because it directly relates to the city’s financial ability to meet local priorities.
Chart 6: Change in government revenues 1992-2000
80
100
120
140
160
1992 1993 1994 1995 1996 1997 1998 1999 2000
1992
= 1
00
Federal Provincial City
Source: The Centre for Spatial Economics and the city of Toronto
The revenue flow study shows that federal and provincial government revenues collected in the city of Toronto rose by 54 per cent and 40 per cent respectively from 1992 to 2000, during a period of significant economic expansion. Revenues collected by the city of Toronto rose by 19 per cent in comparison. During a time of incredible economic growth, while Toronto did benefit, it did not benefit anywhere near as much as the senior levels of government. Increasing debt charges also are a burden. Toronto’s debt has risen to $1.3 billion, up from $1.1 billion in 1998. As the debt grows, more of the city’s revenues will be directed to interest payments. In 1998, the percentage of city property tax revenues allocated to interest payments equalled 7.5 per cent. For 2002, that number is 8.7 per cent. It is
24 KPMG, Competitive Alternatives Study: Comparing Business Costs in North America, Europe and Japan, 2002.

16 Strong City, Strong Nation The Toronto Board of Trade
June 2002
estimated that this will escalate to 11.5 per cent by 2005.25 This increasing debt financing charge seriously constricts Toronto’s financial flexibility. However, the city of Toronto is also responsible for some of the city’s escalating budget challenges. The Toronto Board of Trade has been critical of the amount of time that was lost by the city in moving to amalgamate departments and find savings. The Board believes that more can and must be done to get local expenditures in line. Moreover, as long as Toronto fails to deal with its excessive property taxes on businesses, it will continue to undermine the very tax base that it needs to fuel future growth. Our high business property taxes have already dissuaded business investment in the city, and have pushed businesses further out of the downtown core. The business push outside city has contributed to urban sprawl. Monies will have to be pumped into providing new infrastructure further and further away from the city where the necessary infrastructure framework already exists. Increased pollution, congestion, the cost of providing water, hydro and sewer services to new developments, the building of new schools, hospitals and roadways all represent enormous new expenditures under the urban sprawl scenario. Toronto’s property tax system does little to mitigate this outcome. Toronto’s inability to deal with the property tax inequity, and it’s growing budget challenges, also point to a far deeper problem at the city, namely a challenge with governance. With amalgamation, the city has found itself in the situation where its structure is effectively too large to deal adequately with local needs, while at the same time being too small to appropriately leverage its own economic potential. The city continues to be governed by a Municipal Act that treats all municipalities in Ontario equally, regardless of size or need. It is an extremely restrictive Act that gives the city little in the way of flexibility. The governance issue is a crucial point of concern. It is difficult to convince taxpayers and senior governments of the importance of assisting Toronto if there is a sense that the current structure is flawed. The city has demonstrated little success in reducing operating costs, in establishing core priorities and in applying rigour to its budgeting exercise. To the city’s credit, it does not necessarily have access to all the tools needed to address these concerns. The city must put in place sound accountability measures such as an independent auditor to demonstrate that such tools would be used appropriately. Until this imbalance is rectified, Toronto’s economic potential remains in question. 25 Estimates provided by the CAO’s office, city of Toronto.

Strong City, Strong Nation 17 The Toronto Board of Trade
June 2002
The solution for Toronto’s predicament cannot be based upon increasing the overall tax burden. It must be based on solutions that protect the taxpayer through an effective and accountable governance structure together with reinvestment from senior levels of government.
Principles for a Toronto deal Toronto’s current situation is not sustainable. The city faces a growing litany of challenges and yet has a limited capacity to resolve them. This imbalance will wear down the economic engine. Failure to take action will have substantial implications for the revenue growth of senior levels of government and, by extension, the potential prosperity of the province and the country. The fate of Toronto and the fate of the nation are inextricably linked – a strong city means a strong Canada. It is clear that actions are needed now. The Toronto Board of Trade believes that a new deal for our city must be struck. It must be a deal that recognizes the unique importance of Toronto to the nation’s standard of living. An agenda of action for Toronto should meet the immediate needs of our city and articulate a path for long-term stability and be predicated on three driving principles: Principle 1: Toronto is a significant generator of prosperity for the region, the
province and the country and must continue to be so going forward. Principle 2: Toronto’s governance structure must be reformed to be effective and
accountable and reflect its status as the largest city in Canada. Principle 3: Toronto’s public finance model must provide the municipal
government with greater access to wealth created in the city in order to generate more wealth.
These principles form the foundation of our recommendations, which contain three key areas for action and to be successful, must be implemented as a complete solution.
18 Strong City, Strong Nation The Toronto Board of Trade
June 2002
Achieving the principles – The Toronto Board of Trade solution Immediate investment is needed in infrastructure
As an interim measure to stem further decline in Toronto’s infrastructure, there must be immediate action to invest in assets critical to Toronto’s economy by establishing a five-year funding agreement between the city of Toronto and senior governments. A five-year funding agreement must be in place by the end of 2002.
Our current physical capital assets are vital supports for the economy and must be reinforced. There is a serious infrastructure capital deficit that needs to be reduced before the city of Toronto can even attempt to address current and future infrastructure needs. It is evident that the city cannot deal with this deficit unilaterally. Special, short-term targeted investments must be made in the city by senior levels of government. The federal government, given its robust fiscal status and as the larger net beneficiary of Toronto’s revenue growth, is best positioned to undertake the level of investment necessary to close the infrastructure gap. We believe the federal government must take ownership of this recommendation and invest directly to revitalize Toronto. Ottawa has already indicated a willingness to involve itself in the funding of urban renewal through the Canada Strategic Infrastructure Fund, first announced in the December 2001 Budget. Now, the federal government must take this commitment to the next level and provide additional funding to Toronto to ensure our city keeps producing. The recent announcement of provincial and federal investment in culture in Toronto also reinforces the acceptability of funding renewal in our city. We are advocating for a funding arrangement that would flow funds for a limited period of time.26 This funding must be committed for the duration of the agreement to ensure that the funds flow as needed. The Board believes that the 5-year funding agreement should be set by the end of this year. Priority capital projects that are essential to economic growth in Toronto must be identified. The Board believes such capital investment priorities should include:
26 Examples of such an agreements for cities include: the Vancouver Agreement, signed in 2000 that set up a framework to fund development in Vancouver, targeted specifically at revitalizing the Downtown Eastside. The Winnipeg Development Agreement, signed in 1995, flowed $75 million over five years to address local priorities. Here at home, the Waterfront Redevelopment Initiative represents a $1.5 billion tri-partite agreement.

Strong City, Strong Nation 19 The Toronto Board of Trade
June 2002
• Transportation infrastructure to relieve congestion and improve the environment, including investment in transit capital upgrades and expansions;27
• Social infrastructure focused largely on expanding the availability of affordable rental housing; and,
• Waterfront revitalization to anchor economic growth in the downtown and limit urban sprawl.
These investments are transitional – they will facilitate the ability of the city to deal with pressing needs while senior governments and the city work toward a solution on financing and governance reform to be implemented during this time frame. Toronto needs enhanced resources to meet local challenges
In recognition that the city should become more self reliant, the public finance model for the city of Toronto needs to be reformed to provide the city government with access to new and/or existing revenue sources.
There has been a growing and often contentious, debate over how cities fund themselves and to what types of resources they should have access. We believe the discussion has substantial merit and the ideas put forward warrant consideration. The Board has been on record in submissions to government advocating for greater access to gas tax revenues by cities to support transit enhancements. The Board has also supported the use of taxes applied to hotel rooms to support destination marketing. It is only natural to consider the broader public finance system as a vehicle to drive a more effective flow of funds to support economic growth in Toronto. Exactly how this is to be done – the types of revenue sources to be accessed and the mechanism by which they are collected – is far from conclusive. But that should not deter the debate. In examining the current financing structure, there are several viable options for consideration. They fall into two broad categories that the Board of Trade believes form the basis of a new revenue model for our city: leveraging the tax system to better flow resources to Toronto, and creating new revenue sources.28
27 The Toronto Board of Trade’s, A Strategy for Rail-Based Transit in the GTA, July 2001, offers a comprehensive investment plan for building transit in Toronto and across the GTA. 28 The recent report from the TD Bank, A Choice Between Investing in Canada’s Cities or Divesting in Canada’s Future, April 2002, provides a comprehensive analysis of the revenue options.

20 Strong City, Strong Nation The Toronto Board of Trade
June 2002
Leverage the tax system:
Senior levels of government could permit the city to occupy tax room vacated by them. This could be applied to any of the taxes currently in place, but it is likely that excise and sales taxes are the most logical choices. They can be easily accessed and offer the city a stable source of tax revenue. Occupying existing tax room is the preferred solution as it mitigates the potential for the overall tax burden to increase. The city could be given the ability to levy its own taxes as it chooses – whether in addition to taxes already levied by senior governments, or on new areas. Giving the city greater control over resources is the goal to provide a more substantial, long-term revenue flow to support economic growth. However, attention must still be paid to the overall tax levels. Regardless of who is collecting the tax, it is the Board of Trade’s position that the overall taxes paid by individuals and businesses in the city of Toronto not be increased.
Create mechanisms to access new sources of revenue:
Senior governments could also provide the city with innovative financial tools to generate new revenue sources. Tax Increment Financing (TIF) is an example of such a tool that over the short term does not flow revenues to the city, but has the potential to stimulate employment growth and business investment over the long-term, which will result in dividends to the city. TIF is a tool used by cities to finance certain types of development costs. The public purposes are the redevelopment of blighted areas, construction of low- and moderate-income housing, provision of employment opportunities and improvement of the tax base. Tax increment financing enables a city to use the additional property taxes generated by a new development to pay for certain development expenses. With TIF, a city captures the additional property taxes generated by the development that would have gone to other taxing jurisdictions and uses the tax increments to finance the development costs. Public-private partnerships can also be a source of revenue, particularly through the establishment of municipal corporations, and offer important vehicles through which to access private sector capital.
Both the provincial and federal governments are critical players in ensuring the success of this recommendation. They can provide tax room for the city to create long-term access to revenues. The province in particular has the most influential position with respect to the city’s ability to access new financial tools. Even with the current Municipal Act, the city is restricted in its ability to venture into new fiscal partnerships. By being restrictive, rather than permissive, the Act severely limits any potential for creative
Strong City, Strong Nation 21 The Toronto Board of Trade
June 2002
financing thinking at the city level. The Board believes the province should revisit the Municipal Act and its limitations and provide a more permissive framework for Toronto. The city of Toronto needs a new governance model
Giving Toronto additional fiscal capacity is the right goal over the long-term. However, maintaining the status quo on governance will do little to dispel public perceptions and concerns that the city is not able to handle current demands, let alone additional responsibilities. Consequently, to properly transition Toronto to a new public finance model, there will need to be a transformation of the city’s current governance structure to reflect the fiscal capacity and needs of the sixth largest government in Canada. This transformation will need to focus both on the fundamental structure of the city’s governance model and on the decision making process at the city. The province of Ontario must immediately establish a task force to review and make recommendations on Toronto’s governance structure.
The Toronto Board of Trade acknowledges that with such monumental changes to Toronto’s public finance model come significant accountability challenges. It is clear that the present structure cannot readily accommodate a reformed financing model. A strong governance plan must be in place first. This will provide assurances to taxpayers and to senior levels of government, that with this enhanced responsibility come necessary accountability measures. It must be clear to residents and business that any additional revenue capabilities will be backed by a structure that provides transparency, delivers good decision-making and strives to attain the highest quality of services for all Torontonians. The system must:
• Foster stronger decision-making. There are many examples in other competitor cities where this is accomplished. Governance models that: rely on a strong executive function (the strong mayor model); institute boards of control; run candidates on a local party system; or, elect city wide representatives, are examples of how other jurisdictions have increased the accountability and effectiveness of their municipal governments. There needs to be a full examination of our system and those of our competitors, to determine what can be best applied to Toronto to meet our particular needs;
• Enhance accountability for the decisions that are made by both elected officials and public servants, and how resources are allocated by instituting benchmarks on performance of the city in providing city services; and
• Provide for greater coordination and integration of services and planning both locally and regionally.
22 Strong City, Strong Nation The Toronto Board of Trade
June 2002
Reforming Toronto’s governance structure is clearly the responsibility of the provincial government. However, that does not mean that this level of government alone should determine what constitutes a viable and appropriate governance solution. The Toronto Board of Trade believes that this governance issue is the most critical element of our solution package and we acknowledge that it is also the area where more attention must be focused. To that end, the Board of Trade is committed to working with the city and the province in developing comprehensive reforms. We believe that it is an area that requires leadership from the province and are recommending that they immediately set up a task force to study and make recommendations on a new governance model for the city. It is in the best interests of our members, and more importantly, in the best interests of national prosperity to have a strong and accountable government in the city of Toronto. On process, the city needs to strengthen its own management and budgeting system, effectively doing what both the provincial and federal governments have done: get its own fiscal house in order. It has been five years since amalgamation yet the city is still struggling to consolidate services and programs. There are actions that need to be taken to deliver services that are efficient, effective and reflective of the needs of the city, including:
• Defining priorities and focusing on the delivery of core city services, including realizing program efficiencies and consolidations;
• Ensuring that the levels of taxation and user fees reflect the cost of city services, specifically by correcting the inequity that exists for commercial and industrial property taxpayers;
• Adopting Alternative Service Delivery (ASD) for non-core services; and • Delivering multi-year budgets that set goals and performance measures and
provide greater transparency and accountability for taxpayers. A new governance model that incorporates appropriate accountability measures must be put into place before a new public finance model can be introduced. The Board believes this link is crucial to the success of our strategy.
Strong City, Strong Nation 23 The Toronto Board of Trade
June 2002
Conclusion The Toronto Board of Trade believes our action plan is realistic and achievable. The measures outlined will meet the goal of maintaining Toronto’s economic contribution to Canada. The rewards to all levels of government in Canada include job creation, economic growth, renewed vitality and international competitiveness. We can no longer ignore Toronto’s immense contribution to our country’s past success. Nor can we ignore the compelling evidence that our city is in decline. Investments must be made immediately into Toronto’s deteriorating and inadequate infrastructure. Our governance model must be reformed to enhance local accountability and to provide greater flexibility for the city to meet local needs. For the future, a new public finance structure must be created that gives Toronto greater access to the resources it needs to invest in itself. It is clear to us that the greatest impediment to Toronto’s ongoing prosperity is the inability to maintain what we’ve already got. The Toronto Board of Trade believes that the solutions we have proposed will provide the city with a viable structure within which it can thrive. The Toronto Board of Trade is the champion of a competitive and vibrant Toronto with a mandate to:
• Contribute directly to our members’ success by acting as a dynamic business catalyst and providing innovative and valuable business tools; and
• Create opportunities for governments and the business community to work together on issues that are important to our members.

24 Strong City, Strong Nation The Toronto Board of Trade
June 2002
APPENDIX: Revenue flow study data sources and methodology About The Centre for Spatial Economics (CSE) The CSE was created to improve the quality of spatial economic and demographic research in Canada, and to make the results of this research available to various organizations. The CSE has developed a series of provincial and sub-provincial economic-demographic models for the purpose of assessing the spatial impacts of various public and private sector investment projects, and for projecting the output, employment, population and dwelling potential of sub-provincial areas across Canada. The Centre was formed in July 2000 through a joint initiative of Strategic Projections Inc. and Stokes Economic Consulting Incorporated, both of Oakville, Ontario. Tom McCormack of Strategic Projections Inc. and Ernie Stokes of Stokes Economic Consulting are co-directors of The Centre for Spatial Economics. Prior to establishing this new partnership, Mr. Stokes and Mr. McCormack collaborated on several major assignments and between them, over a span of several decades, had acquired considerable experience in demographic and economic research, in particular in its geographic distribution. The CSE has its headquarters in Waterdown, Ontario. The Toronto Board of Trade retained The Centre for Spatial Economics in December 2001 to develop estimates of the net financial flows between the city of Toronto, the Government of Canada and the Government of Ontario. Table 1 provides the detailed estimates of revenues and expenditures as referenced on page 9 of this report.

Strong City, Strong Nation 25 The Toronto Board of Trade
June 2002
Table 1: Federal and provincial revenues and spending by category
relative to the city of Toronto ($Millions)
Federal Federal Provincial Provincial Average Average Federal Average Average Provincial Revenues and expenditures 1997-1999 1998-2000 2000 1997-1999 1998-2000 2000 Direct taxes from persons 9,038 9,840 10,665 4,440 4,744 5,177 Direct taxes from corporate and government business enterprises 2,117 2,475 3,067 1,343 1,440 1,623 Direct taxes from non-residents (withholding taxes) 442 487 564 0 0 0 Contributions to social insurance plans 1,737 1,678 1,678 821 866 937 Indirect taxes 3,137 3,257 3,389 5,121 5,206 5,068 Other current transfers from persons 4 9 16 0 0 0 Investment income 502 559 642 533 550 576 Current transfers from federal government 0 0 0 1,291 1,457 1,667 Current transfers from provincial governments 9 13 18 0 0 0 Current transfers from local governments 0 0 0 28 19 8 Total revenue 16,987 18,318 20,040 13,577 14,281 15,056 Net current expenditure on goods and services 2,711 2,869 3,120 6,318 6,350 6,401 Current transfers to persons 3,642 3,703 3,799 2,095 2,119 2,137 Current transfers to business 285 273 271 110 113 130 Current transfers to non-residents 0 0 0 0 0 0 Current transfers to federal government 0 0 0 9 12 16 Current transfers to provincial governments 1,291 1,418 1,550 0 0 0 Current transfers to local governments 40 30 23 2,730 2,828 2,814 Interest on public debt 3,608 3,618 3,635 2,071 2,145 2,165 Total current expenditure 11,576 11,911 12,398 13,333 13,569 13,663 Saving 5,410 6,407 7,642 244 713 1,393 Plus capital consumption allowances 320 313 307 482 487 495 Plus net capital transfers 368 373 376 -110 -107 -90 Minus acquisition of non-financial capital 352 354 364 358 252 266 City of Toronto Net Position 5,747 6,738 7,962 257 841 1,532
Sources of data used in developing the estimates The primary source of federal and provincial government revenue and expenditure data used in developing our estimates is Statistics Canada’s Provincial Economic Accounts
26 Strong City, Strong Nation The Toronto Board of Trade
June 2002
(PEA, diskette product number 13-213-XDB). This data source provides detailed historical annual data covering the period from 1981 to 1999 for federal government revenues and expenditures by category relative to Canada as a whole and relative to each individual province. The PEA data also provide provincial government revenue and expenditure data by category for each province from 1981 to 1999.1 The advantage of this data set is the time period it covers (back to 1981). Its major disadvantage is that data for the year 2000 are not provided. Statistics Canada’s National Income and Expenditure Accounts (NIEA, diskette product 13-001-XDB) provide for every year from 1961 to 2000, detailed federal revenue and expenditure estimates by category for Canada as a whole and detailed provincial government estimates by category for Canada as a whole. Statistics Canada also compiles government revenues and expenditures by level of government (federal, provincial and local) on a consistent program-type and fiscal year basis through their Financial Management System (FMS) (published under Catalogue no. 68F0023XIB). This data set, however, covers the fiscal years from 1992-93 to 2000-01 only. Furthermore, federal estimates are countrywide only although provincial estimates for Ontario alone are provided. We used these two data sources (NIEA and FMS) to assist us in constructing PEA-type estimates for the year 2000 of Ontario-specific federal and provincial government revenues and expenditures by category. Neither of these sources provides data for the city of Toronto. To develop estimates of the city’s portion of Ontario-specific federal and provincial revenues and expenditures by category over time we obtained or developed a number of indicators for that purpose. These historical “allocators” covering the years from 1981 to 2000 included the following:
total population; population aged 0 to 14 years; population aged 15 to 64 years; population aged 65 years and over The above four were sourced from the CD-ROM included with Statistics Canada’s Annual Demographic Statistics 2001 (Catalogue no. 91-213-XPB). total households This variable was estimated for both Ontario and the city of Toronto by The Centre for Spatial Economics based on historical census data regarding household headship rates applied to Statistics Canada’s post censal population estimates by age.
1 For all other economic data the PEA cover the period from 1981 to 2000.

Strong City, Strong Nation 27 The Toronto Board of Trade
June 2002
personal income by place of residence; personal disposable income by place of residence; sales of consumer goods and services by point of sale; sales of consumer goods by point of sale; labour income by place of residence Ontario estimates for each of the above for each year from 1981 to 2000 were obtained from the Provincial Economic Accounts. Canada Customs and Revenue Agency (formerly Revenue Canada) data regarding taxfiler reported income and income taxes paid for the years 1981 to 1998 for each of the city of Toronto and Ontario were used to develop estimates of the personal income, disposable income (i.e. after-tax income) and labour income of Toronto residents. Ontario-wide total personal spending and personal goods spending shares of after-tax income were applied to our estimate of city of Toronto residents after-tax income to derive city of Toronto residents personal spending and personal spending on goods. These estimates are used as a proxy for the sale of goods and services by point of sale in the city of Toronto.2 total employed by place of work; total employed by place of residence Ontario estimates for employed by place of residence for the period 1987 to 2000 were obtained from Statistics Canada’s CD-ROM product Labour Force Historical Review 2000 (Catalogue no. 71F0004XCB). We assumed that the number of employed persons by place of work in Ontario is equal to the number employed by place of residence. Total employed by place of residence for the city for the years 1983 to 2000 was supplied to us by the city of Toronto (Economic Development) based on the city’s annual survey of employers. Total employed by place of residence for the years 1987 to 2000 was also supplied to us by the city drawing on data they obtained from Statistics Canada based on a special tabulation of labour force survey (LFS) estimates. We estimated the values for the period 1981 through 1986 by linking the 1987 to 2000 LFS series to much-earlier published LFS estimates for 1981 to 1987 based on a slightly different definition of employment.3 We then estimated the values of employment by place of work for 1981 and 1982 by assuming that the growth rates in this series in 1982 and 1983 matched the growth of employment by place of residence in those years.
2 Our estimates reveal that 49.2 per cent of the personal income of the Greater Toronto Area is received by residents of the city of Toronto with the remaining 50.8 per cent received by residents of the GTA’s four suburban regional municipalities. The Centre for the Study of Commercial Activity (see the CSCA report by Maurice Yeates entitled The GTA@Y2K: The Dynamics of Change in the Commercial Structure of the Greater Toronto Area, published by Ryerson Polytechnic University in 1999) estimates that 49.5 per cent of the market for retail, general and financial services in 1998 was in the city of Toronto and the remaining 50.5 per cent in the rest of the GTA. The similarity of their and our ratios justifies the method we use for estimating the size of consumer spending on goods and services in the city. 3 We obtained the latter from the Toronto Transit Commission when we carried out research for them in 1994.
28 Strong City, Strong Nation The Toronto Board of Trade
June 2002
average wage by place of residence; average wage by place of work; labour income by place of work We calculated these series for Ontario by dividing labour income from the PEA by total employment from the LFS, assuming the employed place of work and by place of residence values to be identical at the provincial level. We calculated the average wage by place of residence for the city as total labour income by place of residence divided by total employment by place of residence. We assumed the average wage by place of work in the city to be equal to the average wage by place of residence. We estimated total labour income by place of work for the city as equal to total employment by place of work multiplied by the estimated average wage by place of work. unemployed by place of residence The number of unemployed by place of residence was obtained for Ontario from the LFS CD-ROM (see employment, above). The number of unemployed by place of residence for the city was obtained from the city’s Economic Development Department. The data for 1987 to 2000 were taken from the special LFS tabulation they had obtained. We estimated the values for 1981 to 1986 unemployed in the city by assuming that the share prevailing in 1987 prevailed in each of those years. corporate profits Corporate profits for all of Ontario covering the years 1981 to 2000 were obtained from the PEA accounts. We assumed the share of Ontario corporate profits earned by businesses in the city of Toronto to be equal to the city’s share within Ontario of labour income by place of work. This assumption allocates corporate profits geographically to the location at which the lion’s share of value added occurs.
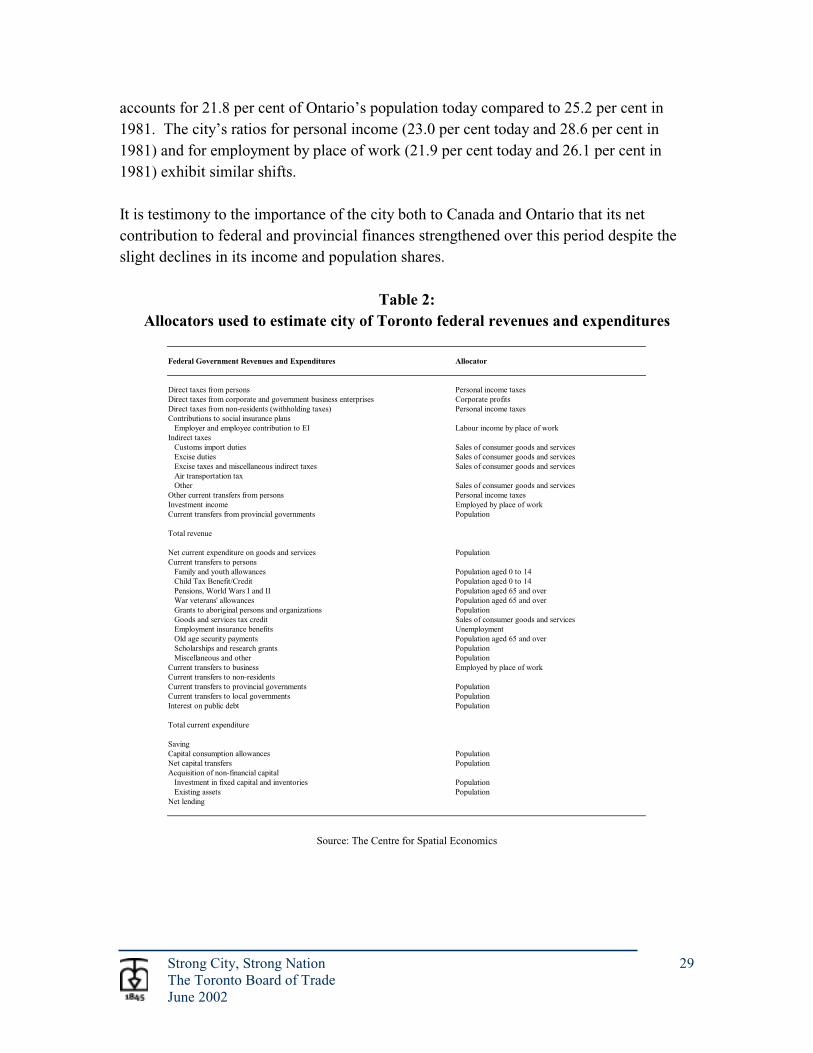
Methodology used to develop the estimates Tables 2 and 3 below indicate which “allocators” we used to estimate the city of Toronto’s shares of federal and provincial revenues and expenditures by category over the period from 1981 to 2000. It should be noted that since most of the province’s growth in employment and population occurred outside of the city of Toronto between 1981 and 2000, the ratios in all cases are lower today than was the case twenty years ago. For example, the city
Strong City, Strong Nation 29 The Toronto Board of Trade
June 2002
accounts for 21.8 per cent of Ontario’s population today compared to 25.2 per cent in 1981. The city’s ratios for personal income (23.0 per cent today and 28.6 per cent in 1981) and for employment by place of work (21.9 per cent today and 26.1 per cent in 1981) exhibit similar shifts. It is testimony to the importance of the city both to Canada and Ontario that its net contribution to federal and provincial finances strengthened over this period despite the slight declines in its income and population shares.
Table 2: Allocators used to estimate city of Toronto federal revenues and expenditures
Federal Government Revenues and Expenditures Allocator Direct taxes from persons Personal income taxes Direct taxes from corporate and government business enterprises Corporate profits Direct taxes from non-residents (withholding taxes) Personal income taxes Contributions to social insurance plans Employer and employee contribution to EI Labour income by place of work Indirect taxes Customs import duties Sales of consumer goods and services Excise duties Sales of consumer goods and services Excise taxes and miscellaneous indirect taxes Sales of consumer goods and services Air transportation tax Other Sales of consumer goods and services Other current transfers from persons Personal income taxes Investment income Employed by place of work Current transfers from provincial governments Population Total revenue Net current expenditure on goods and services Population Current transfers to persons Family and youth allowances Population aged 0 to 14 Child Tax Benefit/Credit Population aged 0 to 14 Pensions, World Wars I and II Population aged 65 and over War veterans' allowances Population aged 65 and over Grants to aboriginal persons and organizations Population Goods and services tax credit Sales of consumer goods and services Employment insurance benefits Unemployment Old age security payments Population aged 65 and over Scholarships and research grants Population Miscellaneous and other Population Current transfers to business Employed by place of work Current transfers to non-residents Current transfers to provincial governments Population Current transfers to local governments Population Interest on public debt Population Total current expenditure Saving Capital consumption allowances Population Net capital transfers Population Acquisition of non-financial capital Investment in fixed capital and inventories Population Existing assets Population Net lending
Source: The Centre for Spatial Economics

30 Strong City, Strong Nation The Toronto Board of Trade
June 2002
Table 3: Allocators used to estimate city of Toronto provincial revenues and expenditures
Provincial Government Revenues and Expenditures Direct taxes from persons Personal income taxes Direct taxes from corporate and government business enterprises Corporate profits Employer contributions to workers' compensation Labour income by place of work Personal contributions to social insurance plans Hospital and medical insurance premiums Labour income by place of work Miscellaneous personal contributions to social insurance plans Labour income by place of work Indirect taxes Amusement tax Sales of consumer goods and services Corporation tax (not on profits) Population Gasoline tax Households (= vehicles) Motor vehicle licenses and permits Households (= vehicles) Other licenses, fees and permits Sales of consumer goods and services Miscellaneous taxes on natural resources Real property tax Households Retail sales tax (including liquor and tobacco) Sales of consumer goods and services Profits of liquor commissions Sales of consumer goods and services Gaming profits Payroll taxes Labour income by place of work Miscellaneous Sales of consumer goods and services Investment income Employed by place of work Current transfers from federal government Population Current transfers from local governments Population Total revenue Net current expenditure on goods and services Population Current transfers to persons Workers' compensation benefits Labour income by place of work Grants to benevolent associations Population Social assistance - income maintenance Population Social assistance - other Population Miscellaneous Population Current transfers to business Employed by place of work Current transfers to federal government Population Current transfers to local governments Population Interest on public debt Population Total current expenditure Saving Capital consumption allowances Population Net capital transfers Population Acquisition of non-financial capital Investment in fixed capital and inventories Population Existing assets Population Net lending
Source: The Centre for Spatial Economics

Strong CityStrong Nation
Securing Toronto’s
Contribution to Canada
June 2002The Toronto Board of Trade
www.bot.com
1711 6/11/02 10:49 AM Page 1