STRIVING TOWARD THE FUTURE: ASPIRATION …mparzen/published/parzen35.pdf1 striving toward the...
47
1 STRIVING TOWARD THE FUTURE: ASPIRATION-PERFORMANCE DISCREPANCIES AND PLANNED ORGANIZATIONAL CHANGE GIUSEPPE LABIANCA Gatton Endowed Associate Professor of Management LINKS International Center for Research on Social Networks in Business Gatton College of Business & Economics University of Kentucky Lexington, KY 40506 859-257-3741 [email protected] JAMES F. FAIRBANK Associate Professor of Management Penn State Erie, The Behrend College 5101 Jordan Rd. Erie, PA 16563 814-898-6232 [email protected] GOCE ANDREVSKI Assistant Professor of Management Queen’s University Kingston, ON [email protected] and MICHAEL PARZEN Associate Professor of Decision and Information Analysis Goizueta Business School Emory University Atlanta, GA 30322 404-727-6110 [email protected] June 10, 2009 Conditionally Accepted at Strategic Organization
Transcript of STRIVING TOWARD THE FUTURE: ASPIRATION …mparzen/published/parzen35.pdf1 striving toward the...
1
STRIVING TOWARD THE FUTURE:
ASPIRATION-PERFORMANCE DISCREPANCIES
AND PLANNED ORGANIZATIONAL CHANGE
GIUSEPPE LABIANCA
Gatton Endowed Associate Professor of Management
LINKS International Center for Research on Social Networks in Business
Gatton College of Business & Economics
University of Kentucky
Lexington, KY 40506
859-257-3741
JAMES F. FAIRBANK
Associate Professor of Management
Penn State Erie, The Behrend College
5101 Jordan Rd.
Erie, PA 16563
814-898-6232
GOCE ANDREVSKI
Assistant Professor of Management
Queen’s University
Kingston, ON
and
MICHAEL PARZEN
Associate Professor of Decision and Information Analysis
Goizueta Business School
Emory University
Atlanta, GA 30322
404-727-6110
June 10, 2009
Conditionally Accepted at Strategic Organization
2
STRIVING TOWARD THE FUTURE:
ASPIRATION-PERFORMANCE DISCREPANCIES
AND PLANNED ORGANIZATIONAL CHANGE
ABSTRACT
Interest has been growing in understanding how organizations’ aspiration levels affect their
planning for future organizational change. Previous research did not specify whether
organizations were using direct competitors or other comparable organizations as referents for
forming their aspirations. In this study, we argue that organizations form their social aspirations
based on two types of interorganizational comparisons: competitive and striving. In competitive
comparisons, an organization compares its current performance against that of its current direct
competitors. When relative performance is poor, these organizations plan more extensive and
more radical change. However, we show that organizations that are performing well relative to
competitors do not necessarily become inertial, as theory suggests. Rather, organizations engage
in striving comparisons by comparing their current performance against the performance of
organizations to which they strive to be like in the future. Our analyses show that organizations
with large striving discrepancies are driven to more extensive and more radical change, even if
they are performing well compared to current competitors. We examined this interplay between
competitive and striving discrepancy in explaining organizational change on a sample of 131
AACSB accredited business schools.

3
Why organizations change and what impetuses spark greater or lesser changes are central
questions in organization theory. Theorists in the organizational learning tradition view
organizational change as being driven by discrepancies between an organization’s aspirations
and the feedback it receives in terms of its performance (Cyert & March, 1963; Huber, 1991;
Levitt & March, 1988). Organizations learn from experience, and unsatisfactory performance is
the most salient experience for motivating changes to organizational goals, processes, and
structures. Organizational learning research has explored the topic of organizational change
primarily through these aspiration-feedback models (e.g., Baum & Dahlin, 2007; Bromiley,
1991; March & Shapira, 1992; Greve, 1998, 2003) and, thus, understanding the nature of these
aspirations is crucial.
Organizational learning theorists argue that organizations initiate change when they are
dissatisfied with their expected or aspired-to performance levels. Organizations establish the
levels of performance they are seeking by comparing their current performance with their
historical performance or with the performances of comparable organizations. The motivation to
change depends on how far their attained performance level is above or below their aspirations
(Cyert & March, 1963; Greve, 1998). Managers in organizations that perform below their
aspirations attempt to narrow the performance–aspiration gap by exploring beyond the local
environment and pushing for more extensive changes to the organization’s goals, processes, and
structures in the hopes that they can raise the organization’s performance closer to their
aspiration levels (e.g., Levinthal & March, 1981; Singh, 1986). By contrast, organizations that
perform above aspirations can respond more complacently, reinforce their current ways of doing
business, generally lack motivation to change, focus learning within the immediate
interorganizational environment, and make fairly minor modifications to existing routines
4
(Baum, Rowley, Shipilov, & Chuang, 2005). Thus, managers and decision makers evaluate the
organization’s success or failure according to their attainment discrepancy (March & Simon,
1958; Milliken & Lant, 1991), which affects their subsequent motivations to learn and change
(Baum & Dahlin, 2007).
When explaining the origin of these aspirations, organizational learning theorists argue that
aspirations are set against both internal and external referents (Argote & Greve, 2007).
Internally, organizational decision makers compare the organization’s current performance
against its historical performance, using these historically derived discrepancies to determine
how their organizations should adapt (e.g., Lant, 1992). Externally, the decision makers compare
the organization’s performance against the performance of a referent or peer group of other
organizations, a process that has been called social aspiration (e.g., Greve, 1998; Mezias, Chen
& Murphy, 2002) owing to its origins in Festinger’s (1942) social comparison theory. However,
recent research on the link between social aspirations and organizational change has yielded
mixed and contradictory findings; some researchers have found that discrepancy between the
organization’s current performance and its social aspirations leads to more organizational change
(e.g., Ketchen & Palmer, 1999), some to less (e.g., Greve, 1998), some to riskier or more-radical
change (e.g., Harris & Bromiley, 2007), and some to less-risky change (e.g., Iyer & Miller,
2008). We believe that without understanding these interorganizational social aspirations in
greater depth, the performance-feedback literature will continue to find such contradictory
results. Our study’s contribution to performance-feedback research is to bring elements of
cognitive research on competitive and referent groups into the study of social aspirations to show
that there are multiple types of social aspirations, and that better understanding these different
social aspirations will better explain how decision makers respond to attainment discrepancies.
5
Cyert and March (1963), on whose work most of this research was based, argued that
organizations look to the performance of both competitors and other comparable organizations
when evaluating how to adapt to their environment. We suggest that choosing which
organizations to compare against is an important decision, even if it is not made consciously but
rather through heuristics developed through experience over time. How decision makers interpret
the aspiration-performance feedback depends to an extent on which organizations they include in
the referent group. While Cyert and March explicitly acknowledged that aspirations are
subjective (1963: 124), modern researchers generally compare the performance of the
organization to an average of all of the organizations across an entire industry or subindustry
(e.g., Greve, 1998; 2003; Baum et al., 2005).
We argue that organizations derive their aspirations from two types of external social
comparisons — competitive comparisons and striving comparisons —and that these comparisons
explain in part the differences in organizational reactions. In competitive comparisons, an
organization compares its current performance against that of its current competitors to develop
its future aspirations. In striving comparisons, an organization compares its current performance
against the performance of organizations to which the organization strives to be like in the future.
Striving comparisons help the organization determine how it is doing relative to its imagined
future (Labianca & Fairbank, 2005). For example, Tata Motors might make competitive
comparisons against Hyundai, its most direct competitor currently, but might make striving
comparisons against Toyota, which is outside its immediate competitive set but which Tata
would like to equal someday.
Whether an organization views itself as a success or failure and how it responds in terms of
changes will be determined by its attainment discrepancies against organizations it considers its
6
current rivals, as well as discrepancies against those it is striving to equal in the future. We argue
that performance that is poor relative to direct competitors is likely to trigger more changes, and
changes that are riskier and more radical. But when performance is good relative to competitors,
it is important to understand how intensely the organization is striving to emulate organizations
that are performing at much higher levels. Organizations that are not greatly striving to equal
higher performers will react fairly inertially, while those organizations that are intensively
striving to emulate higher performers will be more likely to make more frequent, more radical,
and riskier changes.
Our focus in this study is on the managers’ plans and intentions to undertake change in their
organizations. Thus, we assume that managers (and their coalitions) are influential actors who
have power to initiate organizational change. We use the term “planned change” to refer to
managers’ plans to initiate organizational change at a subsequent date. We distinguish between
planned change type and planned change extent. Planned change extent refers to the number of
changes an organization plans to initiate in the future. Planned change type captures how
extensive and complex the changes are in terms of affecting many or few elements of the
organization; thus, this captures whether the intended change is more incremental or more radical
in nature. We examined how the interplay between competitive and striving comparisons relates
to organizations’ planned change extent and type in a cross-sectional field setting using surveys
and archival data with business schools as subjects for our research.
COMPETITIVE COMPARISONS AND ORGANIZATIONAL CHANGE
We began by examining the expected relationship between attainment discrepancy and planned
organizational change, as predicted by the performance-feedback model. According to that
theory, the difference between an organization’s performance and the performance of other
7
comparable organizations represents its attainment discrepancy. The greater the attainment
discrepancy, the more the organization will engage in search behaviors and organizational
change designed to minimize the discrepancy or close the gap (Cyert and March, 1963; Greve,
1998). Research based on the performance-feedback model and the effect of attainment
discrepancies has focused almost exclusively on differences between organizations’ current
levels of performance and the mean or median level of performance in the industry or in a
subindustry, and has assumed that these differences match how organizations’ top managers
make their social comparisons.
However, industries are not generally monolithic, and cognitive researchers have shown that top
managers focus their comparisons on smaller sets of reference groups within their industries
(e.g., Fiegenbaum & Thomas, 1995; Porac & Thomas, 1990). Generally, the primary comparison
is against the direct competitors within the industry (Porac et al., 1995). Researchers have shown
that managers often break competing industries into competitive sets to form cognitive maps
(e.g., Reger & Huff, 1993) and, furthermore, that these maps affect organizational action (e.g.,
Reger & Palmer, 1996).
When managers compare their current performance with their competitors’, a process we call
competitive comparison, they identify competitive discrepancies. Clearly, these salient
interorganizational social comparisons inform the performance-feedback model. Competitive
comparisons and competitive discrepancies are important because the competitive environment
is a very significant potential threat: an organization that perceives high competitive discrepancy
recognizes that it is underperforming its direct competitors — that it is failing (Milliken & Lant,
1991). Because failure threatens an organization’s very existence, managers of underperformers
are likely to be motivated to improve performance vis-à-vis their rivals’. For example, Ketchen
8
and Palmer (1999) found that hospitals with high competitive discrepancies were more likely to
enhance their high technologies. By contrast, the perception of success in comparison to
competitors, low competitive discrepancy, is likely to result in adhering to the status quo, or
inertia. For example, Greve’s (1998) study of the radio broadcasting industry found that stations
enjoying low competitive discrepancy in their audience market share were less likely to switch
their formats, while those experiencing high competitive discrepancy were more likely to alter
theirs. Taken together, studies employing a performance-feedback model perspective suggest
that organizations with high competitive discrepancies are more motivated to initiate changes
than those with low competitive discrepancies.
Hypothesis 1a: An organization with greater competitive discrepancy will be more likely
to plan more change than will one experiencing less competitive discrepancy.
The performance-feedback model also suggests that when organizations fall short of their
aspirations, they are more likely to undertake not only more change but also more radical and
riskier change that alters more elements of how the organization normally functions (e.g., Cyert
& March, 1963; Greve, 1998). The greater the discrepancy between performance and aspirations,
the more likely that managers will abandon the more routine local searches that are typical when
discrepancies are low and will, instead, search for and find solutions differently and ultimately
induce riskier change.
Researchers using the performance-feedback model have relied on elements of prospect theory to
suggest that different types of organizational change are likely to be initiated under different
conditions of attainment discrepancy derived from interorganizational social comparisons. An
organization is greatly threatened when its present performance shows high competitive
discrepancy: it faces economic adversity and the danger of lagging so far behind its rivals that it
9
cannot recover. According to prospect theory, organizations facing such threats are more likely
to pursue risky actions and radical change (e.g., Kahneman & Tversky, 1984; Shimizu, 2007). As
top managers stare at the certainty of poor outcomes, they gamble on riskier actions, taking the
organization further from its typical strategic behavior and routines and hoping that these bolder
actions will yield better outcomes. They take these risks even though success may be improbable
and the situation may actually grow worse. Prospect theorists argue that managers’ decision
making is colored by this fundamental bias for loss aversion.
Some performance-feedback model researchers adopting this perspective have found empirical
support for these arguments. For example, Harris and Bromiley (2007) found in their study of
corporate accounting fraud that firms with low sales growth relative to their industry were more
likely to engage in the risky practice of accounting misrepresentation. Audia and Greve’s (2006)
study of the shipbuilding industry found that large companies with high competitive
discrepancies were more likely to make the risky decision to launch a capital expansion of their
facilities. Those studies concluded that radical, risk-seeking organizational change and behavior
are consistent with performance-feedback models. The arguments for this perspective often
assumed competitors are the focus of the comparison, even as the researchers used industry
averages as proxies for making competitive comparisons. Following the same logic, we
hypothesize:
Hypothesis 1b: An organization with a greater competitive discrepancy will be more
likely to plan radical change than will one experiencing less competitive discrepancy.
THE ROLE OF STRIVING ASPIRATIONS IN ORGANIZATIONAL CHANGE
Performance-feedback theorists have argued that when organizations exhibit superior or
satisfactory performance relative to their competitors, they might become inert in responding to

10
environmental changes (e.g., Audia & Greve, 2006). Similarly, an organization with little
discrepancy between its performance and its aspirations can be lulled into complacency (e.g.,
Ketchen & Palmer, 1999). Whether this process is conscious or unconscious, the leaders
recognize that they occupy an acceptable competitive position, and they fear the inherent risk
that comes from change, lest that change erode their favorable competitive position.
Here, however, a counterargument surfaces: As organizations face smaller performance
discrepancies, they will have greater financial power to initiate change, experiment, explore
(Cyert & March, 1963; Nelson & Winter, 1982), and make it more difficult for others to keep up
with them. These arguments are at the heart of temporal competitive advantages theories
(D’Aveni, 1994; Covin & Slevin, 1991), which advocate continuous changes that make it
difficult for competitors to catch up. According to this view, organizations deliberately pursue
innovation and are engaged in a constant search for new and more effective ways of doing things
(Schumpeter, 1947: 151; Nelson & Winter, 1982; D’Aveni, 1994; Brown & Eisenhardt, 1989).
This innovative activity often provides the potential for frequent development of new products
and services, significant changes in the organization’s processes, structure, and capabilities, as
well as changes in their strategies and the way they compete in the marketplace (Covin & Miles,
1999). Thus, according to this temporal competitive advantages view, organizations at low levels
of competitive discrepancy will attempt to stay ahead of competitors by continuously
undertaking change.
Indeed, even within the performance-feedback studies, a number of findings have suggested that
being a relatively strong performer leads to more extensive and more radical change, counter to
performance-feedback theory. For example, Iyer and Miller (2008) found that strong performers,
with low attainment discrepancies, actually engaged in riskier behavior, in this case more
11
acquisitions. Chen and Miller (2007) found that strong performers engaged in more research and
development intensity, which suggests they strongly desired change. Even Audia and Greve
(2006) found that stronger performers among small firms exhibited greater factory expansion.
Why might some organizations become complacent and inert while others continue to embrace
change, even while they have satisfactory competitive discrepancies? We argue that without
understanding striving aspirations, researchers have an incomplete comprehension of how
organizations interpret performance feedback and plan subsequent strategic change.
Organizations with low striving discrepancies will become inertial when they are relatively
strong performers, while organizations with high striving discrepancies will continue to be
motivated to engage in organizational change.
Striving Comparisons
Cognitive researchers have argued that top managers face a number of choices as to which
organizations are similar to themselves (e.g., Baum & Lant, 2003; Reger & Huff, 1993), which
are their direct competitors (e.g., Porac & Thomas, 1990), and which they strive to emulate or
equal in the future (e.g., Gioia & Thomas, 1996; Elsbach & Kramer, 1996). Many of these
researchers have recognized that it may be inadequate to assume that organizations compare
themselves against industry averages, as the learning literature generally has done. Instead, they
have argued that we must think of industries as comprising various reference groups against
which an organization compares its performance (e.g., Fiegenbaum & Thomas, 1995), and that
the managers’ choices of these reference groups are sensitive to both strategic and political
realities (Porac et al., 1999).
12
While comparisons against one’s competitors are clearly salient and immediate sources of social
aspirations, researchers from cognitive strategic and referent group perspectives have pointed out
that organizational change is also driven by comparisons between the organization’s current
performance and the performance of those it is striving to be like in the future (e.g., Gioia &
Thomas, 1996; Labianca & Fairbank, 2005). By ignoring these striving aspirations, learning
theorists have been unable to adequately explain why some organizations with low competitive
discrepancy will continue to pursue many radical changes, while others in the same competitive
position will become more complacent and pursue only a few incremental changes.
As an important part of early research on social comparison theory, Festinger (1942) argued that
future-oriented striving comparisons were an important determinant of individuals’ motivation to
change. Although subsequent social comparison research has focused most heavily on historical-
and present-oriented comparisons in much the same way that learning theorists have done in the
organizational realm (see Buunk & Gibbons, 2007, for a review of social comparison theory),
psychological research in the past two decades has increasingly turned toward understanding the
role of more future-oriented, striving comparisons, including individuals’ ideas of what they
would like to become. These ideal self concepts, “like-to-be selves” (Markus & Nurius, 1986),
can help individuals set challenging stretch goals and motivate them to reach more closely their
ideal persona (e.g., Ruvulo & Markus, 1992; Lin & Tsai, 2006).
Organizational cognition researchers increasingly have emphasized that future-ideal orientations
strongly affect decisions regarding planned organizational change (e.g., Gioia et al., 2000).
Although an organization might be generally associated with a certain status category, its leaders
might want the world to view the organization in another category (Porac et al., 1995). Thus the
top managers sense a striving discrepancy, a gap between their aspirations for their future
13
performance and their current reality, which then motivates them to pursue organizational
change.
For example, Gioia and Thomas (1996) conducted a qualitative case analysis of a large public
university whose top managers initiated a future-oriented striving discrepancy to motivate
strategic change — to become a top-ten public university as their guiding striving aspiration. At
the time, the university was well regarded as a major public research university with a solid
reputation, but no one considered it to be among the elite public universities nationwide. The
perceived discrepancy between their future-striving aspiration and the current situation created
pressure for action to change. In response to the new vision, the university increased
benchmarking of universities considered to be in the top-ten and then launched major change
initiatives based on these comparisons.
In this study, we captured this forward-looking vision with the concept of striving discrepancy,
which is the gap between an organization’s current performance and the performance of those
organizations it aspires to be like in the future. Striving discrepancy reveals something about the
extent to which the organizational members have an upward drive that is motivating change
(Festinger, 1942). Whereas competitive discrepancy diagnoses current threats, future-oriented
striving discrepancy signals dreams for a better tomorrow. In combination, these discrepancies
can help us explain the firms’ propensity to engage in more or less change, and the extent to
which that change will be radical or incremental.
Top managers with high striving discrepancies have strong upward drive — a desire to drive
their organizations to be better — that often necessitates keeping an open mind about directions
for the future. Indeed, Martins (2005) showed that business schools whose managers perceived a
14
large discrepancy between outsiders’ and managers’ perceptions of their industry status were
more likely to undergo significant organizational change over a five-year period. Although the
constructs are different — Martins’ perceived identity-reputation discrepancy and our focus on
striving discrepancies — the similarities suggest that organizations whose managers are actively
striving for a future organization that performs more strongly relative to organizations outside of
its current competitors will be more likely to pursue greater change.
Hypothesis 2a: Organizations with higher striving discrepancies will plan more change
than will those with lower striving discrepancies.
The research on striving in the cognitive literature has not generally explicitly examined the
extent to which these striving discrepancies will motivate riskier, more radical change rather than
incremental change. However, we can make some predictions based on suggestions from
previous qualitative studies. For example, in Gioia and Thomas’s (1996) university study, the
organization’s high level of striving discrepancy led it to make more radical changes, including
joining a major athletic conference and creating a new school of information technology
requiring a large amount of capital. Labianca and Fairbank’s (2005) study showed that a business
school created an expensive doctoral program because of its high level of striving discrepancy.
Thus, we might expect that this phenomenon would be generalizable to other organizations: as
the gap grows between the organization’s current performance and that of others it is striving to
equal, it will commit to greater, wider-ranging problemistic search and will ultimately engage in
more radical organizational change.
Hypothesis 2b: Organizations with higher striving discrepancies will pursue more
radical change than will organizations with lower striving discrepancies.
15
The moderating role of striving discrepancy on the relationship between competitive
discrepancy and planned change
Thus far we have argued that organizations that experience either high competitive discrepancy
or high striving discrepancy are more likely to undertake changes and that the changes will be
more radical. However, these two types of discrepancy may affect organizations’ propensity to
change differently. More specifically, we posit that an organization that is underperforming
relative to its closest rivals is less concerned about its striving discrepancy and is much more
oriented toward its competitive discrepancy — surviving in its current competitive environment.
Consequently, we may expect that when organizations face high competitive discrepancy, the
competitive discrepancy will be a primary driver of organizational change, irrespective of the
level of striving discrepancy.
However, striving discrepancy becomes more salient driver of organizational change when
organizations experience low levels of competitive discrepancy. At low levels of competitive
discrepancy, organizations are more likely to become complacent (e.g., Miller & Friesen, 1984;
Hedberg, Bystrom, & Starbuck, 1976). Research suggests that when an organization is
performing well relative to its closest competitors, it might feel content with their current market
position (Lant & Montgomery, 1987) and exhibit competitive inertia (Greve, 1998). Competitive
inertia is high when a firm initiates a few changes within a narrow range of activity (Miller &
Chen, 1994). We argue that organizations may avoid inertial competitive behavior when they
have a high level of striving discrepancy. An organization that is comparable to or has an
advantage over its direct competitors can reset its sights on other potential referents that are
higher status or better performers (Labianca & Fairbank, 2005). Because of its emphasis on
continuing to strive upward, the future-oriented aspiration discrepancy keep organizational
16
members motivated to continue pursuing opportunities for change and at the same time reduce
their tendency to focus too much on how well they perform vis-à-vis their current competitors.
For example, Labianca and Fairbank (2005) studied a business school that originally set its sights
on being a top-25 school. Yet, once the goal was achieved, the top managers immediately
increased its future aspirations to top-15 status and changed its comparison schools accordingly
to continue to motivate change. In essence, by continually enacting a high-striving discrepancy,
top management can discourage an organization with low competitive discrepancy from falling
victim to competitive inertia, and continue to motivate change in an effort to reach more
challenging performance targets. Choosing a new set of organizations as a reference point toward
which to strive helps the organizational members to maintain a high level of urgency and need
for initiating organizational change and improvement. Thus, we predict that organizations with
low competitive discrepancies will be less likely to respond inertially if they have high aspiration
discrepancies.
Hypothesis 3: There will be a negative interaction between competitive and striving
discrepancy in explaining organizational change. At low levels of competitive
discrepancy, organizations with low striving discrepancy will have low levels of change,
and the change will be incremental; organizations with high levels of striving
discrepancy will have high levels of change, and the change will be radical.
METHODS
Sample
We tested our propositions on a sample of 131 accredited business schools from the Association
to Advance Collegiate Schools of Business (AACSB). We selected this industry because it
17
features systematic interorganizational monitoring and comparison, which is a regular feature of
strategic planning among those schools that operate in a highly institutionalized sector. The
institutional environment creates strong social pressures for organizations to conform to
established norms as a means to demonstrate legitimacy (Meyer & Rowan, 1977). In particular,
the AACSB requires schools to identify several categories of comparison groups — peers,
aspirants, and competitors — during the initial accreditation process and for periodic
accreditation reviews. Accordingly, it is reasonable to expect that administrators know or have
immediate access to the organizations against which they compare themselves. Those
administrators are responsible not only for formulating the strategic direction of their institutions
but also for implementing strategic plans. This suggests that they will make their social
comparison choices with considerable care, providing additional credibility for our primary data.
In addition, reliable and consistent archival data is also readily available for this industry, as
AACSB annually collects extensive strategic, structural, and performance data from its
accredited institutions. Administrators who examine that data can determine differences in, for
example, size, governance, resources, and programmatic focus for specific institutions.
Furthermore, rankings of business schools are readily available from several external sources
such as Business Week, and U.S. News and World Report, enabling administrators to determine
differences in institutional status. Finally, this industry setting provides a sufficiently large
sample of firms for adequate empirical investigation. For more on this industry and its planned
changes at the time of data collection, please see Fairbank, Labianca, and LeClair (2005).
Data
We surveyed 468 business school deans from AACSB’s accredited schools in the fall of 2004.
Email invitations were sent to deans or dean equivalents such as directors or department heads to
18
complete the Web-based survey hosted on the AACSB Website. The survey asked the deans
about their strategic management activities as well as which schools they compete against most
directly across their major programs and which schools they aspire to equal. Results from the
survey were matched with data on the schools supplied by the AACSB. The final sample
included 131 business schools, a 28% response rate.
Because a majority of deans did not respond to our survey, we tested for potential nonresponse
bias. We obtained data on the number of faculty and students, public versus private schools,
university type using the Carnegie Classification of Institutions of Higher Education
(http://chronicle.com/stats/carnegie/), geographic region, and organizational reputation using
U.S. News rankings of all undergraduate and graduate business programs. We then ran logistic
regression to test for the significance of the differences between responders and nonresponders
as a function of the above variables. No variables were significantly different except the number
of students, which was our proxy for organizational size. The average number of students for the
responding schools was 2,130; for nonresponders it was 1,976.
Statistical Model
In selecting an appropriate statistical model, we considered several issues. First, the extent of
planned change, whether large or small, and the type of planned change, whether radical or
incremental, may be simultaneously and systematically affected by stable and unobservable
factors such as top managers’ risk-taking propensity. This implies that the errors might be
contemporaneously correlated across different equations; therefore the coefficients should be
estimated jointly. The high correlation between these two variables (r = .61) further suggests that
the same unobserved factor may cause these two variables. Because the two equations were
linked only by their disturbances, we used a seemingly unrelated regression model (SUR)
19
(Green, 2003; Zellner, 1962). The coefficients of this model were estimated using the
generalized least squares (GLS) estimation method, which provides consistent and more efficient
estimates than the ordinary least squares (OLS) method. In addition, the White test indicated the
presence of heteroskedasticity among the standard errors. We identified that the variance in the
errors around the predicted values was much greater for small schools than for large ones, with
size being operationalized as the number of students enrolled. To deal with this issue, we applied
weighted least squares estimation (Baum, 2006), which produces feasible generalized least
squares estimates (FGLS). We used the number of students per school as an analytical weight
[aw=1/zi2 in STATA], where zi
2 is number of students squared.
Measures
Dependent Variables
Planned Change Extent. The planned change extent scale and the planned change type scale were
derived from the scales used in Gioia & Thomas (1996) and Labianca et al. (2001). We used
only the five content areas that had the highest factor loadings as reported by Gioia and Thomas
(1996). This allowed us to minimize the number of questions that the respondents had to answer
on a lengthy questionnaire. We asked deans, “Are many changes planned in the following
areas?” on a five-point Likert scale (5 = many; 1 = few or none). We took the average across five
content areas: program offerings, quality of students, quality of faculty, overall reputation and
prestige, and financial resources. Reliability for the scale was good (Cronbach’s alpha = .82,
mean = 3.26, std. dev. = .80). This variable, and the other subsequent variables, were
standardized prior to inclusion in the regression model.
Planned Change Type. To measure planned change type, we asked deans, “Are these planned
changes radical or incremental?” on a five-point Likert scale (5 = radical; 1 = incremental). The
20
content areas were the same as for planned change type, and we used the average as above.
Reliability for the scale was good (Cronbach’s alpha = .77, mean = 2.78, std. dev. = .80).
Although the planned change type and extent variables were related (r = 0.61), as one would
expect, they depicted different construct domains and had only a 36% overlap in shared variance.
A principal components factor analysis using a Varimax rotation on the data showed that the
planned change extent and type items fell into the two categories as predicted (factor analysis
results available from the authors).
Independent Variables
Competitive and Striving Discrepancy. Deans were asked to provide two lists of business schools
they monitored. The first was a list of business schools with which they “compete most directly
across your most important programs.” Respondents were given six slots and another open field
in which they could name as many schools as they wished to provide. The average number of
competitor schools was 3.92, std. dev. = 2.24. For the second list, we asked deans to name the
business schools to which they aspired, that is, “schools that your school emulates, i.e., actively
strives to equal or excel.” The average number of emulated schools was 3.34, std. dev. = 2.09.
The average overlap between the competitive set of schools identified and the aspiration business
schools was 21% (std. dev. = 16%).
Competitive discrepancy was measured as the difference between the focal school and the
average of its competitor schools on revenue per faculty member. We standardized this variable
to reduce potential multicollinearity problems when testing the interaction effects. The larger the
discrepancy scores, the worse the school is performing relative to the members of its competitive
set. We collected revenue and faculty data from the AACSB. Revenue per faculty member is a
direct measure of a school’s economic health (Hopkins & Massy, 1981) that can be used to
21
compare across a wide variety of business school types, which can often differ dramatically in
their revenue sources (e.g., funding from legislatures, endowment income, executive education
revenue).
We measured striving discrepancy as the difference between the focal school and the average of
its aspiration schools on revenue per faculty member. The larger the discrepancy, the worse the
school was performing relative to the members of its set of aspirant schools. However, we prefer
an alternative interpretation of this variable: the larger this discrepancy, the more ambitious are
the organization’s future aspirations — they are striving high.
Control variables
Ownership. This categorical variable captured whether the business school was publicly funded
(coded 1) or privately funded (2). This control variable was necessary because public business
schools as a whole, compared with private schools, have been seeking more extensive and
radical change, probably because legislative funding for public schools has been declining, and
this has caused them to aggressively seek other funding sources, necessitating greater and riskier
change initiatives (Fairbank, et al., 2005). The mean was 1.31 and std. dev. was 0.47.
Organizational Size. We used the number of students in each school as our measure of school
size, and we standardized this variable. Previous research has suggested that organizational size
is related to the flexibility and speed for initiating competitive actions (Chen & Hambrick, 1995)
and the propensity for undertaking strategic change (Kelly & Amburgey, 1991). Organizational
size has also been used to operationalize slack in previous performance-feedback studies (e.g.,
Audia & Greve, 2006), and is thus a theoretically important control variable.
22
University Type. University-level factors could also affect the business school’s propensity to
change. For example, the resources available to a given business school may depend on the
university’s range of baccalaureate programs and the number and the range of master’s and
doctoral degrees awarded. We controlled for this possibility by using the Carnegie Classification
of Institutions of Higher Education that classifies educational institutions into nine categories: (1)
doctoral/research–extensive, (2) doctoral/research–intensive, (3) master’s colleges and
universities I, (4) master’s colleges and universities II, (5) baccalaureate colleges – liberal arts,
(6) baccalaureate colleges – general, (7) baccalaureate/associate’s colleges, (8) associate’s
colleges, and (9) specialized institutions. Because we focused on AACSB-accredited institutions,
which did not include associate’s colleges or specialized institutions at the time of our survey,
our sample includes only institutions from the first six categories.
Organizational Reputation. We used the U.S. News and World Report’s Business School Ranking
Survey to obtain organizational reputation data. We used the peer-assessment ranking of the
quality of both undergraduate and graduate business programs. U.S. News surveys the deans of
all accredited business schools about the quality of the business programs of other business
schools on a scale from 1 (marginal) to 5 (outstanding). The peer-assessment scores were
computed as an average of all responses. These scores ranged from 2.3 to 3.9 for undergraduate
business programs and 2.3 to 4.2 for graduate business programs.
Geographic Region. We also controlled for the geographical location of the business school.
Schools in the same region might be more likely to be chosen as a reference point either as
competitors or as aspiration targets than are the schools located in more distant regions. We used
the U.S. National Center for Educational Statistics’s regional classification of schools to
categorize the business schools as midwestern, northeastern, southern, and western.

23
Common Method Bias
Because we collected some independent and dependent variables from a survey of deans, a
single source, we used two procedures to assess the effect of common method variance on our
findings. First, we applied Harman’s (1976) single-factor test. The unrotated factor solution
showed that a single factor did not account for the variance of our independent and dependent
variables. However, this is a weak test of common method bias because it is unlikely that one-
factor model will provide the best fit with the data. Therefore, Podsakoff, MacKenzie, Lee, and
Podsakoff (2003) also suggested a partial correlation procedure for controlling for method bias.
This procedure required a direct measure of the potential source of the common method bias.
One source of common method bias is the so-called social desirability factor, which refers to
“the tendency on the part of individuals to present themselves in a favorable light, regardless of
their true feelings about an issue or topic” (Podsakoff et al., 2003: 881). One potential proxy for
this social desirability bias is the business school’s reputation. The rationale is that the deans of
high-reputation schools are more likely to have a higher propensity to present their school and
themselves more favorably, which in turn might affect their responses on both their plans for
strategic change and the selection of their competitors and aspiration targets. We used the U.S.
News rankings of the quality of their undergraduate and graduate business programs to control
for social desirability effects in all models. In addition, we transformed our independent and
dependent variables by partialling out the effect of the U.S. News undergraduate and graduate
ranking variables. The estimated coefficients using the transformed variables did not change the
results. This procedure provided greater confidence that common method bias did not affect our
results.
24
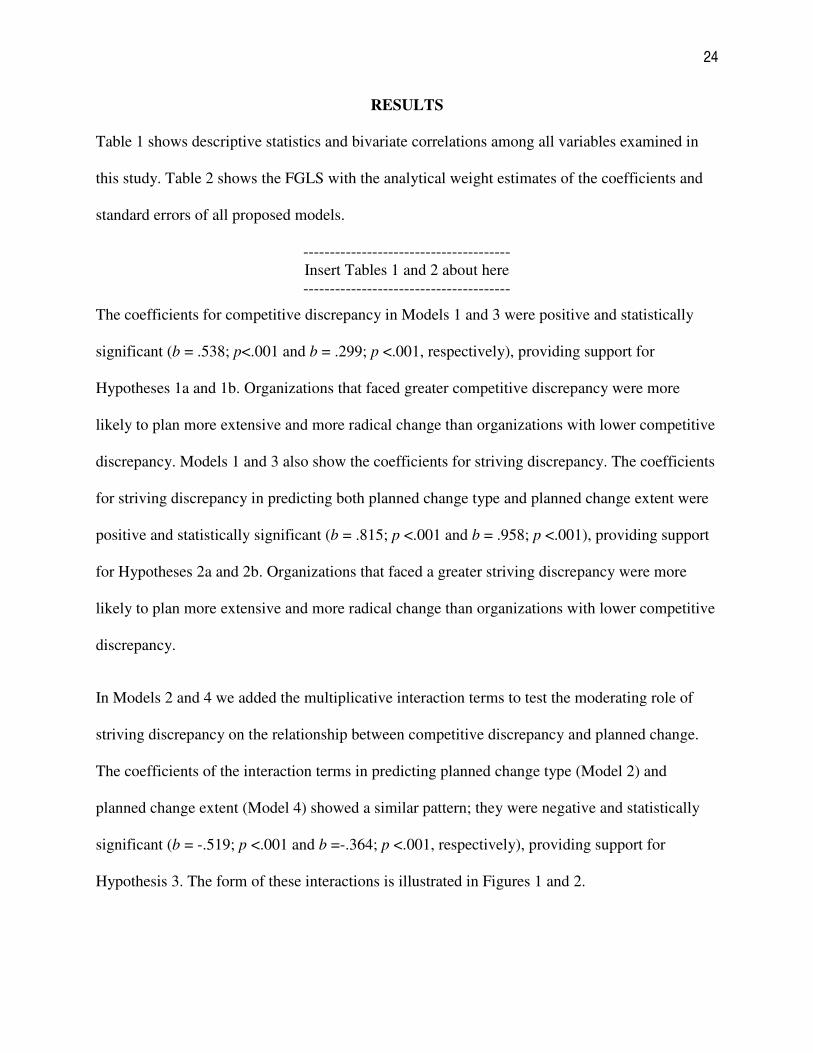
RESULTS
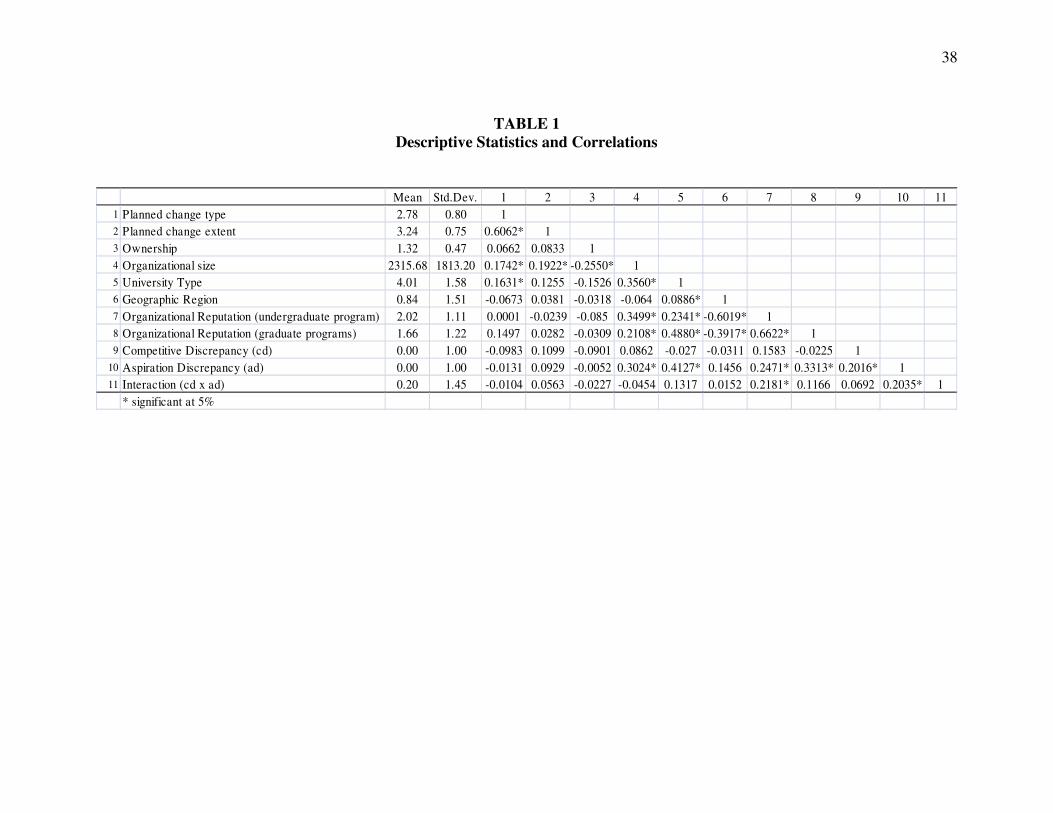
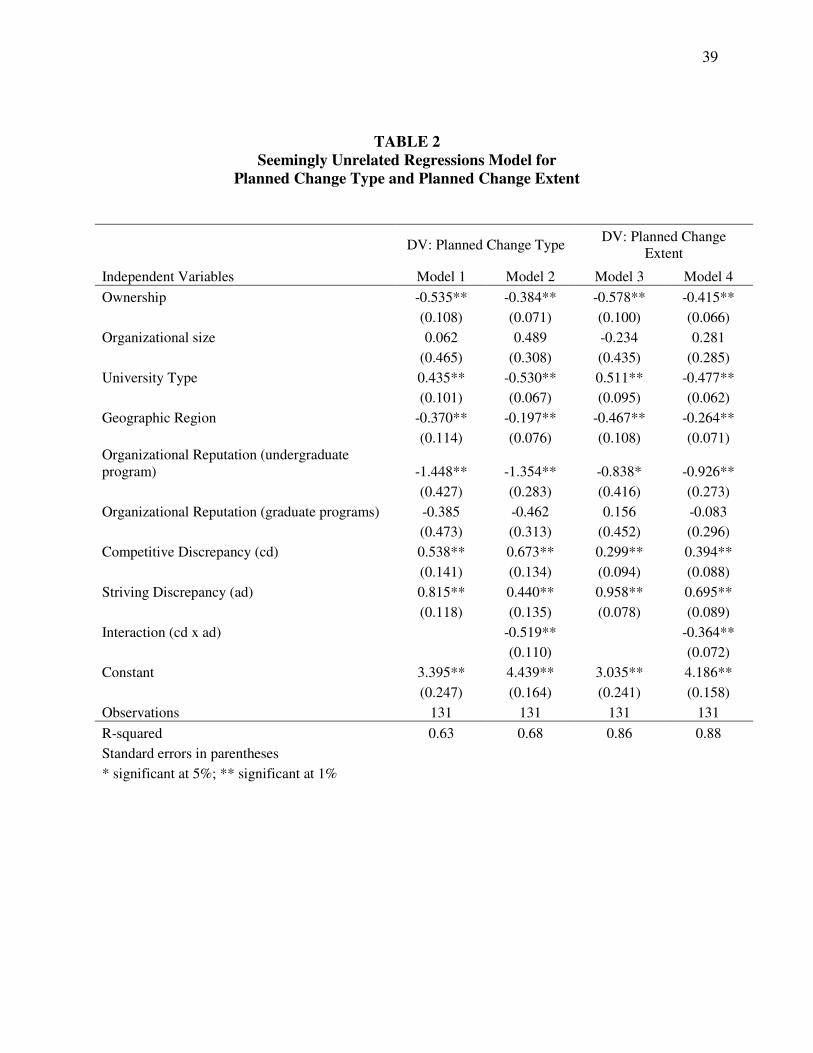
Table 1 shows descriptive statistics and bivariate correlations among all variables examined in
this study. Table 2 shows the FGLS with the analytical weight estimates of the coefficients and
standard errors of all proposed models.
---------------------------------------
Insert Tables 1 and 2 about here
---------------------------------------
The coefficients for competitive discrepancy in Models 1 and 3 were positive and statistically
significant (b = .538; p<.001 and b = .299; p <.001, respectively), providing support for
Hypotheses 1a and 1b. Organizations that faced greater competitive discrepancy were more
likely to plan more extensive and more radical change than organizations with lower competitive
discrepancy. Models 1 and 3 also show the coefficients for striving discrepancy. The coefficients
for striving discrepancy in predicting both planned change type and planned change extent were
positive and statistically significant (b = .815; p <.001 and b = .958; p <.001), providing support
for Hypotheses 2a and 2b. Organizations that faced a greater striving discrepancy were more
likely to plan more extensive and more radical change than organizations with lower competitive
discrepancy.
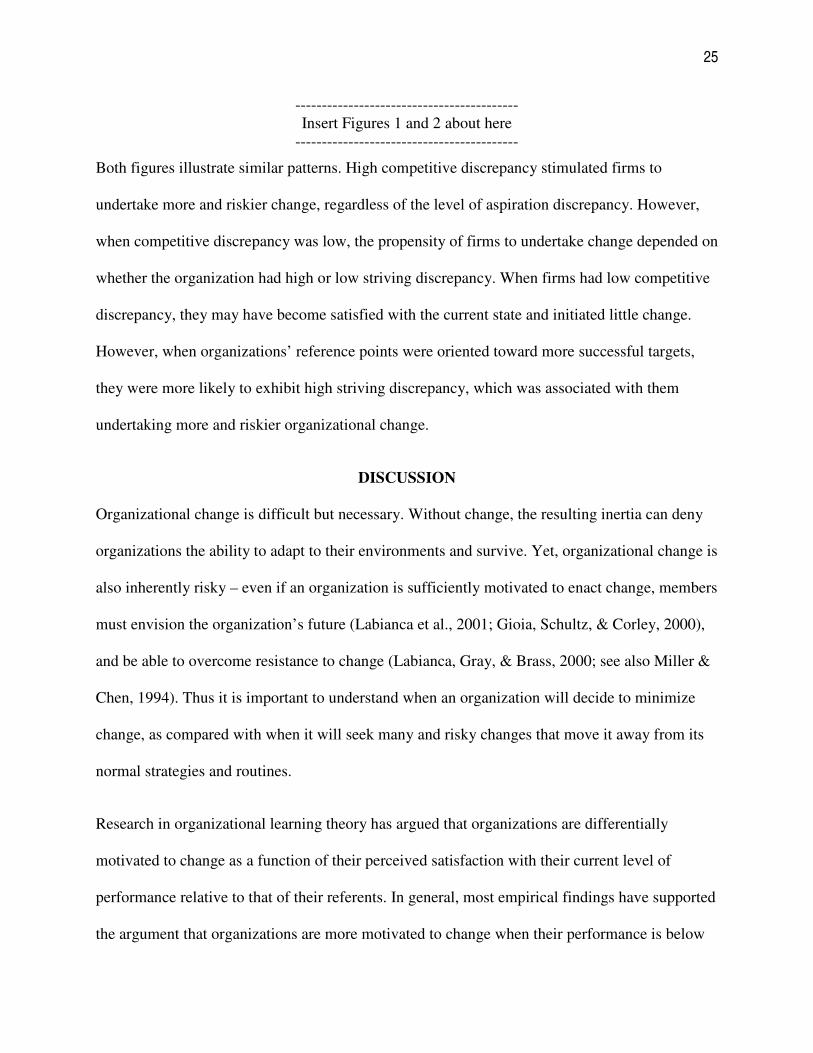
In Models 2 and 4 we added the multiplicative interaction terms to test the moderating role of
striving discrepancy on the relationship between competitive discrepancy and planned change.
The coefficients of the interaction terms in predicting planned change type (Model 2) and
planned change extent (Model 4) showed a similar pattern; they were negative and statistically
significant (b = -.519; p <.001 and b =-.364; p <.001, respectively), providing support for
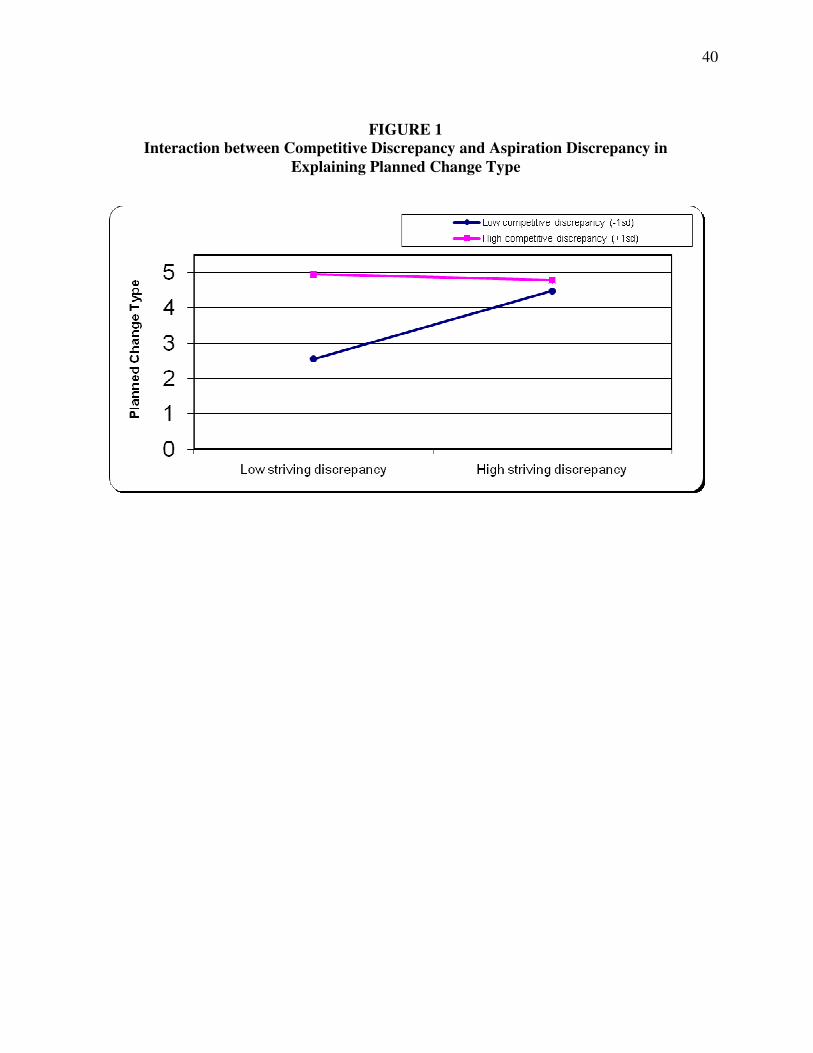
Hypothesis 3. The form of these interactions is illustrated in Figures 1 and 2.
25
------------------------------------------
Insert Figures 1 and 2 about here
------------------------------------------
Both figures illustrate similar patterns. High competitive discrepancy stimulated firms to
undertake more and riskier change, regardless of the level of aspiration discrepancy. However,
when competitive discrepancy was low, the propensity of firms to undertake change depended on
whether the organization had high or low striving discrepancy. When firms had low competitive
discrepancy, they may have become satisfied with the current state and initiated little change.
However, when organizations’ reference points were oriented toward more successful targets,
they were more likely to exhibit high striving discrepancy, which was associated with them
undertaking more and riskier organizational change.
DISCUSSION
Organizational change is difficult but necessary. Without change, the resulting inertia can deny
organizations the ability to adapt to their environments and survive. Yet, organizational change is
also inherently risky – even if an organization is sufficiently motivated to enact change, members
must envision the organization’s future (Labianca et al., 2001; Gioia, Schultz, & Corley, 2000),
and be able to overcome resistance to change (Labianca, Gray, & Brass, 2000; see also Miller &
Chen, 1994). Thus it is important to understand when an organization will decide to minimize
change, as compared with when it will seek many and risky changes that move it away from its
normal strategies and routines.
Research in organizational learning theory has argued that organizations are differentially
motivated to change as a function of their perceived satisfaction with their current level of
performance relative to that of their referents. In general, most empirical findings have supported
the argument that organizations are more motivated to change when their performance is below
26
that of their referents, and less likely to change when they are content with their performance —
that is, when their performance meets or exceeds that of their referents. These findings are not
uniform, however. Other researchers have found support for a contrary argument that
organizations are more motivated to change when they are performing satisfactorily; that is,
when they are performing better than their referents.
Why these conflicting findings? In this study, we found evidence for our argument that
conflicting findings arise from prior research’s failure to recognize that organizations make
competitive and striving social comparisons. Specifically, a focal organization assesses its
performance by comparing it against direct competitors and against organizations it strives to
equal. Previous research assumed that organizations used only their direct competitors as
referents for forming their aspirations, or simply used industry averages that obscured the
difference between competitive and striving comparisons. In this paper, we showed that although
competitive comparisons are important motivators of organizational change, they provide an
incomplete understanding of organizations’ propensity to change. Whether a firm will undertake
change depends on the interplay between competitive and striving comparisons.
We argued that competitive comparisons are stronger motivating factors for organizational
change than are future-oriented striving comparisons. Our results suggested that organizations
are more motivated to change when their competitive discrepancy is higher — when they
underperform relative to their direct competitors — regardless of their striving discrepancy.
When they cannot keep up with their direct rivals, they are under immediate increased threat of
survival, and this adversity makes comparisons with rivals critical for performance evaluation.
On the other hand, striving discrepancy becomes critical for explaining why organizations that
outperform rivals continue to change rather than becoming complacent and falling victim to
27
organizational inertia. Our findings suggest that organizations with low competitive discrepancy
are more likely to undertake change when they exhibit high striving discrepancy; that is,
organizations that are outperforming their direct rivals are less likely to exhibit inertia when they
aspire to equal a new set of more successful organizations in the future. Just as challenging or
stretch goals are important for individuals’ motivation to continue learning and performing well,
the same is true for organizations. Because a performance discrepancy is greater between a focal
firm and more prestigious and better-performing organizations, the focal firm has greater
incentive to initiate organizational change. Additionally, given that the more successful
organizations are likely to be operating in a different competitive environment, our findings also
showed that striving discrepancy motivated the focal organization to undertake not only more but
also more radical change.
Our study highlighted the importance of integrating research on aspiration levels from the
aspiration-feedback model perspective (e.g., Greve, 1998; Chen & Miller, 2008; Mezias et al.,
2002) with the work on aspiration and emulation being conducted by cognitive researchers (e.g.,
Gioia & Chittipeddi, 1991; Gioia & Thomas, 1996; Elsbach & Kramer, 1996; Labianca et al.,
2001; Gioia et al., 2000; Labianca & Fairbank, 2005). The latter research has recognized
explicitly that the choice of referent groups is a cognitive process that incorporates both current-
and future-oriented elements. As organizations ask, “What do we want to be in the future?” they
might actually be laying the foundation for dealing with the challenges they face today. Our
work also advances this cognitive research. For example, much of the empirical work in that
area has focused on how striving aspirations affect issue interpretation (e.g., whether an issue is
viewed as being strategic or tactical) without examining how it affects organizational change
(e.g., Gioia & Thomas, 1996), or has only done so with reference to a single case study (e.g.,
28
Labianca & Fairbank, 2005). Recent researchers in the cognitive tradition are moving into
examining the relationship between discrepancies and organizational change. For example,
Martins (2005) showed that the perceived discrepancy between a business school’s ranking and
the business school’s organizational identity drove the extent of organizational change. We
would urge them to marry an aspiration-feedback approach that incorporates competitive
discrepancies, as we have done here, with an approach that takes into account how top managers
perceive discrepancies on issues such as striving, emulation, identity, image, and reputation.
Limitations. One limitation of our paper is that we did not consider the importance of
organizational identity, image, and reputation in motivating the extent and radicality of change.
Previous researchers (e.g., Martins, 2005; Elsbach & Kramer, 1996; Gioia & Thomas, 1996)
have shown that the motivation for an organization to change is often rooted in how the
organizational members and top managers see their identity, how they perceive that outsiders
view their image, and what their actual reputation is according to outside constituencies.
Organizational reputations, whether transmitted through formal means such as rankings
published in magazines or more informal means such as through discussions within an industry
can motivate organizational members to want others to view their organizations more favorably.
The extent to which a gap exists between the organization’s current state and the desired future
image and reputation can motivate top management to increase the amount and radicalism of
change (e.g., Dutton & Jackson, 1992; Gioia, et al, 2000; Martins, 2005). If top management
uses and communicates these image concerns effectively, they can also motivate organizational
members to avoid their natural inclination to resist change, and thus increase the likelihood that
change will be successful. Although we controlled for organizational reputation, our research
asked only which organizations the focal organization was aspiring to be like, but did not attempt

29
to parse the different influences of desired future identity, image, and reputation as some
previous studies have done (e.g., Gioia & Thomas, 1996; Martins, 2005). We encourage future
researchers to consider integrating a more fine-grained approach to studying desired identity,
image, and reputation into the study of performance-feedback models and organizational change.
Another limitation is that we did not know to what extent internal considerations, such as the
strength of leadership, administrator tenure, coalition support, and internal power dynamics,
affected current strategic planning choices (e.g., Greenwood & Hinings, 1996). An approach that
more comprehensively considered both the internal and external forces for social comparison and
strategic change would enrich our understanding of the dynamics of comparison and change
processes. Another limitation is that we relied on survey data to understand the top managers’
view of their competitive and striving comparisons and were unable to conduct a longitudinal
investigation to track actual change, as compared with planned change. While this is not critical
in the sense that the performance-feedback model is a cognitive theory of comparisons and
reactions to those comparisons, a longitudinal investigation of how these competitive and
striving discrepancies affect change over time would enhance our understanding.
Implications for future research. One strength of our study is that we engaged directly with
managers to understand their aspirations. While most research on behavioral/learning theory has
attempted to examine aspirations by collecting secondary data about performance and structural
variables such as organizational size to understand managers’ desires to engage in risky change
(cf., Greve, 2008), direct discussion with the top managers who make these decisions has been
lacking. Gathering primary data from top managers helps us understand who they view as
competitors (e.g., Reger & Huff, 1993; Reger & Palmer, 1996), which provides more accurate
insight into how organizational members perceive competitive discrepancies. It also opens a
30
window into understanding how they are thinking about the future, and what organizational
changes they are planning. Without attempting to understand future aspirations, researchers have
lacked a more complete comprehension of what drives organizational leaders to select more or
less risky change paths. As researchers have moved increasingly toward more deeply
understanding the choices between different types of organizational changes, we urge a move
from purely secondary data sources toward giving voice more directly to top managers through
such methods as surveys or interviews so that the desired futures of organizations can be better
understood.
31
REFERENCES
Argote, L. and Greve, H.R. 2007. A Behavioral Theory of the Firm – 40 Years and Counting:
Introduction and Impact. Organization Science, 18 (3): 337-349.
Baum, C.F. (2006) An Introduction to Modern Econometrics Using STATA. College Station, TX:
A Stata Press Publication.
Baum, J.A.C. and Dahlin, K.B. (2007). Aspiration Performance and Railroads’ Patterns of
Learning from Train Wrecks and Crashes. Organization Science, 18 (3): 368-385.
Baum, J. A. C., and T. K. Lant 2003 “Hits and Misses: Managers’(Mis)categorization of
Competitors in the Manhattan Hotel Industry.” In J. A. C. Baum and O. Sorenson (eds.),
Geography and Strategy: Advances in Strategic Management, 20: 118–155. Oxford, UK:
JAI/Elsevier.
Baum, J.A.C., and Mezias, S.J. (1992) ‘Localized Competition and Organizational Failure in the
Manhattan Hotel Industry, 1898-1990’, Administrative Science Quarterly, 37, 580-604.
Baum, J. A. C., Rowley, T. J., Shipilov, A. V. and Chuang, Y. T. (2005) ‘Dancing with
Strangers: Aspiration Performance and the Search for Underwriting Syndicate Partners’,
Administrative Science Quarterly, 50 (4): 536-575.
Bromiley, P. (1991). Testing a Causal Model of Corporate Risk Taking and Performance.
Academy of Management Journal, 34 (1): 37-59.
Brown, S.L. & Eisenhardt, K.M. 1998. Competing on the edge: Strategy as structured chaos.
Boston, MA: Harvard Business School Press.
Buunk, A.P. and Gibbons, F.X. (2007) ‘Social Comparison: The End of a Theory and the
Emergence of a Field’, Organizational Behavior and Human Decision Processes, 102: 3-21.

32
Chen, M-J. and Hambrick, D.C. 1995. ‘Speed, Stealth, and Selective Attack: How Small Firms
Differ from Large Firms in Competitive Behavior’, Academy of Management Journal, 38 (2):
453-482.
Chen, M-J. and Miller, K. (2007). Competitive Tension: The Awareness-Motivation-Capability
Perspective. Academy of Management Journal, 50 (1): 101-118.
Covin, J. G. and Slevin, D. P. (1991) ‘A Conceptual Model of Entrepreneurship as Firm
Behavior’, Entrepreneurship Theory and Practice, 16 (1): 7-24.
Covin, J.G. and Miles, M.P. (1999) ‘Corporate Entrepreneurship and the Pursuit of Competitive
Advantage’, Entrepreneurship Theory and Practice, 23 (3): 47-63.
Cyert, R.M. and March, J.G. (1963) A Behavioral Theory of the Firm. Englewood Cliffs, NJ:
Prentice Hall.
D'Aveni, R. A. (1994) Hypercompetition: Managing the Dynamics of Strategic Maneuvering.
New York: Free Press.
Dutton, J.E. and Jackson, S.E. (1987). Categorizing Strategic Issues: Links to Organizational
Action. , 12 (1): 76-90.
Elsbach, K.D. and Kramer, R.M. (1996) ‘Members’ Responses to Organizational Identity
Threats: Encountering and Countering the Business Week Rankings’, Administrative Science
Quarterly, 41: 442-476.
Fairbank, J.F., Labianca, G., & LeClair, D. (2005). ‘Three-Year Forecast’, BizEd, May/June:
46-51.
Fiegenbaum, A. and Thomas, H. (1995) ‘Strategic Groups as Reference Groups: Theory,
Modeling and Empirical Examination of Industry and Competitive Strategy’, Strategic
Management Journal, 16: 461-476.
33
Festinger, Leon (1942) ‘Wish, Expectation, and Group Standards as Factors Influencing Level of
Aspiration’, Journal of Abnormal and Social Psychology, 37: 184-200.
Gioia, D. A. and Chittipeddi, K. (1991) ‘Sensemaking and Sensegiving in Strategic Change
Initiation’, Strategic Management Journal, 12: 433-448.
Gioia, D. A., Schultz, M. and Corley, K. (2000) ‘Organizational Identity, Image, and Adaptive
Instability’, Academy Management Review, 25: 63-81.
Gioia, D.A. and Thomas, J.B. (1996) Institutional Identity, Image and Issue Interpretation:
Sensemaking during Strategic Change in Academia’, Administrative Science Quarterly, 41:
370-403.
Green, W.H. (2003) Econometric Analysis (5th edition). Upper Saddle River, NJ: Prentice Hall.
Greenwood, R. and Hinings, C.R. (1996) ‘Understanding Radical Organizational Change:
Bringing Together the Old and New Institutionalism’, Academy of Management Review, 21:
1022-1054.
Greve, H.R. (1998) ‘Performance, Aspirations, and Risky Organizational Change’,
Administrative Science Quarterly, 43: 58-77.
Greve, H.R. (2002) ‘Sticky Aspirations’, Organization Science, 13: 1-17.
Greve, H.R. (2003) ‘A Behavioral Theory of R&D Expenditures and Innovation: Evidence from
Shipbuilding’, Academy of Management Journal, 46: 685-702.
Greve, H.R. (2008) ‘A Behavioral Theory of Firm Growth: Sequential Attention to Size and
Performance Goals’, Academy of Management Journal, 51: 476-494.
H.H. Harman (1976). Modern Factor Analysis, University of Chicago Press: Chicago, IL.
34
Harris, J., & Bromiley, P. 2007. Incentives to Cheat: The Influence of Executive Compensation
and Firm Performance on Financial Misrepresentation. Organization Science, 18 (3): 350-
367.
Hedberg, B.L.T., Bystrom, P.C. and Starbuck, W.H. (1976) ‘Camping on the Seesaws:
Prescriptions for a Self-Designed Organization’, Administrative Science Quarterly, 21: 41-
65.
Hopkins, D.S.P., and Massy, W.F. (1981) Planning Models For Colleges and Universities.
Stanford, CA: Stanford University Press.
Huber, G.P. (1991). Organizational Learning: The Contributing Processes and the Literatures.
Organization Science, 2 (1): 88-115.
Ireland, R.D., Hitt, M.A. and Sirmon, D.G. (2003) ‘A Model of Strategic Entrepreneurship: The
Construct and Its Dimensions’, Journal of Management, 29 (6): 963-989.
Iyer, D.N. and Miller, K.D. (2008). Performance Feedback, Slack, and the Timing of
Acquisitions. Academy of Management Journal, 51 (4): 808-822.
Kahneman, D. and Tversky, A. (1984) ‘Choices, Values and Frames’, American Psychologist,
39: 341-350.
Kelly, D. and Amburgey, T.L. (1991) ‘Organizational Inertia and Momentum: A Dynamic
Model of Strategic Change’, Academy of Management Journal, 34: 591-612.
Ketchen, D. and Palmer, T. 1999. Strategic responses to poor organizational performance: A test
of competing perspectives. Journal of Management, 25: 683–706.
Labianca, G. and Fairbank, J.F. (2005) ‘Interorganizational Monitoring: Process, Choices, and
Consequences’, In G. Szulanski, Y. Doz, and J. Porac (eds) Advances in Strategic
Management, vol. 22: pp. 117-150. Greenwich, CT: JAI Press.
35
Labianca, G., Fairbank, J.F., Thomas, J.B., Gioia, D.A. and Umphress, E.E. (2001) ‘Emulation in
Academia: Balancing Structure and Identity’, Organization Science, 12: 312-330.
Labianca, G., Gray, B. and Brass, D.J. (2000) ‘A Grounded Model of Organizational Schema
Change During Empowerment’, Organization Science, 11: 235-257.
Lant, T.K. (1992) Aspiration Level Adaptation: An Empirical Exploration. Management Science,
38: 623-644.
Lant, T.K. and Montgomery, D.B. (1987) ‘Learning from Strategic Success and Failure’, Journal
of Business Research, 15: 503-518.
Levinthal, D. A. and March, J. G. (1981) ‘A Model of Adaptive Organizational Search’, Journal
of Economic Behavior and Organization, 2: 307-333.
Levitt, B. and March, J. (1988). Organizational Learning. Annual Review of Sociology, 14: 319-
340.
Lin, C-H. and Tsai, C-C. (2006) ‘Comparisons and Advertising: The Route from Comparisons to
Effective Advertising’, Journal of Business and Psychology, 21 (1): 23-44.
Lumpkin, G.T. and Dess, G.G. (1996) ‘Clarifying the Entrepreneurial Orientation Construct and
Linking It to Performance’, Academy of Management Review, 21: 135-172.
March, J. and Shapira, Z. (1992). Variable Risk Preferences and the Focus of Attention.
Psychological Review, 99(1): 172-183.
March, James and Herbert Simon (1958). Organizations, New York: John Wiley.
Markus, H. and Nurius, P. (1986) ‘Possible Selves’, American Psychologist, 41: 954-969.
Martins, L.L. (2005) ‘A Model of the Effects of Reputational Rankings on Organizational
Change’, Organization Science, 16: 701-720.

36
McGrath, R.G. and MacMillan, I.C. (2000) The Entrepreneurial Mindset: Strategies for
Continuously Creating Opportunity in an Age of Uncertainty. Cambridge, MA: Harvard
Business School Press.
Meyer, John W., and Brian Rowan (1977) ’Institutionalized Organizations: Formal Structure as
Myth and Ceremony. American Journal of Sociology, 83: 340-363.
Mezias, S. J., Chen, Y-R. and Murphy, P. (2002) ‘Adaptive Aspirations in an American
Financial Services Organization: A Field Study’, Management Science, 48: 1285-1300.
Miller, D. and Chen, M.-J. (1994) ‘Sources and Consequences of Competitive Inertia: A Study
of the U.S. Airline Industry’, Administrative Science Quarterly, 39: 1-24.
Miller, D. and Friesen, P.H. (1984) Organizations: A Quantum View. Englewood Cliffs, NJ:
Prentice Hall.
Milliken, F. J. and T. K. Lant. 'The effect of an organization's recent performance history on
strategic persistence and change: The role of managerial interpretations'. In J. Dutton, A.
Huff, and P. Shrivastava (Eds.), Advances in Strategic Management, 7, JAI Press,
Greenwich, CT, 1991, pp. 125-152.
Nelson, R. R. and Winter, S. G. (1982) An Evolutionary Theory of Economic Change.
Cambridge, MA: Belknap Press of Harvard University Press.
Podsakoff, P.M., MacKenzie, S.B. and Lee, J-Y. (2003). Common Method Biases in Behavioral
Research: A Critical Review of the Literature and Recommended Remedies. Journal of
Applied Psychology, 88 (5): 879-903.
Porac, J. and Thomas, H. (1990) Taxonomic Mental Models in Competitor Definition. Academy
of Management Review, 15: 224-40.

37
Porac, J.F., Wade, J.B. and Pollock, T.G. 1999. Industry Categories and the Politics of the
Comparable Firm in CEO Compensation. Administrative Science Quarterly, 44 (1): 112-145.
Porac, J.F., Thomas, H., Wilson, F., Paton, D. and Kanfer, A. (1995) ‘Rivalry and the Industry
Model of Scottish Knitwear Producers’, Administrative Science Quarterly, 40: 203-227.
Reger, R. and Huff, A.S. (1993) ‘Strategic Groups: A Cognitive Perspective’, Strategic
Management Journal, 14: 103-24.
Reger, K.R. and Palmer, B.T. (1996) ‘Managerial Categorization of Competitors: Using Old
Maps to Navigate New Environments’, Organization Science, 7: 22-39.
Ruvulo, A. P. and Markus, H. R. (1992) ‘Possible Selves and Performance: The Power of
Relevant Self-Imagery’, Social Cognition, 10: 95-124.
Shimizu, K. (2007) ‘Prospect Theory, Behavioral Theory, and the Threat-Rigidity Thesis:
Combinative Effects on Organizational Decisions to Divest Formerly Acquired Units’,
Academy of Management Journal, 50: 1495-1514.
Schumpeter, J.A. (1947). The Creative Response in Economic History. The Journal of Economic
History, 7 (2): 149-159.
Singh, J.V. (1986) ‘Performance, Slack, and Risk Taking in Organizational Decision Making’,
Academy of Management Journal, 29: 562-585.
Zellner, A. (1962) ‘An Efficient Method of Estimating Seemingly Unrelated Regressions and
Tests for Aggregation Bias’, Journal of the American Statistical Association, 57: 348-368.
38
TABLE 1
Descriptive Statistics and Correlations
Mean Std.Dev. 1 2 3 4 5 6 7 8 9 10 11
1 Planned change type 2.78 0.80 1
2 Planned change extent 3.24 0.75 0.6062* 1
3 Ownership 1.32 0.47 0.0662 0.0833 1
4 Organizational size 2315.68 1813.20 0.1742* 0.1922* -0.2550* 1
5 University Type 4.01 1.58 0.1631* 0.1255 -0.1526 0.3560* 1
6 Geographic Region 0.84 1.51 -0.0673 0.0381 -0.0318 -0.064 0.0886* 1
7 Organizational Reputation (undergraduate program) 2.02 1.11 0.0001 -0.0239 -0.085 0.3499* 0.2341* -0.6019* 1
8 Organizational Reputation (graduate programs) 1.66 1.22 0.1497 0.0282 -0.0309 0.2108* 0.4880* -0.3917* 0.6622* 1
9 Competitive Discrepancy (cd) 0.00 1.00 -0.0983 0.1099 -0.0901 0.0862 -0.027 -0.0311 0.1583 -0.0225 1
10 Aspiration Discrepancy (ad) 0.00 1.00 -0.0131 0.0929 -0.0052 0.3024* 0.4127* 0.1456 0.2471* 0.3313* 0.2016* 1
11 Interaction (cd x ad) 0.20 1.45 -0.0104 0.0563 -0.0227 -0.0454 0.1317 0.0152 0.2181* 0.1166 0.0692 0.2035* 1
* significant at 5%
39
TABLE 2
Seemingly Unrelated Regressions Model for
Planned Change Type and Planned Change Extent
DV: Planned Change Type
DV: Planned Change
Extent
Independent Variables Model 1 Model 2 Model 3 Model 4
Ownership -0.535** -0.384** -0.578** -0.415**
(0.108) (0.071) (0.100) (0.066)
Organizational size 0.062 0.489 -0.234 0.281
(0.465) (0.308) (0.435) (0.285)
University Type 0.435** -0.530** 0.511** -0.477**
(0.101) (0.067) (0.095) (0.062)
Geographic Region -0.370** -0.197** -0.467** -0.264**
(0.114) (0.076) (0.108) (0.071)
Organizational Reputation (undergraduate
program) -1.448** -1.354** -0.838* -0.926**
(0.427) (0.283) (0.416) (0.273)
Organizational Reputation (graduate programs) -0.385 -0.462 0.156 -0.083
(0.473) (0.313) (0.452) (0.296)
Competitive Discrepancy (cd) 0.538** 0.673** 0.299** 0.394**
(0.141) (0.134) (0.094) (0.088)
Striving Discrepancy (ad) 0.815** 0.440** 0.958** 0.695**
(0.118) (0.135) (0.078) (0.089)
Interaction (cd x ad) -0.519** -0.364**
(0.110) (0.072)
Constant 3.395** 4.439** 3.035** 4.186**
(0.247) (0.164) (0.241) (0.158)
Observations 131 131 131 131
R-squared 0.63 0.68 0.86 0.88
Standard errors in parentheses
* significant at 5%; ** significant at 1%
40
FIGURE 1
Interaction between Competitive Discrepancy and Aspiration Discrepancy in
Explaining Planned Change Type

41
FIGURE 2
Interaction between Competitive Discrepancy and Aspiration Discrepancy in
Explaining Planned Change Extent
42
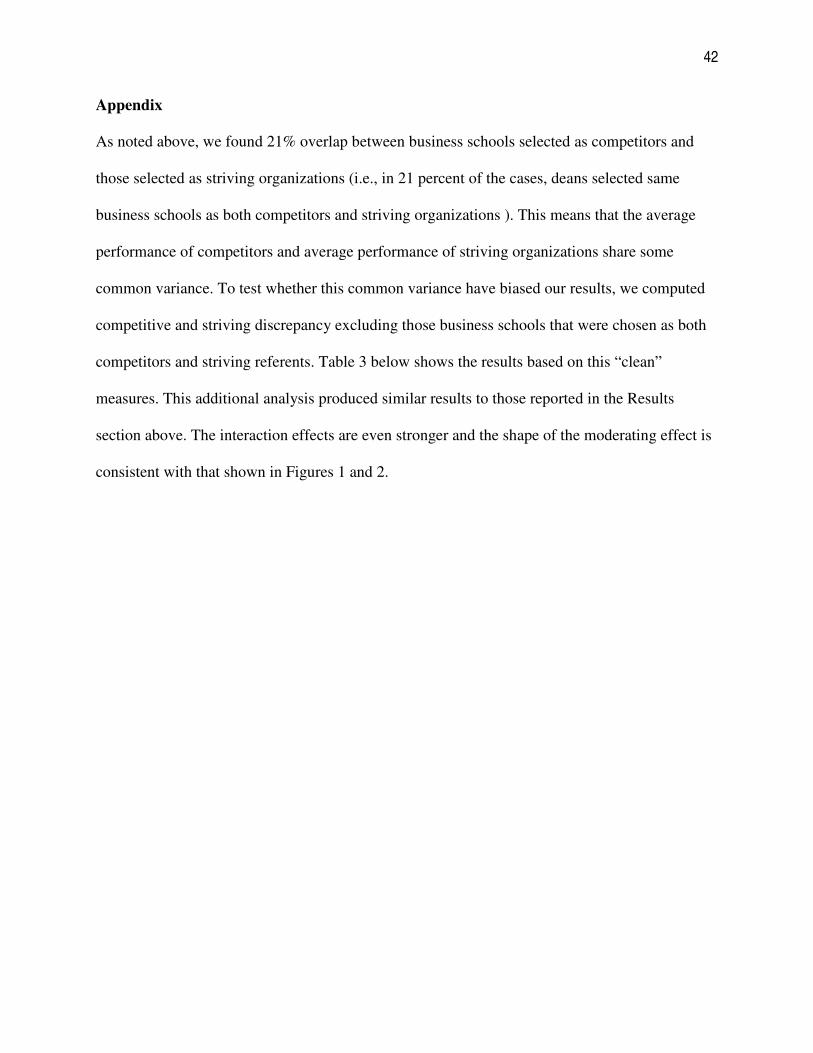
Appendix
As noted above, we found 21% overlap between business schools selected as competitors and
those selected as striving organizations (i.e., in 21 percent of the cases, deans selected same
business schools as both competitors and striving organizations ). This means that the average
performance of competitors and average performance of striving organizations share some
common variance. To test whether this common variance have biased our results, we computed
competitive and striving discrepancy excluding those business schools that were chosen as both
competitors and striving referents. Table 3 below shows the results based on this “clean”
measures. This additional analysis produced similar results to those reported in the Results
section above. The interaction effects are even stronger and the shape of the moderating effect is
consistent with that shown in Figures 1 and 2.

43
TABLE 3
Seemingly Unrelated Regressions Model for
Planned Change Type and Planned Change Extent without Overlap
Independent Variables Model 1 Model 2 Model 3 Model 4
Ownership -0.472** -0.638** -0.224** -0.335**
(0.106) (0.090) (0.076) (0.067)
Organizational size 0.055 0.106 0.531 0.565+
(0.473) (0.391) (0.340) (0.290)
University Type 0.321** 0.503** -0.652** -0.530**
(0.094) (0.081) (0.068) (0.060)
Geographic Region -0.392** -0.321** -0.083 -0.036
(0.092) (0.077) (0.066) (0.057)
Organizational Reputation (undergraduate program) 0.38 -0.077 0.35 0.044
(0.417) (0.350) (0.300) (0.259)
Organizational Reputation (graduate programs) 0.45 -0.008 0.419 0.112
(0.560) (0.466) (0.403) (0.346)
Competitive Discrepancy (cd) 1.182** 1.761** 0.998** 1.386**
(0.229) (0.204) (0.165) (0.151)
Aspiration Discrepancy (ad) 0.737** 1.027** 0.758** 0.952**
(0.103) (0.093) (0.074) (0.069)
Interaction (cd x ad) -1.832** -1.227**
(0.237) (0.176)
Constant 2.052** 2.069** 3.047** 3.058**
(0.312) (0.258) (0.224) (0.191)
Observations 128 128 128 128
"R-squared" 0.63 0.75 0.84 0.88
Standard errors in parentheses
+ significant at 10%; * significant at 5%; ** significant at 1%
DV: Planned
Change Type
DV: Planned
Change Extent
44
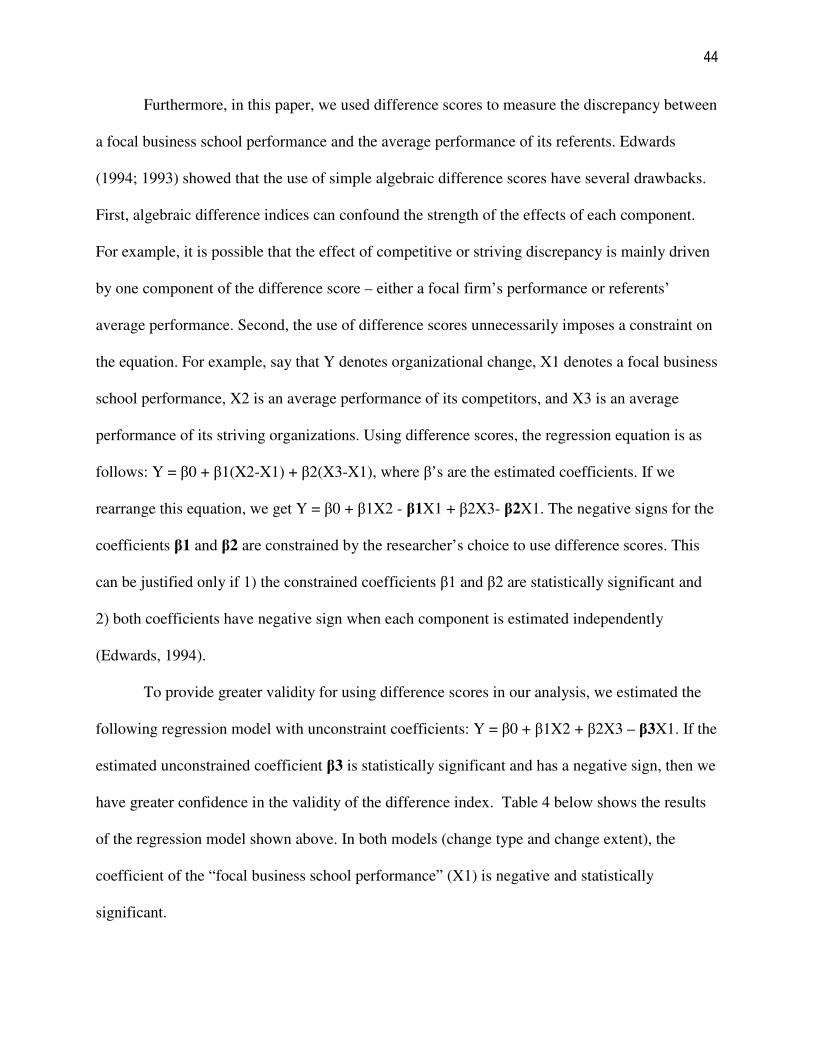
Furthermore, in this paper, we used difference scores to measure the discrepancy between
a focal business school performance and the average performance of its referents. Edwards
(1994; 1993) showed that the use of simple algebraic difference scores have several drawbacks.
First, algebraic difference indices can confound the strength of the effects of each component.
For example, it is possible that the effect of competitive or striving discrepancy is mainly driven
by one component of the difference score – either a focal firm’s performance or referents’
average performance. Second, the use of difference scores unnecessarily imposes a constraint on
the equation. For example, say that Y denotes organizational change, X1 denotes a focal business
school performance, X2 is an average performance of its competitors, and X3 is an average
performance of its striving organizations. Using difference scores, the regression equation is as
follows: Y = β0 + β1(X2-X1) + β2(X3-X1), where β’s are the estimated coefficients. If we
rearrange this equation, we get Y = β0 + β1X2 - β1X1 + β2X3- β2X1. The negative signs for the
coefficients β1 and β2 are constrained by the researcher’s choice to use difference scores. This
can be justified only if 1) the constrained coefficients β1 and β2 are statistically significant and
2) both coefficients have negative sign when each component is estimated independently
(Edwards, 1994).
To provide greater validity for using difference scores in our analysis, we estimated the
following regression model with unconstraint coefficients: Y = β0 + β1X2 + β2X3 – β3X1. If the
estimated unconstrained coefficient β3 is statistically significant and has a negative sign, then we
have greater confidence in the validity of the difference index. Table 4 below shows the results
of the regression model shown above. In both models (change type and change extent), the
coefficient of the “focal business school performance” (X1) is negative and statistically
significant.
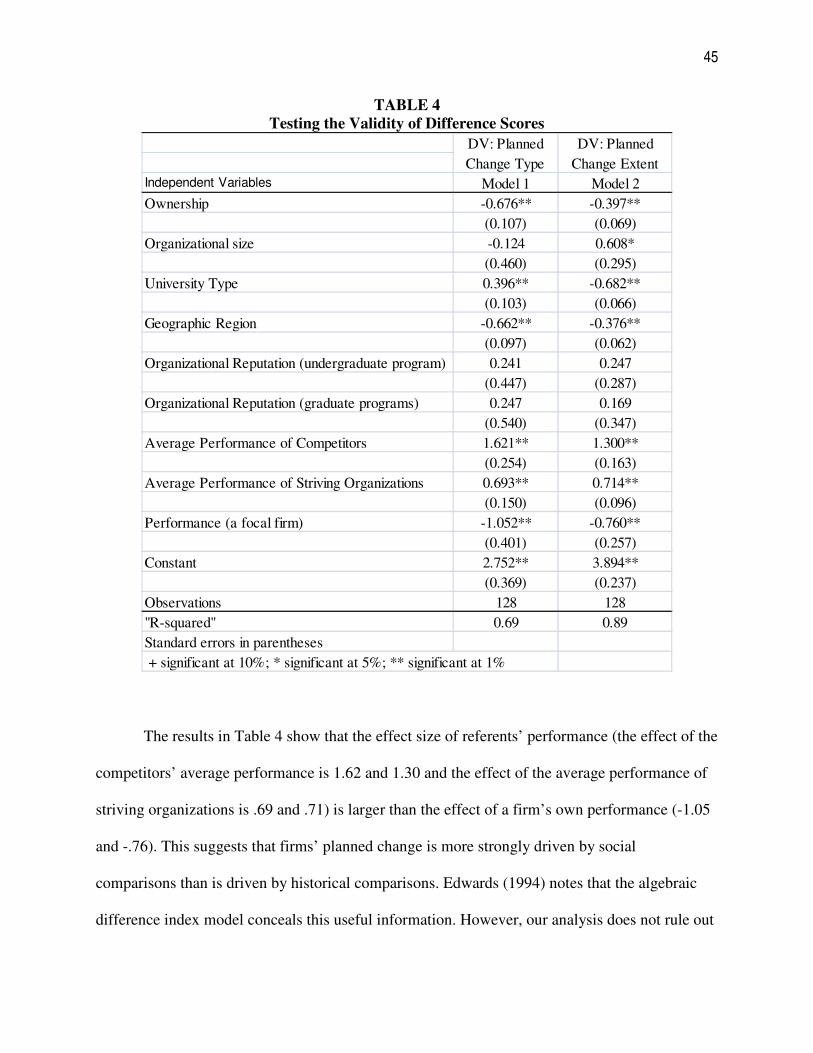
45
TABLE 4
Testing the Validity of Difference Scores
Independent Variables Model 1 Model 2
Ownership -0.676** -0.397**
(0.107) (0.069)
Organizational size -0.124 0.608*
(0.460) (0.295)
University Type 0.396** -0.682**
(0.103) (0.066)
Geographic Region -0.662** -0.376**
(0.097) (0.062)
Organizational Reputation (undergraduate program) 0.241 0.247
(0.447) (0.287)
Organizational Reputation (graduate programs) 0.247 0.169
(0.540) (0.347)
Average Performance of Competitors 1.621** 1.300**
(0.254) (0.163)
Average Performance of Striving Organizations 0.693** 0.714**
(0.150) (0.096)
Performance (a focal firm) -1.052** -0.760**
(0.401) (0.257)
Constant 2.752** 3.894**
(0.369) (0.237)
Observations 128 128
"R-squared" 0.69 0.89
Standard errors in parentheses
+ significant at 10%; * significant at 5%; ** significant at 1%
DV: Planned
Change Type
DV: Planned
Change Extent
The results in Table 4 show that the effect size of referents’ performance (the effect of the
competitors’ average performance is 1.62 and 1.30 and the effect of the average performance of
striving organizations is .69 and .71) is larger than the effect of a firm’s own performance (-1.05
and -.76). This suggests that firms’ planned change is more strongly driven by social
comparisons than is driven by historical comparisons. Edwards (1994) notes that the algebraic
difference index model conceals this useful information. However, our analysis does not rule out
46
the possibility that the unequal effects are because the two components have unequal variances.
Unequal variances should be expected in our case because the referents’ performance is based on
multiple items (several business schools’ performances), whereas a focal firm’s performance is
one item score. Thus, future research is needed to derive more reliable conclusions about
whether social comparisons are stronger driver of change than are historical comparisons (with a
firm’s own performance). Nevertheless, our results show that both types of comparisons are
relevant for predicting organizational change as both coefficients are statistically significant.
Edwards (1994) also recommends tests for higher order models to examine whether the
underlying structure is a more complex than a simple plane implied by the difference score
model. However, he also notes that such exploratory analysis should proceed “if no specific
model is identified a priori” (Edwards, 1994: 74). First, it is clear that in our case the difference
scores model is well-established in prior literature. Second, the alternative models proposed by
Edwards, such as squared difference or absolute difference models, are clearly inadequate for
testing performance-feedback model of organizational change. Both squared difference index
and absolute difference index assume that the positive and the negative scores have the same
effect on organizational change (i.e., they are directionless measures). This is contrary to the
theoretical underpinnings of the performance-feedback model. In fact, prior research has shown
that the relationship between performance discrepancy and organizational change is different at
above and below the performance level of referents. In addition, our findings also suggests that
as competitive discrepancy (competitors’ performance minus a focal firm’s performance)
increases (and the scores increase and become positive), the motivation for organizational
change increases, whereas when competitive discrepancy decreases (and the scores become
47
negative), the motivation for change decreases (indeed, unless a firm also have high striving
discrepancy).
Finally, note that we followed Edwards (1994) only to provide support for the validity for
using difference scores in our analysis. We do not use polynomial regression analysis to test our
hypotheses. This is because it is difficult to meaningfully interpret the moderating effects using
polynomial regression equations. To illustrate, we test in this paper the following model: Y = β0
+ β1(X2-X1) + β2(X3-X1) + β3(X2-X1) (X3-X1) + controls + ε, where X1 is a focal firm’s
performance, X2 is average performance of competitors, X3 is average performance of striving
organizations. If we follow Edwards (1994) procedure we should test the following model: Y =
β0 + β1X2 + β2X3 – β3X1 + β4X1^2 + β5X2X3 - β6X1X2 – β7X1X3 (to test a higher order
models, we would also need to add squared terms for each component). This procedure not only
significantly reduces the degrees of freedom (and thus increases type 2 error), but also makes it
extremely complex and difficult to interpret the form of the interaction effects. We encourage
future research to examine how the three dimensional surface based on the following three
dimensions: X1, X2 and Y will change at different levels of X3.