Stripped image of the gravity field of the Carpathian...
11
GEOLOGICA CARPATHICA, JUNE 2008, 59, 3, 199—209 www.geologicacarpathica.sk Stripped image of the gravity field of the Carpathian- Pannonian region based on the combined interpretation of the CELEBRATION 2000 data ZUZANA ALASONATI TAŠÁROVÁ 1 , MIROSLAV BIELIK 2, 3 and HANS-JÜRGEN GÖTZE 1 1 Institut für Geowissenschaften, Christian-Albrechts-Universität zu Kiel, Geophysik, Otto-Hahn-Platz 1, D-24118 Kiel, Germany; [email protected] 2 Department of Applied and Environmental Geophysics, Faculty of Natural Sciences, Mlynská dolina, Bratislava, Slovak Republic; [email protected] 3 Geophysical Institute of the Slovak Academy of Sciences, Dúbravská cesta 9, Bratislava, Slovak Republic; [email protected] (Manuscript received August 15, 2007; accepted in revised form December 13, 2007) Abstract: The Carpathian-Pannonian region is one of the areas of Central Europe with good coverage of geophysical and geological data. This is due to its complicated evolution that attracted scientific interest already in the past. In addition, several international seismic experiments were conducted here in the last 10 years. The model to be presented uses most of these available data to perform a combined gravity—seismic interpretation. The analysis of the gravity anomalies is performed in order to identify the sources of the anomalies, separate their effects and localize the lithos- pheric inhomogeneities. The gravity stripped image of the region reveals significant differences in the nature of the Microplates ALCAPA and Tisza-Dacia from the surrounding regions. Key words: Carpathian-Pannonian region, Bouguer anomaly, 3-D density modelling, interpretation of the gravity field, lithospheric structure. Introduction The Carpathian Mountain belt, extending over 1300 km, is surrounded by the Pannonian Basin System, Eastern Alps, Bo- hemian Massif, Trans-European Suture Zone (TESZ) and the south-western part of the Precambrian East European Craton (EEC) (Fennosarmatian Craton). The present structural pattern of the Carpathians was formed by the Late Jurassic to Tertiary subduction-collision orogenic processes in the Tethyan mo- bile belt between the stable European Platform in the NE and the Apulia/Adria-related continental blocks (ALCAPA and Tisza-Dacia) drifting from the SW (e.g. Kováč 2000). Recently, several international seismic refraction experi- ments (POLONAISE’97, CELEBRATION 2000, ALP 2002, SUDETES 2003), aimed at investigation of the lithospheric structure in this area, have been performed (e.g. Guterch et al. 2003a). The work presented uses most of these data to perform a combined gravity and seismic 3-D modelling. For this pur- pose, complete Bouguer anomaly newly compiled (Bielik et al. 2006) was used for the forward modelling by means of the Interactive Gravity and Magnetic System (IGMAS) (e.g. Götze 1976; Götze & Lahmeyer 1988). All additional geolog- ical and geophysical data available were combined into a 3-D structural image of the Western Carpathians and Pannonian Basin. It is impossible, however, to perform 3-D modelling of the Carpathian-Pannonian region without including the sur- rounding units. Therefore, this large-scale lithospheric mod- el also comprises the TESZ, EEC, Bohemian Massif and Eastern Alps. It extends down to a depth of 220 km and is developed along 31 parallel cross-sections cutting the above named units. Geological setting The East European Craton (EEC), formed during the Pre- cambrian, is composed of Proterozoic igneous and metamor- phic rocks covered by Vendian and Paleozoic strata (Dadlez et al. 2005). It is divided from the younger Paleozoic platform to the SW by the Trans-European Suture Zone (TESZ). The TESZ is a broad (up to 200 km) zone, crossing Europe from the North Sea to the Black Sea. The north-eastern boundary of the TESZ in Poland is the fault zone, called the Teisseyere- Tornquist-Zone (TTZ) (Dadlez et al. 2005 and references therein). In Poland, the TESZ consists of several suspected ter- ranes accreted to the south-western margin of the EEC during the Paleozoic (e.g. Winchester et al. 2002; Guterch & Grad 2006). These terranes are referred to as Bruno-Silesian (called also Upper-Silesia), Małopolska and Łysogóry blocks. The latter two are exposed in SE Poland in the Holy Cross Moun- tains (HCM) and are separated by the Holy Cross Fault. The SW part of the HCM belongs to the marginal parts of the Małopolska block (Kielce Unit) and the NE part of the HCM belongs to the Łysogóry block (Łysogóry Unit) (e.g. Schätz et al. 2006). Both blocks are interpreted as Baltica derived ter- ranes (e.g. Malinowski et al. 2005; Janik et al. 2005). The Bruno-Silesian block seems to differ from the Małopolska. These two units have different stratigraphic development and are separated by a 500 m wide zone, referred to as the
Transcript of Stripped image of the gravity field of the Carpathian...

GEOLOGICA CARPATHICA, JUNE 2008, 59, 3, 199—209
www.geologicacarpathica.sk
Stripped image of the gravity field of the Carpathian-Pannonian region based on the combined interpretation
of the CELEBRATION 2000 data
ZUZANA ALASONATI TAŠÁROVÁ1, MIROSLAV BIELIK2, 3 and HANS-JÜRGEN GÖTZE1
1Institut für Geowissenschaften, Christian-Albrechts-Universität zu Kiel, Geophysik, Otto-Hahn-Platz 1, D-24118 Kiel, Germany;[email protected]
2Department of Applied and Environmental Geophysics, Faculty of Natural Sciences, Mlynská dolina, Bratislava, Slovak Republic;[email protected]
3Geophysical Institute of the Slovak Academy of Sciences, Dúbravská cesta 9, Bratislava, Slovak Republic; [email protected]
(Manuscript received August 15, 2007; accepted in revised form December 13, 2007)
Abstract: The Carpathian-Pannonian region is one of the areas of Central Europe with good coverage of geophysicaland geological data. This is due to its complicated evolution that attracted scientific interest already in the past. Inaddition, several international seismic experiments were conducted here in the last 10 years. The model to be presenteduses most of these available data to perform a combined gravity—seismic interpretation. The analysis of the gravityanomalies is performed in order to identify the sources of the anomalies, separate their effects and localize the lithos-pheric inhomogeneities. The gravity stripped image of the region reveals significant differences in the nature of theMicroplates ALCAPA and Tisza-Dacia from the surrounding regions.
Key words: Carpathian-Pannonian region, Bouguer anomaly, 3-D density modelling, interpretation of the gravity field,lithospheric structure.
Introduction
The Carpathian Mountain belt, extending over 1300 km, issurrounded by the Pannonian Basin System, Eastern Alps, Bo-hemian Massif, Trans-European Suture Zone (TESZ) and thesouth-western part of the Precambrian East European Craton(EEC) (Fennosarmatian Craton). The present structural patternof the Carpathians was formed by the Late Jurassic to Tertiarysubduction-collision orogenic processes in the Tethyan mo-bile belt between the stable European Platform in the NE andthe Apulia/Adria-related continental blocks (ALCAPA andTisza-Dacia) drifting from the SW (e.g. Kováč 2000).
Recently, several international seismic refraction experi-ments (POLONAISE’97, CELEBRATION 2000, ALP 2002,SUDETES 2003), aimed at investigation of the lithosphericstructure in this area, have been performed (e.g. Guterch etal. 2003a).
The work presented uses most of these data to perform acombined gravity and seismic 3-D modelling. For this pur-pose, complete Bouguer anomaly newly compiled (Bielik etal. 2006) was used for the forward modelling by means of theInteractive Gravity and Magnetic System (IGMAS) (e.g.Götze 1976; Götze & Lahmeyer 1988). All additional geolog-ical and geophysical data available were combined into a 3-Dstructural image of the Western Carpathians and PannonianBasin. It is impossible, however, to perform 3-D modelling ofthe Carpathian-Pannonian region without including the sur-rounding units. Therefore, this large-scale lithospheric mod-el also comprises the TESZ, EEC, Bohemian Massif andEastern Alps. It extends down to a depth of 220 km and is
developed along 31 parallel cross-sections cutting the abovenamed units.
Geological setting
The East European Craton (EEC), formed during the Pre-cambrian, is composed of Proterozoic igneous and metamor-phic rocks covered by Vendian and Paleozoic strata (Dadlez etal. 2005). It is divided from the younger Paleozoic platform tothe SW by the Trans-European Suture Zone (TESZ). TheTESZ is a broad (up to 200 km) zone, crossing Europe fromthe North Sea to the Black Sea. The north-eastern boundary ofthe TESZ in Poland is the fault zone, called the Teisseyere-Tornquist-Zone (TTZ) (Dadlez et al. 2005 and referencestherein). In Poland, the TESZ consists of several suspected ter-ranes accreted to the south-western margin of the EEC duringthe Paleozoic (e.g. Winchester et al. 2002; Guterch & Grad2006). These terranes are referred to as Bruno-Silesian (calledalso Upper-Silesia), Małopolska and Łysogóry blocks. Thelatter two are exposed in SE Poland in the Holy Cross Moun-tains (HCM) and are separated by the Holy Cross Fault. TheSW part of the HCM belongs to the marginal parts of theMałopolska block (Kielce Unit) and the NE part of the HCMbelongs to the Łysogóry block (Łysogóry Unit) (e.g. Schätz etal. 2006). Both blocks are interpreted as Baltica derived ter-ranes (e.g. Malinowski et al. 2005; Janik et al. 2005). TheBruno-Silesian block seems to differ from the Małopolska.These two units have different stratigraphic development andare separated by a 500 m wide zone, referred to as the
200 ALASONATI TAŠÁROVÁ, BIELIK and GÖTZE
Kraków-Lubliniec Zone (Buła et al. 1997). Hence the Bruno-Silesian block is interpreted as a fragment of Gondwana (e.g.Malinowski et al. 2005). However, some authors (e.g. Schätzet al. 2006 and references therein) interpreted all three terranesas exotic terranes of Gondwanan provenance.
The Bohemian Massif, forming the easternmost part of theVariscan belt, is the largest stable outcrop of pre-Permianrocks in Western Europe. It consists mainly of metamorphicrocks, granites, and subordinate fossiliferous Paleozoic rocks(Hrubcová et al. 2005 and references therein).
The Western Carpathians belong to the ALCAPA micro-plate (e.g. Kováč 2000), which reaches the Pieniny KlippenBelt (PKB) in the north, and the Tisza-Dacia microplate in thesouth. The ALCAPA microplate is thrusted over the Tisza-Da-cia microplate along the Mid-Hungarian Line, which is a Ter-tiary strike-slip fault zone (e.g. Plašienka et al. 1997). TheWestern Carpathians comprise, from north to south: the OuterWestern Carpathians, Pieniny Klippen Belt (PKB) and theCentral Western Carpathians. The Carpathian Foredeep is lo-cated in front of the Outer Carpathians along the entire Car-pathian orogen (Fig. 1).
The Pannonian Basin System (PBS) was formed as a back-arc system due to the lithospheric extension and mantle up-welling behind the Carpathian arc during two stages (e.g. Hor-
váth 1993; Kováč 2000). The driving mechanism for the ex-tension is thought to be, traditionally, the subduction roll-backof the European Platform (e.g. Royden et al. 1983; Konečný etal. 2002; Szabó et al. 2004). The PBS is filled with Tertiaryand Quaternary strata that reach, in some places, more than6 km (e.g. Kováč 2000; Makarenko et al. 2002).
Review of results of the previous geophysicalinvestigations
The former geophysical investigations provided informa-tion on the crustal thickness, revealing the crust-mantleboundary (Moho) to be very shallow in the Pannonian Basin.The Moho deepens towards the Carpathians to the north andeast, as well as towards the Bohemian Massif and the EasternAlps in the west (e.g. Horváth 1993; Šefara et al. 1996). Simi-larly to the Moho, also the lithosphere-asthenosphere bound-ary (LAB) in the Pannonian Basin region is very shallow. Ac-cording to the seismological data, magnetotelluric soundingand geothermal measurements (e.g. Babuška et al. 1987; Prauset al. 1990; Horváth 1993; Čermák 1994), the lithosphere-as-thenosphere boundary in the Pannonian Basin is at depths of60 to 80 km. More recent data based on the 2-D integrated
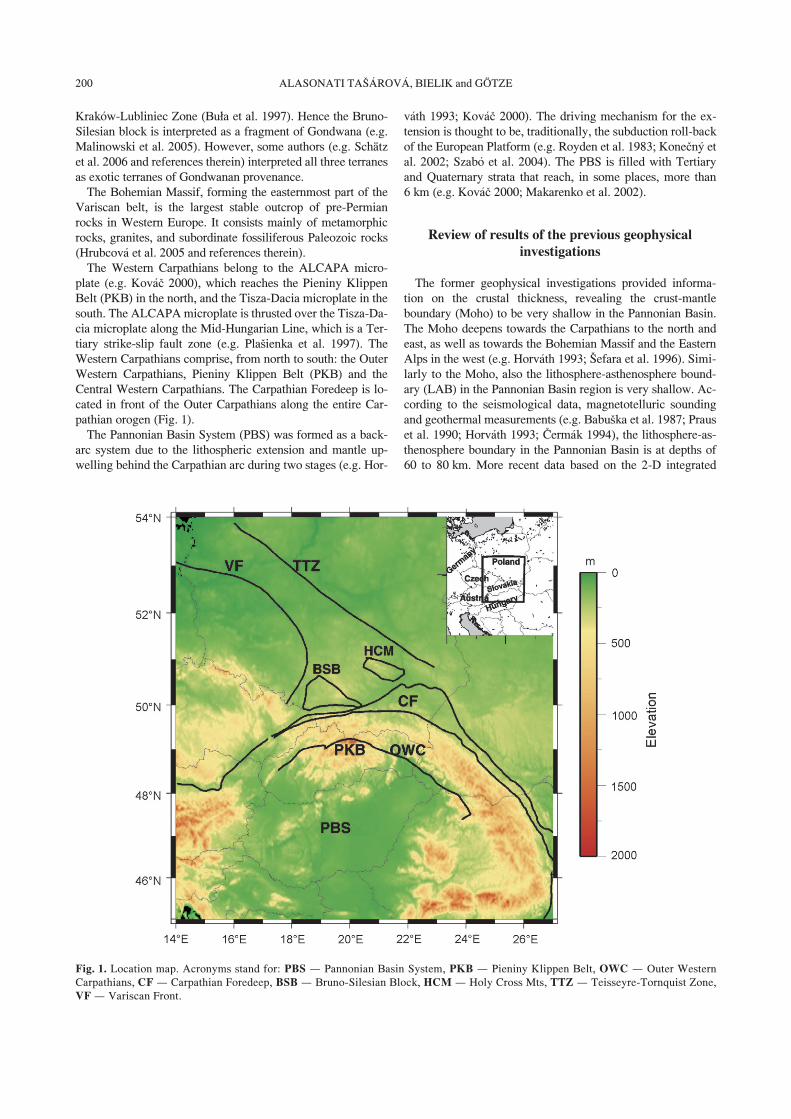
Fig. 1. Location map. Acronyms stand for: PBS – Pannonian Basin System, PKB – Pieniny Klippen Belt, OWC – Outer WesternCarpathians, CF – Carpathian Foredeep, BSB – Bruno-Silesian Block, HCM – Holy Cross Mts, TTZ – Teisseyre-Tornquist Zone,VF – Variscan Front.

201GRAVITY FIELD OF THE CARPATHIAN-PANNONIAN REGION BASED ON CELEBRATION 2000 DATA
modelling combining the heat flow density distribution, abso-lute topographic elevation, gravity data and geoid (Zeyen etal. 2002; Dérerová et al. 2006) show the Pannonian BasinLAB to be at a depth of 80 km. The S-wave receiver functionmethod reveals that the LAB in the northern edge of the Pan-nonian Basin is at a depth of 75 km (Geissler et al. 2007). Pet-rological analysis of the upper mantle xenoliths also confirmsthat a significant mantle uplift (50—60 km) occurred beneaththe Pannonian Basin (Falus et al. 2000). Additionally, accord-ing to the global thermal model for the continental lithosphereof Artemieva (2006), the lithosphere of the Pannonian Basinregion is 50 to 100 km thick.
Maps of heat flow density distribution show a clear differ-ence between the Pannonian Basin System and the surround-ing units. While the Bohemian Massif, Carpathian Mountainsand the European Platform are characterized by medium val-ues of 40 to 70 mW/m2, the heat flow in the PBS reaches 80—130 mW/m2. Higher heat flow values of 80—100 mW/m2 oc-
cur partly also in the Eastern Alps (e.g. Pollack et al. 1993;Čermák 1994; Lenkey et al. 2002).
The region of Central Europe is also well covered bygravimetric and magnetic measurements. The Bougueranomaly used in this work was compiled based on the na-tionally acquired data of Slovakia, Poland, Hungary, theCzech Republic and Austria by Bielik et al. (2006). TheBouguer anomalies are characterized by low values of some—20 to —65 mGal (1 mGal=1×10—5 m/s2) along the WesternCarpathians (Central and Outer) and drop down to less than—120 mGal above the Eastern Alps and the Eastern Car-pathians. The Pannonian Basin, Bruno-Silesian block andso-called Małopolska High in southern Poland, have positivevalues of 0—20 mGal (Fig. 2). The Małopolska High (e.g.Grabowska & Bojdys 2001 and references therein) has twoparts, distinctive also in the Bouguer gravity anomaly. TheNE part, located on the south-western edge of the EEC iscalled the Lublin High. The SW part belongs to the
Fig. 2. Bouguer anomaly modified after Bielik et al. (2006). Acronyms stand for: PBS – Pannonian Basin System, PKB – Pieniny Klip-pen Belt, OWC – Outer Western Carpathians, CF – Carpathian Foredeep, BSB – Bruno-Silesian Block, HCM – Holy Cross Mts,TTZ – Teisseyre-Tornquist Zone, VF – Variscan Front. The Małopolska High, stretching from the HCM to the southern edge of theEEC, is separated by the TTZ into two parts. The Kolárovo gravity high (KGH) is marked by a circle. The location of the cross-sections of the3-D model (thin grey lines) and of the CELEBRATION 2000 experiment (thick black lines) are also shown (upper right corner).
202 ALASONATI TAŠÁROVÁ, BIELIK and GÖTZE
Łysogóry and Małopolska blocks and partly overlaps withthe Holy Cross Mts (HCM, Fig. 2).
The station complete Bouguer gravity anomaly is tied to theIGSN71 datum (e.g. Torge 1989). However, although this da-tum has been conventional for more than 30 years, someworks (e.g. Grabowska & Bojdys 2001; Malinowski et al.2005; Janik et al. 2005) still use data in the Potsdam GravitySystem, shifted with respect to the IGSN71 by ~14 mGal. Forthis reason, their values of the Bouguer gravity anomaly in Po-land are higher than those shown here in Figs. 2 and 3.
Constraining data and indirect densitydetermination
The large-scale international Central European Lithospher-ic Experiment based on Refraction (CELEBRATION 2000)was conducted in June 2000, as a joint experiment of 28 insti-tutions in Europe and North America (Guterch et al. 2003b).The data were collected along ~17 profiles, giving a totallength of 8,900 km. So far, 7 of these profiles have been pro-cessed and published. These are profiles CEL01, CEL02,CEL03, CEL04, CEL05, CEL09 and CEL10 (Fig. 2) (Mali-nowksi et al. 2005; Janik et al. 2005; Hrubcová et al. 2005;Środa et al. 2006; Grad et al. 2006 and Růžek et al. 2007). TheCELEBRATION data together with the results of the previousinvestigations of the region (e.g. Bielik et al. 2004 and refer-ences therein) and information from 2-D integrated modellingof Dérerová et al. (2006) were the primary input for the 3-Dmodelling performed within this study. All of these data con-strain the geometry of the structures modelled (the depth tomajor boundaries, such as sediments, Moho, lithosphere-as-thenosphere boundary). In addition, the P-wave seismic veloc-ities from the CELEBRATION 2000 experiment were con-verted into densities using the empirical relationships ofChristensen & Mooney (1995) and Sobolev & Babeyko(1994).
There are significant differences reaching 0.05—0.13 Mg/m3
(1 Mg/m3=1 g/cm3=1000 kg/m3) in the calculated densityvalues obtained from the two empirical relationships (Ta-ble 1). Thus, there is a wide range of densities correspondingto the observed seismic velocities. Additionally, the empiricalvelocity-density curves, or linear relationships, provide only amean density of a particular rock unit, which internally maybe quite variable. It has been demonstrated by various studies(e.g. Hacker & Abers 2004) that both velocities and densitiesstrongly depend on the composition of rocks. Thus, rocks withsimilar velocities may have significantly different densitiesand vice versa. The determination of densities based only on avelocity-density relationship is hence one of the major prob-lems related to developing combined gravity and seismicmodels. Therefore, all information related to the compositionof the structures modelled should be considered while gravitymodelling is performed. However, a density model always ap-proximates the real structures in a simplified way, with largerunits extending sometimes over tens of kilometers (in distanceand depth). These units are usually characterized by a single(constant) density value. For this reason, although a signifi-cant scatter around the mean value is associated with empiri-
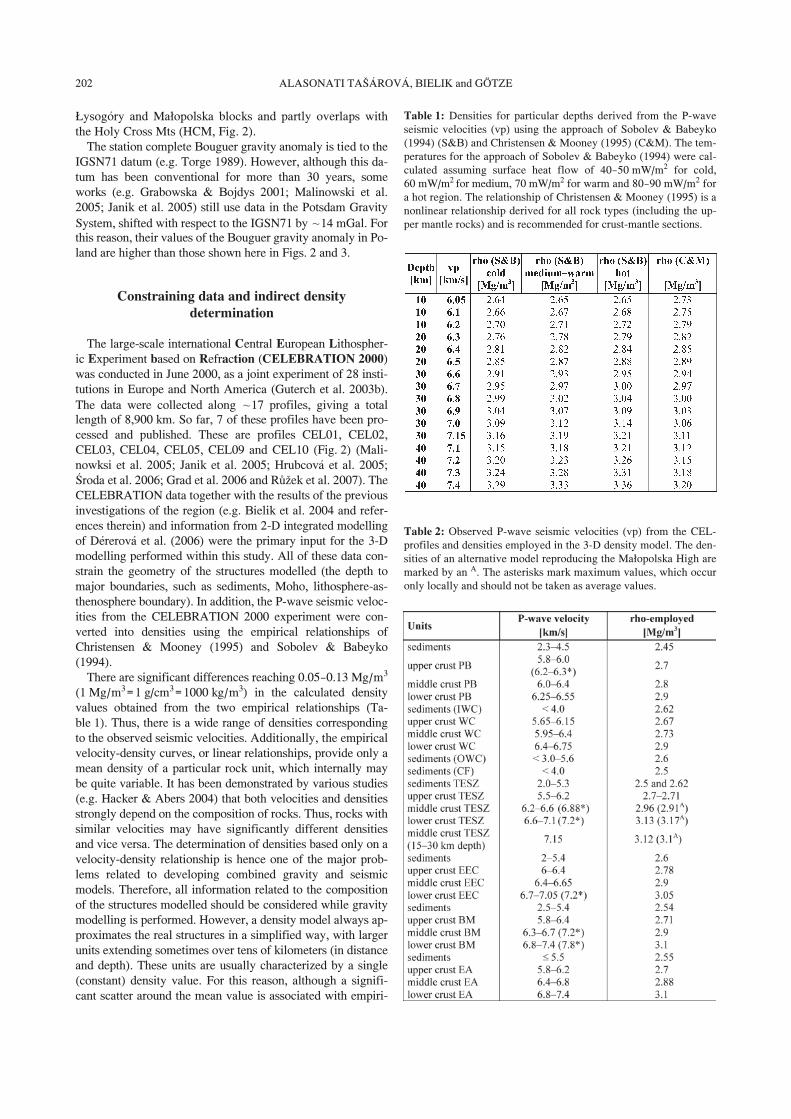
Table 1: Densities for particular depths derived from the P-waveseismic velocities (vp) using the approach of Sobolev & Babeyko(1994) (S&B) and Christensen & Mooney (1995) (C&M). The tem-peratures for the approach of Sobolev & Babeyko (1994) were cal-culated assuming surface heat flow of 40—50 mW/m2 for cold,60 mW/m2 for medium, 70 mW/m2 for warm and 80—90 mW/m2 fora hot region. The relationship of Christensen & Mooney (1995) is anonlinear relationship derived for all rock types (including the up-per mantle rocks) and is recommended for crust-mantle sections.
Table 2: Observed P-wave seismic velocities (vp) from the CEL-profiles and densities employed in the 3-D density model. The den-sities of an alternative model reproducing the Małopolska High aremarked by an A. The asterisks mark maximum values, which occuronly locally and should not be taken as average values.
203GRAVITY FIELD OF THE CARPATHIAN-PANNONIAN REGION BASED ON CELEBRATION 2000 DATA
cal velocity-density relationships (Barton 1986 and referencestherein), they may be applied to larger-scale lithospheric mod-els. Moreover, existing seismic models or boreholes also con-strain the depth to the major boundaries, such as sedimentarybasins and the Moho. The structures modelled are, therefore, atrade-off between the seismic models (extent of the structuresand their velocities) and gravity anomalies.
The relationship of Sobolev & Babeyko (1994) requires P/Tconditions in order to calculate the in situ densities from theseismic velocities. This is very convenient for the modellingof Central Europe because here the various units are character-ized by extremely different temperature conditions. Therefore,this relationship was found more appropriate for the determi-nation of densities from seismic velocities. The temperaturesat various depths are calculated on the basis of the known sur-face heat flow values (Pollack et al. 1993; Majorowicz et al.2003) according to the heat conduction equation (e.g. Turcotte& Schubert 2002). In situ pressure is estimated as a functionof depth, standard density and overpressure factor.
The summary of the observed P-wave velocities (Table 2)shows significant differences between the units considered inthe model (the Western Carpathians, Pannonian Basin, Bohe-mian Massif, TESZ, EEC and Eastern Alps).
Discrepancies in the interpretation of theCELEBRATION 2000 data
The crustal root of more than 50 km in the TESZ area inter-preted by Guterch et al. (1986) and shown also in the maps ofthe Moho depth of Bielik (1999 and references therein) wasnot approved by the CELEBRATION results (e.g. Dadlez etal. 2005; Guterch & Grad 2006). Moreover, there are alsosome discrepancies among the CELEBRATION profilesthemselves, since 3-D seismic interpretation has not yet beenperformed and all of the above mentioned CEL-profiles wereprocessed in 2-D. The most significant differences (exceedingthe errors estimated) occur at the intersection points of the fol-lowing profiles:
– CEL01 and CEL02: thickness of sediments differ by2 km, the thickness of the upper crust and its velocity by 3—4 km and 0.35 km/s, respectively.
– CEL01 and CEL03: velocity at 15 km depth differs by0.68—0.88 km/s.
– CEL01 and CEL04: the upper-crustal velocity is differ-ent by 0.15 km/s and the depth to the interface between theupper and middle crust differs by at least 1 km; the depth tothe Moho varies by 3 km.
– CEL02 and CEL03: the lower-crustal high-velocity bodyis located at different depths, causing a velocity-difference of~0.3 km/s at depths of 30—40 km.
– CEL02 and CEL04: the depth to the boundary betweenthe upper and middle crust and to the Moho differs by 2 km.
– CEL03 and CEL05: the thickness of the sediments variesby 6 km and the velocities at ~10 km depth are different by0.5 km/s and 0.15 km/s.
– CEL04 and CEL10: the velocities in the upper and lowercrust differ by 0.2 and 0.3 km/s, respectively; the difference tothe depth of the Moho is 4 km.
Due to these discrepancies, we believe a 3-D approach us-ing these data as constraining information is very useful in or-der to bring more insights into the structural image of the area.
Density modelling
The 3-D modelling is performed using IGMAS, where themodelled geological bodies are approximated by polyhedra ofconstant density (e.g. Götze 1976). The structures are definedalong 2-D cross-sections that are connected via triangulationinto a 3-D volume. Thus, the geometry of the geological bod-ies between the cross-sections is interpolated. Therefore, in or-der to obtain more reliable results, a greater number of 2-Dplanes must be included. The model presented is developedalong 31 cross-sections, separated by 20 km across the West-ern Carpathians and Pannonian Basin and 40 km in the Bohe-mian Massif and Eastern Alps. They are parallel to each otherand are almost identical with the direction of the CEL05 pro-file. The model consists of 41 bodies, representing the abovementioned units, thus giving a rather complex structure. Con-straining data can be visualized in IGMAS interactively alongthe modelled cross-sections by means of the GIS functions(e.g. Schmidt & Götze 1999). This is a great advantage duringthe modelling of large areas including various datasets.
In general, each of the units consists of four crustal layers:sediments, upper, middle and lower crust (Fig. 3). The densi-ties employed in the 3-D model are summarized in Table 2.The densities of the sediments in the Pannonian Basin Systemand Western Carpathians are based on the previous investiga-tions (e.g. Makarenko et al. 2002; Bielik et al. 2005 and refer-ences therein). The densities of the sediments in the otherunits are mainly based on the P-wave velocities of the CEL-models and relationships of Gardner et al. (1974) and Wang(2000), determined for sedimentary rocks. The upper mantle isin general divided into two parts, the lithospheric and astheno-spheric mantles. The densities of the lithospheric mantle un-derneath the ALCAPA and Tisza-Dacia microplates and theEuropean Platform (EP) are not constant. The colder EP uppermantle was assigned a density of 3.36 Mg/m3, which is by0.03 Mg/m3 greater than the density of the ALCAPA’s lithos-pheric mantle (Fig. 3). This is due to the temperature differ-ence of some 200—300 °C at depths of 50 and 100 km (e.g Ar-temieva 2006). According to the data of Kuskov & Kronrod(2006), the density decrease associated with higher tempera-tures (for constant pressure and composition) is in the order of—0.013 Mg/m3 for +100 °C (meaning that —0.03 Mg/m3 cor-responds to ~230 °C difference in temperature). The astheno-sphere, having a different composition than the lithosphericmantle, has lower Mg# (100×Mg/(Mg+Fe)) and higher den-sity than the lithosphere (e.g. Poudjom Djomani et al. 2001and references therein; Kuskov & Kronrod 2006). The as-thenosphere was assigned a density of 3.38 Mg/m3. The Pan-nonian Basin is, additionally, a region where a mantle up-welling takes place. The average density of the upwellingasthenospheric mantle at depths of 80 to 180 km has a lowvalue of 3.3 Mg/m3. This value was determined based on thecalculations of Cella & Rapolla (1997), and it also agrees withprevious models (e.g. Lillie et al. 1994; Bielik 1999).
204 ALASONATI TAŠÁROVÁ, BIELIK and GÖTZE
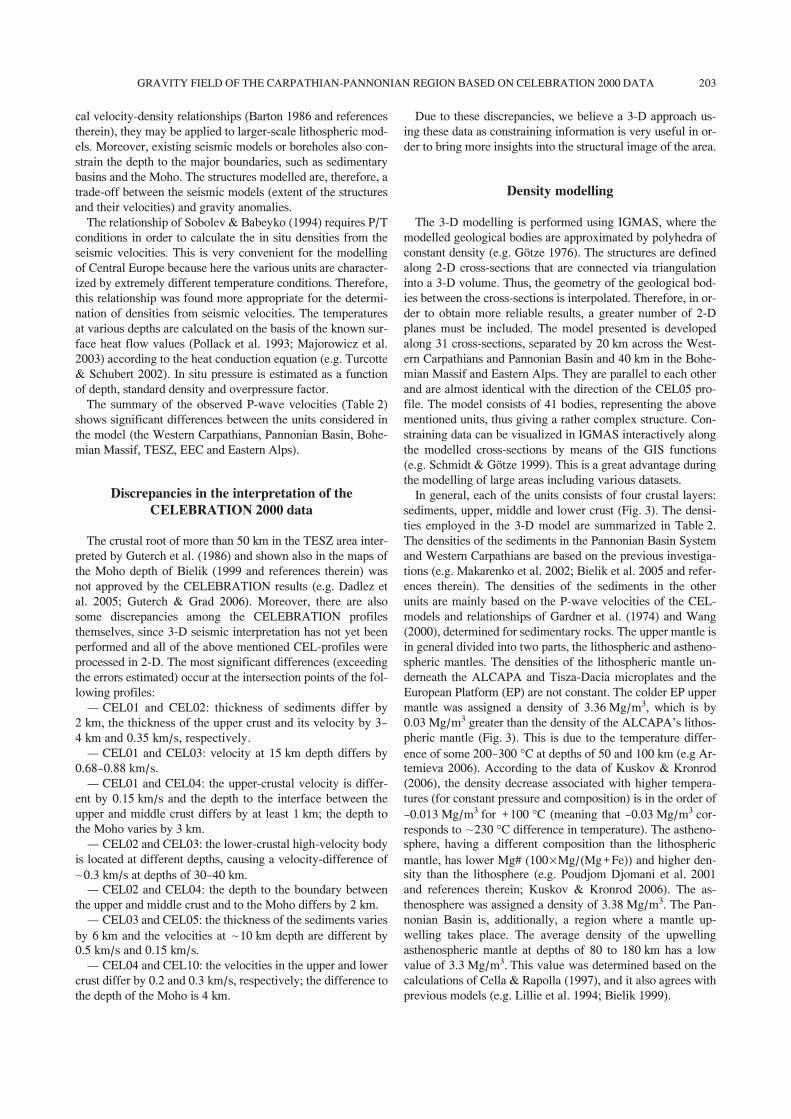
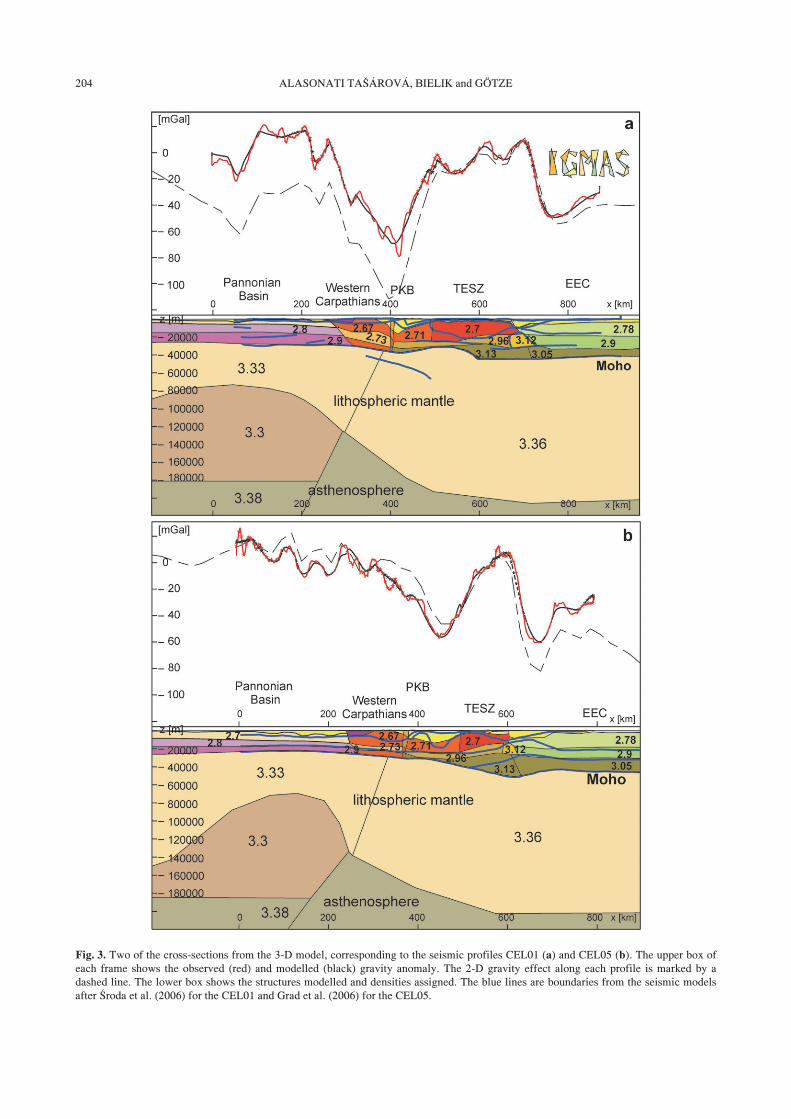
Fig. 3. Two of the cross-sections from the 3-D model, corresponding to the seismic profiles CEL01 (a) and CEL05 (b). The upper box ofeach frame shows the observed (red) and modelled (black) gravity anomaly. The 2-D gravity effect along each profile is marked by adashed line. The lower box shows the structures modelled and densities assigned. The blue lines are boundaries from the seismic modelsafter Środa et al. (2006) for the CEL01 and Grad et al. (2006) for the CEL05.
205GRAVITY FIELD OF THE CARPATHIAN-PANNONIAN REGION BASED ON CELEBRATION 2000 DATA
The employed densities are not relative to one referencedensity, but a three-layered reference model with negativedensities is chosen instead. The reference model used forthis area has two crustal layers. The upper crust (at depths0—15 km) has a density of —2.67 Mg/m3, while the lower crust(at depths 15—35 km) has a density of —2.9 Mg/m3. These val-ues are consistent with the velocity model IASP91 of Kennett& Engdahl (1991) and the global data of Christensen &Mooney (1995). The upper mantle (at depths of 35—220 km)has a density of —3.36 Mg/m3, which is consistent with valuesfor the subcontinental lithospheric mantle given by PoudjomDjomani et al. (2001).
Last but not least, it is important to mention differences be-tween the 2-D and 3-D modelling. A geological structure canbe treated as two-dimensional, if its length is much greaterwith respect to its width (e.g. Blakely 1996). This might be of-ten the case in reality (e.g. rift and fractures zones etc.). How-ever, due to the arcuate shape of the Carpathians, this condi-tion in the Western Carpathians is usually not fulfilled. Thereis a possibility in IGMAS to compute 2-D gravity effect of thestructures modelled along a particular cross-section. The dif-ferences between the calculated 2-D and 3-D effects are sig-nificant. If only the 2-D gravity modelling was performed forthe profile CEL01, with the Moho depth fixed according to theseismic model, the density of the intra-crustal structureswould be overestimated in the area of the microplate ALCA-PA and the TESZ crust underlying the Outer Carpathians(Fig. 3a). In contrary, the crustal densities along the CEL05profile would be underestimated for the microplate ALCAPAand overestimated for the EEC (Fig. 3b). 3-D gravity model-ling thus provides more realistic results for regions character-ized by complicated and non-linear geological structures.Therefore, it is more adequate than a 2-D modelling for inter-pretations of the gravity anomalies of such regions.
Results and interpretation
The microplate ALCAPA is separated from the platform bythe Pieniny Klippen Belt (PKB), extending through the wholecrust. The ALCAPA (Pannonian Basin System and WesternCarpathians) has a constant density lower crust, but the two-layered upper crust and sediments have different densities(Table 2). North of the PKB, the Outer Carpathians and theCarpathian Foredeep are underlain by the crust of the TESZ.According to the seismic interpretations, the TESZ and EEChave similar structure of the middle and lower crust, but sig-nificantly different upper crust (low-velocity TESZ uppercrust) (e.g. Dadlez et al. 2005; Guterch & Grad 2006). This isalso included in the 3-D density model presented (Fig. 3).However, the middle and lower crust of the TESZ in the den-sity model have higher densities than the EEC middle andlower crust (Table 2). These higher-density crustal layers arerequired to reproduce the Małopolska High, as it was also sug-gested by Grabowska & Bojdys (2001). Alternatively, if themiddle crust of the TESZ is modelled with a density almostidentical to the EEC middle crust, the density of the TESZlower crust must be increased (Table 2, values indicated by A).Additionally, a high-velocity body was interpreted in the tran-
sition area between the TESZ and EEC in the middle crust un-derneath the Lublin High (EEC) along the CEL01, CEL02,CEL03 profiles (Malinowski et al. 2005; Janik et al. 2005;Środa et al. 2006). The velocities along the CEL05 (Grad et al.2006) are also elevated in this region. Similarly, a high-densi-ty body in the middle crust is required in the density model inorder to reproduce the gravity anomaly. It is a 3-D structure,stretching from the CEL05 profile in the south to ~60 kmnorth of the CEL01 profile. Its high velocity of 7 to 7.15 km/sand density of 3.12 Mg/m3 indicates mafic composition, simi-lar to olivine gabbro or garnet granulite (Sobolev & Babeyko1994; Christensen & Mooney 1995). Grabowska et al. (sub-mitted) assume this intrusion to be due to the metamorphicprocesses, resulting in the increase of the density and varia-tions of magnetic properties of rocks forming the crystallinecrust of this unit.
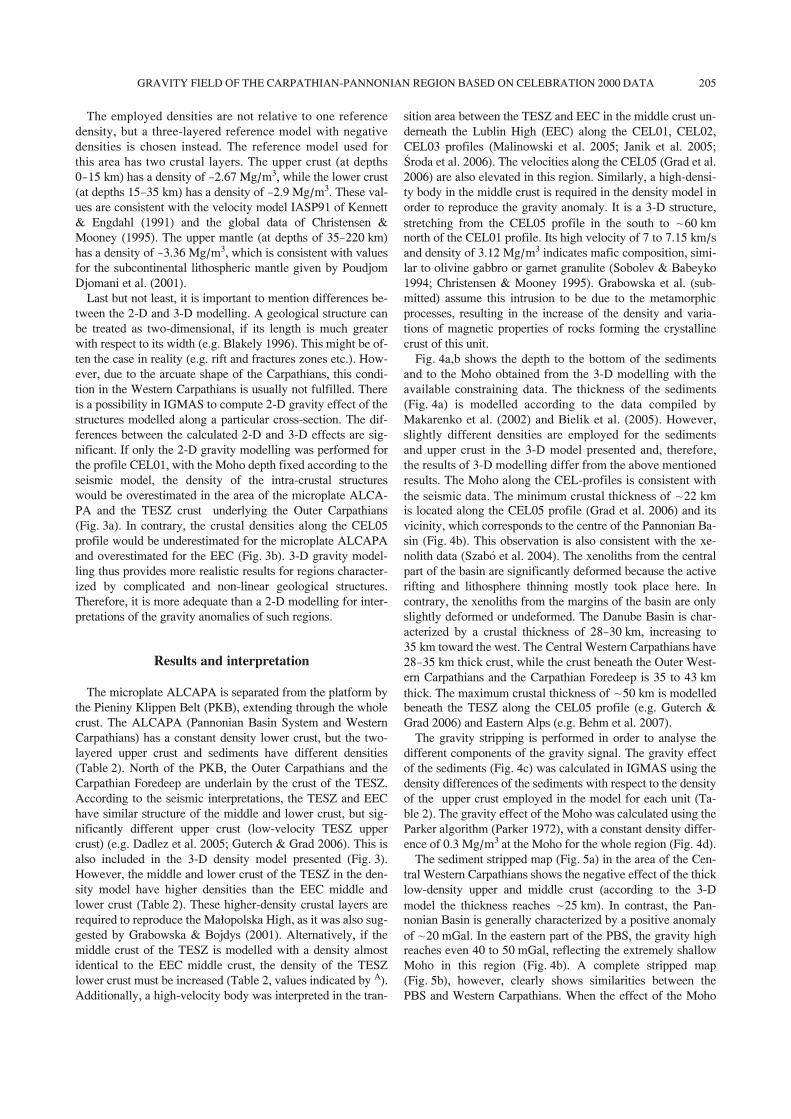
Fig. 4a,b shows the depth to the bottom of the sedimentsand to the Moho obtained from the 3-D modelling with theavailable constraining data. The thickness of the sediments(Fig. 4a) is modelled according to the data compiled byMakarenko et al. (2002) and Bielik et al. (2005). However,slightly different densities are employed for the sedimentsand upper crust in the 3-D model presented and, therefore,the results of 3-D modelling differ from the above mentionedresults. The Moho along the CEL-profiles is consistent withthe seismic data. The minimum crustal thickness of ~22 kmis located along the CEL05 profile (Grad et al. 2006) and itsvicinity, which corresponds to the centre of the Pannonian Ba-sin (Fig. 4b). This observation is also consistent with the xe-nolith data (Szabó et al. 2004). The xenoliths from the centralpart of the basin are significantly deformed because the activerifting and lithosphere thinning mostly took place here. Incontrary, the xenoliths from the margins of the basin are onlyslightly deformed or undeformed. The Danube Basin is char-acterized by a crustal thickness of 28—30 km, increasing to35 km toward the west. The Central Western Carpathians have28—35 km thick crust, while the crust beneath the Outer West-ern Carpathians and the Carpathian Foredeep is 35 to 43 kmthick. The maximum crustal thickness of ~50 km is modelledbeneath the TESZ along the CEL05 profile (e.g. Guterch &Grad 2006) and Eastern Alps (e.g. Behm et al. 2007).
The gravity stripping is performed in order to analyse thedifferent components of the gravity signal. The gravity effectof the sediments (Fig. 4c) was calculated in IGMAS using thedensity differences of the sediments with respect to the densityof the upper crust employed in the model for each unit (Ta-ble 2). The gravity effect of the Moho was calculated using theParker algorithm (Parker 1972), with a constant density differ-ence of 0.3 Mg/m3 at the Moho for the whole region (Fig. 4d).
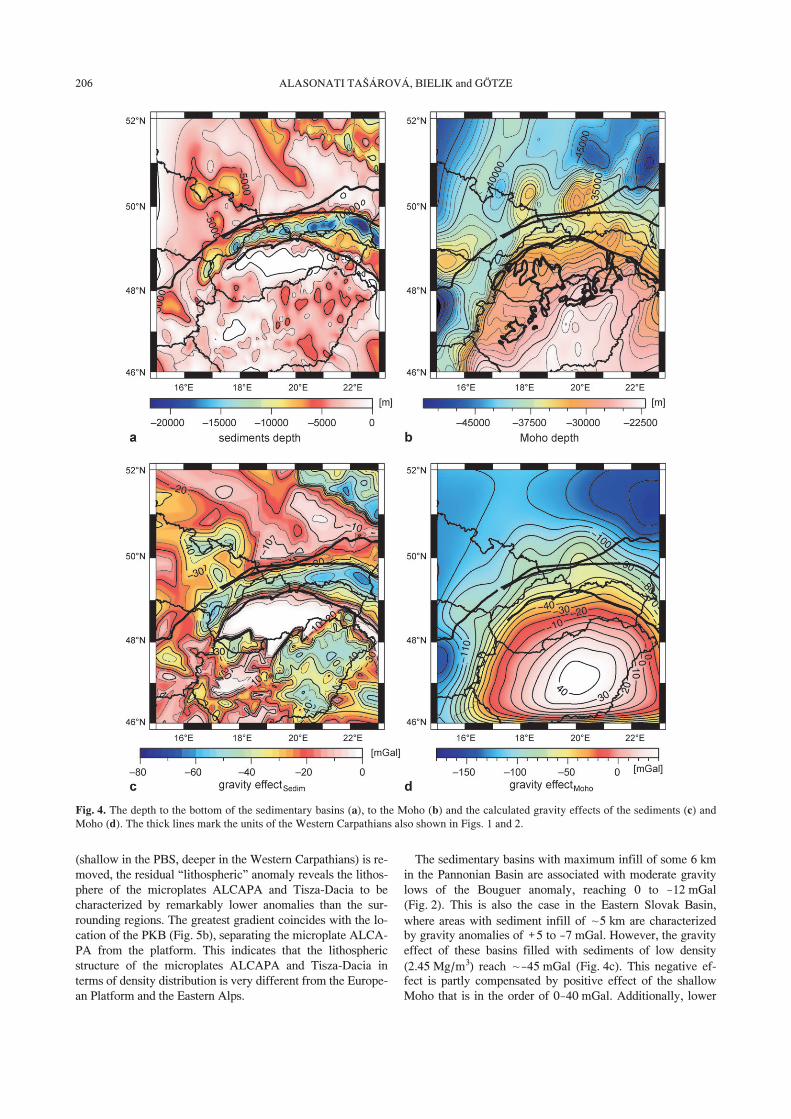
The sediment stripped map (Fig. 5a) in the area of the Cen-tral Western Carpathians shows the negative effect of the thicklow-density upper and middle crust (according to the 3-Dmodel the thickness reaches ~25 km). In contrast, the Pan-nonian Basin is generally characterized by a positive anomalyof ~20 mGal. In the eastern part of the PBS, the gravity highreaches even 40 to 50 mGal, reflecting the extremely shallowMoho in this region (Fig. 4b). A complete stripped map(Fig. 5b), however, clearly shows similarities between thePBS and Western Carpathians. When the effect of the Moho
206 ALASONATI TAŠÁROVÁ, BIELIK and GÖTZE
(shallow in the PBS, deeper in the Western Carpathians) is re-moved, the residual “lithospheric” anomaly reveals the lithos-phere of the microplates ALCAPA and Tisza-Dacia to becharacterized by remarkably lower anomalies than the sur-rounding regions. The greatest gradient coincides with the lo-cation of the PKB (Fig. 5b), separating the microplate ALCA-PA from the platform. This indicates that the lithosphericstructure of the microplates ALCAPA and Tisza-Dacia interms of density distribution is very different from the Europe-an Platform and the Eastern Alps.
Fig. 4. The depth to the bottom of the sedimentary basins (a), to the Moho (b) and the calculated gravity effects of the sediments (c) andMoho (d). The thick lines mark the units of the Western Carpathians also shown in Figs. 1 and 2.
The sedimentary basins with maximum infill of some 6 kmin the Pannonian Basin are associated with moderate gravitylows of the Bouguer anomaly, reaching 0 to —12 mGal(Fig. 2). This is also the case in the Eastern Slovak Basin,where areas with sediment infill of ~5 km are characterizedby gravity anomalies of +5 to —7 mGal. However, the gravityeffect of these basins filled with sediments of low density(2.45 Mg/m3) reach ~—45 mGal (Fig. 4c). This negative ef-fect is partly compensated by positive effect of the shallowMoho that is in the order of 0—40 mGal. Additionally, lower
207GRAVITY FIELD OF THE CARPATHIAN-PANNONIAN REGION BASED ON CELEBRATION 2000 DATA
Fig. 5. Sediment stripped map (a) and the complete stripped map (b), also referred to as a residual “lithospheric” anomaly. The thick linesmark the units shown also in Figs. 1 and 2.
crustal intrusions, reaching some 10 km in depth (e.g. Ádám& Bielik 1998), also compensate for the negative effect of thesediments. Similarly, Kolárovo gravity high is reproduced bya dense lower crust (Bielik et al. 1986), reaching depths of9 km and a width of some 10 to 20 km that is included along 2cross-sections in the 3-D model.
Conclusions and outlook
A 3-D forward modelling was performed for the WesternCarpathians, Pannonian Basin System and the surroundingunits. The model uses mainly data collected recently duringthe CELEBRATION 2000 experiment. It brings them into onestructural image in order to study the lithospheric structure ofthis region. By means of the combined 3-D modelling, prelim-inary estimates of the density distribution of the crust and up-per mantle, as well as the depths of the sedimentary basins andthe Moho were derived. These data allowed the performanceof gravity stripping, which is in the area of the Pannonian Ba-sin crucial for the analysis of the gravity field. In this region,two pronounced features, namely the deep sedimentary basinsand shallow Moho, with opposite gravity effects hinder the in-terpretation of the gravity field by means of filtering (e.g. inthe wavenumber domain), estimating isostatic regional and re-sidual fields or performing the gravity anomaly inversion. Theresults of the gravity stripping revealed the lithosphere of theALCAPA and Tisza-Dacia microplates to be very similar andmuch less dense than the surrounding lithosphere.
The upper mantle of the Pannonian Basin, where an as-thenospheric upwelling takes place, significantly differs fromthe surrounding regions. The upper mantle characterized by anasthenospheric upwelling is, with respect to the “normal” up-per mantle, anomalous in terms of lithospheric thickness, tem-perature and density distribution. As it has been proved in thecourse of the 3-D modelling, the influence of the different up-per mantle densities of the units modelled on the crustal struc-tures is pronounced. Thus, the upper mantle density must bedetermined as precisely as possible, considering all availableinformation. Therefore, in order to determine the upper mantledensities, the combined geophysical—petrological approach ofAfonso (2006) will be applied. The mantle densities betterconstrained should improve the estimations of the densitiesand composition of the crust and enhance the localization ofthe lithospheric inhomogeneities.
Acknowledgments: This work is financed by the DeutscheForschungsgemeinschaft (project TA553/1—1). We are thank-ful to S. Schmidt (Kiel University) for in-house software andtechnical assistance. M. Bielik is grateful to the Slovak Scien-tic Grant Agency (Grants No. 1/3066/06 and 2/6019/06) andAPVT Grant No. APVT-51-002804 for support.
References
Afonso J.C. 2006: Thermal, density, seismological, and rheologicalstructure of the lithospheric-sublithospheric mantle from com-
208 ALASONATI TAŠÁROVÁ, BIELIK and GÖTZE
bined petrological-geophysical modelling: Insights on lithos-pheric stability and the initiation of subduction. Ph.D. Thesis,Carleton Univ., Ottawa.
Artemieva I.M. 2006: Global 1°×1° thermal model TC1 for the con-tinental lithosphere: implications for lithosphere secular evolu-tion. Tectonophysics 416, 245—277,doi:10.1016/j.tecto.2005.11.022.
Ádám A. & Bielik M. 1998: The crustal and upper-mantle geophysi-cal signature of narrow continental rifts in the Pannonian basin.Geophys. J. Int. 134, 157—171,
doi:10.1046/j.1365-246x.1998.00544.x.Babuška V., Plomerová J. & Šílený J. 1987: Structural model of the
subcrustal lithosphere in central Europe. In: Fuchs K. & Froi-devaux C. (Eds.): Composition, structure and evolution of thelithosphere-asthenosphere system. Geodyn. Ser., AGU, Wash-ington D.C. 16, 239—251.
Barton P.J. 1986: The relationship between seismic velocity and den-sity in the continental crust – a useful constrain? Geophys. J.R.Astr. Soc. 87, 195—208.
Behm M., Brückl E. & Chwatal Tybo H. 2007: Application of stack-ing and inversion techniques to 3D wide-angle reflection and re-fraction seismic data of the Eastern Alps. Geophys. J. Int. (2007),doi: 10.1111/j.1365-246X.2007.03393.x.
Bielik M. 1999: Geophysical features of the Slovak Western Car-pathians: a review. Geol. Quart. 43, 3, 251—262.
Bielik M., Fusán O., Plančár J., Biela A. & Túnyi I. 1986: New infor-mation on subsurface structure of Danube Basin. Geol. Práce,Spr. 84, 119—134 (in Slovak English summary).
Bielik M., Šefara J., Kováč M., Bezák V. & Plašienka D. 2004: TheWestern Carpathians – interaction of Hercynian and Alpineprocesses. Tectonophysics 393, 63—86.
Bielik M., Makarenko I., Starostenko V., Legostaeva O., Dérerová J.,Šefara J. & Pašteka R. 2005: New 3D gravity modeling in theCarpathian-Pannonian basin region. Contrib. Geophys. Geodesy35, 1, 65—78.
Bielik M., Kloska K., Meurers B., Švancara J., Wybraniec S. & CEL-EBRATION 2000 Potential Field Working Group 2006: Gravityanomaly map of the CELEBRATION 2000 region. Geol. Car-pathica 57, 3, 145—156.
Blankely R.J. 1996: Potential theory in gravity and magnetic applica-tions. Cambridge University Press, 1—441.
Buła Z., Jachowicz M. & Zaba J. 1997: Principal characteristics ofthe Upper Silesian Block and Małopolska Block border zone(southern Poland). Geol. Mag. 5, 669—677.
Cella F. & Rapolla A. 1997: Density changes in upwelling mantle.Ph. Earth and Plan. Interior 103, 63—84.
Christensen N.I. & Mooney W.D. 1995: Seismic velocity structureand composition of the continental crust: A global view. J. Geo-phys. Res. 100(B7), 9761—9788.
Čermák V. 1994: Results of heat flow studies in Czechoslovakia. In:Bucha V. & Blížkovský M. (Eds.): Crustal structure of the Bo-hemian Massif and the West Carpathians. Springer, New York,85—118, edited by Horváth F., Cloetingh S. & Bada G. Eur.Geophys. Soc., Strasbourg, France 165—194.
Dadlez R., Grad M. & Guterch A. 2005: Crustal structure below thePolish Basin: Is it composed of proximal terranes derived fromBaltica? Tectonophysics 411, 111—128.
Dérerová J., Zeyen H., Bielik M. & Salman K. 2006: Application ofintegrated geophysical modeling for determination of the conti-nental lithospheric thermal structure in the Eastern Carpathians.Tectonics 25,TC3009, doi:10.1029/2005TC001883.
Falus G., Szabó C. & Vaselli O. 2000: Mantle upwelling within thePannonian Basin: evidence from xenolith lithology and mineralchemistry. Terra Nova 12, 6, 295—302.
Gardner G.H.F., Gardner L.W. & Gregory A.R. 1974: Formation ve-
locity and density – the diagnostic basics for stratigraphictraps. Geophysics 29, 6, 770—778.
Geissler W.H., Sodoudi F. & Kind R. 2007: The thickness of the Eu-ropean Lithosphere as seen by S receiverfunctions. Geophys.Res. Abstr. 9, 07345.
Götze H.-J. 1976: Ein numerisches Verfahren zur Berechnung dergravimetrischen und magnetischen Feldgrößen für dreidimen-sionale Modellkörper. Dissertation, Technical UniversityClausthal, Germany.
Götze H.-J. & Lahmeyer B. 1988: Application of three-dimensionalinteractive modeling in gravity and magnetics. Geophysics 53, 8,1096—1108.
Grabowska T. & Bojdys G. 2001: The border of the East-EuropeanCraton in south-eastern. Terra Nova 13, 2, 92—98.
Grabowska T., Bojdys G., Bielik M. & Csicsay K. submitted: Densi-ty and magnetic models of the lithosphere along CELEBRA-TION 2000 PROFILE CEL01. Submitted to Tectonophysics.
Grad M., Guterch A., Keller G.R., Janik T., Hegedus E., Vozár J.,Ślączka A., Tiira T. & Yliniemi J. 2006: Lithospheric structurebeneath trans-Carpathian transect from Precambrian platform toPannonian basin: CELEBRATION 2000 seismic profile CEL05.J. Geophys. Res. 111(B03301).
Guterch A. & Grad M. 2006: Lithospheric structure of the TESZ inPoland based on modern seismic experiments. Geol. Quart. 50,1, 23—32.
Guterch A., Grad M., Materzok R. & Perchuć E. 1986: Deep struc-ture of the Earth’s crust in the contact zone of the Paleozoic andPrecambrian platforms in Poland (Tornquist—Teisseyre Zone).Tectonophysics 128, 251—279.
Guterch A., Grad M., Špičák A., Brückl E., Hegedüs E., Keller G.R.,Thybo H. & CELEBRATION 2000, ALP 2002 & SUDETES2003 working groups 2003a: Special contributions: An overviewof recent seismic refraction experiments in central Europe. Stud.Geophys. Geod. 47, 3, 651—657.
Guterch A., Grad M., Keller G.R., Posgay K., Vozár J., Špičák A.,Brückl E., Hajnal Z., Thybo H., Selvi O. & CELEBRATION2000 Experiment Team 2003b: CELEBRATION 2000 seismicexperiment. Stud. Geophys. Geod. 47, 3, 659—669.
Hacker B.R. & Abers G.A. 2004: Subduction Factory 3. An Excelworksheet and macro for calculating the densities, seismic wavespeeds, and H2O contents of minerals and rocks at pressure andtemperature. Geochem., Geophys., Geosystems – an ElectronicJ. Earth Sci. 5, 1,Q01005, doi:10.1029/2003GC000614.
Horváth F. 1993: Towards a kinematic model for the formation of thePannonian basin. Tectonophysics 226, 333—357.
Hrubcová P., Środa P., Špičák A., Guterch A., Grad M., Keller G.R.,Brückl E. & Thybo H. 2005: Crustal and uppermost mantlestructure of the Bohemian Massif based on CELEBRATION2000 data. J. Geophys. Res. 110(B11305).
Janik T., Grad M., Guterch A., Dadlez R., Yliniemi J., Tiira T.,Keller G.E., Gaczyński G.R. & CELEBRATION 2000 WorkingGroup 2005: Lithospheric structure of the Trans-European Su-ture Zone along the TTZ-CEL03 seismic transect (from NW toSE Poland). Tectonophysics 411, 129—156.
Kennett B.L.N. & Engdahl E.R. 1991: Traveltimes for global earth-quake location and phase identification. Geophys. J. Int. 105,429—465.
Konečný V., Kováč M., Lexa J. & Šefara J. 2002: Neogene evolutionof the Carpatho-Pannonian region: an interplay of subductionand back-arc diapiric uprise in the mantle. EGS Stephan MuellerSpec. Publ. Ser. 1, 165—194.
Kováč M. 2000: Geodynamical, paleographical and structural devel-opment of the Carpathian-Pannonian region in Miocene. Newview on Slovak Neogene basins. Veda, Bratislava, 5—202 (inSlovak).

209GRAVITY FIELD OF THE CARPATHIAN-PANNONIAN REGION BASED ON CELEBRATION 2000 DATA
Kuskov O.L. & Kronrod V.A. 2006: Determining the temperature ofthe Earth’s continental upper mantle from geochemical and seis-mic data. Geochem. Int. 44, 3,
doi:10.1134/S00167029060300250Lenkey L., Dövényi P., Horváth F. & Cloetingh S.A.P.L. 2002: Geo-
thermics of the Pannonian basin and its bearing on the neotec-tonics. EGU Stephan Mueller Spec. Publ. Ser. 3, 29—40.
Lillie R., Bielik M., Babuška V. & Plomerová J. 1994: Gravity mod-elling of the lithosphere in the Eastern Alpine-Western Car-pathian-Pannonian Basin Region. Tectonophysics 231, 4,215—235.
Majorowicz J.A., Čermak V., Šafanda J., Krzywiec P., WróblewskaM., Guterch A. & Grad M. 2003: Heat flow models across theTrans-European Suture Zone in the area of the POLONAISE 97seismic experiment. Physics Chem. Earth 28, 375—391.
Makarenko I., Legostaeva O., Bielik M., Starostenko V., Dérerová J.& Šefara J. 2002: 3D gravity effects of the sedimentary com-plexes in the Carpathian-Pannonian region. Geol. Carpathica,Spec. Issue 53.
Malinowski M., Zelazniewicz A., Grad M., Guterch A. & Janik T.2005: Seismic and geological structure of the crust in the transi-tion from Baltica to Palaeozoic Europe in SE Poland – CELE-BRATION 2000 experiment, profile CEL02. Tectonophysics401, 1—2, 55—77.
Parker R.L. 1972: The rapid calculation of potential anomalies. Geo-phys. J.R. Astr. Soc. 3, 447—455.
Plašienka D., Grecula P., Putiš M., Kováč M. & Hovorka D. 1997:Evolution and structure of the Western Carpathians: an over-view. Miner. Slovaca, Monograph, Bratislava, 1—24.
Pollack H.N., Hurter S.J. & Johnson J.R. 1993: Heat flow from theEarth’s interior: Analysis of the global data set. Rev. Geophys.31, 267—280.
Poudjom Djomani Y.H., O’Reilly S.Y., Griffin W.L. & Morgan P.2001: The density structure of subcontinental lithospherethrough time. Earth Planet. Sci. Lett. 184, 605—621.
Praus O., Pěčová J., Petr V., Babuška V. & Plomerová J. 1990: Mag-netotelluric and seismo-logical determination of lithosphere-as-thenosphere transition in central Europe. Phys. Earth Planet.Inter. 60, 212—228.
Royden L., Horváth F., Nagymarosy A. & Stegena L. 1983: Evolu-tion of the Pannonian Basin System 2, subsidence and thermalhistory. Tectonics 2, 91—137.
Růžek B., Hrubcová P., Novotný M., Špičák A. & Karousová O.
2007: Inversion of travel times obtained during active seismic re-fraction experiments CELEBRATION 2000, ALP 2002 and SU-DETES 2003. Studia Geophysica et Geodaetica 51, 1, 141—164.
Schätz M., Zwing A., Tait J., Belka Z., Soffel H.C. & Bachtadse V.2006: Paleomagnetism of Ordovician carbonate rocks fromMałopolska Massif, Holy Cross Mountains, SE Poland – Mag-netostratigraphic and geotectonic implications. Earth Planet.Sci. Lett. 244, 349—360.
Schmidt S. & Götze H.-J. 1999: Integration of data constraints andpotential field modelling – an example from southern LowerSaxony, Germany. Physics and Chemistry of the Earth (A) 24, 3,191—196.
Sobolev S.V. & Babeyko A.Y. 1994: Modeling of mineralogicalcomposition, density and elastic wave velocities in anhydrousmagmatic rocks. Surveys in Geophysics 15, 5, 515—544.
Szabó C., Falus G., Kovács I. & Bali E. 2004: Composition and evo-lution of lithosphere beneath the Carpathian-Pannonian Region:a review. Tectonophysics 393, 119—137.
Šefara J., Bielik M., Konečný P., Bezák V. & Hurai V. 1996: The lat-est stage of development of the Western Carpathian lithosphereand its interaction with asthenosphere. Geol. Carpathica 47,339—347.
Środa P., Czuba W., Grad M., Guterch A., Tokarski A.K., Janik T.,Rauch M., Keller G.R., Hegedüs E., Vozár J. & Celebration2000 Working Group 2006: Crustal and upper mantle structureof the Western Carpathians from CELEBRATION 2000 profilesCEL01 and CEL04: seismic models and geological implications.Geophys. J. Int. 167, 737—760.
Torge W. 1989: Gravimetry. Walter de Gruyter and Co., Berlin,1—465.
Turcotte D.L. & Schubert G. 2002: Geodynamics: application of con-tinuum physics to geological problems. John Wiley, Hoboken,N.J., 1—450.
Wang Z. 2000: Velocity-density relationships in sedimentary rocks.Geophysics reprint series, Soc. Explor. Geophys. 19, 19, 258—268.
Winchester J.A. & The PACE TMR Network Team 2002: Palaeo-zoic amalgamation of Central Europe: new results from recentgeological and geophysical investigations. Tectonophysics 360,5—21.
Zeyen H., Dérerová J. & Bielik M. 2002: Determination of the conti-nental lithosphere thermal structure in the Western Carpathians:Integrated modelling of surface heat flow, gravity anomalies andtopography. Phys. Earth Planet. Inter. 134, 89—104.