Stretching of cis-formic acid: warm-up and cool-down as ...
10
Stretching of cis-formic acid: warm-up and cool- down as molecular work-out Katharina A. E. Meyer and Martin A. Suhm * A new technique to rotationally simplify and Raman-probe conformationally and vibrationally excited small molecules is applied to the cis–trans isomerism of formic acid. It quintuples the previously available gas phase vibrational data base on this excited form of a strongly anharmonic planar molecule despite its limited spectral resolution. The newly determined cis-formic acid fundamentals allow for a balanced vibrational benchmark on both rotamers of formic acid. Assuming the adequacy of vibrational perturbation theory, it reveals weaknesses of standard methods for these systems like B3LYP-D3(BJ)/ aVQZ VPT2 or PBE0-D3(BJ)/aVQZ VPT2. The functionals uB97-XD and M06-2X additionally suffer from severe integration grid size and symmetry dependencies. The vibrational benchmark suggests B2PLYP- D3(BJ)/aVQZ VPT2 and MP2/aVQZ VPT2 as partially competitive and in any case efficient alternatives to computationally demanding coupled cluster vibrational configuration interaction calculations. Whether this is due to fortuitous compensation between electronic structure and vibrational perturbation error remains to be explored. 1 Introduction Vibrational spectra of small molecules effectively probe the quality of potential energy hypersurface (PES) predictions, when combined with accurate anharmonic calculations. 1 Typically, an intense interplay between theory and experiment initially converges the performance for a set of low quantum number states around the global minimum. To explore the globality of a PES, it is then desirable to add experimental data on a secondary minimum structure. Its quantum states start locally, but evolve into mixed structure states at higher excita- tion, probing the transition state region as well. For three atoms, HCN/HNC is the paradigmatic example. 2 For four atoms, the simultaneous description of the nearly isoenergetic form- aldehyde molecule and H 2 –CO complex is challenging. 3,4 For ve atoms, the cis–trans isomerism of formic acid is arguably one of the most interesting systems, calling for suitable exper- imental reference data for the higher-energy cis-form. These have been surprisingly scarce until very recently, with a single exception. 5 As the smallest carboxylic acid, the formic acid monomer has been addressed by a plethora of theoretical 6–15 and experimental studies. 5,16–55 The isomerisation from the ground state trans- form to the higher-energy cis-form has been of particular interest, 5,14,22,41,42 even when looking at processes in the inter- stellar medium. 56 When it comes to the vibrations of cis-formic acid, matrix isolation has been the method of choice thus far, because the possibility of long irradiation times allows for a signicant formation via laser excitation of the trans- form. 35,41,42,49,50,57 Since the matrix environment shis the band positions compared to the gas phase, a direct comparison with predicted band positions of modern quantum chemical methods would require a very challenging description of the environment. Accurate theoretical predictions for the isolated cis-isomer thus suffer from a lack of gas phase experimental reference data. Two recent studies where this applies are by Tew and Mizukami 14 from 2016 and by Richter and Carbonni` ere 15 from 2018. Due to the fairly large energy difference of 1365 30 cm 1 between both rotamers of formic acid, 22 vibrational gas phase data on the cis-form are rare. The rst gas phase band position of cis-formic acid has been published in 2006 by Baskakov and co-workers, who studied the out-of-plane bending vibration with high resolution FTIR spectroscopy. 5 Only very recently, it was complemented by a second example obtained as a side effect when studying excitonic C]O stretch coupling in jet- cooled carboxylic acid dimers. 54 This observation has trig- gered the present work, which represents a systematic study of all four valence stretching modes of cis-formic acid. It is based on a powerful new Raman scattering approach of thermally populated and rapidly re-cooled molecules. Instead of conserving the conformational excitation by cryogenic matrix trapping, 58 the spectra are rotationally simplied by supersonic expansion. Vibrational and high barrier conformational exci- tation is largely trapped and can be probed without environ- mental distortion as a function of initial gas temperature. Back- Institut f¨ ur Physikalische Chemie, Georg-August-Universit¨ at G¨ ottingen, Tammannstr. 6, 37077 G¨ ottingen, Germany. E-mail: [email protected]; Fax: +49 551 39 33117; Tel: +49 55139 33111 Cite this: Chem. Sci. , 2019, 10, 6285 All publication charges for this article have been paid for by the Royal Society of Chemistry Received 30th March 2019 Accepted 15th May 2019 DOI: 10.1039/c9sc01555h rsc.li/chemical-science This journal is © The Royal Society of Chemistry 2019 Chem. Sci. , 2019, 10, 6285–6294 | 6285 Chemical Science EDGE ARTICLE Open Access Article. Published on 16 May 2019. Downloaded on 12/25/2021 1:19:47 AM. This article is licensed under a Creative Commons Attribution 3.0 Unported Licence. View Article Online View Journal | View Issue
Transcript of Stretching of cis-formic acid: warm-up and cool-down as ...

ChemicalScience
EDGE ARTICLE
Ope
n A
cces
s A
rtic
le. P
ublis
hed
on 1
6 M
ay 2
019.
Dow
nloa
ded
on 1
2/25
/202
1 1:
19:4
7 A
M.
Thi
s ar
ticle
is li
cens
ed u
nder
a C
reat
ive
Com
mon
s A
ttrib
utio
n 3.
0 U
npor
ted
Lic
ence
.
View Article OnlineView Journal | View Issue
Stretching of cis
Institut fur Physikalische Chemie, Georg-Au
6, 37077 Gottingen, Germany. E-mail: msu
Tel: +49 55139 33111
Cite this: Chem. Sci., 2019, 10, 6285
All publication charges for this articlehave been paid for by the Royal Societyof Chemistry
Received 30th March 2019Accepted 15th May 2019
DOI: 10.1039/c9sc01555h
rsc.li/chemical-science
This journal is © The Royal Society of C
-formic acid: warm-up and cool-down as molecular work-out
Katharina A. E. Meyer and Martin A. Suhm *
A new technique to rotationally simplify and Raman-probe conformationally and vibrationally excited small
molecules is applied to the cis–trans isomerism of formic acid. It quintuples the previously available gas
phase vibrational data base on this excited form of a strongly anharmonic planar molecule despite its
limited spectral resolution. The newly determined cis-formic acid fundamentals allow for a balanced
vibrational benchmark on both rotamers of formic acid. Assuming the adequacy of vibrational
perturbation theory, it reveals weaknesses of standard methods for these systems like B3LYP-D3(BJ)/
aVQZ VPT2 or PBE0-D3(BJ)/aVQZ VPT2. The functionals uB97-XD and M06-2X additionally suffer from
severe integration grid size and symmetry dependencies. The vibrational benchmark suggests B2PLYP-
D3(BJ)/aVQZ VPT2 and MP2/aVQZ VPT2 as partially competitive and in any case efficient alternatives to
computationally demanding coupled cluster vibrational configuration interaction calculations. Whether
this is due to fortuitous compensation between electronic structure and vibrational perturbation error
remains to be explored.
1 Introduction
Vibrational spectra of small molecules effectively probe thequality of potential energy hypersurface (PES) predictions, whencombined with accurate anharmonic calculations.1 Typically,an intense interplay between theory and experiment initiallyconverges the performance for a set of low quantum numberstates around the global minimum. To explore the globality ofa PES, it is then desirable to add experimental data ona secondary minimum structure. Its quantum states startlocally, but evolve into mixed structure states at higher excita-tion, probing the transition state region as well. For threeatoms, HCN/HNC is the paradigmatic example.2 For four atoms,the simultaneous description of the nearly isoenergetic form-aldehyde molecule and H2–CO complex is challenging.3,4 Forve atoms, the cis–trans isomerism of formic acid is arguablyone of the most interesting systems, calling for suitable exper-imental reference data for the higher-energy cis-form. Thesehave been surprisingly scarce until very recently, with a singleexception.5
As the smallest carboxylic acid, the formic acidmonomer hasbeen addressed by a plethora of theoretical6–15 and experimentalstudies.5,16–55 The isomerisation from the ground state trans-form to the higher-energy cis-form has been of particularinterest,5,14,22,41,42 even when looking at processes in the inter-stellar medium.56 When it comes to the vibrations of cis-formic
gust-Universitat Gottingen, Tammannstr.
[email protected]; Fax: +49 551 39 33117;
hemistry 2019
acid, matrix isolation has been the method of choice thus far,because the possibility of long irradiation times allows fora signicant formation via laser excitation of the trans-form.35,41,42,49,50,57 Since the matrix environment shis the bandpositions compared to the gas phase, a direct comparison withpredicted band positions of modern quantum chemicalmethods would require a very challenging description of theenvironment. Accurate theoretical predictions for the isolatedcis-isomer thus suffer from a lack of gas phase experimentalreference data. Two recent studies where this applies are by Tewand Mizukami14 from 2016 and by Richter and Carbonniere15
from 2018.Due to the fairly large energy difference of 1365 � 30 cm�1
between both rotamers of formic acid,22 vibrational gas phasedata on the cis-form are rare. The rst gas phase band positionof cis-formic acid has been published in 2006 by Baskakov andco-workers, who studied the out-of-plane bending vibrationwith high resolution FTIR spectroscopy.5 Only very recently, itwas complemented by a second example obtained as a sideeffect when studying excitonic C]O stretch coupling in jet-cooled carboxylic acid dimers.54 This observation has trig-gered the present work, which represents a systematic study ofall four valence stretching modes of cis-formic acid. It is basedon a powerful new Raman scattering approach of thermallypopulated and rapidly re-cooled molecules. Instead ofconserving the conformational excitation by cryogenic matrixtrapping,58 the spectra are rotationally simplied by supersonicexpansion. Vibrational and high barrier conformational exci-tation is largely trapped and can be probed without environ-mental distortion as a function of initial gas temperature. Back-
Chem. Sci., 2019, 10, 6285–6294 | 6285

Chemical Science Edge Article
Ope
n A
cces
s A
rtic
le. P
ublis
hed
on 1
6 M
ay 2
019.
Dow
nloa
ded
on 1
2/25
/202
1 1:
19:4
7 A
M.
Thi
s ar
ticle
is li
cens
ed u
nder
a C
reat
ive
Com
mon
s A
ttrib
utio
n 3.
0 U
npor
ted
Lic
ence
.View Article Online
tunnelling to the trans-form is also not an issue on the timescale of the jet expansion, making it an “easy” experiment.59 Bya 400% increase of perturbation-free cis-formic acid vibrationalfrequencies aer a decade of stagnation, we provide the rstsystematic access to the performance of quantum chemicalmethods towards this model system. This decreases the likeli-hood of accidental error compensation between electronicstructure, vibrational treatment, and matrix shis for cis-formicacid by orders of magnitude.
The structure of this paper is as follows: we briey illustratethe general approach of how the spectra of cis-formic acid wererecorded, followed by a detailed analysis of the spectra anda rst benchmark of vibrational perturbation theory and liter-ature variational data against the experimental data. It is hopedthat this progress will trigger further growth in the experimentaldata base and its use in benchmarking the global PES of formicacid and pentatomic vibrational treatments.
2 Methods2.1 Experimental
A detailed description of the experimental set-up can be found inprevious publications.54,60 Formic acid (Acros Organics, 98+%)was seeded at 0.2% in helium and expanded through a verticalslit nozzle at 1.0 bar into the evacuated jet chamber (backgroundpressure < 0.1 mbar). The expansion was probed by a 532 nm,25 W continuous-wave laser from below. The scattered radiationwas detected perpendicularly with respect to both the expandingow and the laser with a monochromator equipped witha charge-coupled device camera. cis-Formic acid was formed insmall quantities from the trans-rotamer by heating the nozzleand its feed line to temperatures between 100–190 �C.
Fig. 1 Harmonically predicted band positions and Raman scatteringcross-sections s (ref. 74) of all nine fundamentals of cis- (violet) andtrans-formic acid (black), calculated at the B3LYP-D3(BJ)/aVTZ level.
2.2 Computations
The quantum chemical calculations shown in this work wereperformed with the Gaussian 09 program package (revisionE.01)61 using a pruned ultra ne integration grid (99 590). Thisgrid is ner than the default of Gaussian 09 (ne grid,(75 302)).61 The employed methods are B3LYP,62,63 B2PLYP,64
MP2,65,66 M06-2X,67 uB97-XD,68 PBE0,69 and PM3.70,71 Grimme'spairwise dispersion correction (D3) in combination with Becke–Johnson (BJ) damping has been added for B3LYP, B2PLYP, andPBE0.72 For all methods, an augmented quadruple-zeta (aVQZ)basis set has been chosen. Additional augmented double-(aVDZ) and triple-zeta (aVTZ) calculations were carried out forMP2 and B2PLYP-D3(BJ). Moreover, the production calculationshave been performed without the use of symmetry, employingopt ¼ tight convergence.
The assignment of cis-formic acid fundamentals has beensupported by scaled, harmonic frequency calculations at theB3LYP-D3(BJ)/aVTZ level, which have proven to yield sufficientagreement in a previous study.54 For the vibrational benchmarkin Section 3.2, anharmonic frequency calculations were per-formed at all levels listed above using vibrational perturbationtheory (VPT2),73 as implemented in Gaussian 09.61 VPT2 was
6286 | Chem. Sci., 2019, 10, 6285–6294
used under the default settings where resonances identied ina pre-screening are removed and treated variationally.
Additionally, exploratory VPT2 calculations utilising the Cs
symmetry as well as a ner integration grid (pruned super neintegration grid (150 974)61) were carried out in selected cases toprobe their impact on the results. A brief discussion can befound in Section 3.3.
3 Results and discussion3.1 The stretching vibrations of cis-formic acid
To choose suitable spectral regions for cis-rotamer detection,the band positions and Raman scattering cross-sections havebeen predicted using B3LYP-D3(BJ)/aVTZ alongside those of thetrans-form. The results are displayed in Fig. 1. The vibrationshave been labelled according to the Herzberg nomenclature.The cis-formic acid vibrations with the largest scattering cross-sections are n1, n2, n3, and n6, namely the O–H, the C–H, theC]O, and the C–O stretching vibration. In fact, n6 is the onlystretching vibration with a distinctly larger scattering cross-section compared to trans-formic acid.
The experimental spectra of these four vibrational modes ofboth rotamers (cF, F) can be found in Fig. 2 alongside harmonic,individually F-scaled B3LYP-D3(BJ)/aVTZ calculations below thespectra. For each spectral region, four spectra with increasingnozzle temperature have been recorded. These temperatureseries have been intensity-scaled to the trans-monomer band oflowest intensity amongst the four. Consequently, any hot band,i.e., cis-formic acid or a non-isomeric hot band originating fromthermally populated low-lying energy levels of trans-formic acid,should increase in intensity with nozzle temperature, whereasany formic acid cluster band will decrease due to thermaldissociation.
The spectra in the O–H stretching region show one band thatincreases in intensity with temperature at 3637 cm�1. The bandposition is in good agreement with the harmonically calculated,n1(F)-scaled band position of cF with a deviation of only 5 cm�1.Either the anharmonicity of F and cF is similar or there is errorcompensation with the density functional used. Another way ofvalidating this assignment is to compare the intensity ratio of thecF (3637 cm�1) and F (3570 cm�1) bands with the energy differ-ence of both forms. The harmonically calculated energy difference
This journal is © The Royal Society of Chemistry 2019

Fig. 2 Raman jet spectra of formic acid (z0.2%) in helium recorded ata reservoir pressure of 1.0 bar with increasing nozzle temperatures of100–190 �C. Four spectral regions are covered at four temperatureswith data acquisition times between 28 and 63 minutes. Withina spectral region, the spectra have been intensity-scaled to the trans-formic acid monomer band F with the lowest concentration amongstthe four temperatures. Below each temperature series, calculated,vi(F)-scaled harmonic band positions (B3LYP-D3(BJ)/aVTZ level) of cFand F are shown.
This journal is © The Royal Society of Chemistry 2019
Edge Article Chemical Science
Ope
n A
cces
s A
rtic
le. P
ublis
hed
on 1
6 M
ay 2
019.
Dow
nloa
ded
on 1
2/25
/202
1 1:
19:4
7 A
M.
Thi
s ar
ticle
is li
cens
ed u
nder
a C
reat
ive
Com
mon
s A
ttrib
utio
n 3.
0 U
npor
ted
Lic
ence
.View Article Online
of 15.9 kJ mol�1 (B3LYP-D3(BJ)/aVTZ with zero point energycorrection) is just below the error bounds of the only experimentalvalue of 1365 � 30 cm�1 by W. Hocking.22 Neglecting differencesin the partition function of the two complexes, this corresponds toa population of 1–2% of cis-formic acid at 190 �C. Aer correctionby the theoretical cross-section ratio, the ratio of the experimentalband integrals provides a cis-abundance of 2%, thus reaffirmingthe cF assignment. The additional bands downshied comparedto the O–H stretching vibration of trans-formic acid at 3560 cm�1
and 3566 cm�1 are most likely trans-formic acid combinationbands of n2 with the lowest frequency vibrations n7 (3560 cm�1)and n9 (3566 cm
�1), which benet from the large Raman scatteringcross-section of the C–H stretching vibration. The former is ingood agreement with the predicted values of Tew and Mizukami(3566 cm�1)14 as well as Richter and Carbonniere (3558 cm�1)15
and the latter with a prediction of Tew and Mizukami,14 who re-ported (n2 + n9) in Fermi resonance with (n3 + 3n9) at 3571 cm
�1 and3579 cm�1.
The n2 region is spectrally more congested due to its lowsensitivity to hydrogen bonding. In the spectral windows 2970–2945 cm�1 and 2935–2925 cm�1, there are several bands thatdecrease in intensity with temperature, i.e., cluster bands. Thebroad underlying signal is due to rovibrational O and Sbranches of n2. As opposed to the O–H stretching region, thereare two distinct bands increasing in intensity with temperatureat 2925 cm�1 and 2873 cm�1. The latter deviates from the pre-dicted band position of cis-formic acid by 14 cm�1. The amountof cis-formic acid at 190 �C deduced from the integratedintensities of the bands amounts to 1%, which ts the energydifference, as detailed above. Therefore, the band at 2873 cm�1
can be assigned to cF. The second hot band at 2925 cm�1 isshied by �17 cm�1 from the fundamental of F (2942 cm�1).For an assignment to F, two things need to be considered:rstly, the shi directly yields the off-diagonal anharmonicityconstant x2i between n2 and a low-lying energy level vi that isthermally populated. Secondly, the intensity ratio is dependenton the Boltzmann population of that level and yields the exci-tation energy of the latter. Hence, the assignment can bechecked by comparing the experimentally determined anhar-monicity constant and intensity with the calculated values forthe lowest-lying energy levels of trans-formic acid. From theanharmonicity matrix elements in Table 1 it is apparent, thatthe hot band originating from n7 will most likely overlap withthe fundamental, whereas the hot band originating from n9 (andn6) could overlap with a cluster band at 2938 cm�1 causing thehighest nozzle temperature spectrum (red) and the lowestnozzle temperature spectrum (black) to have similar intensities.However, due to the spectral congestion in this area, reliableassignments are not feasible. Additional depolarisationmeasurements to subtract the O and S branches from the sharpQ peak are currently ongoing and will be addressed in detail ina subsequent publication. Here we focus on the straightforwardassignment of the 2925 cm�1 band. Its observed shi of�17 cm�1 perfectly matches the calculated anharmonicityconstant x28. The expected intensity ratio at 190 �C of around4% approaches the observed ratio of 3%, so that it can beassigned to n2 + n8 � n8.
Chem. Sci., 2019, 10, 6285–6294 | 6287
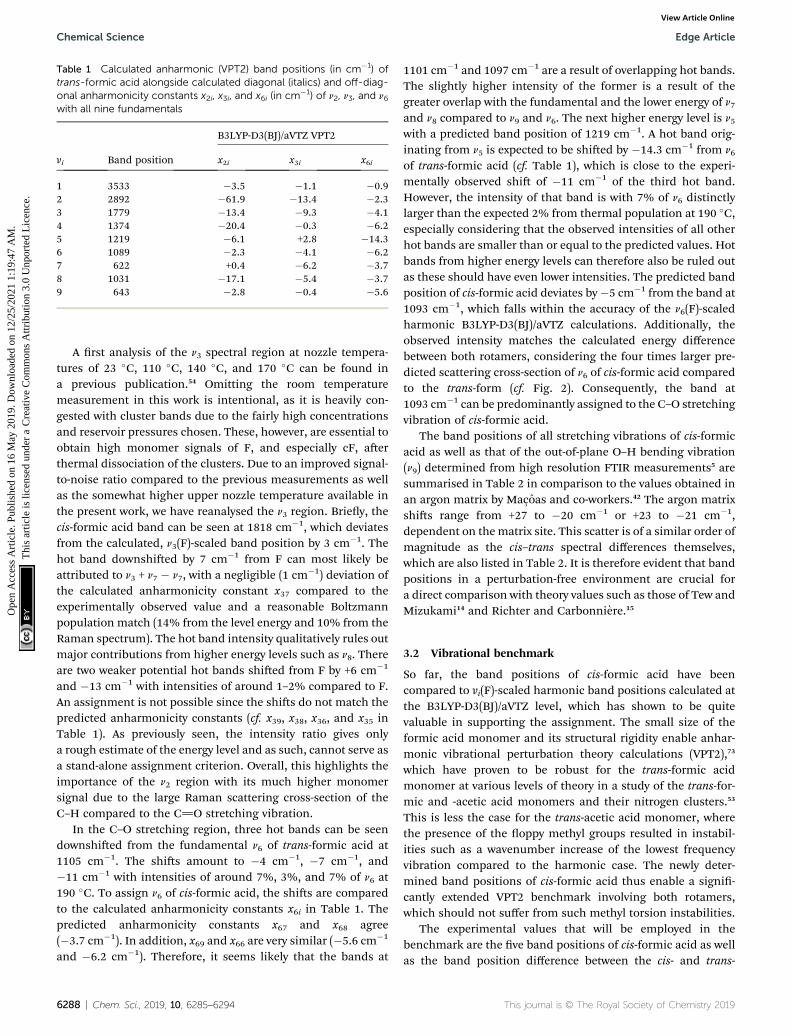
Table 1 Calculated anharmonic (VPT2) band positions (in cm�1) oftrans-formic acid alongside calculated diagonal (italics) and off-diag-onal anharmonicity constants x2i, x3i, and x6i (in cm�1) of n2, n3, and n6with all nine fundamentals
vi Band position
B3LYP-D3(BJ)/aVTZ VPT2
x2i x3i x6i
1 3533 �3.5 �1.1 �0.92 2892 �61.9 �13.4 �2.33 1779 �13.4 �9.3 �4.14 1374 �20.4 �0.3 �6.25 1219 �6.1 +2.8 �14.36 1089 �2.3 �4.1 �6.27 622 +0.4 �6.2 �3.78 1031 �17.1 �5.4 �3.79 643 �2.8 �0.4 �5.6
Chemical Science Edge Article
Ope
n A
cces
s A
rtic
le. P
ublis
hed
on 1
6 M
ay 2
019.
Dow
nloa
ded
on 1
2/25
/202
1 1:
19:4
7 A
M.
Thi
s ar
ticle
is li
cens
ed u
nder
a C
reat
ive
Com
mon
s A
ttrib
utio
n 3.
0 U
npor
ted
Lic
ence
.View Article Online
A rst analysis of the n3 spectral region at nozzle tempera-tures of 23 �C, 110 �C, 140 �C, and 170 �C can be found ina previous publication.54 Omitting the room temperaturemeasurement in this work is intentional, as it is heavily con-gested with cluster bands due to the fairly high concentrationsand reservoir pressures chosen. These, however, are essential toobtain high monomer signals of F, and especially cF, aerthermal dissociation of the clusters. Due to an improved signal-to-noise ratio compared to the previous measurements as wellas the somewhat higher upper nozzle temperature available inthe present work, we have reanalysed the n3 region. Briey, thecis-formic acid band can be seen at 1818 cm�1, which deviatesfrom the calculated, n3(F)-scaled band position by 3 cm�1. Thehot band downshied by 7 cm�1 from F can most likely beattributed to n3 + n7 � n7, with a negligible (1 cm�1) deviation ofthe calculated anharmonicity constant x37 compared to theexperimentally observed value and a reasonable Boltzmannpopulation match (14% from the level energy and 10% from theRaman spectrum). The hot band intensity qualitatively rules outmajor contributions from higher energy levels such as n8. Thereare two weaker potential hot bands shied from F by +6 cm�1
and �13 cm�1 with intensities of around 1–2% compared to F.An assignment is not possible since the shis do not match thepredicted anharmonicity constants (cf. x39, x38, x36, and x35 inTable 1). As previously seen, the intensity ratio gives onlya rough estimate of the energy level and as such, cannot serve asa stand-alone assignment criterion. Overall, this highlights theimportance of the n2 region with its much higher monomersignal due to the large Raman scattering cross-section of theC–H compared to the C]O stretching vibration.
In the C–O stretching region, three hot bands can be seendownshied from the fundamental n6 of trans-formic acid at1105 cm�1. The shis amount to �4 cm�1, �7 cm�1, and�11 cm�1 with intensities of around 7%, 3%, and 7% of n6 at190 �C. To assign n6 of cis-formic acid, the shis are comparedto the calculated anharmonicity constants x6i in Table 1. Thepredicted anharmonicity constants x67 and x68 agree(�3.7 cm�1). In addition, x69 and x66 are very similar (�5.6 cm�1
and �6.2 cm�1). Therefore, it seems likely that the bands at
6288 | Chem. Sci., 2019, 10, 6285–6294
1101 cm�1 and 1097 cm�1 are a result of overlapping hot bands.The slightly higher intensity of the former is a result of thegreater overlap with the fundamental and the lower energy of n7and n8 compared to n9 and n6. The next higher energy level is n5with a predicted band position of 1219 cm�1. A hot band orig-inating from n5 is expected to be shied by �14.3 cm�1 from n6
of trans-formic acid (cf. Table 1), which is close to the experi-mentally observed shi of �11 cm�1 of the third hot band.However, the intensity of that band is with 7% of n6 distinctlylarger than the expected 2% from thermal population at 190 �C,especially considering that the observed intensities of all otherhot bands are smaller than or equal to the predicted values. Hotbands from higher energy levels can therefore also be ruled outas these should have even lower intensities. The predicted bandposition of cis-formic acid deviates by�5 cm�1 from the band at1093 cm�1, which falls within the accuracy of the n6(F)-scaledharmonic B3LYP-D3(BJ)/aVTZ calculations. Additionally, theobserved intensity matches the calculated energy differencebetween both rotamers, considering the four times larger pre-dicted scattering cross-section of n6 of cis-formic acid comparedto the trans-form (cf. Fig. 2). Consequently, the band at1093 cm�1 can be predominantly assigned to the C–O stretchingvibration of cis-formic acid.
The band positions of all stretching vibrations of cis-formicacid as well as that of the out-of-plane O–H bending vibration(n9) determined from high resolution FTIR measurements5 aresummarised in Table 2 in comparison to the values obtained inan argon matrix by Maçoas and co-workers.42 The argon matrixshis range from +27 to �20 cm�1 or +23 to �21 cm�1,dependent on thematrix site. This scatter is of a similar order ofmagnitude as the cis–trans spectral differences themselves,which are also listed in Table 2. It is therefore evident that bandpositions in a perturbation-free environment are crucial fora direct comparison with theory values such as those of Tew andMizukami14 and Richter and Carbonniere.15
3.2 Vibrational benchmark
So far, the band positions of cis-formic acid have beencompared to vi(F)-scaled harmonic band positions calculated atthe B3LYP-D3(BJ)/aVTZ level, which has shown to be quitevaluable in supporting the assignment. The small size of theformic acid monomer and its structural rigidity enable anhar-monic vibrational perturbation theory calculations (VPT2),73
which have proven to be robust for the trans-formic acidmonomer at various levels of theory in a study of the trans-for-mic and -acetic acid monomers and their nitrogen clusters.53
This is less the case for the trans-acetic acid monomer, wherethe presence of the oppy methyl groups resulted in instabil-ities such as a wavenumber increase of the lowest frequencyvibration compared to the harmonic case. The newly deter-mined band positions of cis-formic acid thus enable a signi-cantly extended VPT2 benchmark involving both rotamers,which should not suffer from such methyl torsion instabilities.
The experimental values that will be employed in thebenchmark are the ve band positions of cis-formic acid as wellas the band position difference between the cis- and trans-
This journal is © The Royal Society of Chemistry 2019

Table 2 Band positions of the fundamentals vi of cis-formic acid(in cm�1) obtained in a supersonic jet expansion probed with Ramanspectroscopy (this work) compared to literature values
vi
Jet(thiswork) Gas phase5 Shia (cF–F) Ar matrixb,42 Matrix shic
1 3637 +67 3617.2/3615.9 �21/�212 2873 �69 2899.5/2896.3 +27/+233 1818 +41 1808.0/1806.9 �10/�114 /1391.85 1243.4/1248.96 1093 �11 1107.3/1104.6 +14/+127 662.3/662.389 493.420509(7) �147.30467(1) 502.9/505.3 �9.5/�11.9
a gas phase band position shis from the trans- to the cis-rotamer. b site1/site 2 are two dominant trapping sites. c band position shi of thevalues of both matrix sites compared to the gas phase.
Edge Article Chemical Science
Ope
n A
cces
s A
rtic
le. P
ublis
hed
on 1
6 M
ay 2
019.
Dow
nloa
ded
on 1
2/25
/202
1 1:
19:4
7 A
M.
Thi
s ar
ticle
is li
cens
ed u
nder
a C
reat
ive
Com
mon
s A
ttrib
utio
n 3.
0 U
npor
ted
Lic
ence
.View Article Online
fundamentals. The methods tested are the same as in ref. 53,namely B3LYP-D3(BJ), B2PLYP-D3(BJ), MP2, PBE0-D3(BJ),uB97-XD, M06-2X, and in addition also PM3, all as imple-mented in Gaussian 09.61 For all methods, an augmentedquadruple-zeta (aVQZ) basis set has been used. Additionalaugmented double-zeta (aVDZ) and triple-zeta (aVTZ) calcula-tions have been performed for MP2 and B2PLYP-D3(BJ). Thebenchmarking plots can be found in Fig. 3. The accuracy of theband positions with the Raman set-up used in this work is about1 cm�1 (ref. 60) and the full width at half maximum of all bandsis around 2 cm�1, leading to a conservative error estimate of�2 cm�1 for the band positions and twice the amount for theshi. The green ellipsis in each plot thus shows the area that isin acceptable agreement with experiment. Since n9 has beenmeasured with high resolution FTIR spectroscopy with a preci-sion on the order of �10�5 cm�1 and a somewhat lower accu-racy,5,44 a green arrow points towards the exact band positionand shi in the bottom panel of Fig. 3. Additionally, the resultsof Tew and Mizukami (T & M)14 and Richter and Carbonniere (R& C)15 have been included for all vibrations. Briey, Tew andMizukami have tted a potential energy surface based on 17 076energies calculated at the CCSD(T)(F12*)/cc-pVTZ-F12 level. Thevibrational levels were obtained by using vibrational congu-ration interaction (VCI) with an internal coordinate pathHamiltonian for the isomerisation path connecting bothrotamers.14 Richter and Carbonniere have constructed a valencecoordinate potential energy surface at the CCSD(T)-F12a/aug-cc-pVTZ level and carried out the vibrational energy calculationswith the improved relaxation multi-conguration time-dependent Hartree (MCTDH) method.15
Firstly, the performance of VPT2 calculations at variouslevels of theory will be discussed before these will be comparedwith the VCI andMCTDH calculations. One should note that forthe O–H stretching vibration this comparison can solely bemade with the MCTDH calculations, as the theoretical bandposition of the cis O–H stretching vibration has not been re-ported by Tew and Mizukami. Due to error compensation,
This journal is © The Royal Society of Chemistry 2019
a better agreement between experiment and the tested methodsis typically achieved for the shi between the cis- and trans-rotamers. The absolute band position is predicted correctly intwo cases, namely with MP2/aVTZ and MP2/aVQZ for the C–Ostretching vibration (n6). All other methods fail to predict the cis-formic acid band positions correctly despite generous experi-mental error bars for the stretching vibrations. An accurateprediction of n9 (and the respective shi) is evidently unrealisticdue to the high accuracy of the high resolution measurements.The lower resolution Raman spectra are seen to be fullyadequate to challenge theory on an absolute wavenumber scale.The vibrations where the shi is predicted within the experi-mental error for most methods are the C]O and C–O stretchingvibrations, whereas the largest divergence is observed for theC–H stretching vibration. This is not surprising as the C–Hstretching vibration is prone to stretch-bend Fermi resonance,although the VPT2 code employed61 attempts to include suchpronounced resonances. Consequently, part of the discrepancymay be due to a poor vibrational description by VPT2 ratherthan the electronic structure calculation. The particularlydrastic failure for M06-2X is caused by an inversion of the pre-dicted energy sequence for the C–H stretch fundamental andC–H bending overtone of cis-formic acid, which is amplied byFermi resonance. If the band labels are switched, the agreementincreases signicantly – the severe underestimation of the bandposition of �142 cm�1 (Fig. 3) changes to an overestimation of+10 cm�1. The band position shi improves from �186 cm�1
(Fig. 3) to �34 cm�1, compared to the experimental value of�69 cm�1.
A comparison of the vibrationally averaged, calculated rota-tional constants for all methods with the experimental valuesfor cis-formic acid obtained by Winnewisser and co-workers39 isshown in Table 3. Small individual deviations on the order of�0.5% are observed for B2PLYP-D3(BJ), B3LYP-D3(BJ), andMP2, larger deviations of up to 1–2% for M06-2X, uB97-XD, andPBE0-D3(BJ), and very large deviations for PM3. The averagedeviation over all three rotational constants (last row in Table 3)supports the overall agreement with the experimental structure.The B3LYP-D3(BJ) structure shows the best agreement witha divergence of �0.1%, directly followed by B2PLYP-D3(BJ)(�0.3%). For MP2, the divergence is slightly larger as all rota-tional constants are underestimated and thus, do notcompensate each other. The same is valid for M06-2X, uB97D,and PBE0-D3(BJ), where all constants are overestimated.
A comparison of the individual performance of the methodsfor the determination of ~ni(cF) and D~ni(cF–F) clearly illustratesthat there are few reliable methods. In case of PM3, this is notsurprising. It is the only method that fails to predict the ener-getic order of the vibrations correctly with n4 and n6 switched.Other methods with particularly severe deviations from experi-ment are uB97-XD (cf. n1 and n9) and M06-2X (n1, n2, and n9). Thelarge underestimation of ~n2(cF) and D~n2(cF–F) of M06-2X isenhanced by a level switch between resonance partners, asdiscussed above. All other methods predict the correct sequenceof fundamental and overtone. Another numerical or funda-mental deciency of M06-2X/aVQZ VPT2 is the incorrect sign ofthe total anharmonicity of n9 of cis-formic acid, which gives rise
Chem. Sci., 2019, 10, 6285–6294 | 6289
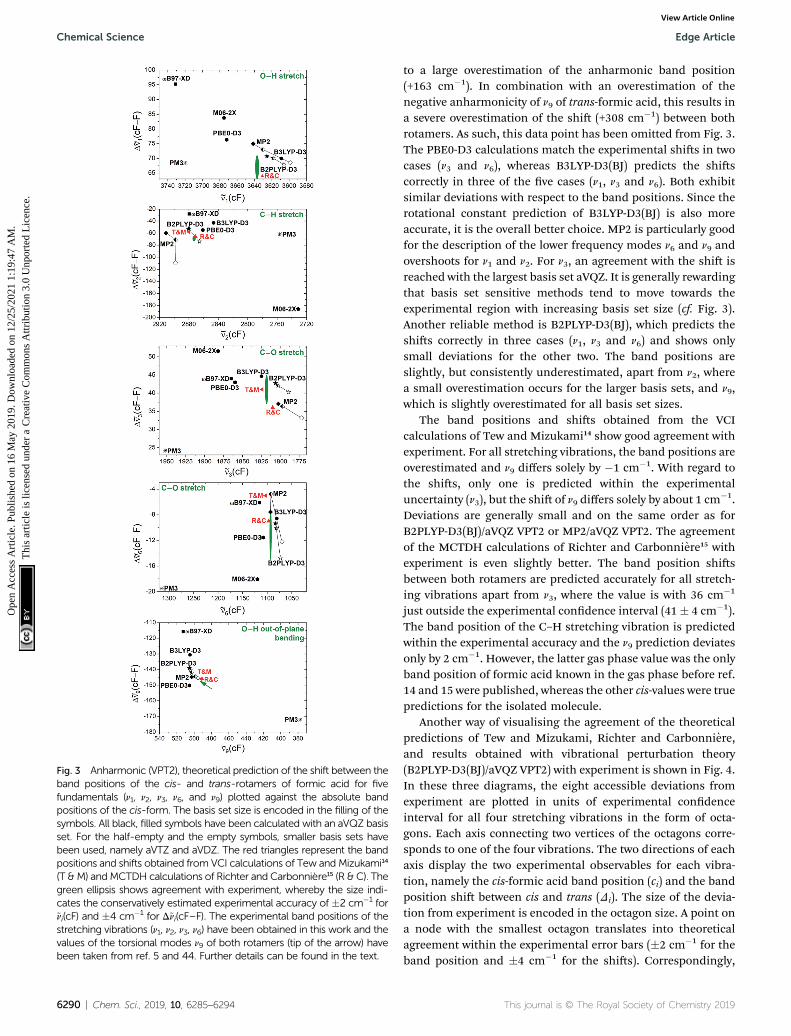
Fig. 3 Anharmonic (VPT2), theoretical prediction of the shift between theband positions of the cis- and trans-rotamers of formic acid for fivefundamentals (n1, n2, n3, n6, and n9) plotted against the absolute bandpositions of the cis-form. The basis set size is encoded in the filling of thesymbols. All black, filled symbols have been calculated with an aVQZ basisset. For the half-empty and the empty symbols, smaller basis sets havebeen used, namely aVTZ and aVDZ. The red triangles represent the bandpositions and shifts obtained from VCI calculations of Tew andMizukami14
(T &M) andMCTDH calculations of Richter and Carbonniere15 (R & C). Thegreen ellipsis shows agreement with experiment, whereby the size indi-cates the conservatively estimated experimental accuracy of �2 cm�1 for~ni(cF) and �4 cm�1 for D~ni(cF–F). The experimental band positions of thestretching vibrations (n1, n2, n3, n6) have been obtained in this work and thevalues of the torsional modes n9 of both rotamers (tip of the arrow) havebeen taken from ref. 5 and 44. Further details can be found in the text.
6290 | Chem. Sci., 2019, 10, 6285–6294
Chemical Science Edge Article
Ope
n A
cces
s A
rtic
le. P
ublis
hed
on 1
6 M
ay 2
019.
Dow
nloa
ded
on 1
2/25
/202
1 1:
19:4
7 A
M.
Thi
s ar
ticle
is li
cens
ed u
nder
a C
reat
ive
Com
mon
s A
ttrib
utio
n 3.
0 U
npor
ted
Lic
ence
.View Article Online
to a large overestimation of the anharmonic band position(+163 cm�1). In combination with an overestimation of thenegative anharmonicity of n9 of trans-formic acid, this results ina severe overestimation of the shi (+308 cm�1) between bothrotamers. As such, this data point has been omitted from Fig. 3.The PBE0-D3 calculations match the experimental shis in twocases (n3 and n6), whereas B3LYP-D3(BJ) predicts the shiscorrectly in three of the ve cases (n1, n3 and n6). Both exhibitsimilar deviations with respect to the band positions. Since therotational constant prediction of B3LYP-D3(BJ) is also moreaccurate, it is the overall better choice. MP2 is particularly goodfor the description of the lower frequency modes n6 and n9 andovershoots for n1 and n2. For n3, an agreement with the shi isreached with the largest basis set aVQZ. It is generally rewardingthat basis set sensitive methods tend to move towards theexperimental region with increasing basis set size (cf. Fig. 3).Another reliable method is B2PLYP-D3(BJ), which predicts theshis correctly in three cases (n1, n3 and n6) and shows onlysmall deviations for the other two. The band positions areslightly, but consistently underestimated, apart from n2, wherea small overestimation occurs for the larger basis sets, and n9,which is slightly overestimated for all basis set sizes.
The band positions and shis obtained from the VCIcalculations of Tew and Mizukami14 show good agreement withexperiment. For all stretching vibrations, the band positions areoverestimated and n9 differs solely by �1 cm�1. With regard tothe shis, only one is predicted within the experimentaluncertainty (n3), but the shi of n9 differs solely by about 1 cm
�1.Deviations are generally small and on the same order as forB2PLYP-D3(BJ)/aVQZ VPT2 or MP2/aVQZ VPT2. The agreementof the MCTDH calculations of Richter and Carbonniere15 withexperiment is even slightly better. The band position shisbetween both rotamers are predicted accurately for all stretch-ing vibrations apart from n3, where the value is with 36 cm�1
just outside the experimental condence interval (41� 4 cm�1).The band position of the C–H stretching vibration is predictedwithin the experimental accuracy and the n9 prediction deviatesonly by 2 cm�1. However, the latter gas phase value was the onlyband position of formic acid known in the gas phase before ref.14 and 15 were published, whereas the other cis-values were truepredictions for the isolated molecule.
Another way of visualising the agreement of the theoreticalpredictions of Tew and Mizukami, Richter and Carbonniere,and results obtained with vibrational perturbation theory(B2PLYP-D3(BJ)/aVQZ VPT2) with experiment is shown in Fig. 4.In these three diagrams, the eight accessible deviations fromexperiment are plotted in units of experimental condenceinterval for all four stretching vibrations in the form of octa-gons. Each axis connecting two vertices of the octagons corre-sponds to one of the four vibrations. The two directions of eachaxis display the two experimental observables for each vibra-tion, namely the cis-formic acid band position (ci) and the bandposition shi between cis and trans (Di). The size of the devia-tion from experiment is encoded in the octagon size. A point ona node with the smallest octagon translates into theoreticalagreement within the experimental error bars (�2 cm�1 for theband position and �4 cm�1 for the shis). Correspondingly,
This journal is © The Royal Society of Chemistry 2019

Table 3 Relative deviations (in %) of VPT2 (aVQZ) rotational constants of cis-formic acid from the experimental values of Winnewisser and co-workers39
B2PLYP-D3(BJ) B3LYP-D3(BJ) MP2 M06-2X uB97-XD PBE0-D3(BJ) PM3
DA0/A0 +0.1 +0.4 �0.3 +1.4 +1.2 +1.1 �18.9DB0/B0 �0.5 �0.3 �0.5 +0.6 +0.6 +0.6 +9.8DC0/C0 �0.4 �0.3 �0.5 +0.7 +0.6 +0.6 +5.31
3ðDA0=A0 þ DB0=B0 þ DC0=C0Þ �0.3 �0.1 �0.4 +0.9 +0.8 +0.8 �1.3
Edge Article Chemical Science
Ope
n A
cces
s A
rtic
le. P
ublis
hed
on 1
6 M
ay 2
019.
Dow
nloa
ded
on 1
2/25
/202
1 1:
19:4
7 A
M.
Thi
s ar
ticle
is li
cens
ed u
nder
a C
reat
ive
Com
mon
s A
ttrib
utio
n 3.
0 U
npor
ted
Lic
ence
.View Article Online
a point on a node with the nth octagon implies a deviation ofthat value by up to n condence intervals from experiment. Thepredicted band position for the C]O stretching vibration of cis-formic acid by Tew and Mizukami (1824 cm�1)14 deviates by+6 cm�1 from the Raman jet value of 1818 cm�1. Consideringthe experimental condence interval of�2 cm�1, the predictionfor c3 lies on the third octagon, or in other words, three nodesaway from the origin on the c3 axis. Note that the origin in thesediagrams cannot be met due to the experimental uncertainty.The sign of the deviation is illustrated by the colour shade of thesymbol, whereby a dark colour shows over- and a light colourunderestimation. The intermediate shade represents an inde-terminate sign of the deviation, which can be seen for the shiof the C]O stretching vibration D3 of Tew and Mizukami. Theaforementioned consistent overestimation of the VCI calcula-tions of Tew and Mizukami (T & M) (apart from D3) can thus bedirectly seen by the otherwise dark-coloured symbols. TheMCTDH method of Richter and Carbonniere falls closer to theorigin and varies more in sign. Therefore, it shows superioragreement with experiment compared to the results of Tew andMizukami. The tendency of the B2PLYP-D3(BJ)/aVQZ VPT2calculations to underestimate the band position ci as well as itsability to predict most shis within the experimental accuracy(smallest octagon) is illustrated. Altogether, Fig. 4 nicely sumsup that the MCTDH method utilised by Richter and
Fig. 4 Agreement of the predicted anharmonic band positions of the stshifts between cis- and trans-formic acid (D1,2,3,6) with experiment. Texperimental confidence interval, i.e., the smallest octagon represents a(green ellipses in Fig. 3) and the nth octagon agreement within n experimof Tew and Mizukami (T & M),14 the MCTDH calculations of Richter and CaaVQZ level. The symbols used are the same as in Fig. 3. The color shaunderestimated (�), or met.
This journal is © The Royal Society of Chemistry 2019
Carbonniere offers a slightly better description of the vibrationsscrutinised here. The VPT2 calculations at the B2PLYP-D3(BJ)/aVQZ level are seen to provide a less expensive alternative.This good performance of the double hybrid functional hasrecently been illustrated for pyruvic acid by Barone et al.75 Forformic acid, there are some interesting systematic errors, whichhave consequences when looking at matrix isolation spectros-copy. Supercially and surprisingly, the comparison of VPT2anharmonic data for trans-formic acid only improves slightlywhen moving from a matrix to the gas phase.12 This is largelydue to substantial downshis of polar (O–H, C]O) stretchingvibrations in an Ar matrix, which mimic the underestimation ofthese vibrations by the B2PLYP functional in the gas phase.Such good agreements for the wrong reason must be avoided inproper benchmarking. Only the gas phase comparison canprovide a realistic picture of the electronic structureperformance.
With regard to the previous assignment of hot bands oftrans-formic acid, the coupling constants to levels with signi-cant thermal population at 190 �C predicted with B3LYP-D3(BJ)/aVTZ (see Table 1) are in good agreement with those at theB2PLYP-D3(BJ)/aVQZ VPT2 level. The largest discrepancyamounts to 0.6 cm�1 (x36), which is below the spectral resolu-tion of the Raman experiment.
retching vibrations of cis-formic acid (c1,2,3,6) as well as band positionhe octagon size displays the deviation from experiment in units ofgreement within the error bars of �2 cm�1 for ci and �4 cm�1 for Di
ental confidence intervals. The methods tested are the VCI calculationsrbonniere (R & C),15 as well as VPT2 calculations at the B2PLYP-D3(BJ)/de shows whether the experimental observable is overestimated (+),
Chem. Sci., 2019, 10, 6285–6294 | 6291

Fig. 5 Mean absolute deviations (MAD, in cm�1) of anharmonically(VPT2) calculated band positions of the stretching vibrations (n1, n2, n3,and n6) and the O–H out-of-plane bending vibration (n9) of cis- andtrans-formic acid resulting from the usage of symmetry (Cs) comparedto no symmetry (C1) or the increase of the DFT integration grid size(super fine integration grid compared to the ultra fine integration grid),as implemented in Gaussian 09.61
Chemical Science Edge Article
Ope
n A
cces
s A
rtic
le. P
ublis
hed
on 1
6 M
ay 2
019.
Dow
nloa
ded
on 1
2/25
/202
1 1:
19:4
7 A
M.
Thi
s ar
ticle
is li
cens
ed u
nder
a C
reat
ive
Com
mon
s A
ttrib
utio
n 3.
0 U
npor
ted
Lic
ence
.View Article Online
3.3 Instabilities of DFT functionals
As previously mentioned in Section 2.2, all production calcula-tions have been carried out without the use of symmetry usingthe pruned ultra ne integration grid of Gaussian 09.61 Toexplore the inuence of symmetry and grid size, additionalcalculations have been performed exploiting the Cs symmetryand a ner integration grid (super ne integration grid,(150 974)).61 For the following analysis, the ve vibrations dis-cussed in this work have been considered for both rotamers,i.e., 10 values.
All density functional theory methods show deviations foranharmonic frequency (VPT2) calculations with and without theuse of symmetry when the integration grid size is kept constant,whereas the results obtained with PM3 and MP2 have a negli-gible (#0.2 cm�1) dependence on symmetry. The size of thedeviation depends largely on the density functional theorymethod used as well as on the vibration. The most sensitivevibrations of the fundamentals discussed in this work are theO–H stretching (n1) and out-of-plane bending vibration (n9),while the smallest deviations are observed for the C]O (n3) andC–O stretching vibrations (n6). For B3LYP-D3(BJ), B2PLYP-D3(BJ), and PBE0-D3(BJ), these deviations are below�10 cm�1, withmean absolute deviations of 2.5 cm�1, 1.7 cm�1,and 2.1 cm�1 for the ultra ne integration grid, respectively.Particularly severe divergence is observed for uB97-XD andM06-2X with discrepancies of up to �96 cm�1 and 133 cm�1,respectively. The mean absolute deviations for these methodsare as large as 30.2 cm�1 (uB97-XD) and 59.5 cm�1 (M06-2X).These can be reduced by using the ner integration grid(super ne integration grid). This is illustrated in Fig. 5, wherethe mean absolute deviation of the band positions using C1 andCs symmetry is plotted for both grid sizes (black and bluesquares). This decrease in divergence, however, occurs at theexpense of distinctly higher computational costs. In case ofuB97-XD and M06-2X, this leads to an mean absolute deviationof 2.8 cm�1 and 48.0 cm�1. The large value for M06-2X is causedby outliers where the deviation between calculations with Cs
and C1 symmetry is enhanced by using the ner grid (n9(cF, F)and n6(cF)).
When just the integration grid is varied and the symmetry iskept xed (either C1 or Cs), the band positions vary on averagebetween 1–2 cm�1 for B3LYP-D3(BJ), B2PLYP-D3(BJ), and PBE0-D3(BJ). This is on the same order of magnitude as the symmetryeffects discussed above. Again, a huge impact of the integrationgrid size is seen for uB97-XD and M06-2X, where mean absolutedeviations of 28.6 cm�1 and up to 63.5 cm�1 are observed (cf.orange and green points in Fig. 5). In both cases, the deviationsare larger for the Cs symmetry, whereas for the other methods, itis the other way around.
Altogether, these symmetry and integration grid sizedependent variations in anharmonic band positions of thefundamentals of cis- and trans-formic acid are on the order ofmagnitude of the experimental error bars for B3LYP-D3(BJ),B2PLYP-D3(BJ), and PBE0-D3(BJ). Nonetheless, one shouldkeep in mind that individual outliers are slightly larger.Anharmonic frequency calculations with uB97-XD and M06-2X
6292 | Chem. Sci., 2019, 10, 6285–6294
on the other hand, show substantial differences with regard tothe symmetry and integration grid chosen, so that these resultsmust be viewed with caution, as has been discussed before.76,77
For most methods, the best agreement with experiment isachieved with the Cs symmetry and the ner integration grid.Since the improvement of the accuracy is below the experi-mental condence interval for the more reliable DFT methods,if present at all, Fig. 3 and 4 would only change slightly.
4 Conclusions
Overall, thermal excitation combined with rapid jet quenchingand Raman probing as reported in this work provides access tothe four stretching vibrations of cis-formic acid in a perturba-tion-free environment. These reference data points are essen-tial for the validation and comparison of modern quantumchemical methods towards a more global description of thismodel system. Recent examples are VCI calculations of Tew andMizukami14 and MCTDH calculations of Richter and Carbon-niere.15 However, it was also shown that vibrational perturba-tion theory can be a good compromise between accuracy andcomputational costs for a reasonably rigid molecule like formicacid, if combined with an adequate method for the electronicstructure calculation. In this case, the double hybrid methodB2PLYP-D3(BJ)/aVQZ and MP2/aVQZ offer a good compromisebetween accuracy and cost efficiency, in particular for differ-ences between corresponding cis- and trans-vibrations. Abenchmark examining various levels of theory revealed thefailure of methods like M06-2X/aVQZ VPT2 or uB97-XD/aVQZVPT2 to give consistent results, partly due to numerical gridsize and symmetry sensitivity. With the single gas phase valuefrom 2006 (ref. 5) available up to a year ago, these conclusionscould not have been drawn. A side effect of the thermal pop-ulation of cis-formic acid is the signicant enhancement of hotbands of trans-formic acid compared to room temperaturespectra. The anharmonicity constants that can be deduced from
This journal is © The Royal Society of Chemistry 2019

Edge Article Chemical Science
Ope
n A
cces
s A
rtic
le. P
ublis
hed
on 1
6 M
ay 2
019.
Dow
nloa
ded
on 1
2/25
/202
1 1:
19:4
7 A
M.
Thi
s ar
ticle
is li
cens
ed u
nder
a C
reat
ive
Com
mon
s A
ttrib
utio
n 3.
0 U
npor
ted
Lic
ence
.View Article Online
these can help to validate combination band assignments,which are in some cases still under debate.15 Finally, furtherexperiments such as deuteration or depolarisation experimentswill help to shed more light on various debates surroundingtrans-formic acid. A prominent example is the assignment of n5and the overtone 2n9, where calculations of Tew andMizukami14
and Richter and Carbonniere15 disagree with the experimental,infrared spectroscopic assignments of Freytes and co-workers37
as well as Raman spectra of Bertie and Michaelian.27 AdditionalRaman data recorded in the fashion shown here, i.e., incombination with thermal excitation, show a distinctly higherintensity for the band previously assigned to the overtone of n9(1305 cm�1 (ref. 37)) compared to n5 (1223 cm�1 (ref. 37)),making this a fascinating disagreement of IR and Ramanintensity patterns to be resolved.8,45 Indeed, a very recent IRinvestigation55 points into the same direction.
Conflicts of interest
There are no conicts to declare.
Acknowledgements
The authors would like to thank A. Nejad for very valuablediscussions and T. Forsting for the construction of the heatablefeed line. This work was funded by the Deutsche For-schungsgemeinscha (DFG, German Research Foundation) –
389479699/GRK2455.
Notes and references
1 J. M. Bowman, T. Carrington and H.-D. Meyer, Mol. Phys.,2008, 106, 2145–2182.
2 Z. Bacic and J. C. Light, J. Chem. Phys., 1987, 86, 3065–3077.3 G. E. Scuseria and H. F. Schaefer, J. Chem. Phys., 1989, 90,3629–3636.
4 J. Altnoder, K. Kruger, D. Borodin, L. Reuter, D. Rohleder,F. Hecker, R. A. Schulz, X. T. Nguyen, H. Preiß, M. Eckhoff,M. Levien and M. A. Suhm, Chem. Rec., 2014, 14, 1116–1133.
5 O. I. Baskakov, V.-M. Horneman, J. Lohilahti and S. Alanko, J.Mol. Struct., 2006, 795, 49–53.
6 C. W. Bock, M. Trachtman and P. George, J. Mol. Spectrosc.,1980, 80, 131–144.
7 I. Yokoyama, Y. Miwa and K. Machida, J. Phys. Chem., 1991,95, 9740–9746.
8 J. Demaison, M. Herman and J. Lievin, J. Chem. Phys., 2007,126, 164305.
9 Y. Scribano and D. M. Benoit, J. Chem. Phys., 2007, 127,164118.
10 S. Maeda, Y. Watanabe and K. Ohno, J. Chem. Phys., 2008,128, 144111.
11 L. O. Paulson, J. Kaminsky, D. T. Anderson, P. Bour andJ. Kubelka, J. Chem. Theory Comput., 2010, 6, 817–827.
12 V. Barone, M. Biczysko and J. Bloino, Phys. Chem. Chem.Phys., 2014, 16, 1759–1787.
13 M. Tsuge and L. Khriachtchev, J. Phys. Chem. A, 2015, 119,2628–2635.
This journal is © The Royal Society of Chemistry 2019
14 D. P. Tew and W. Mizukami, J. Phys. Chem. A, 2016, 120,9815–9828.
15 F. Richter and P. Carbonniere, J. Chem. Phys., 2018, 148,064303.
16 J. K. Wilmshurst, J. Chem. Phys., 1956, 25, 478–480.17 R. C. Millikan and K. S. Pitzer, J. Chem. Phys., 1957, 27, 1305–
1308.18 R. G. Lerner, B. P. Dailey and J. P. Friend, J. Chem. Phys.,
1957, 26, 680–683.19 K. Hirota and Y. Nakai, Bull. Chem. Soc. Jpn., 1959, 32, 769–
771.20 B. Zuckerman, J. A. Ball and C. A. Gottlieb, Astrophys. J., 1971,
163, L41.21 I. C. Hisatsune and J. Heicklen, Can. J. Spectrosc., 1973, 18,
135–142.22 W. H. Hocking, Z. Naturforsch., A, 1976, 31, 1113–1121.23 R. L. Redington, J. Mol. Spectrosc., 1977, 65, 171–189.24 E. Bjarnov and W. H. Hocking, Z. Naturforsch., A, 1978, 33,
610–618.25 E. Willemot, D. Dangoisse and J. Bellet, J. Mol. Spectrosc.,
1978, 73, 96–119.26 J.-C. Deroche, J. Kauppinen and E. Kyro, J. Mol. Spectrosc.,
1979, 78, 379–394.27 J. E. Bertie and K. H. Michaelian, J. Chem. Phys., 1982, 76,
886.28 J. E. Bertie, K. H. Michaelian, H. H. Eysel and D. Hager, J.
Chem. Phys., 1986, 85, 4779–4789.29 L. Nemes, A. R. W. McKellar and J. W. C. Johns, J. Opt. Soc.
Am. B, 1987, 4, 1165.30 Y. Marechal, J. Chem. Phys., 1987, 87, 6344.31 W. H. Weber, P. D. Maker, J. Johns and E. Weinberger, J. Mol.
Spectrosc., 1987, 121, 243–260.32 R. E. Bumgarner, J.-I. Choe, S. G. Kukolich and R. J. Butcher,
J. Mol. Spectrosc., 1988, 132, 261–276.33 J. D. Goddard, Y. Yamaguchi and H. F. Schaefer, J. Chem.
Phys., 1992, 96, 1158–1166.34 G. Luiz, A. Scalabrin and D. Pereira, Infrared Phys. Technol.,
1997, 38, 45–49.35 M. Pettersson, J. Lundell, L. Khriachtchev andM. Rasanen, J.
Am. Chem. Soc., 1997, 119, 11715–11716.36 D. Hurtmans, F. Herregodts, M. Herman, J. Lievin,
A. Campargue, A. Garnache and A. A. Kachanov, J. Chem.Phys., 2000, 113, 1535–1545.
37 M. Freytes, D. Hurtmans, S. Kassi, J. Lievin, J. VanderAuwera, A. Campargue and M. Herman, Chem. Phys., 2002,283, 47–61.
38 F. Madeja, P. Markwick, M. Havenith, K. Nauta andR. E. Miller, J. Chem. Phys., 2002, 116, 2870–2878.
39 M. Winnewisser, B. P. Winnewisser, M. Stein, M. Birk,G. Wagner, G. Winnewisser, K. M. Yamada, S. P. Belov andO. I. Baskakov, J. Mol. Spectrosc., 2002, 216, 259–265.
40 A. Perrin, J.-M. Flaud, B. Bakri, J. Demaison, O. Baskakov,S. Sirota, M. Herman and J. Auwera, J. Mol. Spectrosc.,2002, 216, 203–213.
41 M. Pettersson, E. M. S. Maçoas, L. Khriachtchev, J. Lundell,R. Fausto and M. Rasanen, J. Chem. Phys., 2002, 117, 9095–9098.
Chem. Sci., 2019, 10, 6285–6294 | 6293

Chemical Science Edge Article
Ope
n A
cces
s A
rtic
le. P
ublis
hed
on 1
6 M
ay 2
019.
Dow
nloa
ded
on 1
2/25
/202
1 1:
19:4
7 A
M.
Thi
s ar
ticle
is li
cens
ed u
nder
a C
reat
ive
Com
mon
s A
ttrib
utio
n 3.
0 U
npor
ted
Lic
ence
.View Article Online
42 E. M. Maçoas, J. Lundell, M. Pettersson, L. Khriachtchev,R. Fausto and M. Rasanen, J. Mol. Spectrosc., 2003, 219,70–80.
43 F. Madeja, A. Hecker, S. Ebbinghaus and M. Havenith,Spectrochim. Acta, Part A, 2003, 59, 1773–1782.
44 O. I. Baskakov, E. A. Alekseev, R. A. Motiyenko, J. Lohilahti,V.-M. Horneman, S. Alanko, B. P. Winnewisser,I. R. Medvedev and F. C. de Lucia, J. Mol. Spectrosc., 2006,240, 188–201.
45 O. I. Baskakov, I. A. Markov, E. A. Alekseev, R. A. Motiyenko,J. Lohilahti, V.-M. Horneman, B. P. Winnewisser,I. R. Medvedev and F. C. de Lucia, J. Mol. Struct., 2006,795, 54–77.
46 O. I. Baskakov, B. P. Winnewisser, I. R. Medvedev andF. C. de Lucia, J. Mol. Struct., 2006, 795, 42–48.
47 A. Perrin, J. Vander Auwera and Z. Zelinger, J. Quant.Spectrosc. Radiat. Transfer, 2009, 110, 743–755.
48 A. Olbert-Majkut, J. Ahokas, J. Lundell and M. Pettersson,Chem. Phys. Lett., 2009, 468, 176–183.
49 A. Domanskaya, K. Marushkevich, L. Khriachtchev andM. Rasanen, J. Chem. Phys., 2009, 130, 154509.
50 K. Marushkevich, L. Khriachtchev, J. Lundell,A. V. Domanskaya and M. Rasanen, J. Mol. Spectrosc., 2010,259, 105–110.
51 M. Hakala, K. Marushkevich, L. Khriachtchev,K. Hamalainen and M. Rasanen, J. Chem. Phys., 2011, 134,054506.
52 L. O. Paulson, D. T. Anderson, J. Lundell, K. Marushkevich,M. Melavuori and L. Khriachtchev, J. Phys. Chem. A, 2011,115, 13346–13355.
53 S. Oswald, E. Meyer and M. A. Suhm, J. Phys. Chem. A, 2018,122, 2933–2946.
54 K. A. E. Meyer and M. A. Suhm, J. Chem. Phys., 2018, 149,104307.
55 K. Hull, T. Wells, B. E. Billinghurst, H. Bunn andP. L. Raston, AIP Adv., 2019, 9, 015021.
56 S. Cuadrado, J. R. Goicoechea, O. Roncero, A. Aguado,B. Tercero and J. Cernicharo, Astron. Astrophys., 2016, 596,L1.
57 L. Khriachtchev, M. Pettersson andM. Rasanen, J. Am. Chem.Soc., 2002, 124, 10994–10995.
58 S. Ataka, H. Takeuchi and M. Tasumi, J. Mol. Struct., 1984,113, 147–160.
59 L. Khriachtchev, M. Pettersson and R. B. Gerber, J. Phys.Chem. A, 2015, 119, 2187–2190.
60 T. Forsting, H. C. Gottschalk, B. Hartwig, M. Mons andM. A. Suhm, Phys. Chem. Chem. Phys., 2017, 19, 10727–10737.
6294 | Chem. Sci., 2019, 10, 6285–6294
61 M. J. Frisch, G. W. Trucks, H. B. Schlegel, G. E. Scuseria,M. A. Robb, J. R. Cheeseman, G. Scalmani, V. Barone,B. Mennucci, G. A. Petersson, H. Nakatsuji, M. Caricato,X. Li, H. P. Hratchian, A. F. Izmaylov, J. Bloino, G. Zheng,J. L. Sonnenberg, M. Hada, M. Ehara, K. Toyota,R. Fukuda, J. Hasegawa, M. Ishida, T. Nakajima, Y. Honda,O. Kitao, H. Nakai, T. Vreven, J. A. Montgomery Jr,J. E. Peralta, F. Ogliaro, M. Bearpark, J. J. Heyd,E. Brothers, K. N. Kudin, V. N. Staroverov, R. Kobayashi,J. Normand, K. Raghavachari, A. Rendell, J. C. Burant,S. S. Iyengar, J. Tomasi, M. Cossi, N. Rega, J. M. Millam,M. Klene, J. E. Knox, J. B. Cross, V. Bakken, C. Adamo,J. Jaramillo, R. Gomperts, R. E. Stratmann, O. Yazyev,A. J. Austin, R. Cammi, C. Pomelli, J. W. Ochterski,R. L. Martin, K. Morokuma, V. G. Zakrzewski, G. A. Voth,P. Salvador, J. J. Dannenberg, S. Dapprich, A. D. Daniels,O. Farkas, J. B. Foresman, J. V. Ortiz, J. Cioslowski andD. J. Fox, Gaussian 09 Revision E.01, 2009.
62 A. D. Becke, J. Chem. Phys., 1993, 98, 5648.63 C. Lee, W. Yang and R. G. Parr, Phys. Rev. B: Condens. Matter
Mater. Phys., 1988, 37, 785–789.64 S. Grimme, J. Chem. Phys., 2006, 124, 034108.65 C. Møller and M. S. Plesset, Phys. Rev., 1934, 46, 618–622.66 M. Head-Gordon, J. A. Pople and M. J. Frisch, Chem. Phys.
Lett., 1988, 153, 503–506.67 Y. Zhao and D. G. Truhlar, Theor. Chem. Acc., 2008, 120, 215–
241.68 J.-D. Chai and M. Head-Gordon, Phys. Chem. Chem. Phys.,
2008, 10, 6615–6620.69 C. Adamo and V. Barone, J. Chem. Phys., 1999, 110, 6158–
6170.70 J. J. P. Stewart, J. Comput. Chem., 1989, 10, 209–220.71 J. J. P. Stewart, J. Comput. Chem., 1989, 10, 221–264.72 S. Grimme, Wiley Interdiscip. Rev.: Comput. Mol. Sci., 2011, 1,
211–228.73 J. Bloino and V. Barone, J. Chem. Phys., 2012, 136, 124108.74 N. O. B. Luttschwager and M. A. Suhm, SoMatter, 2014, 10,
4885–4901.75 V. Barone, M. Biczysko, J. Bloino, P. Cimino, E. Penocchio
and C. Puzzarini, J. Chem. Theory Comput., 2015, 11, 4342–4363.
76 S. E. Wheeler and K. N. Houk, J. Chem. Theory Comput., 2010,6, 395–404.
77 N. Mardirossian and M. Head-Gordon, J. Chem. TheoryComput., 2016, 12, 4303–4325.
This journal is © The Royal Society of Chemistry 2019