Stress-Strain Evolution During Peak-Ring Formation: A Case ...
23
HAL Id: hal-02128150 https://hal.umontpellier.fr/hal-02128150 Submitted on 14 May 2019 HAL is a multi-disciplinary open access archive for the deposit and dissemination of sci- entific research documents, whether they are pub- lished or not. The documents may come from teaching and research institutions in France or abroad, or from public or private research centers. L’archive ouverte pluridisciplinaire HAL, est destinée au dépôt et à la diffusion de documents scientifiques de niveau recherche, publiés ou non, émanant des établissements d’enseignement et de recherche français ou étrangers, des laboratoires publics ou privés. Stress-Strain Evolution During Peak-Ring Formation: A Case Study of the Chicxulub Impact Structure Auriol Rae, Gareth Collins, Michael Poelchau, Ulrich Riller, Thomas Davison, Richard Grieve, Gordon Osinski, Joanna Morgan, S. P. S. Gulick, Elise Chenot, et al. To cite this version: Auriol Rae, Gareth Collins, Michael Poelchau, Ulrich Riller, Thomas Davison, et al.. Stress-Strain Evolution During Peak-Ring Formation: A Case Study of the Chicxulub Impact Structure. Journal of Geophysical Research. Planets, Wiley-Blackwell, 2019, 124 (2), pp.396-417. 10.1029/2018JE005821. hal-02128150
Transcript of Stress-Strain Evolution During Peak-Ring Formation: A Case ...

HAL Id: hal-02128150https://hal.umontpellier.fr/hal-02128150
Submitted on 14 May 2019
HAL is a multi-disciplinary open accessarchive for the deposit and dissemination of sci-entific research documents, whether they are pub-lished or not. The documents may come fromteaching and research institutions in France orabroad, or from public or private research centers.
L’archive ouverte pluridisciplinaire HAL, estdestinée au dépôt et à la diffusion de documentsscientifiques de niveau recherche, publiés ou non,émanant des établissements d’enseignement et derecherche français ou étrangers, des laboratoirespublics ou privés.
Stress-Strain Evolution During Peak-Ring Formation: ACase Study of the Chicxulub Impact Structure
Auriol Rae, Gareth Collins, Michael Poelchau, Ulrich Riller, Thomas Davison,Richard Grieve, Gordon Osinski, Joanna Morgan, S. P. S. Gulick, Elise
Chenot, et al.
To cite this version:Auriol Rae, Gareth Collins, Michael Poelchau, Ulrich Riller, Thomas Davison, et al.. Stress-StrainEvolution During Peak-Ring Formation: A Case Study of the Chicxulub Impact Structure. Journal ofGeophysical Research. Planets, Wiley-Blackwell, 2019, 124 (2), pp.396-417. �10.1029/2018JE005821�.�hal-02128150�

Stress-Strain Evolution During Peak-Ring Formation: ACase Study of the Chicxulub Impact Structure
Auriol S. P. Rae1,2 , Gareth S. Collins1 , Michael Poelchau2, Ulrich Riller3 ,Thomas M. Davison1 , Richard A. F. Grieve4 , Gordon R. Osinski4 , Joanna V. Morgan1 ,and IODP-ICDP Expedition 364 Scientists
1Department of Earth Science and Engineering, Imperial College London, London, UK, 2Institut für Geo- undUmweltnaturwissenschaften, Albert-Ludwigs-Universität Freiburg, Geologie, Freiburg, Germany, 3Institut fürGeologie, Universität Hamburg, Hamburg, Germany, 4Department of Earth Sciences/Centre for Planetary Science andExploration, Western University, London, Ontario, Canada
Abstract Deformation is a ubiquitous process that occurs to rocks during impact cratering; thus,quantifying the deformation of those rocks can provide first-order constraints on the process of impactcratering. Until now, specific quantification of the conditions of stress and strain within models of impactcratering has not been compared to structural observations. This paper describes a methodology to analyzestress and strain within numerical impact models. This method is then used to predict deformation andits cause during peak-ring formation: a complex process that is not fully understood, requiring remarkabletransient weakening and causing a significant redistribution of crustal rocks. The presented results aretimely due to the recent Joint International Ocean Discovery Program and International ContinentalScientific Drilling Program drilling of the peak ring within the Chicxulub crater, permitting directcomparison between the deformation history within numerical models and the structural history of rocksfrom a peak ring. The modeled results are remarkably consistent with observed deformation within theChicxulub peak ring, constraining the following: (1) the orientation of rocks relative to their preimpactorientation; (2) total strain, strain rates, and the type of shear during each stage of cratering; and (3) theorientation and magnitude of principal stresses during each stage of cratering. The methodology andanalysis used to generate these predictions is general and, therefore, allows numerical impact models tobe constrained by structural observations of impact craters and for those models to produce quantitativepredictions.
Plain Language Summary During impact cratering events, extreme forces act on rocks beneaththe crater to produce deformation. Computer simulations of large impact cratering events are particularlyimportant because the conditions of those events can never be simultaneously produced by laboratoryexperiments. In this study, we describe a method by which the forces and deformations that occur duringcratering can be measured in computer simulations of impact cratering events. Combining this analysiswith geological observations from impact structures allows us to improve our understanding of impactcrater formation. Here, we use this method to study the Chicxulub impact structure, Mexico, to understandthe formation of “peak rings,” rings of hills found internal to the rim of large impact craters. Our analysisprovides estimates of the sequence of forces and deformation during peak-ring formation. As deformationproduces fractures, our analysis has important implications for how fluids flow through rocks in craters.
1. IntroductionLarge impact craters on rocky planetary bodies possess central peaks or a ring of peaks within the crater inte-rior (Melosh, 1989). Impact structures with these morphologies are known as complex craters (Dence, 1965).In addition to central peaks or peak rings, complex craters have substantially smaller depth-to-diameterratios than the smaller, bowl-shaped, and so-called simple craters (Pike, 1974). The kinematics and dynam-ics of the process whereby transient cavities collapse to form complex morphologies is not fully resolved,particularly for peak-ring craters, which are uncommon on Earth (Melosh & Ivanov, 1999). One of the lead-ing models to explain the formation of peak rings is the dynamic collapse model, where peak rings form bythe outward collapse of an overheightened central uplift over the inwardly slumped rim of the transient cav-
RESEARCH ARTICLE10.1029/2018JE005821
Key Points:• Numerical impact simulations are
used to track stress and strain duringcomplex crater formation
• Stress and strain predictions allowtime, orientation, and magnitudeconstraints on the deformationalhistory of paraautochthonous rocks
• Predicted strains are consistent withthe deformation observed withinrocks of the Chicxulub peak ring
Supporting Information:• Supporting Information S1
Correspondence to:A. S. P. Rae,[email protected]
Citation:Rae, A. S. P., Collins, G. S.,Poelchau, M. H., Riller, U.,Davison, T., Grieve, R. A. F., et al.(2019). Stress-strain evolutionduring peak-ring formation: Acase study of the chicxulubimpact structure. Journal ofGeophysical Research:Planets, 124, 396–417.https://doi.org/10.1029/2018JE005821
Received 30 AUG 2018Accepted 24 JAN 2019Accepted article online 31 JAN 2019Published online 13 FEB 2019
©2019. American Geophysical Union.All Rights Reserved.
RAE ET AL. 396

Journal of Geophysical Research: Planets 10.1029/2018JE005821
ity (Collins et al., 2002; Grieve et al., 1981; Kring et al., 2016; Morgan et al., 2016). With the recent recoveryof a drill core from the peak ring of the Chicxulub crater by the International Ocean Discovery Program(IODP) and International Continental Scientific Drilling Program (ICDP), the imperative has arisen for thedynamic collapse model to make quantitative predictions of the deformation path followed by peak-ringmaterial during crater collapse. Here, we present analysis of the stress-strain path followed by material inthe dynamic collapse model of peak-ring formation and compare the results to observed deformation fromthe Chicxulub peak ring.
2. The Chicxulub Crater and the Dynamic Collapse ModelThe Chicxulub crater, located in the Yucatán peninsula of Mexico, is a ∼200-km-diameter impact struc-ture (Gulick et al., 2008). The identification of the Chicxulub structure (Hildebrand et al., 1991; Penfield& Camargo, 1981) was initially made on the basis of large-scale geophysical signatures: a large negativeBouguer gravity anomaly and magnetic anomalies; the structure's impact origin was confirmed by the iden-tification of shock metamorphosed quartz in samples from within the crater structure (Hildebrand et al.,1991). The crater is buried, and the only surface expression of its presence is a ring of cenotes, water-filledsinkholes in the Cenozoic limestones, 70–85 km in radius.
Seismic reflection and refraction surveys were carried out at the site in order to resolve the crater and sub-crater structure (Gulick et al., 2008; Morgan et al., 1997). The results of those surveys (Gulick et al., 2013, andreferences therein) indicated that the Chicxulub crater possesses: a topographic (inner) rim, 140–170 km indiameter, hereafter termed the “crater rim”; noncontinuous ring faults, external to the crater rim; one, the“outer” ring ∼200 km in diameter and a second, “exterior” ring that is up to 250 km in diameter. Addition-ally, the crater possesses an 80- to 90-km diameter peak ring, which rises up to 400 m above the crater floor,beneath which a strong, inwardly dipping reflector can be found. The peak ring and its inwardly dippingsubsurface structure correspond to a low-velocity zone, ∼4 km/s. A ring-shaped gravity minimum withinthe crater at ∼35-km radial distance suggests that the low-velocity zone, and thus, the peak-ring structureis composed of low density rocks. The crater possesses a terrace zone that extends inward from the craterrim, toward and beneath the peak ring, separated by the dipping reflector. Finally, the Moho is uplifted by1.5–2 km beneath the crater center.
Results of the geophysical surveys at the Chicxulub structure motivated the initial numerical simulationsof peak-ring formation by dynamic collapse (Collins et al., 2002) and provide important constraints on anymodel of peak-ring formation. The combination of geophysical constraints with numerical impact modelssuggest that the peak ring belongs to the paraautochtonous rocks within the crater, albeit possessing unusu-ally low densities and seismic velocities. The structure has been drilled on several occasions, many of whichwere before the identification of the structure as an impact crater.
Investigating the mechanism of peak-ring formation was one of the primary aims of IODP-ICDP Expedition364 (Morgan et al., 2017). The expedition recovered core between 505.42 and 1,363.05 mbsf (meters below seafloor) including the following: from 505.42–617.82 mbsf, carbonate-rich Palaeogene sedimentary rocks; from617.82–750.25 mbsf, allochthonous impactites, predominantly fining-upward suevitic breccias (a polymictbreccia containing crystallized or glassy clasts of impact melt) with impact melt rock at its base; and from750.25–1363.05 mbsf, crystalline target rocks (Figure 1). The crystalline target rocks recovered during theexpedition were predominantly granitic rocks, with occasional preimpact igneous dikes.
Initial analysis of the recovered core provided several constraints on the provenance of peak-ring materialand the deformation that those rocks must have experienced during cratering. The occurrence of crystallinerocks at depths of only 750 mbsf suggests that the crystalline rocks have been uplifted by at least 2.25 km,such that rocks derived from beneath the approximately 3-km-thick Mesozoic sedimentary cover reachedtheir final location in the peak ring. Additionally, the presence of abundant quartz Planar DeformationFeatures (PDFs) but the absence of diaplectic quartz glasses within the granitic target rocks indicate thatthe recovered paraautochthon, the shocked target rocks, experienced shock pressures from 10 to not morethan 35 GPa (Morgan et al., 2016). Moreover, the mechanisms of accommodating rock deformation, and thetiming of those mechanisms, within the peak ring during cratering have been described by Riller et al. (2018).At the beginning of the cratering process, target rocks were pervasively fractured, followed sequentially bythe formation of cataclasite zones, ultracataclasite zones, shear faults, the emplacement of fault breccias,
RAE ET AL. 397

Journal of Geophysical Research: Planets 10.1029/2018JE005821
Figure 1. (a) Schematic stratigraphic log of Hole M0077A. The location of M0077A is indicated on subfigures, (b) aBouguer gravity anomaly map of the crater, and (c) a radial seismic profile of the peak ring through the site location.Modified from Gulick et al. (2013) and Morgan et al. (2016).
impact breccias, and impact melts into dilatant fractures, and finally, the formation of brittle-ductile shearbands.
With this contribution, we aim to quantify the stress and strain histories of peak-ring material during cra-tering, constraining the timing, magnitude, and orientation of stress and strain. This aim will be addressedby the implementation of stress and strain tensorial analysis to the results of numerical impact simulationsand the subsequent comparison with observed deformation from the Chicxulub peak ring.
3. Numerical ModelingThe formation of the Chicxulub impact structure was simulated using the iSALE shock physics code. iSALEis a multirheology, multimaterial code based on the SALE hydrocode (Amsden et al., 1980). Modificationsto the original code have included an elastoplastic constitutive model, fragmentation models (Melosh et al.,1992), various equations of state (Ivanov et al., 1997), a porous compaction model (Wünnemann et al., 2006),and a dilatancy model (Collins, 2014). iSALE and its precursor codes, SALES-2 (Collins et al., 2002) and
RAE ET AL. 398

Journal of Geophysical Research: Planets 10.1029/2018JE005821
SALE-B (Ivanov, 2005), have been used to simulate the formation of the Chicxulub impact structure in pre-vious studies (Collins et al., 2002, 2008; Ivanov, 2005; Morgan et al., 2016). Here, we present an updatedmodel, including use of a dilatancy model (Collins, 2014) and updating previously used parameters in lightof recent advances.
Computational improvements over recent years have permitted us to substantially increase the resolutionof the Chicxulub model presented here. We use a resolution of 60 cells per impactor radius, which, with animpactor radius of 6 km, results in cell widths of 100 m. Previously published simulations of the Chicxulubhave achieved cell widths of 200 m (Collins et al., 2008). Here, we have increased the resolution in orderto facilitate as close a comparison as currently possible between the results of numerical simulations andthe length of recovered impactites from Expedition 364 (745.23 m). Even so, it is worth noting that thewhole length of the recovered core is encapsulated by only eight computational cells and that structuralobservations of the core are made on the centimeter-meter scale.
Impactor parameters in previous simulations of the Chicxulub impact event (e.g., Collins et al., 2008) haveused impactor densities, diameters, and velocities of 2,670 kg/m3, 14 km, and 12.0 km/s, respectively. Inthis study, we have made modified those parameters, where the impactor density, diameter, and velocity are2,670 kg/m3, 12 km, and 15.0 km/s, respectively. The cause of this modification is due to upward revisionof the average asteroidal impactor velocity on Earth to 20.5 km/s (Le Feuvre & Wieczorek, 2011). Statisti-cal probability indicates that vertical impacts are unlikely and that the most probable impact angle is 45◦
(Shoemaker, 1962). Three-dimensional simulations are capable of modeling impactor obliquity; however,this significantly compromises the available resolution. Therefore, we use the iSALE-2D code and adjustthe impactor velocity such that potential impactor obliquity is accounted for. It has been shown that tran-sient cavity size scales with the vertical component of the impactor velocity (Chapman & McKinnon, 1986;Elbeshausen et al., 2009). Consequently, we have adopted 15.0 km/s as the impactor velocity, which is thevertical velocity component of an impactor traveling at 20.5 km/s at 45◦. As a consequence of the increasein impactor velocity in this simulation, the impactor diameter has been decreased, to 12 km, from thevalue used in previous simulations (e.g., Collins et al., 2008), 14 km, such that the impact energy (and,approximately, the transient cavity diameter) of the presented simulation is consistent with previous models.Nevertheless, we note that there are considerable uncertainties in the choice of impactor diameter. Primarily,this is a consequence of a trade-off between impactor parameters/transient cavity size and acoustic fluidiza-tion parameters in determining the final crater dimensions. Simulations were run using a variety of acousticfluidization and impactor parameters, a comparison between the model presented here, previous models,and alternative models is presented within the supporting information (Figures S1 and S2 and Table S3).Ultimately, the stress-strain measurements presented here are qualitatively similar to the results of alter-native models, provided that transient weakening from acoustic fluidization is sufficiently strong and longlasting to produce a peak-ring crater.
The thermodynamic behavior of the materials in the model is described by an equation of state (EoS). Foreach material, we used tables generated using the analytic EoS program (ANEOS, Thompson & Lauson,1974). A three-layer target was selected to replicate the conditions of the Yucatán platform at the time ofimpact. A 3-km layer of sedimentary rocks, using the calcite EoS (Pierazzo et al., 1998), overlies a 30-km layerof crystalline crustal rocks, using the granite EoS (Pierazzo et al., 1997), which overlies crystalline mantlerocks, using the dunite EoS (Benz et al., 1989).
The primary parameters that describe a material's yield strength are pressure, temperature, and materialdamage (Ivanov et al., 1997). Here, we use the shear failure constitutive model described by Collins et al.(2004) and do not use a tensile failure model. Instead, a negative pressure limit is set based on the intersectionof the yield envelope with the pressure axis. Tensile failure was not considered in the models presentedhere because peak-ring material, the focus of this contribution, only ever experiences compressive principalstresses (e.g., Figure 6 in Ivanov et al., 1997). Constitutive model parameters for all materials were based onthose used in previous models (Collins et al., 2008).
Gravitational collapse of the transient cavity is facilitated by the implementation of acoustic fluidization(Melosh, 1979) as a supplement to the constitutive model (Melosh, 1989; Melosh & Ivanov, 1999). Here, weuse the block model implementation of acoustic fluidization (Ivanov & Kostuchenko, 1997). The result ofthis model is a rheology with a time-dependent yield strength and a constant effective kinematic viscosity,
RAE ET AL. 399

Journal of Geophysical Research: Planets 10.1029/2018JE005821
𝜂. Acoustic energy within the material is assumed to decay exponentially, with decay time constant Tdec,causing a gradual increase in strength as time progresses.
Dilatancy is the volume change observed in granular materials when they are subjected to shear deforma-tions. The dilatancy model in iSALE is described by Collins (2014). In iSALE, the equation used to updatethe distension in cells undergoing shear deformation is as follows:
d𝛼dt
= 𝛼𝛽d𝛾p
dt, (1)
where 𝛼 is the distension, which is defined as the ratio of the grain density to the bulk density, and 𝜌s𝜌
(andcan be defined as a function of porosity, 1
1−𝜙). 𝛽 is the dilatancy coefficient, which describes the material's
tendency to gain volume upon plastic shear strain and is a function of pressure, temperature, and the preex-isting dilatancy of the material (Equation (6) in Collins, 2014). The final term of equation (1) is the plasticshear strain rate; this value is determined by iSALE based on velocity gradients in the cell (see Collins, 2014).The dilatancy model is used for completeness and only has a significant effect on volume strain, withoutany noticeable effect on shear strain, or stress conditions for the material studied here.
A complete list of the parameters used in our simulation, including dilatancy model parameters, is shownin the supporting information (Tables S1 and S2).
3.1. Stress and Strain During Impact CrateringRocks undergo deformation during impact cratering. Deformation of a body is the transformation from itsinitial geometry to its final geometry by means of translation, rotation, and/or strain, which can be a distor-tion or a volume change. Translations and rotations are known as rigid body deformations, while distortionsand volume changes are known as nonrigid body deformations. These deformations are variably complexto quantify by observation (Fossen, 2016; Ramsay & Huber, 1983). Commonly, nonrigid body deformationsare the easiest to observationally quantify. Consequently, providing quantitative predictions of deformation,separating translations, rotations, and strains, is of paramount importance to numerical impact simulations.
iSALE uses an Eulerian frame of reference; that is, properties, such as pressure, temperature, or stress, aresaved at specific locations on a grid. A more useful frame of reference to consider when attempting to fol-low the material's path through property space is a Lagrangian reference frame, where individual materialparcels, and their corresponding properties, are tracked. To accomplish this in iSALE, Lagrangian tracer par-ticles are embedded within the mesh in the initial time step (e.g., Pierazzo et al., 1997), their locations thenfollow the material flow, and properties are saved at specific time steps. Here, tracers are advected throughthe grid based on the velocities of the Eulerian grid nodes (Davison et al., 2016; Pierazzo et al., 1997).
We quantify deformation during impact simulations by considering a 3-D Lagrangian pseudo-cell, that is,a “logical” cube of neighboring Lagrangian tracer particles. The three dimensions of the simulation are ina cylindrical coordinate system, corresponding to the radial direction, r, the vertical direction, z, and theazimuth, 𝜃. Thus, the pseudo-cell has an initially square cross section and is a toroidal sector in shape witheight nodes (Figure S3). By calculating the deformation gradient tensor for the pseudo-cell transformationand using the assumptions of infinitesimal strain theory, the infinitesimal strain and rotation tensors ofthe deformation between saved time steps can be derived. These saved time steps have an interval at leastone order of magnitude greater than the interval between calculated time steps in the iSALE code. Duringanalysis of the material of interest to this contribution, we found that saving time steps at a fine temporalscale is necessary during shock and decompression to accurately characterize deformation. Decreasing theinterval between saved time steps beyond 25 ms produces no significant improvement on the results at thecost of unwieldy data file sizes; thus, we used an interval of 25 ms between saved time steps during shockand decompression. After shock and decompression, coarser temporal scales can be used while retainingaccuracy. Here, we have used 2-s intervals between saved time steps for transient cavity formation and cratercollapse, respectively.
iSALE calculates the stress tensor as part of its routine for each time step as an Eulerian field property. Con-sequently, saving the stress tensor as a Lagrangian tracer particle property simply requires that the tracerparticle saves an interpolated value of the stress tensor within the cell that the tracer particle is within.In order to ensure exact correspondence between the stress tensor and the infinitesimal strain tensor, welinearly interpolate the values of the stress tensor within the Lagrangian pseudo-cell, to make the tensor
RAE ET AL. 400

Journal of Geophysical Research: Planets 10.1029/2018JE005821
pseudo-cell centered, and between saved time steps, to ensure that the saved stress tensor corresponds tothe average stress required to cause the corresponding infinitesimal strain. A detailed description of howstrain and stress tensors are acquired and used may be found in the supporting information, an applica-tion of descriptions by Fossen and Tikoff (1993), Tikoff and Fossen (1995), Allmendinger et al. (2012), andFossen (2016).
Several issues arise from the use of our treatment to calculate strains and stresses in three dimensions. First,our interpolated treatment of stress and strain between saved time steps is effectively the result of summingdeformations from many individual computational time steps; therefore, our analysis produces a smoothingeffect on the results of the simulation. The interval between saved time steps was carefully chosen for eachstage of the cratering process to reduce effects from temporal underresolution while maintaining computa-tional efficiency. Second, due to the axisymmetry of iSALE-2D simulations, out-of-plane deformation is notwell characterized; shear strains and stresses can only occur in the r-z plane, and strain can never be local-ized in the 𝜃 direction, precluding the simulation of radially oriented faults. Nevertheless, owing to the radialmovement of material, hoop strains (changes in length along the 𝜃 axis) can be calculated. Finally, axialsymmetry forces the impact angle to be perpendicular to the target but real impacts are unlikely to occur atthis angle. Impactor obliquity would cause changes to both the magnitude and timing of stresses and strainsdistributed around the crater, most strongly during the contact and compression and excavation stages ofcratering. Nevertheless, we note that recent 3-D numerical simulations of peak-ring formation show thatpeak-ring material experiences similar shock magnitudes regardless of azimuth in all but the most obliqueimpacts (Collins et al., 2017). Together, this suggests that the stress-strain history of peak-ring material dur-ing shock in moderately and steeply inclined impacts should be similar at all azimuths and, by the time ofcrater collapse, our analysis of stress and strain derived from 2-D simulations should be appropriate for allbut the most oblique large impact events.
4. ResultsLagrangian pseudo-cell analysis was used to examine the stress-strain paths of material within a simula-tion of the Chicxulub impact event. Within the paraautochthon of a large impact structure, rocks from thepeak ring have experienced the most extreme deformation during crater modification. For this reason, anddue to the recent IODP-ICDP drilling of the Chicxulub peak ring, the peak-ring materials will be focusedupon specifically.
Here, the material that forms the peak-ring structure, termed here and in the following sections as“peak-ring material,” is defined based on two criteria: First, peak-ring material must be solid. Melted mate-rial is distinguished by peak shock pressures >60 GPa. Second, previous work (e.g., Collins et al., 2002;Grieve et al., 1981; Morgan et al., 2016) suggests that peak-ring material derives from the collapse of anoverheightened central uplift thrust atop the rim of the transient cavity. Consequently, peak-ring materialcan be defined as belonging to the flanks of the central uplift at the time of maximum uplift (Collins et al.,2017). All of the material defined in this way undergoes a similar stress-strain history (see supporting infor-mation); thus, these criteria constrain a volume of material representative of the geological structure of thepeak ring, rather than a topographic definition. Furthermore, this material has an inwardly dipping basalcontact consistent with seismic observations and provides a method that can be used to define peak-ringmaterial in lower resolution and 3-D models, where it may be challenging to define the peak-ring materialbased on topographic details. For this Chicxulub simulation, maximum central uplift occurs at ∼180 s, andwe define that peak-ring material is any material above the plane that defines the base of the maximum cen-tral uplift and within the 15 km that are interior to the trough that surrounds the maximum central uplift.The location of the material that satisfies these two criteria, the peak-ring material, is shown on Figure 2throughout the simulation.
Our results show that the peak-ring material originates from 8- to 11-km depth and 10- to 25-km radialdistance (Figure 2a). From shock wave arrival to the end of transient cavity growth, the material moves out-ward, adjacent to and a part of, the transient cavity wall (Figure 2b). This material subsequently collapsesinward (Figure 2c) and becomes entrained into the flank of the central uplift (Figure 2d). At this time, thecentral uplift is overheightened and collapses radially outward (Figure 2e), emplacing the peak-ring mate-rial on top of the collapsed transient cavity rim (Figure 2f). The results presented here will use a singleLagrangian pseudo-cell from within the center of the peak-ring material, which is representative of the
RAE ET AL. 401

Journal of Geophysical Research: Planets 10.1029/2018JE005821
Figure 2. Selected time steps of the Chicxulub simulation presented here. The target is comprised of three layers:sedimentary rock (gray), granitic basement (pink), and mantle (purple). A grid of tracer particles is shown to highlightthe target rock deformation. Additionally, in the first frame, (a), the provenance of impact melt and the peak-ringmaterial are shown in green and red, respectively. The impact melt and peak-ring material is then tracked throughoutthe steps (b)–(f). The location of a single pseudo-cell (white) is shown throughout the simulation.
stress-strain history of the entire peak ring (see supporting information). This pseudo-cell originates from20.2-km radial distance and 8.95-km depth and ends at 35.0-km radial distance and 2.50-km depth. Thesequence of deformation of this cell will be described chronologically in the following sections.
4.1. Deformation During Shock and DecompressionThe first stage of impact-related deformation to affect the peak-ring material is shock and decompression(Figure 3). Deformation is characterized by an initial, rapid horizontal compression of the material as it isshocked (Figure 3a), which results in a rapid reduction in the volume of the material (negative volumetricstrains; Figure 3c) and a rapid increase in shear strain (Figure 3d). During these few milliseconds, strain ratereaches its maximum, 0.87 s−1 (Figure 3f). This value may be an underestimate due to the unavoidable effectsof finite spatial and temporal resolution and the implementation of artificial viscosity in shock physics codes(see Anderson, 1987). As decompression occurs, the strain rate rapidly drops, volumetric strain increases andbecomes positive (due to pressure release). Throughout the entire stage of deformation, there is a negligibleamount of rotation of the material from its initial orientation (Figure 3e).
During shock and decompression, pressures and shear stresses rapidly increase (Figure 4). For the selectedpseudo-cell, the arrival of the stress wave occurs at 2.10 s. Most of the peak-ring material never experiences
RAE ET AL. 402

Journal of Geophysical Research: Planets 10.1029/2018JE005821
Figure 3. Strain path of the Lagrangian pseudo-cell during shock and decompression. (a) r-z cross section of thepseudo-cell at t = 0.0 s (light blue) and t = 6.0 s (dark blue). The pathway of the individual tracers relative to eachother through time is indicated by the dashed lines. (b) The initial (t = 0.0 s) and postshock (t = 6.0 s) arrangement ofthe simulation; see Figure 2. (c) The cumulative first strain invariant, 𝜖I1. (d) The cumulative square root of the seconddeviatoric strain invariant,
√𝜖J2. (e) Cumulative rotation (i.e., orientation) of the material. (f) Strain rate (i.e., the rate
of change of cumulative√
𝜖J2 with respect to time). Additional data may be found in the supporting information(Figure S4).
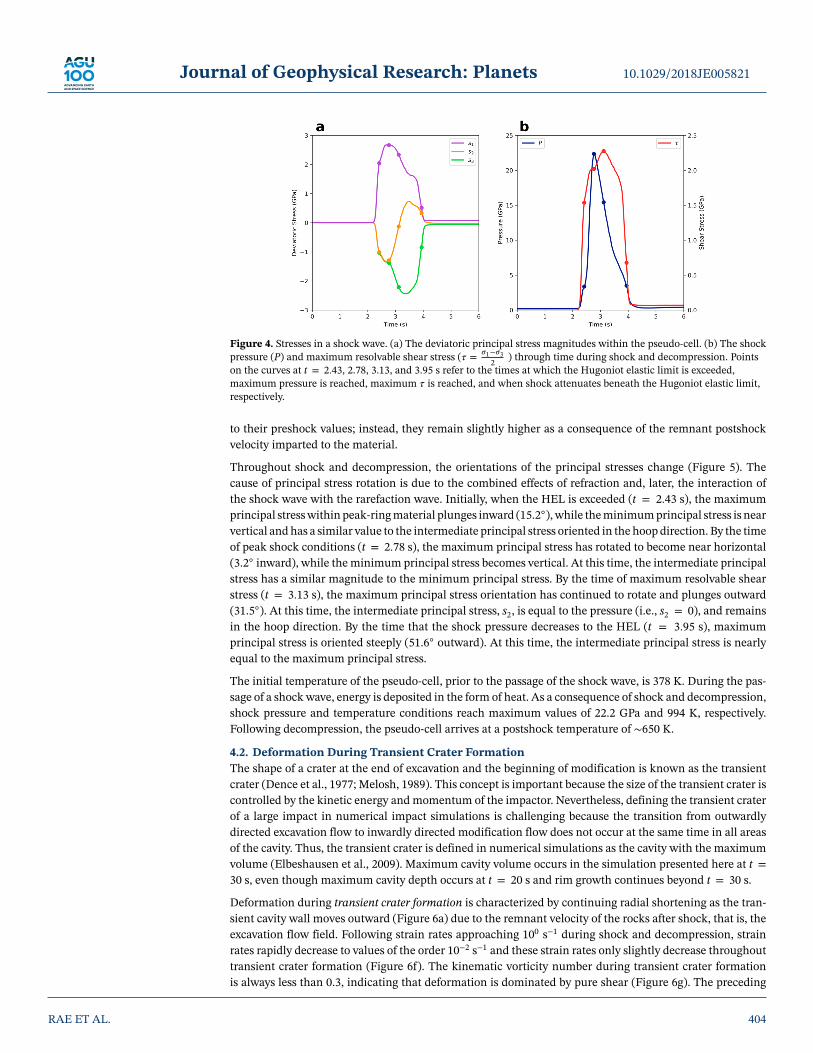
shock pressures greater than 40 GPa; therefore, the peak-ring material experiences shock metamorphismfrom a plastic wave with an elastic precursor. The stress wave exceeds the Hugoniot elastic limit (HEL;3.56 GPa for the granite strength properties used here) at 2.43 s where the maximum resolvable shear stressis 1.6 GPa. Pressures subsequently increase in the plastic wave up to 22.2 GPa at 2.78 s and where the max-imum resolvable shear stress is 2.0 GPa. At this moment of the peak shock condition, the rarefaction wavearrives and pressures begin to decrease. Nevertheless, maximum resolvable shear stresses increase until3.13 s, where the pressure is 15.5 GPa, and the maximum resolvable shear stress is 2.3 GPa. The cause ofthe increase in shear stress as pressure decreases in the wave is due to the rarefaction wave increasing theintermediate deviatoric principal stress, s2, from tensile to compressive values (Figure 4). By 3.95 s, the stresswave possesses a pressure less than the HEL. Beyond this time, the pressure and shear stresses do not return
RAE ET AL. 403
Journal of Geophysical Research: Planets 10.1029/2018JE005821
Figure 4. Stresses in a shock wave. (a) The deviatoric principal stress magnitudes within the pseudo-cell. (b) The shockpressure (P) and maximum resolvable shear stress (𝜏 = 𝜎1−𝜎3
2 ) through time during shock and decompression. Pointson the curves at t = 2.43, 2.78, 3.13, and 3.95 s refer to the times at which the Hugoniot elastic limit is exceeded,maximum pressure is reached, maximum 𝜏 is reached, and when shock attenuates beneath the Hugoniot elastic limit,respectively.
to their preshock values; instead, they remain slightly higher as a consequence of the remnant postshockvelocity imparted to the material.
Throughout shock and decompression, the orientations of the principal stresses change (Figure 5). Thecause of principal stress rotation is due to the combined effects of refraction and, later, the interaction ofthe shock wave with the rarefaction wave. Initially, when the HEL is exceeded (t = 2.43 s), the maximumprincipal stress within peak-ring material plunges inward (15.2◦), while the minimum principal stress is nearvertical and has a similar value to the intermediate principal stress oriented in the hoop direction. By the timeof peak shock conditions (t = 2.78 s), the maximum principal stress has rotated to become near horizontal(3.2◦ inward), while the minimum principal stress becomes vertical. At this time, the intermediate principalstress has a similar magnitude to the minimum principal stress. By the time of maximum resolvable shearstress (t = 3.13 s), the maximum principal stress orientation has continued to rotate and plunges outward(31.5◦). At this time, the intermediate principal stress, s2, is equal to the pressure (i.e., s2 = 0), and remainsin the hoop direction. By the time that the shock pressure decreases to the HEL (t = 3.95 s), maximumprincipal stress is oriented steeply (51.6◦ outward). At this time, the intermediate principal stress is nearlyequal to the maximum principal stress.
The initial temperature of the pseudo-cell, prior to the passage of the shock wave, is 378 K. During the pas-sage of a shock wave, energy is deposited in the form of heat. As a consequence of shock and decompression,shock pressure and temperature conditions reach maximum values of 22.2 GPa and 994 K, respectively.Following decompression, the pseudo-cell arrives at a postshock temperature of ∼650 K.
4.2. Deformation During Transient Crater FormationThe shape of a crater at the end of excavation and the beginning of modification is known as the transientcrater (Dence et al., 1977; Melosh, 1989). This concept is important because the size of the transient crater iscontrolled by the kinetic energy and momentum of the impactor. Nevertheless, defining the transient craterof a large impact in numerical impact simulations is challenging because the transition from outwardlydirected excavation flow to inwardly directed modification flow does not occur at the same time in all areasof the cavity. Thus, the transient crater is defined in numerical simulations as the cavity with the maximumvolume (Elbeshausen et al., 2009). Maximum cavity volume occurs in the simulation presented here at t =30 s, even though maximum cavity depth occurs at t = 20 s and rim growth continues beyond t = 30 s.
Deformation during transient crater formation is characterized by continuing radial shortening as the tran-sient cavity wall moves outward (Figure 6a) due to the remnant velocity of the rocks after shock, that is, theexcavation flow field. Following strain rates approaching 100 s−1 during shock and decompression, strainrates rapidly decrease to values of the order 10−2 s−1 and these strain rates only slightly decrease throughouttransient crater formation (Figure 6f). The kinematic vorticity number during transient crater formationis always less than 0.3, indicating that deformation is dominated by pure shear (Figure 6g). The preceding
RAE ET AL. 404

Journal of Geophysical Research: Planets 10.1029/2018JE005821
Figure 5. Stress orientations and magnitudes during shock and decompression. (a) Crater growth at time steps indicated in Figure 4 with location of thepseudo-cell indicated by the white marker. (b) r-z sectional deviatoric Lamé's stress ellipses at corresponding times, solid lines indicate compressive deviatoricstresses, while dashed lines indicate tensile deviatoric stresses. (c) Mohr's circle representation of the conditions of stress at corresponding times. Solid anddotted lines indicate the strength envelope of material at standard conditions, intact and damaged, respectively, these envelopes are drawn such that shear stressis measured by
√𝜖J2, rather than 𝜎1−𝜎3
2 . Consequently, material is still at failure even though the Mohr circle may not be in contact with the strength envelopes.
RAE ET AL. 405

Journal of Geophysical Research: Planets 10.1029/2018JE005821
shock and decompression stage has kinematic vorticity numbers between 0.3 and 0.5, and kinematic vor-ticity numbers increase toward the end of transient crater formation. Additionally, during this stage ofdeformation, the material initially rotates clockwise about the hoop direction by approximately 6◦ beforebeginning to rotate counterclockwise from 25 s after impact (Figure 6e).
The orientation of stresses during transient crater formation remains consistent throughout and follows theexcavation flow field (Figure 7). Initially (t = 6.0 s), the pressure and deviatoric stresses are high and themaximum principal stress plunges gently outward (8.8◦); these stresses rapidly decrease until t = 15 s, afterwhich, they remain comparatively constant. Nevertheless, the orientation of the maximum principal stresscontinues to rotate such that by t = 30 s, the maximum principal stress plunges gently inward (10.1◦).Throughout this stage of deformation, the intermediate deviatoric principal stress is tensile and is orientedin the hoop direction. Additionally, the proportional difference between 𝜎1, 𝜎2, and 𝜎3 remains constant.During this stage of cratering, transient strength reduction has no influence on deformation (Figure 7c).
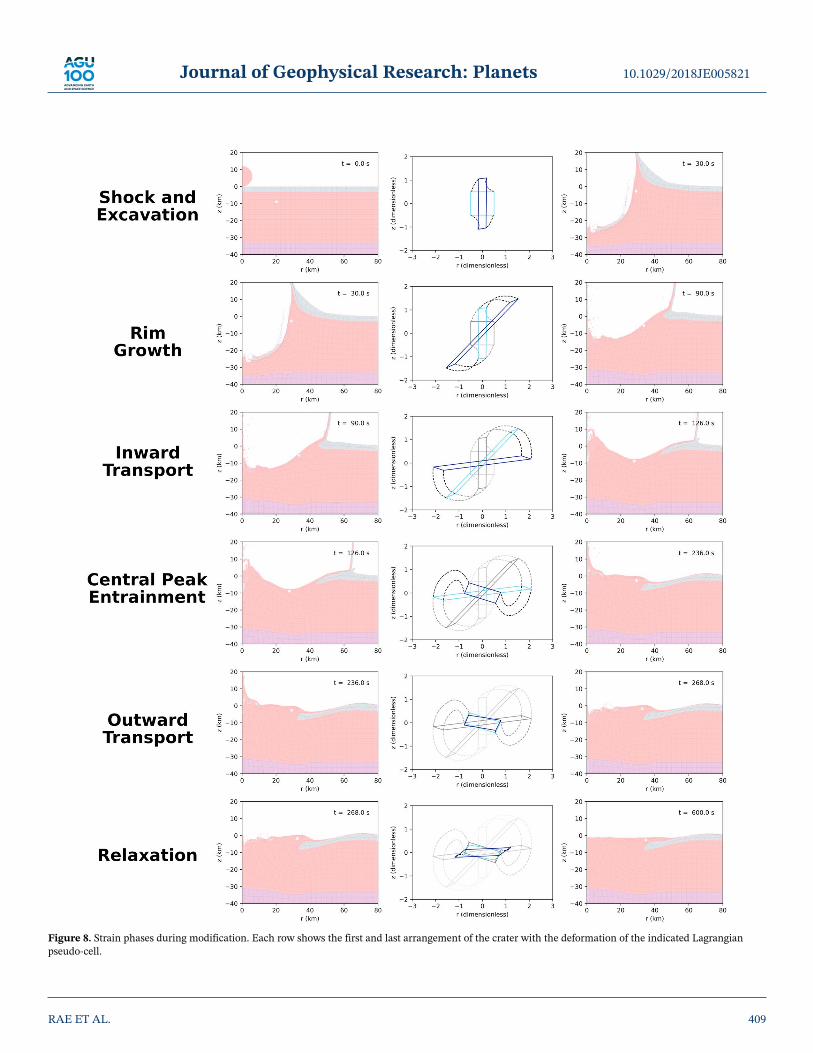
4.3. Deformation During Crater ModificationThe stress-strain-time path during crater modification for peak-ring material is complex (Figure 8). Never-theless, the deformation can be subdivided into five quantitatively distinct phases: rim growth (t = 30–90 s),inward transport (t = 90–126 s), central peak entrainment (t = 126–236 s), outward transport (peak-ringemplacement) (t = 236–268 s), and relaxation (t = 268–600 s). The initial and final time steps of thesephases are shown in Figure 8. Quantitative measures of the strain path are shown in Figure 9.4.3.1. StrainThe first phase of crater modification from the perspective of peak-ring material, rim growth, is characterizedby the deceleration of the material in the radial direction and the onset of significant clockwise (with respectto the hoop direction) rotation (30◦); this rotation occurs as a consequence of the differential velocities ofmaterial above and beneath the peak-ring material. Beneath, material is beginning to collapse toward thecrater center, while above, material is still being excavated radially outward. This differential velocity fieldalso causes an increase in the relative amount of simple shear compared to pure shear; kinematic vorticitynumbers increase from∼0.3 to∼0.95 (Figure 9b). Throughout this phase, the instantaneous principal strainsall decrease in magnitude (Figure 9f), and strain rates decrease steadily from 2 × 10⁻² to 6 × 10⁻³ s−1
(Figure 9a). The minimum principal strain (e3) remains perpendicular to the cavity wall, while the maximumprincipal strain (e1) is also contained within the r-z plane.
The transition to the next phase of crater modification, inward transport, is characterized by the switchingof the orientations of the minimum and intermediate principal strains (Figure 9f). The minimum principalstrain, for the first time in the simulation, becomes oriented in the hoop direction; that is, the maximumshortening direction is concentric. This switch is a result of the inward transport of the peak-ring material asthe transient crater wall collapses causing convergence of flow into the center of the crater. As the materialflows inward, counterclockwise rotation continues (Figure 9c); however, strain rates are comparatively low(Figure 9a), and thus, this phase of modification is accompanied by comparatively small amounts of nonrigidbody deformation (Figure 9).
The inward velocity experienced by the peak-ring material during inward transport ceases as the peak-ringmaterial is entrained into the flank of the rising central uplift (Figure 2d). Central peak entrainment occursas the central peak is rising (until t = 175 s) and during the initial collapse of the overheightened centralpeak. During this phase, and slightly before, for the only time in the simulation after shock, strain ratesincrease (Figure 9a), reaching and maintaining rates of 10−2 s−1. Additionally, counterclockwise rotation ofthe peak-ring material continues until slightly after the central peak reaches its maximum height. At thistime, the peak-ring material has reached a total rotation of approximately 90◦ (Figure 9c). Additionally,while the central uplift builds, the maximum principal strain is oriented subvertically, while the minimumprincipal strain (maximum shortening) is oriented subhorizontally. Later, at the time of maximum centraluplift, when the material finally ceases all inward movement and begins to move outward, the materialand the principal strains begin to rotate clockwise (about the hoop direction; Figure 9c). By the end of thedeformation phase, the minimum principal strain plunges inward (23.4◦), parallel to the direction in whichthe peak ring is emplaced. The onset of the central peak collapse also causes an increase in the kinematicvorticity number from 0.1 to 0.9 (Figure 9b).
RAE ET AL. 406

Journal of Geophysical Research: Planets 10.1029/2018JE005821
Figure 6. Strain path of the Lagrangian pseudo-cell during transient crater formation. (a) The r-z cross section of thepseudo-cell at t = 6.0 s (light blue), t = 30.0 s (dark blue), and the original pseudo-cell at t = 0.0 s (gray). The pathway ofthe individual tracers relative to each other through time is indicated by the dashed lines. (b) The postshock (t = 6.0 s)and transient crater (t = 30.0 s) arrangement of the simulation; see Figure 2, (c) the cumulative first strain invariant,𝜖I1, (d) the cumulative second deviatoric strain invariant 𝜖J2, (e) cumulative rotation (i.e., orientation) of the material,(f) strain rate (i.e., the rate of change of cumulative 𝜖J2 with respect to time), (g) kinematic vorticity number, and(h) rates of principal strain through time.
RAE ET AL. 407

Journal of Geophysical Research: Planets 10.1029/2018JE005821
Figure 7. Stress orientation and magnitude during transient cavity growth. (a) Crater shape at t = 20 s, with thelocation of the pseudo-cell indicated by the white marker. (b) Major and minor axes of the r-z cross section of thedeviatoric Lamé's stress ellipsoid, solid lines indicate compressive deviatoric stresses, while dashed lines indicatetensile deviatoric stresses. (c) Mohr's circle representation of the conditions of stress. Solid and dotted lines indicate thestrength envelope of material at standard conditions, intact and damaged, respectively.
The transition from the central peak entrainment phase to the outward transport phase is marked by a rapiddecrease in strain rate, from 10−2 to 10−3 s−1 (Figure 9a) and a change in the orientation of the principal strainaxes (Figure 9f), whereby the now outwardly directed velocity of the material causes maximum principalextension in the hoop direction; this is the only time in the simulation where the maximum instantaneousstretch is in the hoop direction.
As the peak-ring material is emplaced outward, its radial velocity gradually decreases and the peak ringcomes, on average to rest. After this occurs, the peak-ring material gradually relaxes and flattens; thisphase of deformation, relaxation, occurs at comparatively small strain rates, declining from 10−3 to 10−5 s−1
(Figure 9a). By the end of the relaxation phase of crater modification, the material has undergone signif-icant volumetric expansion (volume strain = 0.0338), almost exclusively due to the effect of accumulateddistension from the dilatancy model (Figure 9d).
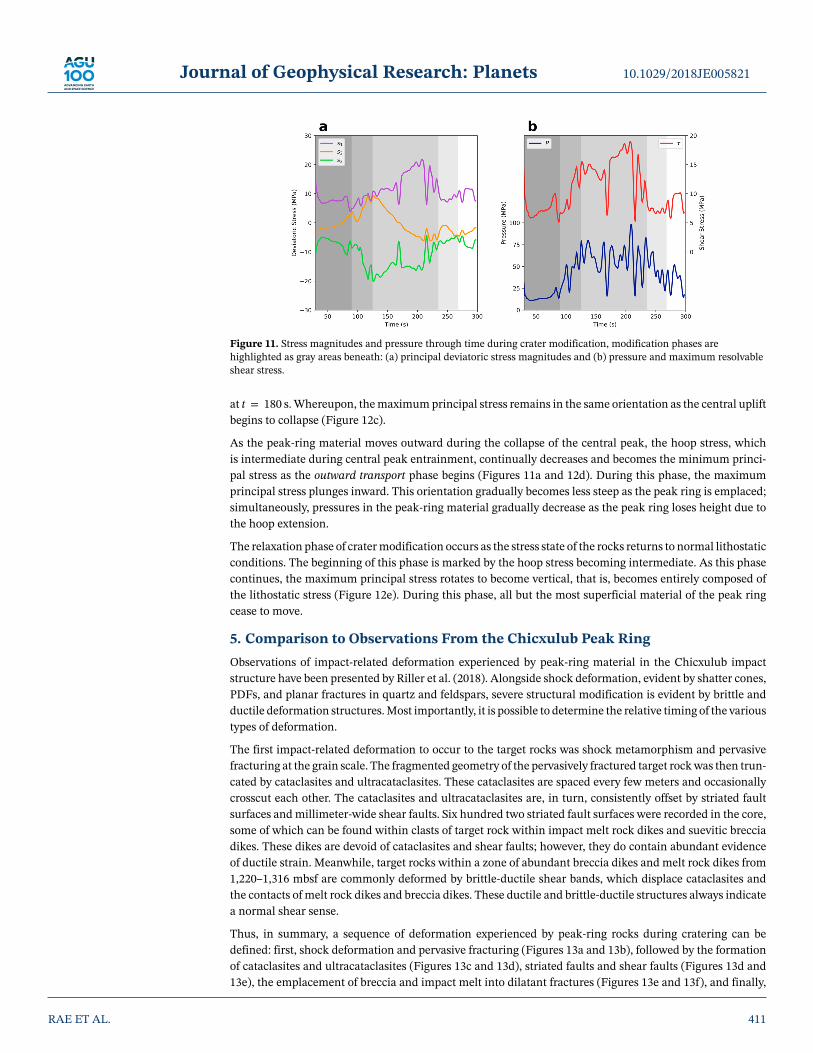
The five phases of crater modification are marked by distinctly different strain states (Figure 10). The firstphase, rim growth, and the contact and excavation stage produce oblate strain ellipsoids (flattening). Theinward transport phase is marked by a prolate strain ellipsoid (constriction). The remaining phases of modifi-cation occur under near plane strain conditions, progressing from slightly constrictional to slightly flatteningstrains as time continues. This indicates that peak-ring rocks deformed during the earliest stages of crater-ing should have developed planar fabrics (S-tectonites), while deformation structures developed during latercratering phases should develop some linear fabrics (L-tectonites, or more realistically LS-tectonites).4.3.2. StressDuring these phases of deformation, the peak-ring material experiences a sequence of stress states as com-plex as, and related to, the strain path that the material follows. Figure 11 shows the history of deviatoricprincipal stresses and pressure during the first four phases and into the final phase of the crater modifica-tion stage and Figure 12 shows representative sectional deviatoric Lamé's stress ellipses and Mohr's circlediagrams for each of the five phases of crater modification.
During the earliest phase of crater modification, rim growth, the peak-ring material experiences pressuresfrom 5–25 MPa and shear stresses of ∼5–10 MPa (Figure 11b). During this phase, the maximum princi-pal stress orientation plunges inward (Figure 12a), parallel to the cavity wall; consequently, it rotates fromsteeply to shallowly inclined as the crater rim continues to grow.
Through the rim growth phase, the intermediate principal stress, which is oriented in the hoop direc-tion, increases until, as the inward transport phase begins, the hoop stress exceeds the wall-parallel stress(Figures 11a and 12b). This occurs as a result of the inward convergence of the peak-ring material. Duringthis phase, as the material converges into the building central peak, pressures and shear stresses increase toin excess of 50 and 15 MPa, respectively (Figure 11b).
As the inward transport of material meets increasing resistance against the rising central uplift duringcentral peak entrainment, the radial, wall-parallel stress begins to exceed the hoop stress (Figure 12c).
RAE ET AL. 408
Journal of Geophysical Research: Planets 10.1029/2018JE005821
Figure 8. Strain phases during modification. Each row shows the first and last arrangement of the crater with the deformation of the indicated Lagrangianpseudo-cell.
RAE ET AL. 409

Journal of Geophysical Research: Planets 10.1029/2018JE005821
Figure 9. Quantification of strain during the phases of crater modification, the duration of each phase is indicated bythe gray highlighting beneath the plots. Individual plots show: (a) strain rate, (b) kinematic vorticity number,(c) cumulative material rotation (i.e., orientation), (d) distension, (e) total deviatoric strain, calculated as the sum of√
𝜖J2, and (f) rates of principal strain through time. Additional data may be found in the supporting information(Figure S5).
Meanwhile, the minimum deviatoric principal stress decreases causing large shear stresses during the cen-tral peak entrainment phase. Pressure in the peak-ring material during entrainment reaches up to nearly100 MPa (Figure 11b). During this phase, the maximum principal stress orientation rotates from plunginggently outward, through horizontal to plunging inward until the central uplift reaches its maximum height
Figure 10. Flinn-Ramsay diagram of strain ellipsoids corresponding to each phase of peak-ring formation. K-numbersand D-numbers/ octahedral shear strain (𝜀s), which respectively describe the shape of the strain ellipsoid and themagnitude of strain, are contoured.
RAE ET AL. 410
Journal of Geophysical Research: Planets 10.1029/2018JE005821
Figure 11. Stress magnitudes and pressure through time during crater modification, modification phases arehighlighted as gray areas beneath: (a) principal deviatoric stress magnitudes and (b) pressure and maximum resolvableshear stress.
at t = 180 s. Whereupon, the maximum principal stress remains in the same orientation as the central upliftbegins to collapse (Figure 12c).
As the peak-ring material moves outward during the collapse of the central peak, the hoop stress, whichis intermediate during central peak entrainment, continually decreases and becomes the minimum princi-pal stress as the outward transport phase begins (Figures 11a and 12d). During this phase, the maximumprincipal stress plunges inward. This orientation gradually becomes less steep as the peak ring is emplaced;simultaneously, pressures in the peak-ring material gradually decrease as the peak ring loses height due tothe hoop extension.
The relaxation phase of crater modification occurs as the stress state of the rocks returns to normal lithostaticconditions. The beginning of this phase is marked by the hoop stress becoming intermediate. As this phasecontinues, the maximum principal stress rotates to become vertical, that is, becomes entirely composed ofthe lithostatic stress (Figure 12e). During this phase, all but the most superficial material of the peak ringcease to move.
5. Comparison to Observations From the Chicxulub Peak RingObservations of impact-related deformation experienced by peak-ring material in the Chicxulub impactstructure have been presented by Riller et al. (2018). Alongside shock deformation, evident by shatter cones,PDFs, and planar fractures in quartz and feldspars, severe structural modification is evident by brittle andductile deformation structures. Most importantly, it is possible to determine the relative timing of the varioustypes of deformation.
The first impact-related deformation to occur to the target rocks was shock metamorphism and pervasivefracturing at the grain scale. The fragmented geometry of the pervasively fractured target rock was then trun-cated by cataclasites and ultracataclasites. These cataclasites are spaced every few meters and occasionallycrosscut each other. The cataclasites and ultracataclasites are, in turn, consistently offset by striated faultsurfaces and millimeter-wide shear faults. Six hundred two striated fault surfaces were recorded in the core,some of which can be found within clasts of target rock within impact melt rock dikes and suevitic brecciadikes. These dikes are devoid of cataclasites and shear faults; however, they do contain abundant evidenceof ductile strain. Meanwhile, target rocks within a zone of abundant breccia dikes and melt rock dikes from1,220–1,316 mbsf are commonly deformed by brittle-ductile shear bands, which displace cataclasites andthe contacts of melt rock dikes and breccia dikes. These ductile and brittle-ductile structures always indicatea normal shear sense.
Thus, in summary, a sequence of deformation experienced by peak-ring rocks during cratering can bedefined: first, shock deformation and pervasive fracturing (Figures 13a and 13b), followed by the formationof cataclasites and ultracataclasites (Figures 13c and 13d), striated faults and shear faults (Figures 13d and13e), the emplacement of breccia and impact melt into dilatant fractures (Figures 13e and 13f), and finally,
RAE ET AL. 411

Journal of Geophysical Research: Planets 10.1029/2018JE005821
Figure 12. Sectional deviatoric Lamé's stress ellipses and Mohr's circle diagrams through the phases of cratermodification. Rotation of the largest principal stress in the r-z sectional stress ellipses through time is indicated, whilethe effect of acoustic fluidization is demonstrated on the Mohr's circle diagrams. The Mohr's circle diagrams drawnhere are the average stress values over the calculated saved time interval, acoustic fluidization supposes thathigh-frequency oscillations may reduce, or increase, pressure about the average, and thus, rock failure may befacilitated when the pressure drops sufficiently that the Mohr's circle intersects the failure envelope. The grayenvelopes schematically indicate the areas that the Mohr's circle passes through during acoustic vibrations.
the formation of brittle-ductile and ductile shear bands (Figure 13f). It shall now be demonstrated how theseobservations are consistent with quantitative results derived from numerical simulations.
5.1. Pervasive FracturingThe controls of fault and fracture formation under compressional rock failure is a complex subject (Rameshet al., 2015); nevertheless, the length scale at which faults and fractures form is controlled by strain, strainrate, and the speed at which fractures propagate (Melosh, 2005). Given a fixed amount of strain, high strainrates cause more closely spaced fractures than low strain rates. The cause of this behavior is that fracturescannot be longer than the distance that sound travels in the time that deformation occurs in. Consequently,the rapid, and predominantly pure shear deformation during shock and decompression at strain rates nearto 100 s−1, is expected to be the cause of pervasive fractures at the subgrain scale.
The likelihood that fractures occur on small length scales during shock and decompression, can be examinedquantitatively by considering the compressional fragmentation model presented by Melosh et al. (2017),adapted from the tensional fragmentation model of Grady and Kipp (1980), where modal fracture spacing,l, is related to deviatoric strain, 𝜖 by the following:
RAE ET AL. 412

Journal of Geophysical Research: Planets 10.1029/2018JE005821
Figure 13. Sequence of deformation in Hole M0077A described in detail by Riller et al. (2018). (a) Shatter conefragment from a breccia clast (708.50 mbsf; Morgan et al., 2016). (b) Plane-polarized transmitted light image ofpervasive subgrain-scale fracturing in quartz with planar fractures and planar deformation features, pore spaces arefilled with blue-dyed epoxy (1,076.15 mbsf). (c) Cataclasite (925.74 mbsf). (d) Cataclasite truncated by shear faults(1,255.54 mbsf). (e) Shear-faulted granite as clast within melt-bearing breccia (1,281.48 mbsf). (f) Ductile shearstructure in melt-bearing breccia with normal shear sense displacement (white half-arrows; 1,289.64 mbsf).
l = 4[ (m + 1)(m + 3)4
8πk(m + 2)5 ]1∕3𝜖−m∕3 (2)
where m and k are the parameters that describe the Wiebull distribution of available flaws for fracture nucle-ation, N = kem. During shear failure, these parameters have values of m = 3
2and k ≈ 2.6 × 10⁹ m−3
(Melosh et al., 2017; Ramesh et al., 2015). Using these values, and a value of 𝜖 equal to the cumulative devi-atoric shear strain during shock (∼0.3; Figure 3d), the fracture spacing for the peak-ring rocks, l = 0.23 cm.This value is similar to the spacing of the subgrain-scale fractures in the granitic target rocks (Figure 13b).Despite the pervasive fracturing that occurs during this stage of crater formation, it is not necessary that thematerial gains volume by dilatancy. Pressures are extremely high during this stage; therefore, fractures willnot distend.
5.2. Cataclasites and UltracataclasitesFollowing shock and decompression, during crater excavation, the material continues to deform by predom-inantly pure shear and is horizontally compressed (Figures 8a and 9b). Consequently, the deformation styleduring this stage of crater formation is not expected to be any different to that during shock and decompres-sion. The low pressure and high strains during excavation are likely to cause the shock-formed fractures todilate and introduce distension to the rocks. Additionally, as the strain rates are an order of magnitude lower(Figure 9a), displacement is likely to localize onto more widely spaced shock-formed fractures.
Toward the end of excavation and into the rim growth phase of crater modification, deformation becomesincreasingly dominated by simple shear (Figure 9b). This change in the type of shear is likely to marka change in deformation style, from pervasive fracture networks, brittlely accommodating a pure sheardisplacement field, to subparallel faults capable of accommodating a simple shear displacement field. Impor-tantly, at the microscopic scale, deformation is never homogeneous and, during the early stages of cratering,is always brittle, occurring by simple shear on fractures. Consequently, macroscale pure shear must beaccommodated by more complex fault arrangements than the fracture networks associated with macroscalesimple shear. It is therefore during rim growth that cataclasites and ultracataclasites are likely to form(Figure 13c).
Following rim growth, there is a relative hiatus of deformation as peak-ring material is transported inwardtoward the crater center. Nevertheless, during this movement, a substantial solid-body rotation of thepeak-ring material occurs. Additionally, the maximum principal stress changes orientation from approx-imately radially to the hoop direction (Figure 12c). This change must cause the rearrangement of faultsystems in the deforming peak-ring material such that previously utilized faults are abandoned and new
RAE ET AL. 413

Journal of Geophysical Research: Planets 10.1029/2018JE005821
faults form. This new fault arrangement is likely to be transpressional. This phase of deformation maytherefore explain observed cross-cutting relationships between cataclasites (Figure 13d).
5.3. Shear FaultsAs the peak-ring material becomes entrained into the central peak, pressures, deviatoric stresses, instan-taneous strains, and strain rates substantially increase (Figure 9a). Greater strain rates are likely to lead todecreased spacing between deformation structures. Meanwhile, increased pressures from ∼10 to ∼100 MPa(respectively, corresponding to ∼300-m and ∼3-km depths at normal lithostatic conditions) for rocks thatare at ∼650 K is likely to lead to a change in deformation mechanism. The observations of Riller et al.(2018) indicate that cataclasites and ultracataclasites, of which there are 258 recorded occurrences withinthe recovered core, are truncated by shear faults. The total number of shear faults in the recovered core issubstantially greater than the number cataclasites, over 600 striated fault surfaces were measured (Rilleret al., 2018), and these only represent the subset of shear faults that possess open surfaces. Consequently,it is clear that the spacing between the cataclasites and ultracataclasites, which formed early during crater-ing, is more than double the average spacing between the later deformation structures seen as cross-cuttingshear faults. This relationship is qualitatively consistent with the increase in strain rate that occurs duringcentral peak entrainment.
5.4. Melt Intrusion and DeformationOnce the central peak begins to collapse, peak-ring material moves outward atop the collapsed transientcrater rim, now capped with material originally ejected from the transient cavity, and is itself capped byimpact melt. As a consequence of the radially outward directed velocity field, the minimum principal stresschanges orientation to the hoop direction. This stress regime causes maximum principal stretching in thehoop direction, which, in a natural system, would cause radially oriented, transtensional fault systems. Suchfaults may have facilitated the intrusion and mixture of impact melt and breccia bodies within the peak-ringmaterial (Figure 13e).
The final phase of peak-ring formation, relaxation, occurs at strain rates beginning to approach conventionaltectonic strain rates of 10−5 s−1 (Figure 9c) under stress conditions of normal failure, that is, 𝜎1 orientedvertically (Figure 12e). The shocked target rocks in the peak ring are at ∼650 K, while the impact melt rocksand suevitic breccias are likely to be at temperatures significantly in excess of 1000 K. It is therefore nosurprise that the last phase of impact deformation is brittle-ductile in the shocked target rocks and is ductilein the suevites and impact melt rocks. Additionally, the shear sense of these structures is always normal,amounting the maximum extension in the horizontal direction (Figure 13f).
5.5. Discussion of UncertaintiesBefore proceeding to conclude this contribution, it is necessary to consider the uncertainties associatedwith the analysis of a numerical simulation in this way. Here, we have focused upon the stress-strain his-tory of just one Lagrangian pseudo-cell. The exact location of this pseudo-cell does not directly correspondto the location of the recent IODP-ICDP drill core. The primary reason for this chosen difference is thatLagrangian tracer particles close to the free surface, where there is limited confining pressure, can behavewithout coherency to their neighboring tracer particles, thus removing any meaning from calculated straininformation. Instead, the location of the selected pseudo-cell was chosen to be at the center of the peak-ringmaterial, such that it would be representative of the deformation of the entire peak-ring structure. Thestress-strain history of other pseudo-cells within the peak ring is quantitatively similar, to the one pseudo-cellpresented here, with some systematic variations on properties such as material orientation (see supportinginformation; Figures S6–S8).
6. ConclusionsThis work presents a detailed analysis of the temporal evolution of stress and strain within the peak-ringmaterial of a numerical impact simulation. Our approach provides a template for directly comparing struc-tural observations from impact structures with numerical impact simulations. This type of analysis allowsfor quantitative constraints on: the timing of deformation, the orientation, and the magnitude of strain asso-
RAE ET AL. 414

Journal of Geophysical Research: Planets 10.1029/2018JE005821
ciated with each stage of the impact cratering process and the orientation and magnitude of stress duringshock, crater excavation, and crater modification.
The remarkable consistency between the stress-strain-time path of material within the Chicxulub peak ringduring cratering with the complex sequence of observations of deformation from the recent IODP-ICDP drillcore from the Chicxulub peak ring suggests that, kinematically, the dynamic collapse model of peak-ringformation is accurate. The kinematics of the model requires that one or more transient dynamical weakeningmechanism operates and that the total effect of these mechanism(s) must be consistent with the rheologicalproperties of the block model implementation of acoustic fluidization used here. Consequently, significantpredictions can be made by the dynamic collapse model on the properties of rocks around complex craters,including but not limited to the orientation of faults, fractures, and microfractures; porosity and permeabilitystructure and anisotropy; and the formation of frictionally generated pseudotachylites.
While the recent IODP-ICDP drill core and the importance of peak-ring formation motivated the focusof this work upon the deformation of peak-ring rocks, we emphasize that the same methodology has ageneral application. For example, directly related to this study, this type of analysis may provide furtherinsight into large crater formation through a comparison between the three largest impact structures onEarth—Vredefort, Sudbury, and Chicxulub—which each provide access to structural deformation at differ-ent depths beneath the crater floor. Furthermore, detailed comparison between structural observations atterrestrial and extraterrestrial craters and their corresponding numerical simulations may be particularlyinsightful in revealing changes in deformation style between craters of different sizes or on different terrains.
Appendix A: Expedition 364 ScientistsS. P. S. Gulick1,2, J. V. Morgan3, E. Chenot4, G. L. Christeson2, P. Claeys5, C. S. Cockell6, M. J. L. Coolen7,L. Ferrière8, C. Gebhardt9, K. Goto10, S. Green11, H. Jones12, D. A. Kring13, J. Lofi4, C. M. Lowery2, R.Ocampo-Torres14, L. Perez-Cruz15, A. E. Pickersgill16,17, M. Poelchau18, A. S. P. Rae2,18, C. Rasmussen4,19, M.Rebolledo-Vieyra20, U. Riller21, H. Sato22, J. Smit23, S. M. Tikoo24, N. Tomioka25, J. Urrutia-Fucugauchi15,M. T. Whalen26, A. Wittmann27, L. Xiao28, K. E. Yamaguchi29,30.1Department of Geological Sciences, Jackson School of Geosciences, University of Texas at Austin,Austin, TX, USA. 2Institute for Geophysics, Jackson School of Geosciences, University of Texas at Austin,Austin, TX, USA. 3Department of Earth Science and Engineering, Imperial College London, London, UK.4Géosciences Montpellier, Université de Montpellier, Montpellier, France. 5Analytical, Environmental andGeo-Chemistry, Vrije Universiteit Brussel, Brussels, Belgium. 6Centre for Astrobiology, School of Physicsand Astronomy, University of Edinburgh, Edinburgh, UK. 7Western Australia Organic and Isotope Geo-chemistry Centre (WA-OIGC), School of Earth and Planetary Sciences, Curtin University, Bentley, WA6102, Australia. 8Natural History Museum, Vienna, Austria. 9Alfred Wegener Institute Helmholtz Cen-tre of Polar and Marine Research, Bremerhaven, Germany. 10International Research Institute of DisasterScience, Tohoku University, Sendai, Japan. 11British Geological Survey, Edinburgh, UK. 12Department ofGeosciences, Pennsylvania State University, University Park, PA, USA. 13Lunar and Planetary Institute,Houston, TX, USA. 14Groupe de Physico-Chimie de l'Atmosphère, L'Institut de Chimie et Procédés pourl'Énergie, l'Environnement et la Santé (ICPEES), Université de Strasbourg, Strasbourg, France. 15Instituto deGeofísica, Universidad Nacional Autónoma De México, Ciudad De México, Mexico. 16School of Geographi-cal and Earth Sciences, University of Glasgow, Glasgow, UK. 17Argon Isotope Facility, Scottish UniversitiesEnvironmental Research Centre, East Kilbride, UK. 18Department of Geology, University of Freiburg,Freiburg, Germany. 19Department of Geology and Geophysics, University of Utah, Salt Lake City, UT, USA.20Independent consultant, Cancun, Mexico. 21Institut für Geologie, Universität Hamburg, Hamburg, Ger-many. 22Japan Agency for Marine-Earth Science and Technology, Kanagawa, Japan. 23Faculty of Earth andLife Sciences (FALW), Vrije Universiteit Amsterdam, Amsterdam, Netherlands. 24Earth and Planetary Sci-ences, Rutgers University, New Brunswick, NJ, USA. 25Kochi Institute for Core Sample Research, JapanAgency for Marine-Earth Science and Technology, Kochi, Japan. 26Department of Geosciences, Universityof Alaska Fairbanks, Fairbanks, AK, USA. 27Eyring Materials Center, Arizona State University, Tempe, AZ,USA. 28School of Earth Sciences, Planetary Science Institute, China University of Geosciences, Wuhan,China. 29Department of Chemistry, Toho University, Chiba, Japan. 30NASA Astrobiology Institute.
RAE ET AL. 415

Journal of Geophysical Research: Planets 10.1029/2018JE005821
Appendix B: Author ContributionsThe work in this contribution was carried out during the PhD research of A. S. P. R. The PhD project wasplanned and supervised by J. V. M., G. S. C., R. A. F. G., and G. R. O.. T. D. and G. S. C. implemented code toiSALE such that postprocessing could be carried out. A. S. P. R. carried out the iSALE numerical simulationsand postprocessing of the results. G. S. C., M. P., U. R., T. D., R. A. F. G., G. R. O., and J. V. M. contributedthrough discussions prior to the manuscript being written. A. S. P. R. wrote the first draft and all authorscontributed to subsequent drafts.
Appendix C: Data AvailabilityiSALE is not a publicly available code; however, depending on usage terms, access is available upon requestof the lead developers. Details of iSALE access are available at the iSALE website (www.isale-code.de).A GitHub repository containing additional supporting information pertaining to this contribution maybe found at the GitHub website (https://github.com/ImperialCollegeLondon/Chicxulub_StressStrain; DOI:10.5281/zenodo.1406165). The repository contains input files for the presented iSALE simulations and thepySALEPlot script used to calculate stress and strain. Data from IODP-ICDP Expedition 364 is availableupon request from the IODP website (http://iodp.pangaea.de/).
References
Allmendinger, R. W., Cardozo, N., & Fisher, D. M. (2012). Structural geology algorithms: Vectors and tensors. New York: CambridgeUniversity Press.
Amsden, A. A., Ruppel, H. M., & Hirt, C. W. (1980). SALE: A simplified ALE computer program for fluid flow at all speeds (LA-8095).New Mexico: Los Alamos National Laboratories.
Anderson, C. E. (1987). An overview of the theory of hydrocodes. International Journal of Impact Engineering, 5(1-4), 33–59.Benz, W., Cameron, A., & Melosh, H. (1989). The origin of the Moon and the single-impact hypothesis III. Icarus, 81(1), 113–131.Chapman, C. R., & McKinnon, W. B. (1986). Cratering of planetary satellites. In J. A. Burns & M. S. Matthews (Eds.), Satellites (pp. 492–580).
Tucson, AZ: University of Arizona Press.Collins, G. S. (2014). Numerical simulations of impact crater formation with dilatancy. Journal of Geophysical Research: Planets, 119,
2600–2619. https://doi.org/10.1002/2014JE004708Collins, G. S., Melosh, H. J., & Ivanov, B. A. (2004). Modeling damage and deformation in impact simulations. Meteoritics & Planetary
Science, 39(2), 217–231.Collins, G. S., Melosh, H. J., Morgan, J. V., & Warner, M. R. (2002). Hydrocode simulations of Chicxulub crater collapse and peak-ring
formation. Icarus, 157(1), 24–33. https://doi.org/10.1006/icar.2002.6822Collins, G. S., Morgan, J., Barton, P., Christeson, G. L., Gulick, S., Urrutia, J., et al. (2008). Dynamic modeling suggests terrace
zone asymmetry in the Chicxulub crater is caused by target heterogeneity. Earth and Planetary Science Letters, 270(3–4), 221–230.https://doi.org/10.1016/j.epsl.2008.03.032
Collins, G. S., Patel, N., Rae, A. S. P., Davies, T. M., Morgan, J. V., Gulick, S. P. S., & Expedition 364 Scientists (2017). Numerical simula-tions of chicxulub crater formation by oblique impact. In 48th Lunar and Planetary Science Conference (Abstract 1832, pp. 20–24). TheWoodlands, TX.
Davison, T. M., Collins, G. S., & Bland, P. A. (2016). Mesoscale modeling of impact compaction of primitive solar system solids. TheAstrophysical Journal, 821(1), 68. https://doi.org/10.3847/0004-637X/821/1/68
Dence, M. R. (1965). The extraterrestrial origin of Canadian craters. Annals of the New York Academy of Sciences, 123(2), 941–969.https://doi.org/10.1111/j.1749-6632.1965.tb20411.x
Dence, M. R., Grieve, R. A. F., & Robertson, P. B. (1977). Terrestrial impact structures-principal characteristics and energy considerations.In D. J. Roddy, R. O. Pepin, & R. B. Merrill (Eds.), Impact and explosion cratering (pp. 247–275). New York: Pergamon Press.
Elbeshausen, D., Wünnemann, K., & Collins, G. S. (2009). Scaling of oblique impacts in frictional targets: Implications for crater size andformation mechanisms. Icarus, 204(2), 716–731. https://doi.org/10.1016/j.icarus.2009.07.018
Fossen, H. (2016). Structural geology (2nd ed.). Bergen, Norway: Cambridge University Press.Fossen, H., & Tikoff, B. (1993). The deformation matrix for simultaneous simple shearing, pure shearing and volume
change, and its application to transpression-transtension tectonics. Journal of Structural Geology, 15(3), 413–422.https://doi.org/10.1016/0191-8141(93)90137-Y
Grady, D. E., & Kipp, M. E. (1980). Continuum modelling of explosive fracture in oil shale. International Journal of Rock Mechanics andMining Sciences & Geomechanics Abstracts, 17(3), 147–157. https://doi.org/10.1016/0148-9062(80)91361-3
Grieve, R., Robertson, P., & Dence, M. (1981). Constraints on the formation of ring impact structures, based on terrestrial data. In Multi-ringbasins: Formation and evolution (pp. 37–57). New York and Oxford: Pergamon Press.
Gulick, S. P. S., Barton, P. J., Christeson, G. L., Morgan, J. V., McDonald, M., Mendoza-Cervantes, K., et al. (2008). Importance of pre-impactcrustal structure for the asymmetry of the Chicxulub impact crater. Nature Geoscience, 1(2), 131. https://doi.org/10.1038/ngeo103
Gulick, S., Christeson, G., Barton, P., Grieve, R., Morgan, J., & Urrutia-Fucugauchi, J. (2013). Geophysical characterization of the Chicxulubimpact crater. Reviews of Geophysics, 51, 31–52. https://doi.org/10.1002/rog.20007
Hildebrand, A. R., Penfield, G. T., Kring, D. A., Pilkington, M., Camargo Z. A., Jacobsen, S. B., & Boynton, W. V. (1991).Chicxulub crater: A possible cretaceous/tertiary boundary impact crater on the yucatan Peninsula, Mexico, Geology, 19(9), 867–871.https://doi.org/10.1130/0091-7613(1991)019<0867:CCAPCT>2.3.CO;2
Ivanov, B. A. (2005). Numerical modeling of the largest terrestrial meteorite craters. Solar System Research, 39(5), 381–409.https://doi.org/10.1007/s11208-005-0051-0
AcknowledgmentsThe authors would like to thankThomas Kenkmann, Nick Timms, andJay Melosh for useful discussions andconversations that encouraged thedevelopment of this work.Additionally, we would like to thankBoris Ivanov and an anonymousreferee for their detailed andconstructive comments thatsignificantly improved this paper. Wegratefully acknowledge the developersof iSALE: Kai Wünnemann, GarethCollins, Dirk Elbeshausen, TomDavison, Boris Ivanov, and Jay Melosh.Plots in this work were created withthe pySALEPlot tool written by TomDavison. The Chicxulub drillingexpedition was funded by the IODP asExpedition 364 with cofunding fromthe ICDP. Expedition 364 wasimplemented by ECORD, withcontributions and logistical supportfrom the Yucatán state governmentand UNAM. The work presented herewas funded by STFC (ST/N000803/1)and NERC (NE/P011195/1).
RAE ET AL. 416

Journal of Geophysical Research: Planets 10.1029/2018JE005821
Ivanov, B. A., Deniem, D., & Neukum, G. (1997). Implementation of dynamic strength models into 2D hydrocodes:Applications for atmospheric breakup and impact cratering. International Journal of Impact Engineering, 17(1–5), 375–386.https://doi.org/10.1016/S0734-743X(97)87511-2
Ivanov, B. A., & Kostuchenko, V. N. (1997). Block oscillation model for impact crater collapse. In 28th Lunar and Planetary ScienceConference (Abstract 631, pp. 631). Texas.
Kring, D. A., Kramer, G. Y., Collins, G. S., Potter, R. W., & Chandnani, M. (2016). Peak-ring structure and kinematics from amulti-disciplinary study of the Schrödinger impact basin. Nature Communications, 7(13), 161.
Le Feuvre, M., & Wieczorek, M. A. (2011). Nonuniform cratering of the Moon and a revised crater chronology of the inner Solar System.Icarus, 214(1), 1–20. https://doi.org/10.1016/j.icarus.2011.03.010
Melosh, H. J. (1979). Acoustic fluidization: A new geologic process? Journal of Geophysical Research, 84(B13), 7513–7520.https://doi.org/10.1029/JB084iB13p07513
Melosh, H. J. (1989). Impact cratering: A geologic process, No. 11 In Oxford monographs on geology and geophysics. New York: OxfordUniversity Press.
Melosh, H. J. (2005). The mechanics of pseudotachylite formation in impact events. In Impact tectonics (pp. 55–80). Berlin, Heidelberg:Springer. https://doi.org/10.1007/3-540-27548-7_2
Melosh, H. J., & Ivanov, B. A. (1999). Impact crater collapse. Annual Review of Earth and Planetary Sciences, 27(1), 385–415.https://doi.org/10.1146/annurev.earth.27.1.385
Melosh, H. J., Johnson, B. C., & Bowling, T. J. (2017). Impact spall and fragmentation by near-surface stress wave interactions. In 48thLunar and Planetary Science Conference (Abstract 2051).
Melosh, H. J., Ryan, E. V., & Asphaug, E. (1992). Dynamic fragmentation in impacts: Hydrocode simulation of laboratory impacts. Journalof Geophysical Research, 97(E9), 14,735–14,759. https://doi.org/10.1029/92JE01632
Morgan, J. V., Gulick, S. P. S., Bralower, T., Chenot, E., Christeson, G., Claeys, P., et al. (2016). The formation of peak rings in large impactcraters. Science, 354(6314), 878–882. https://doi.org/10.1126/science.aah6561
Morgan, J., Gulick, S., Mellet, C. L., Green, S. L., & the Expedition 364 Scientists (2017). Chicxulub: Drilling the K-Pg impactcrater. Proceedings of the International Ocean Discovery Program, 364. College Station, TX: International Ocean Discovery Program.https://doi.org/10.14379/iodp.proc.364.2017
Morgan, J., Warner, M., the Chicxulub Working Group, Brittan, J., Buffler, R., Camargo, A., et al. (1997). Size and morphology of theChicxulub impact crater. Nature, 390(6659), 472–476. https://doi.org/10.1038/37291
Penfield, G. T., & Camargo, Z. A. (1981). Definition of a major igneous zone in the central Yucatan platform with aeromagnetics andgravity, Technical program, abstracts and biographies (Society of Exploration Geophysicists 51st Annual International Meeting): Los Angeles(pp. 37). College Station, TX: Society of Exploration Geophysicists.
Pierazzo, E., Kring, D. A., & Melosh, H. J. (1998). Hydrocode simulation of the Chicxulub impact event and the production of climaticallyactive gases. Journal of Geophysical Research, 103(E12), 28,607–28,625.
Pierazzo, E., Vickery, A. M., & Melosh, H. J. (1997). A reevaluation of impact melt production. Icarus, 127(2), 408–423.https://doi.org/10.1006/icar.1997.5713
Pike, R. J. (1974). Depth/diameter relations of fresh lunar craters: Revision from spacecraft data. Geophysical Research Letters, 1(7), 291–294.Ramesh, K. T., Hogan, J. D., Kimberley, J., & Stickle, A. (2015). A review of mechanisms and models for dynamic failure, strength, and
fragmentation. Planetary and Space Science, 107, 10–23. https://doi.org/10.1016/j.pss.2014.11.010Ramsay, J., & Huber, M. (1983). The techniques of modern structural geology: Strain analysis (Vol. 1). London, New York: Academic Press.Riller, U., Poelchau, M. H., Rae, A. S. P., Schulte, F. M., Collins, G. S., Melosh, H. J., et al. Expedition 364 Science Party, IODP-ICDP (2018).
Rock fluidization during peak-ring crater formation. Nature, 562(7728), 511. https://doi.org/10.1038/s41586-018-0607-zShoemaker, E. M. (1962). Interpretation of lunar craters, Physics and astronomy of the Moon (pp. 283–359). New York: Elsevier.Thompson, S. L., & Lauson, H. S. (1974). Improvements in the CHART D radiation-hydrodynamic code III: Revised analytic equations of
state (SC-RR-710714). Alberquerque, New Mexico: Sandia National Laboratory.Tikoff, B., & Fossen, H. (1995). The limitations of three-dimensional kinematic vorticity analysis. Journal of Structural Geology, 17(12),
1771–1784. https://doi.org/10.1016/0191-8141(95)00069-PWünnemann, K., Collins, G. S., & Melosh, H. J. (2006). A strain-based porosity model for use in hydrocode simulations of impacts and
implications for transient crater growth in porous targets. Icarus, 180(2), 514–527. https://doi.org/10.1016/j.icarus.2005.10.013
RAE ET AL. 417