Stress Response Escherichia Elevated Hydrostatic Pressurejb.asm.org/content/175/22/7170.full.pdf ·...
8
Vol. 175, No. 22 JOURNAL OF BACrERIOLOGY, Nov. 1993, p. 7170-7177 0021-9193/93/227170-08$02.00/0 Copyright © 1993, American Society for Microbiology Stress Response of Escherichia coli to Elevated Hydrostatic Pressure TIMOTHY J. WELCH,1 ANNE FAREWELL,2 FREDERICK C. NEIDHARDT,2 AND DOUGLAS H. BARTLETT}* Center for Marine Biomedicine and Biotechnology, Scripps Institution of Oceanography, University of California, San Diego, La Jolla, California 92093-0202,1 and Department of Microbiology and Immunology, University of Michigan Medical School, Ann Arbor, Michigan 48109-062O2 Received 22 July 1993/Accepted 17 September 1993 The response of exponentially growing cultures of Escherichia coli to abrupt shifts in hydrostatic pressure was studied. A pressure upshift to 546 atm (55,304 kPa) of hydrostatic pressure profoundly perturbed cell division, nucleoid structure, and the total rate of protein synthesis. The number of polypeptides synthesized at increased pressure was greatly reduced, and many proteins exhibited elevated rates of synthesis relative to total protein synthesis. We designated the latter proteins pressure-induced proteins (PIPs). The PIP response was transient, with the largest induction occurring approximately 60 to 90 min postshift. Fifty-five PIPs were identified. Many of these proteins are also induced by heat shock or cold shock. The PIP demonstrating the greatest pressure induction was a basic protein of 15.6 kDa. High pressure inhibits growth but does not inhibit the synthesis of stringently controlled proteins. Cold shock is the only additional signal which has been found to elicit this type of response. These data indicate that elevated pressure induces a unique stress response in E. coli, the further characterization of which could be useful in delineating its inhibitory nature. Pressure is a physical parameter which has influenced the evolution and distribution of life. For example, in the deep sea, obligatory barophilic bacteria which require pressures greater than 1,000 atm for optimal growth (1 atm = 1.01325 x 10⁵ Pa = 1.01325 bars = 14.7 lb/in2; 36) have been isolated. Although there is little information regarding the mechanisms of bacte- rial adaptation to high pressure, the fundamental basis of all pressure effects stems from the changes in volume which accompany biochemical and physiological processes. High pressure inhibits the rate or extent of reactions which result in an increase in the volume of activated complexes or end products. Conversely, high pressure promotes reactions which decrease overall system volumes. In many cases, the volume changes are due to changes in water structure around proteins, nucleic acids, ions, and enzyme substrates (27). Although numerous studies have investigated high-pressure effects on particular functions in Escherichia coli, a bacterial species that does not ordinarily grow at high pressure, controversy remains as to the key pressure points which limit the growth of bacteria at high pressure (14, 20, 22). The effects of elevated pressure on E. coli are pleiotropic. Both rotation of the flagellum and flagellar filament polymer- ization are affected at pressures well below those which affect cell growth (16). The proton-translocating ATPase is also pressure sensitive (14). Because the capacity of this enzyme to promote proton translocation across the membrane is consid- erably more sensitive to elevated pressure than is its ability to catalyze ATP hydrolysis, cells under pressure expend more energy pumping protons. Moderate pressures in the range of 200 to 500 atm inhibit cell division more than cell growth, causing single cells to form long filaments (42). Moderate pressures also lengthen the lag period of E. coli cultures (41). When the uptake of radiolabeled thymine, leucine, and uracil is measured, the results indicate that DNA synthesis stops at around 500 atm, protein synthesis stops at around 580 atm, and RNA synthesis stops at around 770 atm (38). At certain pressures, cell division and DNA synthesis become partially synchronous, perhaps because elevated pressure inhibits new * Corresponding author. rounds of DNA replication. The sensitivity of protein synthesis to high pressure is likely caused by pressure inhibition of aminoacyl tRNA binding to the ribosomes and loose couple formation (6, 21). Moderate pressures are known to affect the quaternary structures of many proteins (33). Although E. coli is not a bacterial species which is believed to have evolved specific mechanisms for coping with variation in hydrostatic pressure, many of the effects of pressure could overlap with those of stressors to which E. coli has evolved adaptational mechanisms. Identification of such overlaps could reveal fundamental aspects of the inhibitory effect of high pressure on cell metabolism. As a starting point for analysis of the biochemical effects of, and physiological responses to, elevated pressure, we chose to monitor the high-pressure protein responders synthesized in E. coli. In addition, the extensive gene-protein data base available for E. coli was used to identify proteins whose relative rates of synthesis are elevated under high pressure. The data show that elevated hydrostatic pressure induces a unique stress response in E. coli which results in higher levels of both heat shock proteins (HSPs) and cold shock proteins (CSPs), as well as of many proteins which appear only in response to high pressure. MATERIALS AND METHODS Bacterial strain, media and growth conditions. E. coli K-12 strain W3110 (26) cells were grown at 28°C in morpholine propanesulfonic acid (MOPS) minimal medium (17) that was modified for anaerobic growth by increasing the MOPS buffer concentration to 80 mM. Glucose (0.8% [wt/vol]) was added as a carbon and energy source. Cells were grown anaerobically to a steady state in 25-ml Monovett syringes (Sarstedt Inc., Newton, N.C.). All culture manipulations were done in an anaerobic glove box under nitrogen gas to minimize introduc- tion of oxygen into the culture. It was necessary to culture E. coli anaerobically when incubating cells under elevated pres- sure because gases such as oxygen can become toxic at increased partial pressures (13). For the viability experiments, bacteria were diluted into L broth (5) and plated onto the same medium containing 1.5% agar (Difco Laboratories, Detroit, Mich.). 7170 on June 2, 2018 by guest http://jb.asm.org/ Downloaded from
Transcript of Stress Response Escherichia Elevated Hydrostatic Pressurejb.asm.org/content/175/22/7170.full.pdf ·...

Vol. 175, No. 22JOURNAL OF BACrERIOLOGY, Nov. 1993, p. 7170-71770021-9193/93/227170-08$02.00/0Copyright © 1993, American Society for Microbiology
Stress Response of Escherichia coli to Elevated Hydrostatic PressureTIMOTHY J. WELCH,1 ANNE FAREWELL,2 FREDERICK C. NEIDHARDT,2 AND DOUGLAS H. BARTLETT}*
Center for Marine Biomedicine and Biotechnology, Scripps Institution of Oceanography, University of California,San Diego, La Jolla, California 92093-0202,1 and Department of Microbiology and Immunology,
University of Michigan Medical School, Ann Arbor, Michigan 48109-062O2
Received 22 July 1993/Accepted 17 September 1993
The response of exponentially growing cultures of Escherichia coli to abrupt shifts in hydrostatic pressurewas studied. A pressure upshift to 546 atm (55,304 kPa) of hydrostatic pressure profoundly perturbed celldivision, nucleoid structure, and the total rate of protein synthesis. The number of polypeptides synthesized atincreased pressure was greatly reduced, and many proteins exhibited elevated rates of synthesis relative to totalprotein synthesis. We designated the latter proteins pressure-induced proteins (PIPs). The PIP response wastransient, with the largest induction occurring approximately 60 to 90 min postshift. Fifty-five PIPs wereidentified. Many of these proteins are also induced by heat shock or cold shock. The PIP demonstrating thegreatest pressure induction was a basic protein of 15.6 kDa. High pressure inhibits growth but does not inhibitthe synthesis of stringently controlled proteins. Cold shock is the only additional signal which has been foundto elicit this type of response. These data indicate that elevated pressure induces a unique stress response inE. coli, the further characterization of which could be useful in delineating its inhibitory nature.
Pressure is a physical parameter which has influenced theevolution and distribution of life. For example, in the deep sea,obligatory barophilic bacteria which require pressures greaterthan 1,000 atm for optimal growth (1 atm = 1.01325 x 10⁵ Pa= 1.01325 bars = 14.7 lb/in2; 36) have been isolated. Althoughthere is little information regarding the mechanisms of bacte-rial adaptation to high pressure, the fundamental basis of allpressure effects stems from the changes in volume whichaccompany biochemical and physiological processes. Highpressure inhibits the rate or extent of reactions which result inan increase in the volume of activated complexes or endproducts. Conversely, high pressure promotes reactions whichdecrease overall system volumes. In many cases, the volumechanges are due to changes in water structure around proteins,nucleic acids, ions, and enzyme substrates (27). Althoughnumerous studies have investigated high-pressure effects onparticular functions in Escherichia coli, a bacterial species thatdoes not ordinarily grow at high pressure, controversy remainsas to the key pressure points which limit the growth of bacteriaat high pressure (14, 20, 22).The effects of elevated pressure on E. coli are pleiotropic.
Both rotation of the flagellum and flagellar filament polymer-ization are affected at pressures well below those which affectcell growth (16). The proton-translocating ATPase is alsopressure sensitive (14). Because the capacity of this enzyme topromote proton translocation across the membrane is consid-erably more sensitive to elevated pressure than is its ability tocatalyze ATP hydrolysis, cells under pressure expend moreenergy pumping protons. Moderate pressures in the range of200 to 500 atm inhibit cell division more than cell growth,causing single cells to form long filaments (42). Moderatepressures also lengthen the lag period of E. coli cultures (41).When the uptake of radiolabeled thymine, leucine, and uracilis measured, the results indicate that DNA synthesis stops ataround 500 atm, protein synthesis stops at around 580 atm, andRNA synthesis stops at around 770 atm (38). At certainpressures, cell division and DNA synthesis become partiallysynchronous, perhaps because elevated pressure inhibits new
* Corresponding author.
rounds of DNA replication. The sensitivity of protein synthesisto high pressure is likely caused by pressure inhibition ofaminoacyl tRNA binding to the ribosomes and loose coupleformation (6, 21). Moderate pressures are known to affect thequaternary structures of many proteins (33).Although E. coli is not a bacterial species which is believed
to have evolved specific mechanisms for coping with variationin hydrostatic pressure, many of the effects of pressure couldoverlap with those of stressors to which E. coli has evolvedadaptational mechanisms. Identification of such overlaps couldreveal fundamental aspects of the inhibitory effect of highpressure on cell metabolism. As a starting point for analysis ofthe biochemical effects of, and physiological responses to,elevated pressure, we chose to monitor the high-pressureprotein responders synthesized in E. coli. In addition, theextensive gene-protein data base available for E. coli was usedto identify proteins whose relative rates of synthesis areelevated under high pressure. The data show that elevatedhydrostatic pressure induces a unique stress response in E. coliwhich results in higher levels of both heat shock proteins(HSPs) and cold shock proteins (CSPs), as well as of manyproteins which appear only in response to high pressure.
MATERIALS AND METHODS
Bacterial strain, media and growth conditions. E. coli K-12strain W3110 (26) cells were grown at 28°C in morpholinepropanesulfonic acid (MOPS) minimal medium (17) that wasmodified for anaerobic growth by increasing the MOPS bufferconcentration to 80 mM. Glucose (0.8% [wt/vol]) was added asa carbon and energy source. Cells were grown anaerobically toa steady state in 25-ml Monovett syringes (Sarstedt Inc.,Newton, N.C.). All culture manipulations were done in ananaerobic glove box under nitrogen gas to minimize introduc-tion of oxygen into the culture. It was necessary to culture E.coli anaerobically when incubating cells under elevated pres-sure because gases such as oxygen can become toxic atincreased partial pressures (13). For the viability experiments,bacteria were diluted into L broth (5) and plated onto the samemedium containing 1.5% agar (Difco Laboratories, Detroit,Mich.).
7170
on June 2, 2018 by guesthttp://jb.asm
.org/D
ownloaded from
RESPONSE OF E. COLI TO HYDROSTATIC PRESSURE 7171
High-pressure incubations. Cells were incubated at elevatedhydrostatic pressure in stainless steel pressure vessels equippedwith quick-connect fittings for rapid decompression-recom-pression as previously described (39).
Bacterial growth measurements. The optical density of thebacterial culture was measured with a Spectronic 20 spectro-photometer (Milton Roy Co., Rochester, N.Y.). Direct bacte-rial counts were determined by epifluorescence microscopyafter staining with 4',6-diamidino-2-phenylindole (23).
Determination of relative rates of protein synthesis. Rela-tive rates of protein synthesis were determined by measuringincorporation of L-[4,5-3H]leucine (final concentration, 20 ,uM;165 mCi/mmol; Amersham, Arlington Heights, Ill.) into a cold5% trichloroacetic acid-insoluble fraction. This fraction wascollected by centrifugation as previously described (25). Ra-dioactivity was determined by liquid scintillation counting.
Radioactive labeling of proteins. Proteins were pulse-la-beled by addition of TRAN-35 S-label (1,089 Ci/mmol; 50,uCi/ml; ICN Biomedicals, Inc., Costa Mesa, Calif.) for 30-minperiods at various times before and after pressurization. Toexpose the cells to the label without decompressing the culture,the label was diluted into MOPS medium and 1.5 ml was putinto a small latex finger cot and sealed by clamping the looseend with a metal clamp such that no air spaces existed. Thefinger cots were then placed into 25-ml syringes containing theculture, and syringe needles were affixed to the inside syringetops. After the syringes were placed inside pressure vessels,labeling could be started at any time before or after pressur-ization by inversion of the pressure vessel, which resulted inrupture of the latex balloon by the syringe needle. At the endof a labeling period, the cultures were quickly decompressedand labeling was stopped by addition of nonradioactive methi-onine (final concentration, 50 mM) and cysteine (final concen-tration, 8 mM). Control experiments verified that no proteinlabeling occurred until inversion of the pressure vessels.
One-dimensional SDS-PAGE. One dimensional protein sep-aration was performed by sodium dodecyl sulfate (SDS)-polyacrylamide gel electrophoresis (PAGE) (1). The resolvinggel was 12.5% acrylamide. Protein samples were dissolved inLaemmli sample buffer (9). For fluorography, gels were treatedwith En3Hance (Dupont, Boston, Mass.) before exposure toKodak X-Omat AR film.Two-dimensional PAGE. Both the preparation of cell ex-
tracts for two-dimensional (2D) PAGE and the 2D PAGEitself were performed by the methods of O'Farrell (18) with themodifications of VanBogelen and Neidhardt (31).
Immunoprecipitation. Immunoprecipitations were carriedout as described in the PANSORBIN immunological applica-tions handbook radioimmunoprecipitation protocol (Calbio-chem, San Diego, Calif.).PIP identification. Pressure-induced protein (PIP) isoelec-
tric points (pl) and relative molecular masses were determinedby plottingx ory coordinates versus reference spots of proteinswith known pI or molecular weights (32). Preliminary identi-fication of PIPs was accomplished by comparing PIP alpha-numeric and coordinate positions with those present in the E.coli gene-protein data base (32), as well as by comparing Fig. 7with previously published HSP (28) and CSP (8) autoradio-grams.
RESULTS
Changes in OD, viability, and cell number after pressureupshift. W3110 cultures were divided into two portions at anoptical density (OD) at 600 nm of 0.10 (designated time zero).At this time, one portion was incubated under the original
atmospheric pressure conditions while the other was subjectedto 546 atm of hydrostatic pressure. At various times, bothcultures were sampled to determine OD, viability CFU, andcell numbers (direct cell counts). Although sampling of thehigh-pressure culture necessitated brief periods of decompres-sion and recompression (approximately 30 s), it has previouslybeen found that for bacterial cultures with generation times ofseveral hours, brief decompression-recompression does notaffect cell growth (37). Control experiments in which the ODsof a W3110 culture were measured at time zero and 1,360 minpostshift to 546 atm indicated that the sampling regimen hadno effect on cell growth.
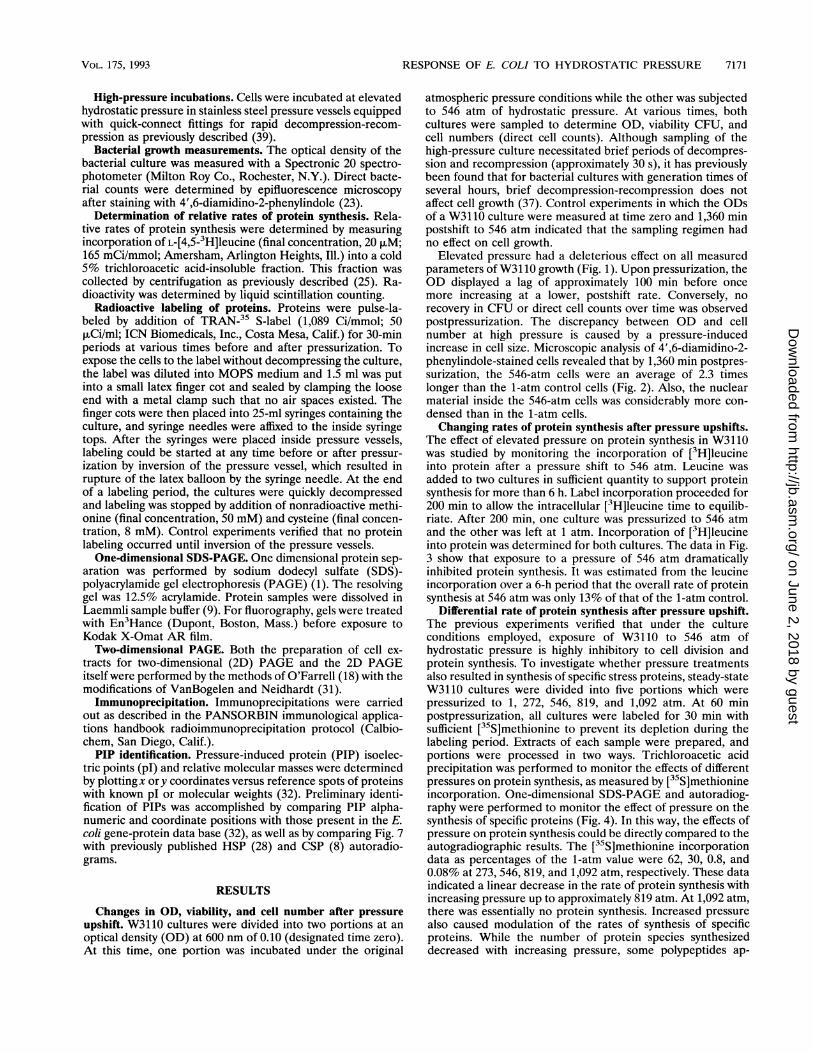
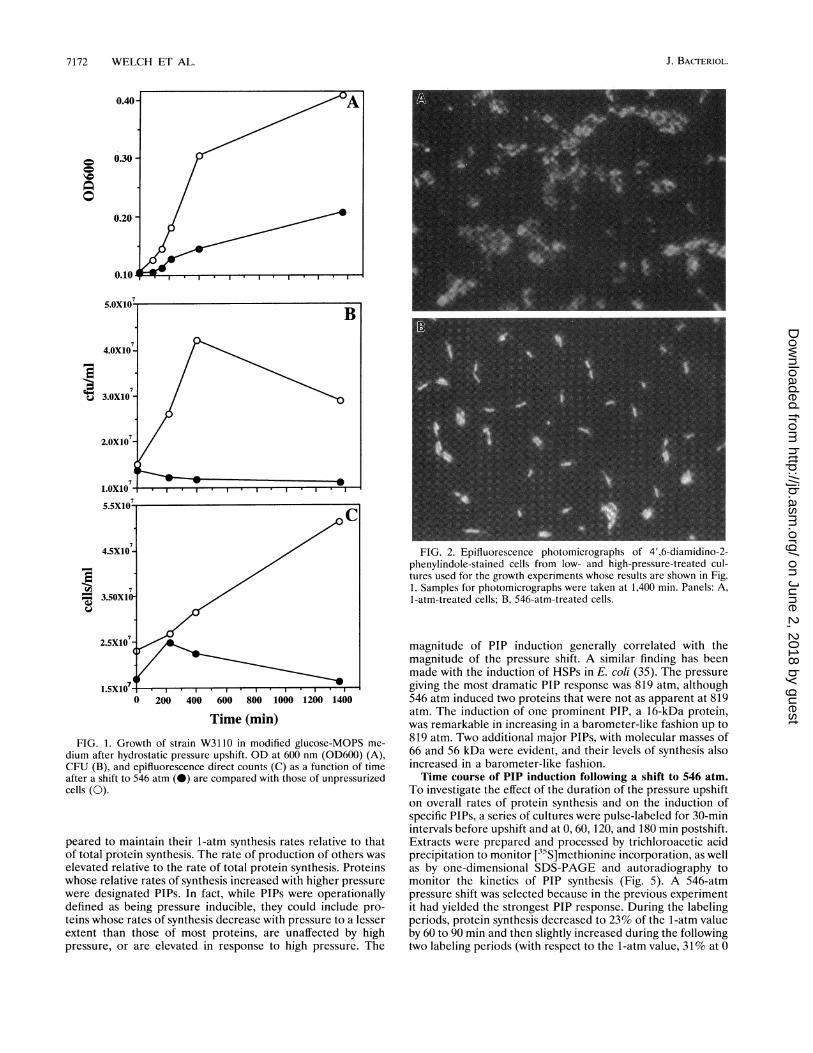
Elevated pressure had a deleterious effect on all measuredparameters of W31 10 growth (Fig. 1). Upon pressurization, theOD displayed a lag of approximately 100 min before oncemore increasing at a lower, postshift rate. Conversely, norecovery in CFU or direct cell counts over time was observedpostpressurization. The discrepancy between OD and cellnumber at high pressure is caused by a pressure-inducedincrease in cell size. Microscopic analysis of 4',6-diamidino-2-phenylindole-stained cells revealed that by 1,360 min postpres-surization, the 546-atm cells were an average of 2.3 timeslonger than the 1-atm control cells (Fig. 2). Also, the nuclearmaterial inside the 546-atm cells was considerably more con-densed than in the 1-atm cells.Changing rates of protein synthesis after pressure upshifts.
The effect of elevated pressure on protein synthesis in W3110was studied by monitoring the incorporation of [3H]leucineinto protein after a pressure shift to 546 atm. Leucine wasadded to two cultures in sufficient quantity to support proteinsynthesis for more than 6 h. Label incorporation proceeded for200 min to allow the intracellular [3H]leucine time to equilib-riate. After 200 min, one culture was pressurized to 546 atmand the other was left at 1 atm. Incorporation of [3H]leucineinto protein was determined for both cultures. The data in Fig.3 show that exposure to a pressure of 546 atm dramaticallyinhibited protein synthesis. It was estimated from the leucineincorporation over a 6-h period that the overall rate of proteinsynthesis at 546 atm was only 13% of that of the 1-atm control.
Differential rate of protein synthesis after pressure upshift.The previous experiments verified that under the cultureconditions employed, exposure of W3110 to 546 atm ofhydrostatic pressure is highly inhibitory to cell division andprotein synthesis. To investigate whether pressure treatmentsalso resulted in synthesis of specific stress proteins, steady-stateW3110 cultures were divided into five portions which werepressurized to 1, 272, 546, 819, and 1,092 atm. At 60 minpostpressurization, all cultures were labeled for 30 min withsufficient [35S]methionine to prevent its depletion during thelabeling period. Extracts of each sample were prepared, andportions were processed in two ways. Trichloroacetic acidprecipitation was performed to monitor the effects of differentpressures on protein synthesis, as measured by [35S]methionineincorporation. One-dimensional SDS-PAGE and autoradiog-raphy were performed to monitor the effect of pressure on thesynthesis of specific proteins (Fig. 4). In this way, the effects ofpressure on protein synthesis could be directly compared to theautogradiographic results. The [35S]methionine incorporationdata as percentages of the 1-atm value were 62, 30, 0.8, and0.08% at 273, 546, 819, and 1,092 atm, respectively. These dataindicated a linear decrease in the rate of protein synthesis withincreasing pressure up to approximately 819 atm. At 1,092 atm,there was essentially no protein synthesis. Increased pressurealso caused modulation of the rates of synthesis of specificproteins. While the number of protein species synthesizeddecreased with increasing pressure, some polypeptides ap-
VOL. 175, 1993
on June 2, 2018 by guesthttp://jb.asm
.org/D
ownloaded from
7172 WELCH ET AL.
00
c)"
L.oxio741.0X10-75.5X10- c
4.5X10
3.50X1*
2.5X107-4
71.5X10
0 200 400 600 800 1000 1200 1400
Time (min)
FIG. 1. Growth of strain W3110 in modified glucose-MOPS me-
dium after hydrostatic pressure upshift. OD at 600 nm (OD600) (A),CFU (B), and epifluorescence direct counts (C) as a function of timeafter a shift to 546 atm (0) are compared with those of unpressurizedcells (0).
peared to maintain their 1-atm synthesis rates relative to thatof total protein synthesis. The rate of production of others waselevated relative to the rate of total protein synthesis. Proteinswhose relative rates of synthesis increased with higher pressurewere designated PIPs. In fact, while PIPs were operationallydefined as being pressure inducible, they could include pro-teins whose rates of synthesis decrease with pressure to a lesserextent than those of most proteins, are unaffected by highpressure, or are elevated in response to high pressure. The
FIG. 2. Epifluorescence photomicrographs of 4',6-diamidino-2-phenylindole-stained cells from low- and high-pressure-treated cul-tures used for the growth experiments whose results are shown in Fig.1. Samples for photomicrographs were taken at 1,400 min. Panels: A,1-atm-treated cells; B, 546-atm-treated cells.
magnitude of PIP induction generally correlated with themagnitude of the pressure shift. A similar finding has beenmade with the induction of HSPs in E. coli (35). The pressuregiving the most dramatic PIP response was 819 atm, although546 atm induced two proteins that were not as apparent at 819atm. The induction of one prominent PIP, a 16-kDa protein,was remarkable in increasing in a barometer-like fashion up to819 atm. Two additional major PIPs, with molecular masses of66 and 56 kDa were evident, and their levels of synthesis alsoincreased in a barometer-like fashion.Time course of PIP induction following a shift to 546 atm.
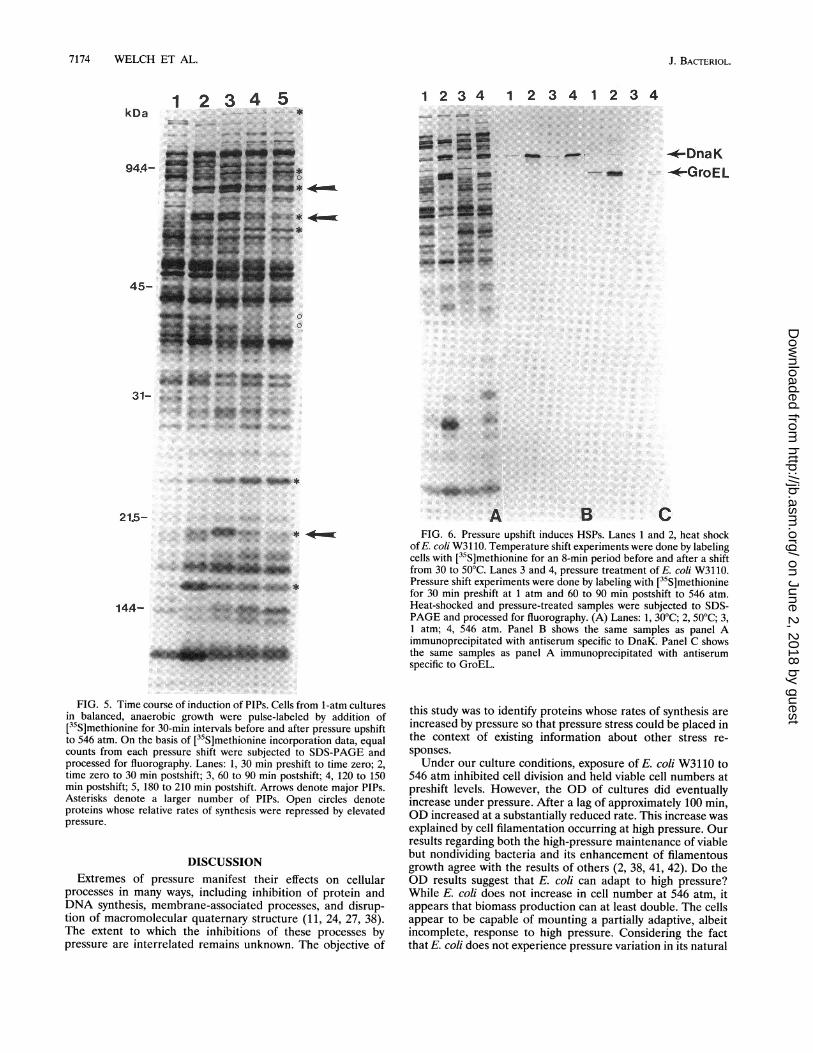
To investigate the effect of the duration of the pressure upshifton overall rates of protein synthesis and on the induction ofspecific PIPs, a series of cultures were pulse-labeled for 30-minintervals before upshift and at 0, 60, 120, and 180 min postshift.Extracts were prepared and processed by trichloroacetic acidprecipitation to monitor [35S]methionine incorporation, as wellas by one-dimensional SDS-PAGE and autoradiography tomonitor the kinetics of PIP synthesis (Fig. 5). A 546-atmpressure shift was selected because in the previous experimentit had yielded the strongest PIP response. During the labelingperiods, protein synthesis decreased to 23% of the 1-atm valueby 60 to 90 min and then slightly increased during the followingtwo labeling periods (with respect to the 1-atm value, 31% at 0
J. BACTERIOL.
on June 2, 2018 by guesthttp://jb.asm
.org/D
ownloaded from

RESPONSE OF E. COLI TO HYDROSTATIC PRESSURE 7173
106
0
coCu
1 r=0~
Cuf.j
*=u
105O 100 200 300 400
time (min)
FIG. 3. Protein synthesis after hydrostatic pressure upshift.[3H]leucine incorporation into protein, measured as a function of timeafter cells were shifted to 546 atm (0), was compared with labelincorporation into protein in unpressurized cells (0).
to 30 min, 23% at 60 to 90 min, 28% at 120 to 150 min, and32% at 180 to 210 min). Although the time course of PIPinduction and repression was different for each PIP, all induc-tions were evident by either the 0- to 30- or 30- to 60-minperiod (Fig. 5). The transient nature of most inductions was
seen by their repression by either 60 to 90 or 120 to 150 min.However, some PIPs maintained elevated levels of synthesiseven 180 to 210 min postshift to high pressure.High pressure induces HSPs. Many stresses that limit cell
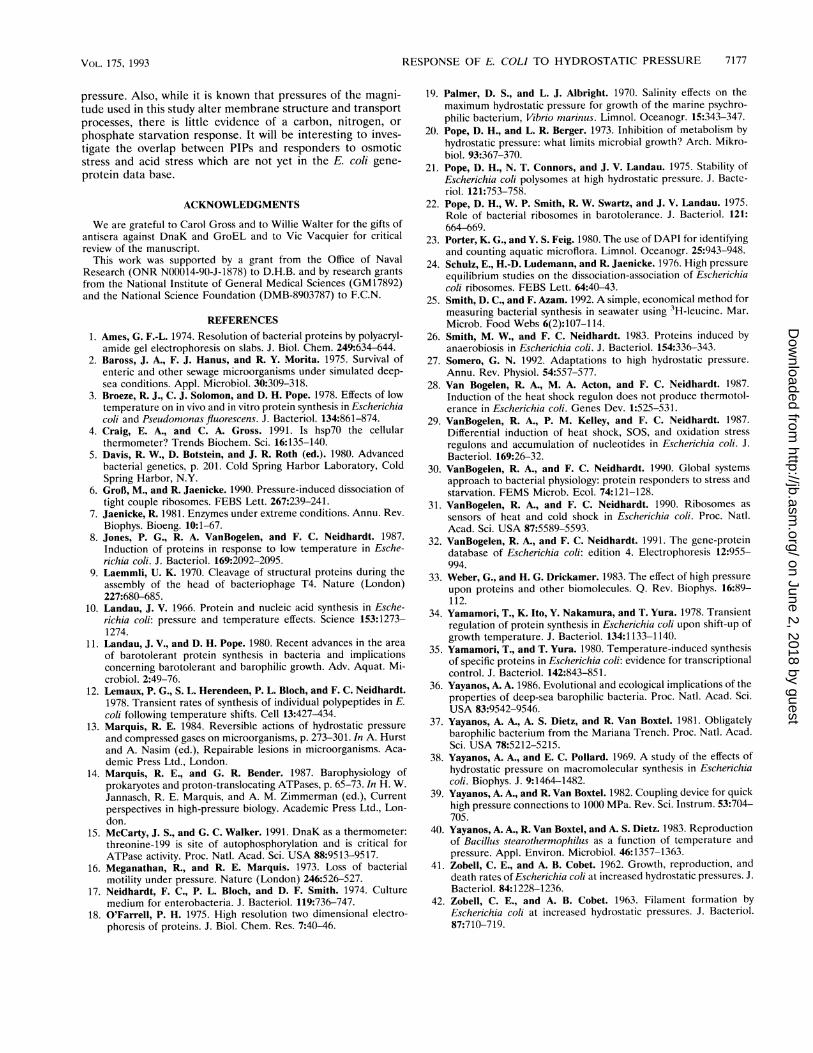
growth induce certain HSPs, particularly the heat shock chap-erones DnaK and GroEL (32). We investigated whetherpressure upshift would induce the synthesis of these HSPs.W3110 cells were heat shocked, and proteins were labeled for8 min before and after a shift to 50°C. Samples were comparedby SDS-PAGE with the labeled proteins synthesized beforeand after the shift to 546 atm. There was a striking similarity inmobility between the proteins induced by heat shock and thoseinduced by high pressure. In particular, among the major PIPs,the 66- and 56-kDa PIPs migrated like HSPs DnaK andGroEL, respectively, while the 16-kDa PIP was not induced byheat shock. To determine whether DnaK or GroEL is specif-ically induced by high pressure, W31 10 proteins labeled pre-
and postshift to a high temperature and pre- and postshift to a
high pressure were immunoprecipitated with polyclonal anti-sera to DnaK (Fig. 6B) and GroEL (Fig. 6C). The resultsindicate that both DnaK and GroEL are indeed PIPs andappear to be the 66- and 56-kDa major PIPs.2D gel analysis and cataloguing of PIPs. To locate addi-
tional PIPs and to make use of the E. coli gene-protein database (32) for preliminary PIP identification, 2D PAGE was
performed. Extracts from W31 10 cells labeled for 30 minimmediately prior to pressure treatment, and beginning at 60min postshift to 546 atm, were prepared, and equal amounts oflabeled protein were subjected to both equilibrium and non-
equilibrium 2D PAGE and autoradiography (Fig. 7). Fifty-fivepolypeptides had markedly higher rates of protein synthesisrelative to total protein synthesis subsequent to the high-pressure upshift. The 16-kDa PIP, PIP 45 (115.9), is a highlybasic protein (approximate pl, 11.0) and resolved near severalbasic ribosomal proteins on nonequilibrium 2D PAGE. Of the
kDa
4_j0:' 66_W_0:;.56_~~~~~~~~~~1 36i:
FIG. 4. Effect of hydrostatic pressure upshift on the pattern ofprotein synthesis. Cells from 1-atm cultures in balanced, anaerobicgrowth were pulse-labeled by addition of [31S]methionine for a 30-mmnperiod at 60 mmn postshift to the indicated pressures. On the basis of[35S]methionine incorporation data, equal counts from each of the firstthree pressure shift samples were subjected to SDS-PAGE andprocessed for fluorography. For the two highest pressure shift samples,incorporation was too low to load counts equal to the first threesamples, and instead a maximum amount of protein was loaded ontothe SDS-PAGE gel. Fluorography of lanes 4 and 5 required 10-foldlonger exposure than the first three lanes. Lanes: 1, 1-atm shift; 2,273-atm shift; 3, 546-atm shift; 4, 819-atm shift; 5, 1,092-atm shift.Arrows denote major PIPS.
55 PIPs, 18 appeared to share coordinates with previouslyidentified proteins, and an additional 12 possible overlaps alsoexisted. Paradoxically, I11 of the 55 PIPs were HSPs (ClpB,ClpP, Lon, RpoH, DnaK, GroEL, GroES, GrpE, G21.0, andF10.1), while 4 of the 55 PIPs were CSPs (G41.2, RecA, HNS,and F10.6). Another interesting feature of the pressure re-sponse is that it did not result in repression of stringentlycontrolled proteins that are normally repressed during shiftsdown in growth rate (arrows in Fig. 7).
VOL. 175, 1993
on June 2, 2018 by guesthttp://jb.asm
.org/D
ownloaded from
7174 WELCH ET AL.
1 2 3 4 1 2 3 4 1 2 3 4kDa
,*-DnaKI7 1 4-GroEL94.4-
45-
31-
21.5-
144-
FIG. 5. Time course of induction of PIPs. Cells from 1-atm culturesin balanced, anaerobic growth were pulse-labeled by addition of[35S]methionine for 30-min intervals before and after pressure upshiftto 546 atm. On the basis of [35S]methionine incorporation data, equalcounts from each pressure shift were subjected to SDS-PAGE andprocessed for fluorography. Lanes: 1, 30 min preshift to time zero; 2,time zero to 30 min postshift; 3, 60 to 90 min postshift; 4, 120 to 150min postshift; 5, 180 to 210 min postshift. Arrows denote major PIPs.Asterisks denote a larger number of PIPs. Open circles denoteproteins whose relative rates of synthesis were repressed by elevatedpressure.
DISCUSSIONExtremes of pressure manifest their effects on cellular
processes in many ways, including inhibition of protein andDNA synthesis, membrane-associated processes, and disrup-tion of macromolecular quaternary structure (11, 24, 27, 38).The extent to which the inhibitions of these processes bypressure are interrelated remains unknown. The objective of
A B CFIG. 6. Pressure upshift induces HSPs. Lanes 1 and 2, heat shock
of E. coli W3110. Temperature shift experiments were done by labelingcells with [35S]methionine for an 8-min period before and after a shiftfrom 30 to 50°C. Lanes 3 and 4, pressure treatment of E. coli W3110.Pressure shift experiments were done by labeling with [35S]methioninefor 30 min preshift at 1 atm and 60 to 90 min postshift to 546 atm.Heat-shocked and pressure-treated samples were subjected to SDS-PAGE and processed for fluorography. (A) Lanes: 1, 30°C; 2, 50°C; 3,1 atm; 4, 546 atm. Panel B shows the same samples as panel Aimmunoprecipitated with antiserum specific to DnaK. Panel C showsthe same samples as panel A immunoprecipitated with antiserumspecific to GroEL.
this study was to identify proteins whose rates of synthesis areincreased by pressure so that pressure stress could be placed inthe context of existing information about other stress re-sponses.Under our culture conditions, exposure of E. coli W3110 to
546 atm inhibited cell division and held viable cell numbers atpreshift levels. However, the OD of cultures did eventuallyincrease under pressure. After a lag of approximately 100 min,OD increased at a substantially reduced rate. This increase wasexplained by cell filamentation occurring at high pressure. Ourresults regarding both the high-pressure maintenance of viablebut nondividing bacteria and its enhancement of filamentousgrowth agree with the results of others (2, 38, 41, 42). Do theOD results suggest that E. coli can adapt to high pressure?While E. coli does not increase in cell number at 546 atm, itappears that biomass production can at least double. The cellsappear to be capable of mounting a partially adaptive, albeitincomplete, response to high pressure. Considering the factthat E. coli does not experience pressure variation in its natural
J. BACTERIOL.
on June 2, 2018 by guesthttp://jb.asm
.org/D
ownloaded from

RESPONSE OF E. COLI TO HYDROSTATIC PRESSURE 7175
LfiI0-
:f * M: 15
I _ I~~L
B
FIG. 7. Autoradiograms of 2D gels of PIPs. Samples were gener-
ated by labeling cells with [35S]methionine for 30 min preshift at 1 atm
(A) and 60 to 90 min postshift to 546 atm (B). Each panel is a
composite of two gels run with the same extract: right, pH 5 to 7ampholine equilibrium gel; left, pH 3 to 10 nonequilibrium gel. PIPsare marked by squares and are numbered as in Table 1. Arrows pointto stringently controlled proteins. Spots: a, protein chain elongationfactor G; b, ribosomal protein S1; c and d, protein chain elongationfactor Tu; e, protein chain elongation factor TS; f and g, ribosomalprotein S6; h, ribosomal protein L12; i, ribosomal protein L7. Spots f,g, and i correspond to PIPs 38, 39, and 43, respectively.
environment, the observed increase in OD following the initiallag is intriguing and suggestive of overlap between certaininhibitory aspects of high pressure and other environmentalstresses for which E. coli has evolved adaptive responses. Thepossible roles of PIPs in the resumption of cell growth atelevated pressure await investigation.Our finding of a correlation between rates of [35S]methi-
onine incorporation and hydrostatic pressure is qualitativelyconsistent with the results of others concerning the pressure
sensitivity of protein synthesis. For example, Yayanos andPollard reported a similar finding (38). However, under our
conditions, E. coli W3110 demonstrated a pressure limit ofapproximately 800 atm, which is at odds with previouslyreported values ranging from 580 to 670 atm (21, 38). Theextent to which strain, medium, and temperature differencescontributed to these discrepancies is unknown, but all of thesevariables have been reported to affect the ability of bacteria to
grow or synthesize protein at increased pressure (11, 19, 40).Another difference is the use of anaerobic cultures in thisstudy. In addition, our high-pressure pulse-labeling techniqueis likely to provide greater sensitivity than the radiolabelaccumulation methods employed in the past to measure trans-lation rates. This is particularly true if differences in proteinturnover rates between low- and high-pressure-treated cellsexist.To monitor the response of E. coli to high pressure without
bias towards any particular aspect of cell physiology, we havechosen a global systems approach. Changes in the synthesis ofproteins were identified from 2D gels, and protein coordinateswere compared with those of proteins in the E. coli gene-protein data base (30, 32). This resulted in the identification of55 PIPs. It is unlikely that additional experiments will result inthe identification of additional PIPs, as the data suggest thatthe magnitude of the pressure stress appears to affect themagnitude of PIP induction rather than which PIPs aresynthesized. The most profound induction occurs with PIP115.6 (Fig. 4 and 7). Protein 115.9 has not been previouslyobserved. Since its resolution by 2D PAGE requires nonequi-librium isoelectric focusing, it is possible that additionalstresses not yet analyzed by this technique also induce thisprotein. The isoelectric focusing point of PIP 115.9 is 11.0.Many of the other PIPs which have been identified, or for
which putative identifications have been made (Table 1),present an interesting contradiction. High pressure inducesmore HSPs (n = 11) than most other conditions outside ofthose which precisely mimic a heat shock response, while alsoinducing more CSPs (n = 4) than most conditions outside ofthose which precisely mimic a cold shock response (32). HSPsand CSPs have inverse responses to a variety of conditions,including temperature and antibiotics which target the ribo-some (8, 31). There are, however, commonalities betweenhigh-pressure effects and the effects of both decreases andincreases in temperature. Both low temperature and highpressure inhibit an early step of translation (3, 6, 11). The coldshock response has been suggested to be an adaptive responseto facilitate the expression of genes involved in translationinitiation (8). Also, pressure, like low-temperature incubation,results in the continued synthesis of stringently controlledproteins involved in transcription and translation despite thegrowth rate decrease; this behavior suggests decreased trans-lational capacity.
Pressure could turn on both HSPs and CSPs by affectingribosomes, either by inducing all ribosomes to signal bothstress responses partially or because of differential effects onribosomes, depending on the state of the ribosome at the timeof pressurization. There are several additional possible targetsthrough which pressure could initiate a partial heat shockresponse. Both high temperature and high pressure destabilizethe quaternary structures of proteins (7, 33), and an increasedproportion of dissociated subunits could induce a heat shocksigma-32 factor-dependent heat shock response (4). Alterna-tively, pressure could directly affect the phosphorylation stateor ATPase activity of HSP DnaK. These properties of DnaKalso modulate the heat shock response (15).The time course of synthesis of pressure-induced HSPs is
dramatically different from that of temperature upshift. Withinminutes of a shift of E. coli from 28 to 50°C, many HSPs areapparent (12, 34, 35), while at 28°C, pressure induction of themajor HSPs requires 60 to 90 min, suggesting that the signalfor heat shock induction is generated only slowly by highpressure. As with heat shock, the pressure response is alsotransient, GroES synthesis is repressed by 60 to 90 minpostshift, GroEL is repressed by 120 to 150 min postshift, and
VOL. 175, 1993
on June 2, 2018 by guesthttp://jb.asm
.org/D
ownloaded from

7176 WELCH ET AL.
TABLE 1. E. coli W3110 PIPs
Serial Alpha-nunumeric Coordinatesc Identificationd Comment(s)no.' designationh
HSPHSPPossibly G80.1 or G80.0; HSP
HSPHSPHSPHSP
Possibly F48.8 G6PD
CSP
Possibly F39.6
CSP
Possibly F39.0 (ArgI)Possibly G34.2
Possibly F29.0Possibly H47.4
HSP
Possibly C17.2 (Dut)
Possibly H14.0 L9
CSPRibosomal protein S6ARibosomal protein S6BHSPNonequilibrium gelPossibly C13.2Ribosomal protein L7CSPNonequilibrium gel
HSPHSP
Possibly C44.0Possibly G70.0 PFLHSP
" Numbers correspond to the numbers in Fig. 7.Alphanumeric designations are as previously described (32).
' Protein coordinates were assigned on the basis of the positions of these proteins on reference gels (32).'" Gene product identifications were based on overlapping reference gel coordinates, except for PIPs 9 and 10, whose identities were verified by immunoprecipitation.
DnaK remains high even 180 to 210 min postshift. During theheat shock response, such readjustments in the rates of proteinsynthesis require only 15 to 20 min (12). Therefore, both theupshift and downshift in rates of HSP synthesis are delayedduring the pressure induction response. The more rapid stressresponse to temperature may be due to an increase in the QlO.
The stress responses which are not seen in response topressure upshift are informative. For example, there does notappear to be a DNA damage response (SOS response; 29)although high pressure is known to inhibit DNA synthesis (10,38, 42). Indeed, we found that the nuclear material wasconsiderably more compacted at high pressure than at low
12345678910111213141516171819202122232425262728293031323334353637383940414243444546474849505152535455
F157.4G98.0F84.1H94.0G80.2G77.4E72.0C62.5B66.0B56.5G53.0G52.1H48.8G41.2G43.4F48.8F42.8E43.6C39.3H43.0H37.5G36.7F38.7G34.7F34.1F30.8H47.0H25.6C26.3B25.2H20.0C17.1H15.6H15.1H15.7H15.3F14.7D14.7C14.8C15.4160.9C13.1A13.0F1O.6115.9F10.9F10.1F21.5G16.6H29.5G42.3H46.9C46.1G77.5G21.0
67 x 12653 x 11672 x 11331 x 11541 x 11249 x 11170 x 10987 x 107104 x 108102 x 10248 x 9957 x 9825 x 9541 x 9047 x 8959 x 9566 x 8870 x 8984 x 873 x 89
33 x 8345 x 7960 x 8255 x 7656 x 7561 x 7022 x 9524 x 6281 x 63107 x 6224 x 4792 x 3824 x 2924 x 2627 x 2929 x 2763 x 2873 x 3176 x 3179 x 3054 x 10493 x 25117 x 2260 x 1435 x 3253 x 1758 x 1167 x 5135 x 3931 x 6843 x 8728 x 9383 x 9253 x 11142 x 50
CIpBLon
CIpBRpoHDnaKGroEL
RecA
GrpE
HNSRpsFRpsFGroES
RplL
ClpP
J. BACTERIOL.
on June 2, 2018 by guesthttp://jb.asm
.org/D
ownloaded from
RESPONSE OF E. COLI TO HYDROSTATIC PRESSURE 7177
pressure. Also, while it is known that pressures of the magni-tude used in this study alter membrane structure and transportprocesses, there is little evidence of a carbon, nitrogen, or
phosphate starvation response. It will be interesting to inves-tigate the overlap between PIPs and responders to osmoticstress and acid stress which are not yet in the E. coli gene-
protein data base.
ACKNOWLEDGMENTS
We are grateful to Carol Gross and to Willie Walter for the gifts ofantisera against DnaK and GroEL and to Vic Vacquier for criticalreview of the manuscript.
This work was supported by a grant from the Office of NavalResearch (ONR N00014-90-J-1878) to D.H.B. and by research grantsfrom the National Institute of General Medical Sciences (GM17892)and the National Science Foundation (DMB-8903787) to F.C.N.
REFERENCES1. Ames, G. F.-L. 1974. Resolution of bacterial proteins by polyacryl-
amide gel electrophoresis on slabs. J. Biol. Chem. 249:634-644.2. Baross, J. A., F. J. Hanus, and R. Y. Morita. 1975. Survival of
enteric and other sewage microorganisms under simulated deep-sea conditions. Appl. Microbiol. 30:309-318.
3. Broeze, R. J., C. J. Solomon, and D. H. Pope. 1978. Effects of lowtemperature on in vivo and in vitro protein synthesis in Escherichiacoli and Pseudomonas fluorescens. J. Bacteriol. 134:861-874.
4. Craig, E. A., and C. A. Gross. 1991. Is hsp70 the cellularthermometer? Trends Biochem. Sci. 16:135-140.
5. Davis, R. W., D. Botstein, and J. R. Roth (ed.). 1980. Advancedbacterial genetics, p. 201. Cold Spring Harbor Laboratory, ColdSpring Harbor, N.Y.
6. GroBl, M., and R. Jaenicke. 1990. Pressure-induced dissociation oftight couple ribosomes. FEBS Lett. 267:239-241.
7. Jaenicke, R. 1981. Enzymes under extreme conditions. Annu. Rev.Biophys. Bioeng. 10:1-67.
8. Jones, P. G., R. A. VanBogelen, and F. C. Neidhardt. 1987.Induction of proteins in response to low temperature in Esche-richia coli. J. Bacteriol. 169:2092-2095.
9. Laemmli, U. K. 1970. Cleavage of structural proteins during theassembly of the head of bacteriophage T4. Nature (London)227:680-685.
10. Landau, J. V. 1966. Protein and nucleic acid synthesis in Esche-richia coli: pressure and temperature effects. Science 153:1273-1274.
11. Landau, J. V., and D. H. Pope. 1980. Recent advances in the area
of barotolerant protein synthesis in bacteria and implicationsconcerning barotolerant and barophilic growth. Adv. Aquat. Mi-crobiol. 2:49-76.
12. Lemaux, P. G., S. L. Herendeen, P. L. Bloch, and F. C. Neidhardt.1978. Transient rates of synthesis of individual polypeptides in E.coli following temperature shifts. Cell 13:427-434.
13. Marquis, R. E. 1984. Reversible actions of hydrostatic pressure
and compressed gases on microorganisms, p. 273-301. In A. Hurstand A. Nasim (ed.), Repairable lesions in microorganisms. Aca-demic Press Ltd., London.
14. Marquis, R. E., and G. R. Bender. 1987. Barophysiology ofprokaryotes and proton-translocating ATPases, p. 65-73. In H. W.Jannasch, R. E. Marquis, and A. M. Zimmerman (ed.), Currentperspectives in high-pressure biology. Academic Press Ltd., Lon-don.
15. McCarty, J. S., and G. C. Walker. 1991. DnaK as a thermometer:threonine-199 is site of autophosphorylation and is critical forATPase activity. Proc. Natl. Acad. Sci. USA 88:9513-9517.
16. Meganathan, R., and R. E. Marquis. 1973. Loss of bacterialmotility under pressure. Nature (London) 246:526-527.
17. Neidhardt, F. C., P. L. Bloch, and D. F. Smith. 1974. Culturemedium for enterobacteria. J. Bacteriol. 119:736-747.
18. O'Farrell, P. H. 1975. High resolution two dimensional electro-phoresis of proteins. J. Biol. Chem. Res. 7:40-46.
19. Palmer, D. S., and L. J. Albright. 1970. Salinity effects on themaximum hydrostatic pressure for growth of the marine psychro-philic bacterium, Vibrio marinus. Limnol. Oceanogr. 15:343-347.
20. Pope, D. H., and L. R. Berger. 1973. Inhibition of metabolism byhydrostatic pressure: what limits microbial growth? Arch. Mikro-biol. 93:367-370.
21. Pope, D. H., N. T. Connors, and J. V. Landau. 1975. Stability ofEscherichia coli polysomes at high hydrostatic pressure. J. Bacte-riol. 121:753-758.
22. Pope, D. H., W. P. Smith, R. W. Swartz, and J. V. Landau. 1975.Role of bacterial ribosomes in barotolerance. J. Bacteriol. 121:664-669.
23. Porter, K. G., and Y. S. Feig. 1980. The use of DAPI for identifyingand counting aquatic microflora. Limnol. Oceanogr. 25:943-948.
24. Schulz, E., H.-D. Ludemann, and R. Jaenicke. 1976. High pressureequilibrium studies on the dissociation-association of Escherichiacoli ribosomes. FEBS Lett. 64:40-43.
25. Smith, D. C., and F. Azam. 1992. A simple, economical method formeasuring bacterial synthesis in seawater using 3H-leucine. Mar.Microb. Food Webs 6(2):107-114.
26. Smith, M. W., and F. C. Neidhardt. 1983. Proteins induced byanaerobiosis in Escherichia coli. J. Bacteriol. 154:336-343.
27. Somero, G. N. 1992. Adaptations to high hydrostatic pressure.Annu. Rev. Physiol. 54:557-577.
28. Van Bogelen, R. A., M. A. Acton, and F. C. Neidhardt. 1987.Induction of the heat shock regulon does not produce thermotol-erance in Escherichia coli. Genes Dev. 1:525-531.
29. VanBogelen, R. A., P. M. Kelley, and F. C. Neidhardt. 1987.Differential induction of heat shock, SOS, and oxidation stressregulons and accumulation of nucleotides in Escherichia coli. J.Bacteriol. 169:26-32.
30. VanBogelen, R. A., and F. C. Neidhardt. 1990. Global systemsapproach to bacterial physiology: protein responders to stress andstarvation. FEMS Microb. Ecol. 74:121-128.
31. VanBogelen, R. A., and F. C. Neidhardt. 1990. Ribosomes assensors of heat and cold shock in Escherichia coli. Proc. Natl.Acad. Sci. USA 87:5589-5593.
32. VanBogelen, R. A., and F. C. Neidhardt. 1991. The gene-proteindatabase of Escherichia coli: edition 4. Electrophoresis 12:955-994.
33. Weber, G., and H. G. Drickamer. 1983. The effect of high pressureupon proteins and other biomolecules. 0. Rev. Biophys. 16:89-112.
34. Yamamori, T., K. Ito, Y. Nakamura, and T. Yura. 1978. Transientregulation of protein synthesis in Escherichia coli upon shift-up ofgrowth temperature. J. Bacteriol. 134:1133-1140.
35. Yamamori, T., and T. Yura. 1980. Temperature-induced synthesisof specific proteins in Escherichia coli: evidence for transcriptionalcontrol. J. Bacteriol. 142:843-851.
36. Yayanos, A. A. 1986. Evolutional and ecological implications of theproperties of deep-sea barophilic bacteria. Proc. Natl. Acad. Sci.USA 83:9542-9546.
37. Yayanos, A. A., A. S. Dietz, and R. Van Boxtel. 1981. Obligatelybarophilic bacterium from the Mariana Trench. Proc. Natl. Acad.Sci. USA 78:5212-5215.
38. Yayanos, A. A., and E. C. Pollard. 1969. A study of the effects ofhydrostatic pressure on macromolecular synthesis in Escherichiacoli. Biophys. J. 9:1464-1482.
39. Yayanos, A. A., and R. Van Boxtel. 1982. Coupling device for quickhigh pressure connections to 1000 MPa. Rev. Sci. Instrum. 53:704-705.
40. Yayanos, A. A., R. Van Boxtel, and A. S. Dietz. 1983. Reproductionof Bacillus stearothermophilus as a function of temperature andpressure. Appl. Environ. Microbiol. 46:1357-1363.
41. Zobell, C. E., and A. B. Cobet. 1962. Growth, reproduction, anddeath rates of Escherichia coli at increased hydrostatic pressures. J.Bacteriol. 84:1228-1236.
42. Zobell, C. E., and A. B. Cobet. 1963. Filament formation byEscherichia coli at increased hydrostatic pressures. J. Bacteriol.87:710-719.
VOL. 1 75, 1993
on June 2, 2018 by guesthttp://jb.asm
.org/D
ownloaded from