Stress-induced changes in the metabolism, gut microbiome ...
108
Stress-induced changes in the metabolism, gut microbiome and behavior PhD thesis Dániel Kuti Neurosciences (“János Szentágothai”) Doctoral School Semmelweis University Supervisor: Krisztina Kovács, D.Sc Official reviewers: Barna Vásárhelyi, MD, D.Sc József Halász, MD, Ph.D Head of the Final Examination Committee: Árpád Dobolyi, D.Sc Members of the Final Examination Committee: Attila Patócs, MD, D.Sc Máté Tóth, Ph.D Budapest 2020
Transcript of Stress-induced changes in the metabolism, gut microbiome ...
Stress-induced changes in the metabolism, gut
microbiome and behavior
PhD thesis
Dániel Kuti
Neurosciences (“János Szentágothai”) Doctoral School
Semmelweis University
Supervisor: Krisztina Kovács, D.Sc
Official reviewers: Barna Vásárhelyi, MD, D.Sc
József Halász, MD, Ph.D
Head of the Final Examination Committee: Árpád Dobolyi, D.Sc
Members of the Final Examination Committee: Attila Patócs, MD, D.Sc
Máté Tóth, Ph.D
Budapest
2020

2
Table of Contents
Abbreviations .................................................................................................................... 5
1. Introduction ......................................................................................................... 8
1.1. Stress in general................................................................................................... 8
1.2. Hypothalamo-pituitary-adrenocortical (HPA) axis ............................................. 9
1.3. Central regulation of food intake and energy metabolism ................................ 10
1.4. Effect of stress on the metabolic system ........................................................... 14
1.5. Effect of stress on gastrointestinal tract (GI)..................................................... 16
1.6. Gut brain axis .................................................................................................... 16
1.7. Targeting the microbiome ................................................................................. 19
2. Aim .................................................................................................................... 21
3. Materials and methods....................................................................................... 22
3.1. Animals ............................................................................................................. 22
3.2. Stereotaxic surgery ............................................................................................ 22
3.3. Stress procedures ............................................................................................... 22
3.3.1. Acute and repeated stress .................................................................................. 22
3.3.2. Chronic variable stress (CVS) ........................................................................... 23
3.3.3. Two-hits stress protocol .................................................................................... 25
3.4. General procedure in rifaximin experiment ...................................................... 26
3.5. Metabolic measurements ................................................................................... 27
3.6. Behavior tests .................................................................................................... 28
3.6.1. Sucrose consumption test .................................................................................. 28
3.6.2. Open field test ................................................................................................... 28
3.6.3. Novel environment test ..................................................................................... 28
3.6.4. Elevated plus maze ............................................................................................ 29
3.7. Gut permeability test in vivo ............................................................................. 29
3.8. Hormone, endotoxin, glucose and triglyceride measurement from plasma ...... 29
3.9. Gene expression analysis................................................................................... 30
3.10. Microbiome analysis ......................................................................................... 31
3.11. Bacterial load in mesenteric lymph node .......................................................... 32
3.12. Histological methods ......................................................................................... 33
3.12.1. Perfusion and tissue processing ......................................................................... 33
3.12.2. Haematoxylin & eosin staining, imaging and quantification ............................ 33
3.12.3. Immunostaining, imaging and quantification .................................................... 33
3.13. Epidemiological data collection ........................................................................ 34
3.14. Statistics............................................................................................................. 35

3
4. Results ............................................................................................................... 36
4.1. Basal metabolic and locomotor activity ............................................................ 36
4.2. Acute restraint stress ......................................................................................... 38
4.3. Effects of acute psychological stress on locomotor behaviour and metabolic
variables............................................................................................................. 39
4.3.1. Locomotor activity ............................................................................................ 39
4.3.2. Cumulative food intake ..................................................................................... 41
4.3.3. Energy expenditure (EE) ................................................................................... 43
4.3.4. Respiratory exchange ratio (RER) .................................................................... 44
4.3.5. Body composition.............................................................................................. 45
4.4. Chemogenetic activation of CRHPVN neurons................................................... 45
4.5. Effect of CRHPVN activation on locomotor behavior and metabolism .............. 46
4.5.1. Locomotor activity ............................................................................................ 46
4.5.2. Cumulative food intake ..................................................................................... 47
4.5.3. Energy expenditure (EE) ................................................................................... 48
4.5.4. Respiratory exchange ratio (RER) .................................................................... 49
4.5.5. Body composition.............................................................................................. 50
4.6. Control experiments .......................................................................................... 51
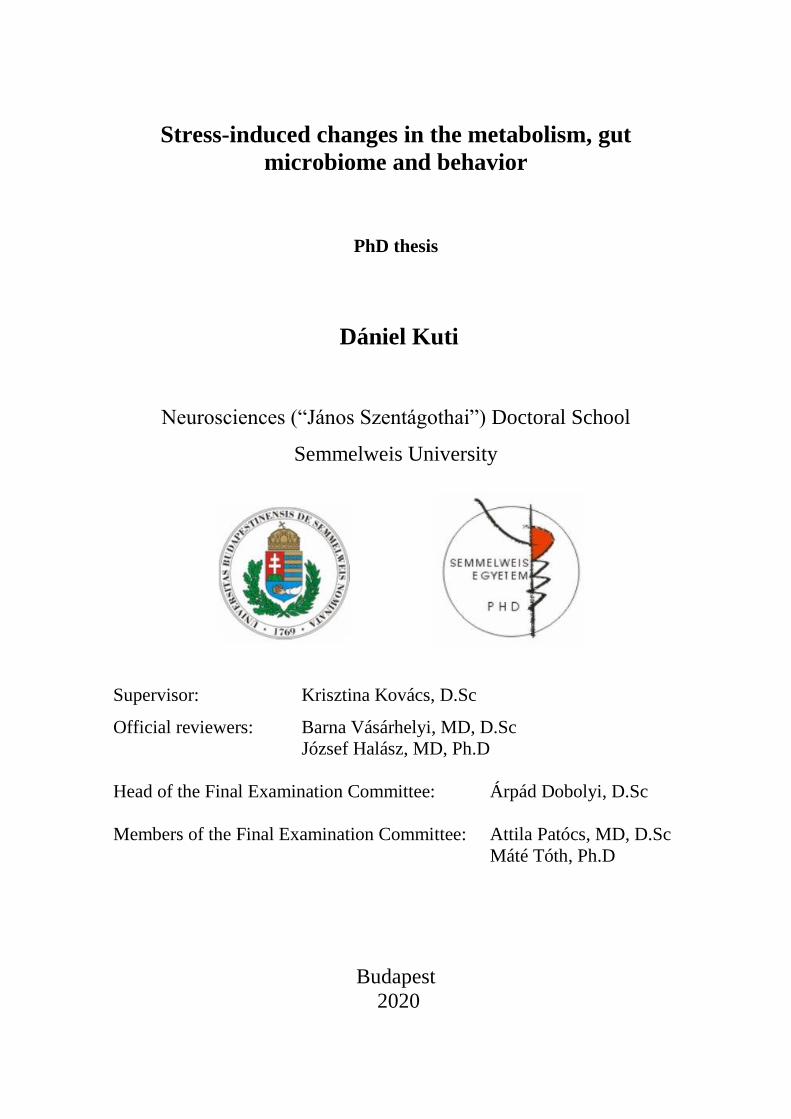
4.7. Effects of chronic stress .................................................................................... 52
4.8. Effect of chronic variable stress on metabolism ............................................... 54
4.8.1. Locomotor activity ............................................................................................ 54
4.8.2. Cumulative food intake ..................................................................................... 56
4.8.3. Energy expenditure............................................................................................ 57
4.8.4. Respiratory exchange ratio (RER) .................................................................... 58
4.8.5. Body composition.............................................................................................. 59
4.9. Effect of chronic stress on gut microbiome and its restoration after rifaximin
treatment ............................................................................................................ 60
4.10. Effect of rifaximin treatment on chronic stress-induced changes in organ
weights, hormones and metabolic markers ....................................................... 61
4.11. Effect of rifaximin on chronic stress-induced changes on behavior ................. 63
4.11.1. Ethogram ........................................................................................................... 63
4.11.2. Open field, EPM, sucrose consumption test...................................................... 65
4.12. Effect of MS+CVS and rifaximin treatment on the gut and gut-related
immunity ........................................................................................................... 67
4.12.1. Colon mucosa, tight junction protein expression and gut permeability ............ 67
4.12.2. Gut permeability, macrophage infiltration, local- and systemic bacterial load . 69
4.13. Hypothesis: correlation between Parkinson’s disease prevalence, consumption
of certain antibiotics and gut microbial dysbiosis ............................................. 71

4
5. Discussion ......................................................................................................... 73
5.1. The effect of acute stress and effect of the activation of CRHPVN on metabolic
system ................................................................................................................ 73
5.2. Metabolic changes after chronic stress and during recovery ............................ 76
5.3. Chronic stress effect on colon microbiome and gut .......................................... 79
5.4. Antibiotic effect on gut microbiome ................................................................. 81
6. Conclusion ......................................................................................................... 84
7. Summary ........................................................................................................... 85
8. Összefoglalás ..................................................................................................... 86
9. References ......................................................................................................... 87
10. Publication of the author ................................................................................. 106
11. Acknowledgement ........................................................................................... 108

5
Abbreviations
5-HT – Serotonin
AAV – Adeno-associated virus
ACC – Anterior cingulate cortex
ACTH – Adrenocorticotropic hormone
AGRP – Agouti-related peptide
ahCRF – α-helical CRF9–41
AMP – Antimicrobial peptide
ARC – Arcuate nucleus
AVP – Arginine vasopressin
BAT – Brown adipose tissue
BNST – Bed nucleus of stria terminals
CART – Cocaine- and amphetamine-regulated transcript
CB1 – Cannabinoid-1 receptor
CCK – Cholecystokinin
CNO – Clozapine-N-oxide
CORT – corticosterone
CRH-Ires-Cre – Corticotropin releasing hormone-Internal ribosomal entry side-Cre
CVS – Chronic variable stress
DMH – Dorsomedial nucleus of the hypothalamus
DNA – deoxyribonucleic acid
DREADD – Designer receptor exclusively activated by designer drug
ECDC – European Centre for Disease Prevention and Control
EDTA – Ethylenediaminetetraacetic acid
EE – Energy expenditure
ENS – Enteric nervous system
EPM – Elevated plus maze
ESAC – European Surveillance of Antibiotic Consumption network
eWAT – Epididymal white adipose tissue
FITC – Fluorescein isothiocyanate
FMT – Fecal microbiota transplant
GABA – γ-aminobutyric acid

6
GAPDH – Glyceraldehyde 3-phosphate dehydrogenase
GHSR1 – Ghrelin receptor
GIT – Gastrointestinal tract
GLP-1 – Glucagon-Like Peptide 1
GR – Glucocorticoid receptor
H&E – Hematoxylin & eosin
HPA axis – Hypothalamic-pituitary-adrenal axis
IBD – Inflammatory bowel disease
IBS – Irritable bowel syndrome
icv – Intracerebroventricular
IDO – Indoleamine 2,3 dioxygenase
LAL – Limulus amebocyte lysate (assay)
LepR – Leptin receptor
LHA – Lateral hypothalamic area
LPS – Lipopolysaccharide
MCH – Melanin-concentrating hormone
MD – Minimal disease
MLN – Mesenteric lymph node
MR – Mineralocorticoid receptor
MRI – Magnetic resonance imaging
mRNA – messenger ribonucleic acid
MS – Maternal separation
MSH – Melanocyte-stimulating hormone
NA – Noradrenaline
NAc – Nucleus accumbens
NCBI – National Center for Biotechnology Information
NPY – Neuropeptide Y
NTS – Nucleus of the solitary tract
OF – Open field
PBS – Phosphate buffered saline
PCR – Polymerase chain reaction.
PD – Parkinson’s disease
PFC – Prefrontal cortex
PMv – Premammillary nucleus of the hypothalamus

7
POA – Preoptic area
POMC – Proopiomelanocortin
PVH – Paraventricular nucleus of hypothalamus
PVN – Paraventricular nucleus
PYY – Pancreatic Peptide YY3-36
Reg3b – Regenerating islet-derived protein 3-beta
RER – Respiratory exchange ratio
Retnlb – Resistin-like beta
RIA – Radioimmunoassay
SCFA – Short chain fatty acids
SCh – Suprachiasmatic nucleus
SEM – Standard error of mean
sWAT – Subcutan white adipose tissue
TG – Triglyceride
TH – Tyrosine hydroxylase
TJP1-3 – Tight junction protein 1-3
TLR – Toll- like receptor
VMH – Ventromedial nucleus of the hypothalamus
vSbc – Venral subiculum
VTA – Ventral tegmental area
Y1,2 and 5 receptors –Y1,2 and 5 receptors of Neuropeptide Y
αSyn – α-synuclein

8
1. Introduction
1.1. Stress in general
Each living organism continuously struggle to maintain an internal homeostasis, as it
was first defined by Walter Cannon [1]. Homeostasis is an equilibrium condition for many
different physiological variables: body temperature, ionic composition and osmolality,
pH, and blood glucose level etc. For survival in a continuously changing external and
internal environment, these variables should be kept in well-defined range [2]. In 1936,
Hans Selye published a paper in Nature entitled “A syndrome produced by diverse
nocuous agents” and introduced the stress concept. He wrote: “…if the organism is
severely damaged by acute non-specific nocuous agents, a typical syndrome appears, the
symptoms of which are independent of the nature of the damaging agent, and represent
rather a response to damage as such” [3]. He noticed that the same pathological triad
(adrenal gland enlargement, thymus involution, gastrointestinal ulceration) evolves in
response to many different stressors (bacterial infection, toxins, physical stimuli) [3]. A
few years later, Selye defined the General Adaptation Syndrome, GAS as an “integrated
syndrome of closely inter-related adaptive reactions to non-specific stress itself“ [4].
GAS develops in three successive stages: 1. alarm reaction, 2. active resistance, 3.
exhaustion (Fig. 1.) [5].
Figure 1. General adaptation system.

9
Sterling and Eyer were the first, who introduced the expression allostasis, which
basically the maintenance of homeostasis through changes. The expended energy for
allostasis is the allostatic load [6].
In response to various external and internal stressors catecholamines release from
adrenal medulla, induced by the activation of sympathetic nervous system (SNS), and the
hypothalamo-pituitary-adrenocortical (HPA) axis became rapidly activated. [7]. In
response to the activation of both sympathetic nervous system and HPA, bodily resources
are mobilized for fight or flight, including centrally mediated cardiovascular adaptations
with increased heart rate and blood pressure and redistribution of blood supply between
muscles and skin. During acute stress, respiration is also increased to support increased
metabolic demands with oxygen. Increased vigilance, alertness and arousal are also
specific features of stress. [8]. From the pathophysiological point of view, it is important
to distinguish between acute and chronic stress. Acute stress is a short term challenge,
while during chronic stress the body is exposed to stressors for a prolonged time or
frequently exposed to various different stressors, chronically [9].
1.2. Hypothalamo-pituitary-adrenocortical (HPA) axis
Different environmental stimuli trigger stress response and activate the
neuroendocrine stress axis as a reflex regulation. In first step, corticotropin-releasing
hormone (CRH) and vasopressin (AVP) are released from the parvocellular neurons of
the hypothalamic paraventricular nucleus (PVN). These hormones are secreted to the
hypophyseal portal circulation and trigger adrenocorticotropic hormone (ACTH) release
from the adrenocorticotropic cells of anterior pituitary gland. Then, ACTH reaches the
adrenal cortex via the blood circulation and stimulates cortisol (in human) and
corticosterone (in rodents) release from the zona fasciculata. Corticosteroids act through
mineralocorticoid (MR) and glucocorticoid (GR) nuclear receptors [10]. The basal
occupancy of MR is around nine fold higher than GR; because affinity of MR is higher
(Kd = 0.1–0.5 nM) for corticosterone than that of GR (Kd = 2–5 nM). For this reason,
occupancy of GR is increased seven-fold higher during stress, while MRs are alre ady
fully occupied even at no stress conditions [11]. Therefore, stress effects occur rather
through GR than MR. MR is involved in the appraisal process and the early-phase of
stress [10]. Inhibitory feedback by glucocorticoids plays a major role in stress response.
This suppression occurs at several node of the axis, at pituitary, at hypothalamus or

10
extrahypothalamic sites (hippocampus, cortex) and inhibit expression of effector
molecules [12].
The neural regulation of HPA axis is originated from different brain regions, which
depends on the nature and intensity of stressor. The information of physical and metabolic
stressors (hypovolemia, hypoglycaemia) are transported through ascending neurons from
the brainstem and spinal cord and these neurons have direct projection to the PVN. These
projections originated from the nucleus of the solitary tract (NTS) and C1 and C3
catecholaminergic neurons. Brainstem pathways also interact with other structures such
as dorsal raphe and dorsomedial hypothalamic nucleus (DMH) [10].
By contrast, psychogenic stressors require more complex polysynapthic pathways,
which include limibic brain regions such as prefrontal cortex (PFC), hippocampus,
amygdala and bed nucleus of stria terminals (BNST). PFC projects both inhibitory and
stimulatory information to PVN. These inputs are mediated through interconnections with
other structures such as hippocampus, ventral subiculum (vSbc) and amygdala. The
hippocampus is mainly suppress the activation of HPA axis. The projection of
hippocampus reach indirectly the PVN. The projection occurs via vSbc and PFC. These
regions innervate the periventricular region that projects glutamatergic and GABAergic
neurons to the CRH neurons. There are neuronal innervations as well as from basolateral
and medial amygdala to the PVN that potentiate the HPA axis. The central nucleus of
amygdala express also CRH and has essential role in the stress induce behavioural
responses (especially fear). The BNST is an integrative centre between limbic brain
regions and PVN. The projections of BNST innervates the periventricular GABA- and
glutamatergic neurons and suppress the inhibiting signals of GABAergic interneurons
[10].
1.3. Central regulation of food intake and energy metabolism
In the beginning of this chapter, I would like to clarify few metabolism related
concepts for the better understand ability. Orexigen is any substance, which stimulates
appetite; by contrast, anorexigen inhibits appetite. Catabolism is the set of metabolic
pathways that breaks down molecules into smaller units and anabolism constructs
molecules from smaller units.
To govern neuroendocrine autonomic and behvaioral stress responses, hypothalamus
is also a key node of metabolic regulation [13]. Arcuate nucleus (ARC), paraventricular

11
nucleus of the hypothalamus (PVH), ventromedial nucleus (VMH) and lateral
hypothalamic area (LHA) were described as a key feeding regulatory centers in the
hypothalamus [14]. Circulating metabolic-related hormones mediate information to these
centers about the energy status from periphery. These hormones bind to specific receptors
and can alter the physiology of the receptor containing neurons. Leptin, insulin and
ghrelin all target multiple brain neurons involved in energy intake [15-17].
Leptin is secreted by adipocytes and secreted in proportions of adipose depots. The
hormone has a key role in the regulation of glucose and lipid metabolism, by suppressing
food intake by decreasing meal size rather than meal number [18-20]. In particular, leptin
receptor (LepR) expressed in the retrochiasmatic area, arcuate- (ARC), dorsomedial-
(DMH), ventral premammillary- (PMv) and ventromedial (VMH) nuclei of the
hypothalamus. Elias et al. examined neuronal activation after leptin administration [21].
Leptin-induced c-Fos expression was detected in Lepr-expressing neurons in the
hypothalamus and hindbrain [21]. In addition, other studies demonstrated that fos
expression was very low in PVH, unlike in ARC and DMH, because of the secondary
activation of leptin-dependent pathways [22, 23].In addition, leptin also aim hindbrain
and the midbrain ventral tegmental area (VTA) to affect the reward system. Following
studies showed that dopamine is an important neurotransmitter in this influence because
of the dopaminergic inputs to the nucleus accumbens (NAc) from VTA [24-26]. LepR
expressed also in the medial part of the nucleus of the solitary tract (NTS) and expression
of leptin activation marker (pSTAT3) was demonstrated in this brain region after leptin
injection [27].
Insulin is able to reduce blood glucose concentrations by facilitating glucose uptake
into muscle, liver and adipose tissue through insulin dependent glucose transporter
protein GLUT4. The hormone is secreted by the β cells of Langerhans islets of pancreas
[28]. Insulin enters the brain from blood circulation [29] and reduces food intake there by
suppressing neuropeptide Y (NPY) and increases the activation of melanocyte stimulating
hormone (α-MSH) neurons in ARC [30]. Insulin also able to alter reward and motivation
processes through insulin receptors (IRs) in the limbic system [31, 32]. In addition, insulin
reduces the meal size by promoting the effect of cholecystokinin (CCK) [33]. It is also
secreted at the proportion of adipose tissue [34]. Insulin receptors (IR) are expressed in
different locations of the brain: olfactory bulb, cerebellum, parts of the cortex,
hippocampus, choroid plexus, VTA and ARC [35]. However, arcuate nucleus of

12
hypothalamus is in the focus of investigation of insulin’s action in the aspect of metabolic
function [36].
Ghrelin is a gastrointestinal (GI) hormone, which induces food intake. It is secreted by
the stomach and proximal small intestine [37]. The ghrelin receptor (GHSR1) belongs to
the G-protein coupled receptor family and affects adenylate cyclase activity and
intracellular Ca2+ channels. GHSR1 expressed in most of the brain regions where IR or
LepR are found [17]. Ghrelin also influences glucose homeostasis and reward [37].
Pancreatic Peptide YY3-36 (PYY) and Glucagon-Like Peptide 1 (GLP-1) are secreted
by L cells in the distal part of small intestine. Both hormone inhibit food intake but on
different ways. PYY binds Y2 receptor in the ARC and regulates energy homeostasis. In
contrast, GLP-1 enhances the secretion of insulin but has direct effect on vagal afferents
[38-40].
Cholecystokinin (CCK) is synthesized by I cells in the proximal part of intestine. The
hormone regulates metabolism via vagal nerve and hindbrain. It has a powerful effect to
decrease meal size [41].
Arcuate nucleus ARC harbors two separate neuron population that exert opposite
influence on food intake (Fig. 2.). Neuropeptide Y (NPY) and Agouti-related peptide
(AgRP) colocalized neurons mediate anabolic effects. These neurons located in the
medial portion of ARC and the cells are GABAergic [42]. Intracerebroventricular
administration of NPY or direct injection into hypothalamus stimulates food intake and
reduce energy metabolism. Consequently, continuous central dosage of NPY leads to
obesity [43, 44], however, NPY–KO mice display normal food intake and normal leptin
and insulin levels [45]. It is likely that other orexigenic neuropeptides, such as AgRP,
orexin or melanin-concentrating hormone (MCH), may compensate the lack of NPY.
Orexin and MCH are expressed in the lateral hypothalamic area and adjust food intake to
the arousal state [46, 47]. NPY expressing neurons are key mediators of the orexigenic
effect of ghrelin while they are inhibited by leptin and insulin. In addition, NPY/ AgRP
neurons project a tonic GABAergic inhibition to the anorexigenic proopiomelanocortin
(POMC)/ cocaine- and amphetamine-regulated transcript (CART) neurons [48].
The other major metabolic-related neuron population in the ARC is anorexigenic.
These cells are located in the lateral part of the nucleus and express POMC (alpha-
melanocyte-stimulating hormone (MSH) and CART. Neurons in this region are equipped
with leptin and insulin receptors and mediate their anorexigenic effect by increasing
energy expenditure. [49]. In mice, CART is colocalized with POMC, however, CART is

13
coexpressed rather in orexigenic NPY/AgRP neurons than POMC neurons in human [50].
Besides that, CART is translated with MCH in the lateral hypothalamus in several species
[51].
The anorexigenic effect of POMC neurons in ARC projects to PVN, ventromedial
nucleus and lateral hypothalamus and reduce food intake with increased energy
expenditure (EE) [52]. Similarly, NPY/AgRP neurons of ARC project to the same
hypothalamic regions (PVN, VMH, LH) as POMC neurons, however orexigenic neurons
of arcuate nucleus send axons also to the dorsomedial nuclei of hypothalamus. In these
nuclei (PVN, VMH, LH, DMH), NPY neurons affect on the contrary of POMC food
intake and EE via Y1,2 and 5 receptors; while, AgRP alters energy homeostasis as an
antagonist of melanocortin 4 receptor (MC4R), thus inhibit the effect of α-MSH [50, 53].
The projected information of arcuate nucleus influences the parvo- and parvicellular
neurons of PVN, where different hormones are expressed, such as corticotrophin-
releasing hormone (CRH), thyrotrophin-releasing hormone (TRH) and oxytocin, thus
regulates different neuroendocrine pathways [54].
Huge number of VMH are glucose-responsive neurons, which mediate the
anorexigenic effect of leptin [55]. These neurons are also intervened by POMC neurons
of ARC and mediate the effect of leptin-induced anorexia partly to the PVN via brain-
derived neurotrophic factor (BDNF) [56].

14
Figure 2. Schematic representation of metabolic regulation in arcuate nuclei of the
hypothalamus [57].
The dorsomedial nucleus is received inputs from other hypothalamic areas which are
involved in food intake regulation. Furthermore, DMH interconnected with the circadian
centre, suprachiasmatic nuclei (SCh) and includes neurons, which express circadian
genes, sensitive to the daily schedule [58]. DMH intervenes preoptic area (POA), PVN
and LH. Therefore, different studies propose that DMH plays an essential role in the
circadian effect of thermoregulation, endocrine function, arousal and food intake [59],
however, some studies disagree this hypothesis [58].
1.4. Effect of stress on the metabolic system
Stress is accompanied with increased energy expenditure and metabolic rate to
promote coping. Food intake and appetite is inhibited during acute stress, which
accompanied with high-energy expenditure. Both major classes of stress mediator

15
hormones, - the glucocorticoids and catecholamines (adrenaline and noradrenaline) - have
profound metabolic effects. Epinephrine is synthetized in the adrenal medulla of adrenal
gland by the chromaffin cells. These cells have sympathetic innervation and release upon
sympathetic stimuli. Epinephrine is rapid mediator of stress response and acts on nearly
all body tissues. Stress is accompanied with a rapid elevation of blood glucose, which is
regulated by adrenaline. At cellular level, adrenaline phosphorylates enzymes of
glycogenolysis in the liver and muscle, which results glycogen conversion to glucose.
Furthermore, adrenaline has an indirect effect on blood glucose level by triggering
glucagon release and inhibiting insulin secretion. In the adipose tissues, adrenaline
activates lipolysis [60].
Glucocorticoids are steroid hormones, which released from the zona fasciculata of
adrenal cortex to the stress-induced activation of HPA axis. Glucocorticoids increase
blood glucose level by increasing the synthesis of gluconeogenesis enzymes. The
hormone mobilizes also the substrates for gluconeogenesis from other tissues via
mobilization of amino acids from extrahepatic tissues and stimulates lipolysis in adipose
tissues. In addition, these steroid hormones decrease energy uptake in muscle and adipose
tissues to inhibit energy storage [61]. The effects of glucocorticoids are relatively slow,
compared to other metabolic hormones like insulin, leptin or catecholamines, because
these changes mediated through gene expression rather than direct control of enzymes
regulation [62]. In addition, significant level of GRs are localized in different brain
regions that influencing metabolic system, such as ARC, VMH and PVH [61].
The permanent presence of stressors seriously affect the resistance of the body,
therefore the energy homeostasis may collapse during prolonged chronic stress. Catabolic
changes may dominate in response to high level of glucocorticoids. Furthermore, due to
the chronically elevated blood glucose level results in increased insulin secretion, which
leads to insulin resistance and type2 diabetes on the long run [63]. Besides that, hormone
sensitive lipase is continuously activated during chronic stress, which elevates glycerine
and fatty acid levels in the blood and these changes accompanied with other metabolic
related maladaptive processes like hypertriglyceridemia, non-alcoholic fatty liver disease
(NAFLD) or atherosclerosis [64].
The sympathetic nervous system and glucocorticoid hormones act together to alter central
metabolic pathways. Sympathetic activation results in suppression of food intake by
inhibiting orexigenic NPY action [65]. In addition, α-MSH neurons of ARC potentiate
CRH release in PVN. Leptin receptors, which are expressed in PVN, induce CRH

16
expression and results in activation of sympathetic preganglionic neurons projecting the
brain stem and spinal cord. Leptin also inhibits NPY neurons in ARC, and activates the
ventro- and dorsomedial hypothalamic projection of PVN [66].
1.5. Effect of stress on gastrointestinal tract (GI)
It is well known, that symptoms of different GI disorders worsen in prolonged stress
and negative emotions. Activation of HPA axis and sympathoadrenal system alter various
physiological functions of GI such as gastric secretion, gut motility, visceral sensitivity,
mucosal blood flow, barrier function and triggers different gastrointestinal relevant
symptoms like dyspepsia, diarrhoea or abdominal pain. Chronic activation of the stress
system can lead to severe GI disorders such as irritable bowel syndrome (IBS) or
inflammatory bowel disease (IBD). Enteric nervous system (ENS) plays an essential role
in the regulation of gut functions. It has a great impact on motility and secretion of GI
neuropeptides and hormones. Strong evidences confirm that, prolonged stress as well as
early life stress are able to alter central pain circuitry, influence motility and permeability
through GI [67, 68].
In the last decade, emerging studies demonstrated important interaction between the
gut microbiome and host. Stress induces a notable shift in the composition of microbiota,
with the growth of pathogenic bacteria and this alteration further aggravate the symptoms
of GI disorders. For example, norepinephrine enhances the virulence of E. coli or C. jejuni
[67, 68]. Infants with altered microbiota composition showed higher level of infant GI
symptoms and allergic reactions.
The gut microbiome able to modify the interaction between HPA axis and immune
system. Stress increases gut permeability and results in “leaky gut” which underpins
chronic low-grade inflammation, due to the elevated plasma level of bacterial
lipopolysaccharide (LPS) [69]. CRF, which is also produced within the gut, plays an
essential role in the stress-induced gut permeability dysfunction, modulation of
inflammation in gut, and contributes to visceral hypersensitivity via CRF receptors. Of
note, early life stress causes elevated plasma corticosterone level and results in increased
gut permeability and bacterial translocation to spleen and liver [69].
1.6. Gut brain axis
The microbiome is a complex and dynamic mixture of microorganisms, which
includes different bacteria, fungi, archaea and viruses [70]. These microbial communities

17
present in different parts of the human body such as the oro-naso-pharyngeal cavity, skin,
vagina, gastrointestinal tract etc. These communities interact with host and influence
health and disease [71]. The largest proportion of the microbiome is found in the
gastrointestinal tract: from the stomach to the colon, bacterial biomass ranges from 102–3
to 1011–1012 cells/ml, among those approximately 95% being anaerobic [70]. The human
gut microbiome consists of seven major phyla: Bacteroidetes, Actinobacteria,
Cyanobacteria, Fusobacteria, Proteobacteria, and Verrucomicrobia [72]. The
microbiome is exposed to different factors, which constantly change the composition of
it. These factors include many variables such as birth, breast feeding, diet, stress, aging,
drugs (antibiotics) etc. [73-75].
Gut microbiome widely interacts with the host’s metabolic system (Fig.3.). The dietary
ingredients can be metabolized differentially and it highly depend on the composition of
microbiome. For instance, different bacteria can produce bile acid, short chain fatty acids
(SCFA), choline etc. [69, 76]. SCFAs suppress histone deacetylases and able to modify
intracellular signalling through their specific receptors that found throughout the body.
For instance, propionic acid mediates advantageous effect on the regulation of body
weight and glucose metabolism by influencing FFAR3 receptor containing nerve fibres
in hepatic portal vein [77]. Recent studies indicate that microbiome is able to influence
enteroendocrine cells in gut. E. coli produced proteins are able to induce secretion of
GLP-1 and PYY hormones from enteroendocrine cells that affect food intake [78]. For
these reason, microbiome can contribute to the development of different metabolic
system-related disorders such as, obesity or diabetes [79, 80].

18
Figure 3. Schematic representation of different pathways of gut brain axis [81].
It is also well documented that a shift in gut microbiome can be associated with
gastrointestinal disorders such as inflammatory bowel disease (IBD) and irritable bowel
syndrome (IBS). A recent study identified key bacterial species that may be involved in
the development of these gastrointestinal diseases and altering the gut microbiota has
been proposed as a strategy for the treatment [82].
Growing body of evidence indicates dysbiosis of gut microbiota could contribute or,
exaggerate several neuropsychiatric disorders such as anxiety, depression, Alzheimer
disease, Parkinson disease, multiple sclerosis, autism etc. [75]. There are many different
pathways, through which, microbiome can influence the normal function of brain.
Recently, a number of microbial metabolites (referred to as neuro-active metabolites)
produced through tryptophan metabolism have been suggested to influence the gut brain-
axis. Interestingly, germ free mice have elevated level of circulating tryptophan beside
lower level of 5-HT compared to conventionally colonized mice. Another study indicated
that probiotic administration of Lactobacillus decreased the colonic tryptophan
degradation by inhibiting indoleamine 2,3 dioxygenase (IDO – rate limiting enzyme of
kynurenine pathways) [83]. Besides that, many microbes can metabolize

19
neurometabolites such as GABA, noradrenaline, serotonin, dopamine, acetylcholine,
tryptophan that could directly affect brain functions [76]. In addition, gram-negative
bacteria induce pro-inflammatory cytokines by their cell wall component, LPS; which
stimulates toll- like receptor (TLR) coupled immunological pathways. Inflammatory
mediators can also access to the brain. For instance, Campylobacter jejuni infection
triggers neuronal activity in the vagal sensory ganglia and in the NTS. The vagus nerve
has also an important role in the mediation of gut-brain communication. There are strong
evidences, which demonstrate that microbiome is capable to alter the activity of vagal
projection. Administration of Lactobacillus reuteri supported wound healing in mice by
enhanced oxytocin secretion in hypothalamus, which was eliminated by vagotomy.
Another experiment showed that administration of Lactobacillus rhamnosus induced
anxiolytic and antidepressant-like behaviour, however, this effect was attenuated in
vagotomized mice [69, 76].
1.7. Targeting the microbiome
As microbiome is a permanently changing community and the effects of microbiome
on the host depend on which bacteria colonized the host’s gut. Although the composition
of the gut microbiome is relatively constant, it can be targeted by different factors, which
provide the basis of microbiota- based therapies. [75]. There are specific dietary
supplements through which the microbiome can be targeted. These are the probiotics,
prebiotics and synbiotics.
Probiotics are living microorganisms, which provide beneficial effects to the host.
Probiotics should survive the low pH in the stomach, biliary salts and should be able to
colonise the gut [69]. The most popular probiotics belong to Lactobacilli and
Bifidobaceria, however, yeasts, such as Saccharomyces boulardii are also used in
probiotic preparations.
Prebiotics are also a manuipulating factor, which are non-digestible fibres. These
fibres are selectively metabolized in the intestinal tract and as a result, promote the
proliferation of beneficial bacteria. For example, a Bifidobacterium derived prebiotic (B-
GOS) induced bifidogenic effect in microbiome of young volunteers [69].
Parabiotics are non-living, inactivated probiotics, but imitate the beneficial effect of
the living microorganism. In the contrary of probiotics, parabiotics have some advantages
in safety aspect. For example, the risk of infection, risk of microbial translocation and the

20
possibility of inflammatory responses are lower that may occur in individuals with weak
immune system [84].
Postbiotics are water-soluble metabolites, which are metabolized by gut colonising
bacteria. Postbiotics includes wide range of metabolites such as enzymes, proteins,
peptides, saccharides, organic acid, SCFA etc. It is demonstrated, postbiotics can mimics
the effects of probiotics without the risky inherent [84].
Antibiotics is an antimicrobial molecule, which inhibit the growth of bacteria. In case
of bacterial infections, antibiotics are the primary agents of pharmacological defence.
They target pathogenic bacteria, however, administration of antibiotics have also harmful
effect on commensal bacteria in the gut and result reduced amount of microbiome and
microbial diversity [69].
Faecal microbiota transplant (FMT) is a recently used administration. As it implies,
FMT is a transplantation of faecal bacteria from healthy donor to a recipient. FMT was
applied first in clinical trial against Clostridioides difficile infection and the treatment was
highly effective against the infection. In addition, FMT is widely used application against
different GI related disorders [85, 86].

21
2. Aim
My first aim was to investigate the effect of stress on the metabolic system. Therefore,
I raised the following specific questions:
How an acute restraint stress affects metabolic variables and locomotor
behavior?
What is the role of the hypothalamic paraventricular nucleus in the
regulation of metabolic- and behavioral changes?
What are the differences between metabolic changes seen in response to
acute and chronic stress?
How the metabolic system recovers after repeated stress?
My second main aim was to test the hypothesis, whether rifaximin – non-absorbable
antibiotic - restores chronic stress-induced gastrointestinal and inflammatory symptoms
and changes in microbiome along with stress-induced changes in anxiety-like behaviour.
Third, we challenged the hypothesis if there is a relation between the systemic
antibiotic consumption and the prevalence of Parkinson’s disease.

22
3. Materials and methods
3.1. Animals
All experiments were performed on male mice with C57BL/6J genetic background.
CRH-Ires-Cre transgenic mouse line was used in the virus-injected experiments. Animals
were born and housed at the minimal disease (MD) level of Medical Gene Technology
Unit at the Institute of Experimental Medicine. Mice were housed in 12 h light/dark cycle
(lights on from 6 a.m. to 6 p.m.) at 21–22 °C with humidity. Animals received standard
pelleted rodent chow (VRF1, Special Diets Services (SDS), Witham, Essex, UK)
containing 19,1 g% protein, 55,3 g% carbohydrate and 4,8 g% fat. Chow and water were
provided ad libitum. Experiments were complied with the ARRIVE guidelines and
performed in accordance with the guidelines of European Communities Council Directive
(86/609 EEC), EU Directive (2010/63/EU) and the Hungarian Act of Animal Care and
Experimentation (1998; XXVIII, Sect. 243/1998). All procedures and experiments were
approved by the Animal Care and Use Committee of the Institute of Experimental
Medicine (permit number: PEI/001/29-4/2013).
3.2. Stereotaxic surgery
CRH-IRES-Cre transgenic mice were anesthetized with a cocktail of 100 mg/kg
ketamine and 10 mg/kg xylazine (1 ml/100 g bw, i.p.). Bilateral stereotaxic injection of a
virus vector construct (pAAV8/hSyn-DIO-hM3D(Gq)-mCherry, Addgene; 4-7,9 x
1012/ml, UNC GTC Vectore Core) was performed into both side of paraventricular
nucleus (PVN) (30 nl/side). PVN was approached by a glass cannula at the following
coordinates from Bregma: AP:-0,7mm; lat: -0,035mm DV: -0,5mm. After surgery, mice
recovered for 3 weeks before the beginning of metabolic measurements. Control animals
have been injected with pAAV-hSyn-DIO-mCherry.
3.3. Stress procedures
3.3.1. Acute and repeated stress
Mice were exposed to restraint acute stress for 1h (n=8). For the procedure, 50ml
Falcon tubes were used with small holes on side and one at the end for breathing and
ventilating. Tubes were filled with paper towel from the opening of tube and closed with
own cap to avoid turning around. With this procedure, mice were immobilized without

23
being harmful and provided a stressful event. During the 1h, tubes were stabilized from
outside. Experimental design and timeline diagram is shown on figure 4.
Figure 4. Overview of the acute stress experiment.
3.3.2. Chronic variable stress (CVS)
During CVS, experimental animals were stressed for 4 weeks, two times daily, by
different psychogenic stressors:
Water avoidance stress (WAS) – The test apparatus was a plastic tank (40 cm
length × 40 cm width × 30 cm height) with a fixed glass cylinder (d=8 cm) in the
center of the floor. The tank was filled with fresh water to 1 cm below the top of
block. The stressed mice were placed on the block for 1 h.
Disturbed circadian rhythm - Mice were exposed to changed or extended light or
dark phase.
Social defeat – Experimental mice (intruder) were placed one by one into the
home cage of dominant CD1 male mice (aggressor) and they were left there for 8
minutes.
Footshock - Mice were shocked in every 20 sec by 0,5 mA electric shock for 12
minutes.
Forced swim - Mice were forced to swim for 6 min in 18 cm high and 14 cm
diameter glass cylinders filled with clean tap water.
Slanted cage – The home cage of experimental mice was tilted to a 45° angle
Soaked bed – The bedding was mixed with water in the home cage
Shaking – The cages of the mice were placed on a shaker for 1 hour. The shaking
speed was randomly changed during one hour.

24
Crowding – The moving area of the mice was reduced and the experimental mice
were crowded. In case of rifaximin experiment, vehicle and rifaximin treated mice
were separately crowded.
Rat feces odour – Feces of male rats was collected and it was placed into a Falcon
tube with small holes and the tube was placed into the home cage of the stressed
mice.
Daily schedule of the stressors is found in table 1. After CVS procedure, a cohort of
experimental animals (n=4/group) were transferred to cages of Phenomaster system for
metabolic measurements. Open field test was done with another cohort of mice (n=5-
6/group), then they were sacrificed, blood was collected on EDTA and plasma was stored
at -20°C until assays. Adrenal glands were dissected and measured after autopsy.
Experimental design and timeline diagram is shown on figure 5.
Figure 5. Overview of the chronic variable stress experiment.
Chronic variable stress (2x daily); OF: Open field test.

25
Table 1. Daily schedule of the chronic variable stress.
CVS protocol
day a.m. p.m.
1.day water avoidance overnight light
2.day social defeat footshock
3.day forced swimming soaked bedding + slanted cages
4.day crowding + shaking crowding + dark for 18h
5.day restraint isolation
6.day social defeat forced swimming
7.day crowding + shaking soaked bedding + slanted cages
8.day forced swimming footshock
9.day water avoidance overnight light
10.day social defeat footshock
11.day isolation + rat feces odour isolation + rat feces odour + dark
for 18h
12.day crowding + shaking crowding + soaked bedding +
slanted cages
13.day forced swimming forced swimming
14.day social defeat restraint
15.day rat feces odour + dark for 18h crowding + shaking + overnight
light
16.day isolation + rat feces odour footshock
17.day forced swimming crowding + soaked bedding
18.day social defeat (6-10 min) isolation + rat feces odour + dark
for 18h
19.day water avoidance footshock
20.day dark for 18h crowding+shaking
21.day crowding + soaked bedding + slanted
cages isolation + rat feces odour
22.day footshock forced swimming
23.day water avoidance overnight light
24.day crowding + shaking isolation + rat feces odour + dark
for 18h
25.day social defeat slanted cages + soaked bedding
26.day footshock restraint + shaking
3.3.3. Two-hits stress protocol
This protocol is a frequently used procedure to induce anxiety or depression-like
symptoms in experimental animals [87]. It started at postnatal day 1, when pups were
separated from their mother (maternal separation MS) for 3 hours daily for 12 days (early
life stress - first hit). During the three hours, mothers were placed into separate individual
cages and offspring were transferred into a small box, which was placed on a heating pad

26
(30-33°C). Mothers and pups were in two separate rooms. Control litters were not
separated and left undisturbed except the change of bedding once a week. Pups were
weaned at the 21th day after born and they were housed 2-3/cages. At the age of 50 days,
mice were exposed to chronic variable stress paradigm (CVS - second hit). The protocol
followed the same CVS schedule, which is written in table 1.
3.4. General procedure in rifaximin experiment
During chronic variable stress, half of the animals received 300 mg/kg bw/day
rifaximin, a non-absorbable antibiotic (Sigma). Animals from different litters were
randomly assigned to rifaximin/vehicle groups. Rifaximin was dissolved in 5%
hypromellose solution in drinking water. The other half of mice (controls) received 5%
hypromellose to drink. Fluid intake and body weight of the animals was monitored and
rifaximin concentration in the drinking water was adjusted. This experiment was
performed on two different set of experimental mice. At the end of the experiment
behaviour tests were performed on both sets (see below). After last test, one set of mice
(n=5-7/groups) was decapitated (30 min after EPM) and trunk blood was collected on
EDTA and plasma stored at -20°C. This blood sample was the measure of stress-induced
CORT, as it was collected at the time of maximal adrenocortical CORT release provoked
by EPM exposure. Adrenal glands and thymus were collected, cleaned and weighed for
each mouse. Organ weights were normalized to final body weight and expressed as mg/g
bw. Colon, liver, mesenteric lymph node and colon content were harvested and stored at
-70°C until assay. The upper intestinal tract has a very low population of bacteria because
of different factors like gastric acidity, propulsive motility and pancreatic enzymes. By
contrast, the colon has a very stagnant motility with retropulsive contractions keeping the
contents in the proximal colon and thus, the largest and “most constant” bacterial
ecosystem located in the colon [88]. For this reason, colon tissue and content was used
for further analysis. Experimental design and timeline diagram is shown on figure 6. The
second set of mice (n=22) were exposed to gut permeability test after the last behavioural
test (see below).

27
Figure 6. Overview of the rifaximin experiment.
MS: Maternal separation (3h daily); CVS: Chronic variable stress (2x daily); OF: Open
field test; EPM: Elevated plus maze test.
3.5. Metabolic measurements
Experimental mice were singly housed for 1 week before training. Then, the mice were
housed in training boxes for 3 days for acclimatization to learn the use of feeders and
drinking bottles. On the first day of acclimatization, body composition was measured by
magnetic resonance imaging (MRI) scan (EchoMRI). One day long control measurement
was performed in metabolic boxes (TSE Phenomaster) in normal circumstances after
training (baseline). Then, mice were exposed to 1 h restraint acute stress. In case of virus-
injected mice, control measurements were done after a saline injection, while the
experimental mice were injected by clozapine-N-oxide (CNO). CNO was dissolved in 0,9
% saline solution (1 mg/ml) and was injected i.p. (dose:1mg/kg body weight). Control
virus injected mice were treated by saline or CNO. After inducing stress response, and
CNO/saline injections, the metabolic measurement was continued for further 24 hours.
Experimental design and timeline diagram is shown on figure 7.
Chronically stressed mice were placed into metabolic cages and their metabolic
changes were measured after the last stress of the CVS protocol for three days. Data of
the first day were regarded as stress effect on metabolism and data of the third day were
considered as recovery. Food- and O2 consumption, CO2 production and X-Y-Z
locomotor activity data were automatically collected during the metabolic measurements.
Energy expenditure (EE (kcal/h)) was calculated using a rearrangement of the abbreviated
Weir equation as supplied by TSE Labmaster System: EE= (3.941 (VO2) + 1.106
(VCO2)) × 1.44. The respiratory exchange ratio (RER) was calculated also with the

28
following formula: VCO2/VO2. The body composition was determined again at the end
of metabolic measurements.
Figure 7. Experimental overview of the CNO induced metabolic measurement.
3.6. Behavior tests
3.6.1. Sucrose consumption test
Sucrose consumption test was performed before the CVS part of two hits protocol and
one day after chronic stress. Mice had free choice for 24h between two bottles: one with
1% sucrose solution and the other filled with tap water. The position of the two bottles
was switched after 12h. Sucrose and tap water intakes were assessed by weighing bottles.
The sucrose consumption was expressed as a percentage of total liquid intake. As we did
not habituate the animals to sucrose, this test measures neophobia rather than sucrose
preference [89].
3.6.2. Open field test
In open field test, mice were placed in the center of a 40x40x30cm, white, non-
transparent plastic box and their exploration was video-recorded from above for 10 min
and then analyzed by Noldus EthoVision XT 10 program. The open field was divided
into 16 squares by a 4x4 grid in the software. The four inner squares of the grid were
considered as central area.
3.6.3. Novel environment test
The first five minutes of the mouse behavior in the open field arena was analyzed by
Solomon Coder software. Four different behavior elements were differentiated in this
analysis: walk, survey, rearing and grooming. The analysis was carried out by two
individuals blinded to subject treatment group. Walking was noted when the mouse
changed its location or turned as long as the front paws moved. Surveying was noted

29
when all paws were on the floor and head directed upwards. Rearing was noted when two
hind legs were on the floor and head directed upwards.
3.6.4. Elevated plus maze
The elevated plus maze (arm length-30 cm, arm width-7 cm, wall height-30 cm
platform height-80 cm) apparatus was made of dark-grey painted Plexiglas. Open arms
were surrounded by 0,3 mm high ledges. Mice were placed into the central area of the
platform facing to one of the open arms and were allowed to explore the apparatus for 5
min. Mice were considered to enter a compartment when all four legs crossed the lines
separating the compartments. Videos were analyzed by Noldus Observer software.
Percentage of time spent in closed arms was used as a measure anxiety-like behavior.
3.7. Gut permeability test in vivo
To assess gut permeability, four experimental groups were formed: control, vehicle
treated; control, rifaximin treated; chronically stressed, vehicle treated and chronically
stressed, rifaximin treated mice. The dose of rifaximin was 300 mg/kg, vehicle was 5%
hypromellose) After overnight of fasting, all animals received FITC-labelled 4kDa
Dextran (Sigma-Aldrich) via oral gavage (dose: 44 mg/kg; 100 mg/ml). 2 hours later,
250-300 µl blood was collected from heart, centrifuged and serum was collected. Serum
samples were diluted with an equal volume of PBS and FITC concentration was measured
from 100 µl of diluted serum at excitation 485nm and emission 535nm wavelength using
Cytation 5 Cell Imaging Multimode reader (Biotek Instruments). A standard curve was
obtained by serial dilution of FITC-dextran solution in PBS (range: 0-16000 ng/ml).
Equal volume of non-hemolytic serum from non- gavaged mice was added to the serial
dilution before measurement.
3.8. Hormone, endotoxin, glucose and triglyceride measurement
from plasma
Plasma corticosterone was measured from 10µl plasma by direct RIA as described
Zelena et al. [90].

30
To determine plasma endotoxin levels, commercially available limulus amebocyte
lysate (LAL) assay was used in accordance of the manufacturer’s instructions (Pierce
LAL Chromogenic Endotoxin Quantitation Kit, Thermo Scientific).
Plasma glucose level was determined by Glucose Colorimetric Detection Kit from
plasma according to the manufacturer’s protocol (Glucose Colorimetric Detection Kit,
Invitrogen).
Plasma triglyceride (TG) level was measured by multiparameter diagnostic device for
triglycerides (MultiCare-in; Biochemical Systems International Srl).
3.9. Gene expression analysis
Frozen colon tissue samples were homogenized by Bertin Technology Minilys
homogenizer in 300 µl TRI reagent. Then, total mRNA was isolated from the homogenate
using a Total mRNA Mini Kit (Geneaid) according the manufacturer’s instruction. To
eliminate genomic DNA contamination, DNase I (Fermentas) treatment was used.
Sample quality control and the quantitative analysis were carried out by NanoDrop
(Thermo Scientific). cDNA synthesis was performed with High Capacity cDNA Reverse
Transcription Kit (Applied Biosystems). Real-Time PCR was carried out in ABI
StepOnePlus instrument (Applied Biosystems) with Fast EvaGreen quantitative PCR
master mix (Biotium) and gene-specific primers. Primers (Microsynth) were designed in
our laboratory using Primer-BLAST software of the National Center for Biotechnology
Information (NCBI). Forward and reverse primers used to quantify different mRNAs are
listed in Table 2. Gene expression was analyzed by the 2-ΔΔCT method using the ABI
StepOne Software v2.3 (Applied Biosystems). The amplicons were tested by melt curve
analysis on ABI StepOnePlus instrument (Applied Biosystems). Relative changes in gene
expression were normalized against GAPDH mRNA expression. Reference gene was
selected based on the NormFinder software [91].

31
Table 2. Forward and reverse primers for the selected genes
Genes Forward primer Reverse primer
GAPDH TGACGTGCCGC TGGAGAAA AGTGTAGCCCAAGATGCCCTTCAG
TJP1 CGGCCGCTAAGAGCACAG TGGAGGTTTCCCCACTCTGA
TJP2 GCAGAGACAACCCCCACTTT CTTGACCACGATGGCTGCTA
TJP3 ACAGCATGCGGACCTACAAG AGCCCTCGTCATCAGAGG AT
Occludin CCGGCCGCCAAGGTTC CATGCATCTCTCCGCCAT
MUC2 GCTGACGAGTGGTTGGTGAATG GATGAGGTGGCAGACAGGAGAC
Reg3b ACCCTCCGCACGCATTAGTT TTTGGCAGGCCAGTTCTGCAT
Retnlb TCAGTCGTCAAGAGCCTAAGAC AGTCTGCCAGAAGACGTGAC
3.10. Microbiome analysis
Total DNA was extracted from 200 mg colon content using QIAamp DNA Stool Mini
Kit (Qiagen) according to the manufacturer’s protocol. Total genomic DNA
concentration and quality control was checked by using NanoDrop (Thermo Fisher).
Targeting the bacterial 16S ribosomal RNA gene, dominant taxon of the gut microbiome
were analyzed by real time quantitative PCR with Fast EvaGreen quantitative PCR master
mix (Biotium) and taxon specific primers (Table 3.) on ABI StepOnePlus instrument
(Applied Biosystems). In case of Proteobacteria, primer specificity for the phylum could
not be confirmed, therefore, different subdivisions of the phylum were determined
(Alpha-, Beta-, Epsilon- and Gamma-Proteobacteria). The position of the specific
primers in 16S rRNA gene and primer references are found in Table 3. The primer
specificity was tested by Melt Curve Analysis. DNA samples were diluted to the same
concentration 5ng/µl. Quantification was done by using standard curves made from
known concentrations of the respective amplicon for each set of primers. Gene expression
was analyzed using ABI StepOne v2.3 program (Applied Biosystems). The results are
expressed in copy number (CN) and it was calculated with the following formula: CN =
A*6x10²³/(L*660)*1x109 ng/g; where A is the amount of the amplicon in ng, L is the
length of the amplicon.

32
Table 3. Forward and reverse primers of the targeted microorganism, the PCR
amplicon position in the 16S rRNA gene and the references of primers.
Target
organism
Amplicon
position in
the 16S
rRNA gene
Sequence Ref.
Actinobacteria Act920F3
Act1200R
f: TACGGCCGCAAGGCTA
r: TCRTCCCCACCTTCCTCCG [92]
Bacteroidetes Bact934F
Bact1060R
f: GGARCATGTGGTTTAATTCGATGAT
r: AGCTGACGACAACCATGCAG [93]
Clostridium sp. Clos58-f
Clos780-r
f: AAAGGAAGATTAATACCGCATAA
r: ATCTTGCGACCGTACTCCCC [94]
Cyanobacteria Cya-F783
Cya-R1100
f: GGCAGCAGTGGGGAATTTTC
r: GTMTTACCGCGGCTGCTGG [95]
Firmicutes 928F-Firm
1040FirmR
f: TGAAACTYAAAGGAATTGACG
r: ACCATGCACCACCTGTC [92]
α-proteobacteria A682F
908aR
f: CIAGTGTAGAGGTGAAATT
r: CCCCGTCAATTCCTTTGAGTT [96]
β-proteobacteria Beta680F
1392R
f: CRCGTGTAGCAGTGA
r: ACGGGCGGTGTGTACA [97]
γ-proteobacteria 1080γF
γ1202R
f: TCGTCAGCTCGTGTYGTG
r: CGTAAGGGCCATGATG [92]
Verrucomicrobia VER_37F
VER_673R
f: TGGCGGCGTGGWTAAGA
r: TGCTACACCGWGAATTC [98]
Total bacteria 331F
797R
f: TCCTACGGGAGGCAGCAGT
r: GACTACCAGGGTATCTAATCCTGTT [99]
3.11. Bacterial load in mesenteric lymph node
Mesenteric lymph nodes (MLN) were aseptically collected and stored at -70°C. Total
DNA was isolated from MLN by Tissue Genomic DNA Mini Kit (Geneaid) according to
the manufacturer. DNA concentration and quality control was checked by using
NanoDrop (Thermo Scientific). Samples were diluted to the same DNA concentration.
Then total DNA was amplified targeting bacterial 16S rRNA gene by using a universal
bacterial primer (Table 3.). Amplification was processed by RT-PCR as described in 2.6.

33
3.12. Histological methods
3.12.1. Perfusion and tissue processing
24h after metabolic measurement, restraint stress was repeated on CRH-Ires-Cre x
tdTomato transgenic mice. In rAAV8/hsyn-DIO-hM3D(Gq)-mCherry injected mice, a
second treatment with CNO was performed. Two hours after the beginning of stress or
CNO injection, (at the maximum of cFos expression) mice were anesthetized and
perfused with ice cold fixative (4% paraformaldehyde in 0.1 M phosphate buffer pH 7.2)
for histology. Chronically stressed mice, which were kept in metabolic cages, were
perfused 72h after metabolic measurements. The fixed brain tissue was dissected, post-
fixed in the same fixative supplemented with 10% sucrose and incubated overnight in
KPBS with sucrose. Then, coronal sections (20 μm) were cut on freezing microtome and
stored in cryoprotectant at −20 °C until use.
In case of rifaximin experiment, cleaned colon samples was placed immediately after
decapitation into 10% buffered paraformaldehyde (pH=7.4) for 24 h. Fixed tissues were
embedded in paraffin and sectioned 5 µm thick sections in two parallel series.
3.12.2. Haematoxylin & eosin staining, imaging and quantification
One series of the two parallel colon sections was deparaffinized and stained with
haematoxylin & eosin (H&E) according to a standard protocol. Images of stained colon
sections were captured under 20x magnification with Spot RT color digital camera on
Nikon Eclipse 6000 microscope. Mucosa thickness was measured by using ImageJ
software, in a blinded manner. From each mouse, five sections were randomly selected,
from each section, 10 measurements were done and averaged.
3.12.3. Immunostaining, imaging and quantification
To check the place of virus injections and to verify the effect of acute stress, free-
floating coronal brain sections were washed three times in KPBS. To avoid nonspecific
binding, sections were incubated in 2% normal donkey serum (Jackson ImmunoResearch
Laboratories) in PBS/0,3% Triton X100 at room temperature for 1h. Then, sections were
incubated in rabbit anti-c-Fos antibody made in rabbit primer (sc-52 Santa Cruz
Biotechnology, Santa Cruz, CA, 1:10000) at 4°C for 72h. After 3 times washing, sections
were incubated in anti-rabbit Alexa Fluor 488 secondary antibodies produced in donkey
(Life technologies 1:1000) for 1hour at room temperature. After incubation, sections were

34
washed again in KPBS and were cover-slipped with DAPI Fluoromount-G
(SouthernBiotech). Digital images of hypothalamic paraventricular nucleus (PVN) were
captured using Nikon C2+ confocal microscope.
F4/80 (murine macrophage marker) immunostaining was performed on colon samples
by an immunohistochemical protocol for paraffin embedded sections. Slides were
deparaffinized and rehydrated. Antigen retrieval pre-treatment was performed with
proteinase K (Sigma; 10 mg/ml; diluted 1:25 in digestion puffer: 1M Tris and 0,5M
EDTA). In this immunostaining, endogenous peroxidase was blocked by 0,3% H2O2.
Next, slides were incubated in 2,5% normal rabbit serum then incubated in anti-mouse
F4/80 antibody made in rat (BMA Biomedicals, T-2008; 1:50) overnight at 4°C in
humidified boxes. After washing, slides were incubated in biotinylated secondary
antibody (Vector Laboratories, 1:250) for 1 h. Then, immunoreactivity was visualized
with Alexa FluorTM 488 Tyramide SuperBoostTM Kit, according to the manufacturer’s
instructions (Invitrogen by Thermo Fisher Scientific). Slides were cover slipped with
DAPI Fluoromount-G (SouthernBiotech) and scanned with Pannoramic MIDI II Slide
Scanner. Images were analyzed with Caseviewer 2.3. software by two different
investigators, who were blinded to treatment. For quantitative analysis of the area%
occupied by F4/80 immunoreactivity, ten images from each mouse were randomly
selected and re-opened in Image J software. All images were set at a common threshold
level and F4/80 positive areas were selected. Background subtraction procedure was
performed equally in each image. The entire immunoreactive area fraction was then
automatically measured by the program, with the same threshold. Area % was measured
separately for submucosa and lamina propria.
3.13. Epidemiological data collection
Antibiotic consumption data, collected between 1997-2009 by the ESAC project
(European Surveillance of Antibiotic Consumption network) and data from the ECDC
(European Centre for Disease Prevention and Control) database (2010-2017) were used.
Within the penicillin group, consumption data of narrow spectrum penicillins (J01CE)
plus penicillinase resistant penicillins (J01CF) and the extended spectrum penicillins
(J01CA) plus β lactamase inhibitor combination penicillins (J01CR) were separately
compared to PD prevalence change data. Changes in PD prevalence between 1990-2016

35
were obtained from [100]. Correlation was calculated between antimicrobial consumption
data and changes in PD prevalence.
3.14. Statistics
All data are shown as means ± SEM. Unpaired or paired two tailed Student’s t-test
were used when significant differences was determined between two groups. Statistical
analysis was performed by two-way ANOVA (GraphPad Prism 7) followed by Sidak’s
multiple comparison test when the mean differences was calculated between groups that
have been split on two independent factors. In case of sugar preference, data was analyzed
by repeated-measures ANOVA followed by Sidak’s post hoc test. Time was the repeated
measure in paired two tailed Student’s t-test and repeated-measures ANOVA. Correlation
analysis was performed in our medical hypothesis between antimicrobial consumption
and changes in PD prevalence. In all cases, differences were considered statistically
significant at p<0.05.

36
4. Results
4.1. Basal metabolic and locomotor activity
Control, basal metabolic measurements were done on intact C57BL/6J mice for 72h.
As seen on Fig. 8, locomotor activity and all metabolic parameters show circadian
rhythmicity. Their locomotor activity, food intake, energy expenditure (EE) and
respiratory exchange ratio (RER) are higher in the dark phase compared to the light phase
(locomotor activity: F(1,3) = 15.47; p = 0.0293; food intake: F(1.3) = 17,68; p = 0.0245;
EE: F(1,3) = 39,94; p = 0.008; RER: F(1,3) = 24.4; p = 0.0159). Two distinct peaks occur
in all parameters during the active phase: the first at the beginning of dark phase and the
second is before the inactive state.

37
Figure 8. Basal metabolic measurement.
Baseline recordings of locomotor activity, food intake, energy expenditure (EE),
respiratory exchange ratio (RER) and average of these activities in the light and dark
phases. Data were analyzed by repeated two-way ANOVA (n =4). Time being the
repeated measure. Mean ± SEM values, **p < 0.01 vs. control group [101].

38
4.2. Acute restraint stress
Neuronal activity in the hypothalamus of CRH IRES Cre/TdTomato mice, as assessed
by c-Fos immunostaining revealed selective activation of CRH neurons in response to 1h
restraint stress. 60,5% of the CRH neurons were c-Fos positive in PVN of stressed mice.
By contrast, CRH (Tomato) and c-Fos colocalization was not observed in the PVN of
control, non-stressed mice (Fig. 9A). ACTH and corticosterone plasma levels were
significantly increased in stressed mice compared to the controls [ACTH: t = 9.052; DF
= 4; p = 0.0028; corticosterone: t = 4.461; DF = 4; p =0.0112] (Fig. 9B-C).
Figure 9. Effectiveness of acute stress.
Representative images of the hypothalamic paraventricular nucleus (PVN) from control
and restrained mice. Red- tdTomato fluorescent protein expression in CRH neurons of
CRH-IRES-Cre mice Green- c-Fos immunolabelled cell nuclei. Yellow- Stress-activated
CRH neurons. 3V- third ventricle. Scale bar is 100µm (A) [not published] Plasma ACTH
level (B) and plasma corticosterone level (C) in control vs. acutely restrained male mice.
[101]. Data were analysed by unpaired t-test (n =3). Mean ± SEM values, *p<0.05,
**p<0.01 vs. control group.

39
4.3. Effects of acute psychological stress on locomotor behaviour
and metabolic variables
4.3.1. Locomotor activity
Stressed mice displayed increased locomotor activity in the first hours after acute stress
[measurement points during the first hour: 1. point: t = 0.3764; DF = 168; p = >0.9999;
2. point: t = 1.025; DF = 168; p = 0.9999; 3. point: t = 1.582; DF = 168; p = 0.9535; 4.
point: t = 3.464; DF = 168; p = 0.0168; 5. point: t =3.656; DF = 168; p = 0.0085], it
reminded elevated in the following three hours (Fig. 10B), however, average of the first
four hours were not significantly changed [F(1,7) = 2.446; p = 0.1618] (Fig. 10C). The
average locomotor activity was not changed when in the entire light phase was analyzed
[F(1,7) = 1.427; p = 0.2712] (Fig. 10D). Nevertheless, locomotor activity of stressed
animals was significantly decreased in dark phase compared to the basal measurements
[F(1,7) = 6.823; p = 0.0348] (Fig. 10E).

40
Figure 10. Acute stress effect on locomotor activity.
Daily timeline of locomotor activity after acute restraint stress compared to basal
measurements (A). The first four (4) hour timeline of locomotor activity after acute stress
compared to the basal measurements (B). Average locomotor activity in the first four
hour (C), in the light phase (D) and in the dark phase (E) after acute stress. Data were
analyzed by repeated measures two-way ANOVA. In case of the first four hours ANOVA
was followed by Sidak’s multiple comparison test (n =8). Time and treatment being the
repeated measures. Mean ± SEM values, *p<0.05, **p<0.01 vs. control group [not
published].

41
4.3.2. Cumulative food intake
Stressed mice consumed more food in the first four hours after acute stress. After the
third hour, significant difference was noticed between basal measurement and the
measurements after acute stress [measurement points during the fourth hour: 1. point: t =
3.16; DF = 168; p = 0.0457; 2. point: t = 3.917; DF = 168; p = 0.0033; 3. point: t = 4.34;
DF = 168; p = 0.0006; 4. point: t = 3.316; DF = 168; p = 0.0276; 5. point: t = 3.539; DF
= 168; p = 0.0129; 6. point: t = 3.872; DF = 168; p = 0.0038] (Fig. 11B). However, this
difference was equalized later and the cumulative food intake was not changed neither in
the entire light phase [t = 0.9107; DF = 7; p = 0.3927] (Fig. 11D) nor in the entire dark
phase [t = 1.426; DF = 7; p = 0.1969] (Fig. 11E).

42
Figure 11. Effect of acute stress on food intake.
Daily timeline of cumulative food intake after acute restraint stress compared to the basal
measurements (A). The first four hour timeline of cumulative food intake after acute stress
compared to the basal measurements (B). Average cumulative food intake in the first four
hour (C), in the light phase (D) and in the dark phase (E) after acute stress. Difference
of cumulative food intake was tested by paired t-test. Time being the repeated measures.
During the first four hours, significance of the continuous changes was analyzed by
repeated measures two-way ANOVA followed by Sidak’s multiple comparison test (n=8).
Time and treatment being the repeated measures. Mean ± SEM values, *p<0.05,
**p<0.01, ***p<0.001 vs. control group [not published].

43
4.3.3. Energy expenditure (EE)
Energy expenditure (EE) was higher during the first four hours after acute stress
[F(1,7) = 15.25; p = 0.0059] (Fig. 12B-C) and it was also significantly elevated in the
entire light phase compared to the basal measurement [F(1,7) = 15; p = 0.0061] (Fig.
12D). However, there was no difference in the dark phase [F(1,7) = 0.000609; p = 0.981]
(Fig. 12E).
Figure 12. Effect of acute stress on energy expenditure.
Daily timeline of energy expenditure after acute restraint stress compared to the basal
measurements (A). The first four hour timeline of energy expenditure after acute stress
compared to the basal measurements (B). Average energy expenditure in the first four
hour (C), in the light phase (D) and in the dark phase (E) after acute stress. Data were
analyzed by repeated measures two-way ANOVA (n =8). Time and treatment being the
repeated measures. Mean ± SEM values, **p<0.01 vs. control group [not published].

44
4.3.4. Respiratory exchange ratio (RER)
RER is the ratio of carbon dioxide production (VCo2) and oxygen (VO2) used. The value
indicates the predominant fuel source. The value usually changes between 0.7 and 1. RER
of 1 indicates that carbohydrates was metabolized as the predominant fuel and RER of
0.7 indicates fat utilization. As seen on Figure 9, there were not significant differences in
the utilization of energy sources in the first four hours (Fig. 13B-C) after acute stress
neither in the light phase (Fig. 13D) nor in the dark phase (Fig. 13E).
Figure 13. Effect acute stress on respiratory exchange ratio (RER).
Daily timeline of RER after acute restraint stress compared to the basal measurements
(A). The first four hour timeline of RER after acute stress compared to the basal
measurements (B). Average RER in the first four hour (C), in the light phase (D) and in
the dark phase (E) after acute stress. Data were analyzed by repeated measures two-way
ANOVA. In case of the first four hours ANOVA was followed by Sidak’s multiple
comparison test (n =8). Time and treatment being the repeated measures. Mean ± SEM
values [not published].

45
4.3.5. Body composition
Body composition was measured before the beginning of 1h restraint stress and it was
measured again 24h later by MRI. As seen on Figure 8., body weight and fat mass were
decreased 24 hours later of acute stress [body weight: t = 2.437; DF = 7; p = 0.045; fat
mass: t = 4.467 DF = 7; p = 0.0029] (Fig 14A-B). In lean mass, there was no effect of
acute stress [t = 1.887; DF = 7; p = 0.1011] (Fig. 14C).
Figure 14. Effect of acute stress on body composition.
Body weight (A), fat mass (B) and lean mass (C) before and 24hours after acute restraint
stress. Fat and lean mass represented as the percentage of body weight. Data were
analyzed by paired t-test (n =8). Mean ± SEM values, *p<0.05, **p<0.01 vs. control
group [not published].
4.4. Chemogenetic activation of CRHPVN neurons
To reveal the contribution of stress-related CRH expressing neurons in challenge-
induced locomotor and metabolic changes we chemogenetically manipulated these
neurons in the paraventricular nucleus. To confirm that paraventricular CRH neurons
(CRHPVN) become activated after triggering Gq-DREADD receptors, CRH-IRES-Cre
mice, -previously injected by Cre-dependent pAAV-hSyn-DIO-hM3D(Gq)-mCherry
vector into the hypothalamic PVN region- received CNO injection (i.p.). Control animals
were injected with pAAV-hSyn-DIO-mCherry vector and also challenged with CNO. In
both cases, c-Fos expression was used an indirect marker of neuronal activity. As showed
on Fig. 15., c-Fos induction was seen only in DREADD expressing mice. It has been
noted that c-Fos expression after activation of CRHPVN neurons goes beyond the nucleus
and seen in non CRH neurons the peri-paraventricular region, possibly due to secondary
neuronal activation originating in CRHPVN cells.

46
Figure 15. Activation of CRH neurons in PVN by DREADD.
Representative images of the paraventricular hypothalamic area of control and DREADD
virus injected mice. Red- mCherry fluorescent protein in CRH neurons; Green- c-Fos
immunoreactive neurons. 3V-third ventricle. Scale bar is 100µm [not published].
4.5. Effect of CRHPVN activation on locomotor behavior and
metabolism
4.5.1. Locomotor activity
Locomotor activity did not change significantly after activation of CRHPVN neurons
within the first four hours after i.p. CNO treatment [F(1,6) = 1.422; p = 0.2781] (Fig.
16B-C), although there was a tendency for increased locomotion, when compared to
saline injected mice. Similarly, there was no change in the average of locomotion neither
in the light [F(1,6) = 0.2377; p = 0.6432] (Fig. 16D) nor in the dark phase [F(1,6) = 0.7;
p = 0.4348] (Fig. 16E).

47
Figure 16. Effect of activation of CRHPVN neurons on locomotor behavior
Locomotor activity of CRH-IRES-Cre mice injected by pAAV-hSyn-DIO-hM3D(Gq)-
mCherry vector into the PVN after CNO/saline treatment (A). The first four hour timeline
of locomotor activity after CNO or saline (B). Average locomotor activity in the first four
hour (C), in the light phase (D) and in the dark phase (E) after i.p. injections. Data were
analyzed by repeated measures two-way ANOVA (n =7). Time and treatment being the
repeated measures. Mean ± SEM values [not published].
4.5.2. Cumulative food intake
The average of cumulative food intake was significantly higher in the first four hours
after CNO injection [t = 3.53; DF = 6; p = 0.0124] (Fig. 17B-C). However, there was no
difference in cumulative food intake in the entire light phase [t = 1.761; DF = 6; p =
0.1287] (Fig. 17A and D), however, it was significantly decreased in the dark phase [t =
3.165; DF = 6; p = 0.0194] (Fig. 17E).

48
Figure 17. Effect of chemogenetic activation of CRHPVN neurons on cumulative food
intake.
Daily timeline of cumulative food intake after CNO treatment compared to the
measurements after saline injection (A). The first four hour timeline of cumulative food
intake after CNO/saline injections in DREADD expressing mice (B). Average cumulative
food intake in the first four hour (C), in the light phase (D) and in the dark phase (E) after
activation of CRHPVN neurons. Data were analysed by paired t-test (n =7). Time being
the repeated measures. Mean ± SEM values, *p<0.05 vs. control group [not published].
4.5.3. Energy expenditure (EE)
After CNO injection, average of energy expenditure was significantly higher in the
first four hour [F(1,6) = 15.61; p = 0.0075] (Fig. 18B-C). After the fourth hour, there was
no difference in EE between saline and CNO treatment and the average of energy
expenditure did not changed neither in the light (Fig. 18D) nor in the dark phase [light:
F(1,6) = 4.758; p = 0.0719; dark: F(1,6) = 2.691; p = 0.1521] (Fig. 18E).

49
Figure 18. Effect of chemogenetic activation of CRHPVN neurons on the energy
expenditure.
Daily timeline of energy expenditure after CNO treatment compared to the measurements
after saline injection (A) in CRH-IRES-Cre mice injected with virus vectors encoding
stimulatory DREADDs. The first four hour timeline of energy expenditure after activating
CRHPVN neurons by CNO (B). Average energy expenditure in the first four hour (C), in
the light phase (D) and in the dark phase (E). Data were analysed by repeated measures
two-way ANOVA (n =7). Time and treatment being the repeated measures. Mean ± SEM
values, **p<0.01 vs. control group [not published].
4.5.4. Respiratory exchange ratio (RER)
There was no difference in the respiratory exchange ratio during 23 hours of metabolic
measurements after CNO injection compared to RER values after saline injection [first 4
hour: F(1,6) = 0.03247; p = 0.8629; light: F(1,6) = 0.1221; p = 0.7387; dark: F(1,6) =
2.848; p = 0.1424] (Fig. 19A-E).

50
Figure 19. Effect of chemogenetic activation of CRHPVN neurons on respiratory
exchange ratio.
Daily timeline of respiratory exchange ratio after CNO treatment compared to the
measurements after saline injection (A). The first four hour timeline of RER after
CNO/saline injections in DREADD expressing mice (B). Average respiratory exchange
ratio in the first four hour (C), in the light phase (D) and in the dark phase (E). Data were
analyzed by repeated measures two-way ANOVA (n =7). Time and treatment being the
repeated measures. Mean ± SEM values [not published].
4.5.5. Body composition
Body composition changes of DREADD expressing mice, was measured by MRI on
the first day of acclimatization and at the end of metabolic measurements. As shown on
Fig. 20, body weight and fat mass were significantly reduced [body weight: t = 2.541; DF
= 6; p = 0.0440; fat mass: t = 2.954; DF = 5; p = 0.0317] and lean mass did not change [t
= 0.5653; DF = 6; p = 0.5923] at the end of measurements.

51
Figure 20. DREADD induced stress effect on body composition.
Basal body weight at the first day of acclimatization (blue) and body weight at the end of
measurements (red) (A). Fat mass at the first day of acclimatization (blue) and fat mass
at the end of measurements (red) (B). Basal lean mass at the first day of acclimatization
(blue) and lean mass at the end of measurements (red) (C). Fat and lean mass represented
in the percentage of body weight. Data were analysed by paired t-test (n =8). Time being
the repeated measures. Mean ± SEM values, *p<0.05 vs. control group [not published].
4.6. Control experiments
To examine whether CNO injection or virus injection are able to influence the
metabolic system, control virus injected mice (DREADD gene was not included in
plasmid (see chapter 4.2.) were kept in metabolic cages for 24h and their metabolic
changes were measured after CNO injection. These results were compared to intact
control mice and to DREADD injected mice after saline treatment. Locomotor activity of
both virus injected mice (control and DREADD containing virus) was decreased in the
dark phase compared to the intact control mice, however, this reduced locomotor activity
was significant only after CNO injection [DREADD virus + saline vs. intact control: q =
2.735; DF = 65; p = 0.1373; control virus + CNO vs. intact control: q = 5.811; DF = 65;
p = 0.0003] (Fig 21A). The average food intake, EE and RER did not changed neither in
light nor in dark state after CNO treatment [Food intake - DREADD virus + saline vs.
intact control: q = 0.9666; DF = 65; p = 0.7739; control virus + CNO vs. intact control: q
= 0.7158; DF = 65; p = 0.8686; EE - DREADD virus + saline vs. intact control: q = 2.261;
DF = 65; p = 0.2534; control virus + CNO vs. intact control: q = 0.6945; DF = 65; p =
0.8758; RER - DREADD virus + saline vs. intact control: q = 0.6873; DF = 65; p =
0.8782; control virus + CNO vs. intact control: q = 0.04946; DF = 65; p = 0.9993] (Fig
21B-D), however, energy expenditure was increased significantly in the first four hours

52
after i.p. injection compared to intact control mice [DREADD virus + saline vs. intact
control: q = 5.266; DF = 9; p = 0.0119; control virus + CNO vs. intact control: q = 4.064;
DF = 9; p = 0.044] (Fig. 21C).
Figure 21. Effectiveness of virus injection and CNO injection on metabolic system.
Daily timeline of locomotor activity (A), food intake (B), energy expenditure (C) and
respiratory exchange ratio (D). Blue – intact control (n=8), white – control virus + CNO
i.p. injection (n=4) and black – DREADD virus + saline i.p. injection (n=7). Data were
analysed by one-way ANOVA followed by Tukey’s multiple comparisons test. Mean ±
SEM values (not published).
4.7. Effects of chronic stress
Mice exposed to chronic stress did not gain significant body weight by the end of stress
protocol, when compared to non-stress controls as shown on Fig.18. [control – compared
to initial bodyweight: t = 4.359; DF = 16; p = 0.001; CVS - compared to initial body
weight: t = 1.588; DF = 16; p = 0.2464] (Fig. 22A). To check the behavioral effect of the
CVS, mice were exposed to open field one day after the end of CVS procedure.
Chronically stressed mice spent significantly less time in centrum (t = 2.332; DF = 8; p =
0.048) (Fig. 22D) and the latency of the first entry into corners were shorter (t = 3.651;

53
DF = 8; p = 0.0065) (Fig. 22E) compared to non-stressed controls. These mice were then
sacrificed and different stress markers measured. CVS resulted in adrenal enlargement [t
= 2.492; DF = 8; p = 0.0374] (Fig. 22B) and increased plasma corticosterone level [t =
2.532; DF = 8; p = 0.0351] (Fig. 22C).
Figure 22. Effects of chronic stress on body weight, adrenals, plasma hormone level
and behaviour.
Body weights of control (blue) and chronically stressed mice before and after CVS
protocol (A). Normalized adrenal gland weight (B). Plasma corticosterone level (C).
Center preference (D) and the first latency to corner (E) during open field test. Data were
analyzed by unpaired t-test (n=5/group). Mean ± SEM values, *p<0.05, **p<0.01,
***p<0.001 vs. control group. In case of body weight gain, repeated two-way ANOVA
followed by Sidak’s multiple comparison test were done (n =9). Time being the repeated
measures. Mean ± SEM values, *p<0.05, **p<0.01, ***p<0.001 vs. initial body weight
[not published].

54
4.8. Effect of chronic variable stress on metabolism
After the CVS procedure, metabolic changes of the experimental mice were measured
for 72 h. The first 24h (right after the CVS protocol) of the measurements were considered
as stress effect and the last 24h was regarded as recovery of CVS exposed mice.
4.8.1. Locomotor activity
The average of locomotor activity chronically stressed mice was significantly higher
in the light phase [q = 3.91; DF = 31; p = 0.0009], In the dark phase, locomotor activity
was not changed significantly during the three days of measurements after CVS compared
to the control mice [control vs. stress effect q = 2.144 DF = 33; p = 0.0716; control vs.
recovery q = 1.867; DF = 33; p = 0.1254] (Fig. 23A-B).
55
Figure 23. Chronic stress effect on locomotor activity.
Daily timeline of locomotor activity in control mice (blue) and mice exposed to chronic
variable stress, CVS (red). (A). Average locomotor activity after chronic stress (red)
during recovery (green) and in controls (blue) in the light and dark periods (B). Data
were analysed by one-way ANOVA followed by Dunnett’s multiple comparison test.
Significance was calculated by repeated two-way ANOVA between stress effect and
recovery (n =4). Time being the repeated measures. Mean ± SEM values, ***p<0.001 vs.
control [not published].

56
4.8.2. Cumulative food intake
Food consumption of the stressed mice was higher after CVS procedure but it was
elevated significantly only during the active phase [light: q = 1.175; DF = 9; p = 0.4274;
dark: q = 2.818; DF = 9; p = 0.0361]. The cumulative food intake reminds elevated during
recovery compared to the control mice, however, it was not significant [light: q = 0.184;
DF = 9; p = 0.9756; dark: q = 1.48; DF = 9; p = 0.2853] (Fig. 24A-B).
Figure 24. Chronic stress effect on cumulative food intake.
Daily timeline of cumulative food intake after chronic stress (red), during recovery
(green) and control mice (blue) (A). Average cumulative food intake after chronic stress
(red), during recovery (green) and in control mice (blue) in the light and dark phase (B).
Data were analyzed by one-way ANOVA followed by Dunnett’s multiple comparison test.
Significance was calculated by paired t-test between stress effect and recovery (n =4).
Time being the repeated measures. Mean ± SEM values, *p<0.05 vs. control group [not
published].

57
4.8.3. Energy expenditure
Energy expenditure of chronically stressed mice was continuously higher during the
three days of metabolic measurements compared to control mice [control vs. stress effect
- light: q = 20.6; DF = 33; p = <0.0001; dark: q = 10.3; DF = 33; p = <0.0001; control vs.
recovery - light: q = 13.45; DF = 33; p = <0.0001; dark: q = 8.009; DF = 33; p = <0.0001].
However, statistical analyses revealed that during recovery, the average energy
expenditure was decreased significantly in the active phase compared to the energy
expenditure of stress effect [F(11, 36) = 2.325; p = 0.028] (Fig. 25A-B).
Figure 25. Effect of chronic stress on energy expenditure.
Daily timeline of energy expenditure after chronic stress (red), during recovery (green)
and control mice (blue) (A). Average energy expenditure after chronic stress (red), during
recovery (green) and in control mice (blue) in the light and dark phase (B). Data were
analyzed by one-way ANOVA followed by Dunnett’s multiple comparison test.
Significance was calculated by repeated two-way ANOVA between stress effect and
recovery (n =4). Time being the repeated measures. Mean ± SEM values, ****p<0.0001
vs. control, #<0.05 vs. stress effect [not published].

58
4.8.4. Respiratory exchange ratio (RER)
During metabolic measurements, respiratory exchange ratio was continuously higher
in the stressed mice after CVS procedure [light: q = 2.872; DF = 33; p = 0.0134; dark: q
= 3.19; DF = 33; p = 0.006], however, the average RER of the stressed mice was dropped
after two days to the control level but only under the light phase [light: q = 0.4596; DF =
33; p = 0.859; dark: q = 3.899; DF = 33; p = 0.0009] (Fig. 26A-B).
Figure 26. Effect of chronic stress on respiratory exchange ratio (RER).
Daily timeline of respiratory exchange ratio after chronic stress (red), during recovery
(green) and in control mice (blue) (A). Average respiratory exchange ratio after chronic
stress (red), during recovery (green) and control mice (blue) in the light and dark state
(B). Data were analysed by one-way ANOVA followed by Dunnett’s multiple comparison
test. Significance was calculated by repeated two-way ANOVA between stress effect and
recovery (n =4). Time being the repeated measures. Mean ± SEM values, *p<0.05,
**p<0.01, ***p<0.001 vs. control [not published].

59
4.8.5. Body composition
Body composition was determined at the beginning (end of CVS) and the end of
metabolic measurements. As shown on Figure 27., there was no difference in body weight
between stressed and control mice at the beginning of measurements. However, fat mass
was significantly lower and lean mass was higher in chronically stressed animals
compared to the controls. During recovery, in chronically stressed mice, fat and lean mass
were restored to the control level and body weight significantly increased.
Figure 27. Chronic stress effect on body composition.
Body weight (A). Fat mass as % of body weight (B). Lean mass as % of body weight (C).
Blue is the average of control mice, red is the average of stressed mice at the beginning
and green is the average of CVS exposed mice at the end of measurement. Fat and lean
mass represented in the percentage of body weight. Data were analysed by one-way
ANOVA (n =4) and paired t-test was used to calculate significant differences between
stress effect and recovery. Mean ± SEM values, *p<0.05, ***p<0.001 vs. control group,
#<0.05, ###<0.001 vs. group of stress effect [not published].

60
4.9. Effect of chronic stress on gut microbiome and its restoration
after rifaximin treatment
Next, we investigated the effect of chronic stress on gut microbiome. As shown on
Fig. 28A exposure to “two hits” chronic stress paradigm resulted in significant reduction
of DNA in the colon content indicating reduction of total colonic bacteria. Colon
microbiome diversity was analyzed at phylum level and the results showed an increased
abundance in the phylum of Bacteriodetes [F(1,17) = 5.844; p = 0.0272] and
Proteobacteria [t = 2.665; DF = 17; p = 0.0324 compared to control]. Changes in
Firmicutes, Actinobacteria, Verrucomicrobia and Cyanobacteria were not significant
(Fig. 28B-C). Amount of Clostridium sp. was determined at genus level. Chronic stress
resulted in increased abundance of Clostridium in response to stress (Fig. 28D) [t = 2.707;
DF = 17; p = 0.0297 compared to control].
Rifaximin is a non-absorbable gut-acting antibiotic, which selectively eliminates
pathogenic bacteria from the gastrointestinal tract and relieves diarrhea associated with
Clostridium difficile infections.
Next, we have been interested in, if rifaximin treatment is able to restore stress-induced
changes in gut microbiome. Antibiotic treatment reduced total DNA concentration in the
colon content in non-stressed control animals while restored the abundance of
Proteobacteria and decreased Clostridium sp (t = 3.233; DF = 17; p = 0.0098 compared
to vehicle) in the chronically stressed mice (Fig. 28A-B-D).

61
Figure 28. Differences in the microbiome composition after chronic stress and
rifaximin treatment.
Total DNA concentration of colon content (A), copy numbers of bacterial phyla in the
colon content (B, C). Copy number of Clostridium sp. in different experimental groups
(D). Data were analyzed by two-way ANOVA, followed by Sidak’s multiple comparison
test (n = 5–7 per group). Mean ± SEM values, *p < 0.05 vs. control group, #p < 0.05, ##p
< 0.01, vs. MS + CVS-vehicle [102].
4.10. Effect of rifaximin treatment on chronic stress-induced
changes in organ weights, hormones and metabolic markers
Next, effects of rifaximin treatment was examined on different stress markers after
MS+CVS procedure. During chronic variable stress, weight gain between experimental
groups was not significantly different [F(1,18) = 0.2027; p = 0.8884)] (Fig. 29A).
Normalized adrenal weight was higher in all MS + CVS exposed mice than in controls
[F(1, 19)=4.512; p=0.047] (Fig. 29B). Two-way ANOVA did not reveal drug (rifaximin)
effect. Thymus weights were not different among the groups [F(1, 19) = 1.759; p =
0.2005]. During CVS procedure, basal (morning), pre-stress corticosterone levels were
significantly higher in CVS exposed mice than in controls [F (1, 18) = 7.181; p = 0.0153].

62
Two-way ANOVA indicated no drug effect [F(1, 18) = 0.1965; p = 0.6629] (Fig. 29C).
Analysis of plasma corticosterone concentrations after acute EPM exposure revealed no
significant differences among the treatment groups [F(1, 19) = 0.226; p = 0.6399] (Fig.
23D). Plasma glucose levels following acute stress were elevated in chronically stressed
mice compared to controls [F(1, 13) = 22.44; p = 0.0004] (Fig. 29E). In addition, post hoc
test revealed elevated plasma TG level in stressed mice [t = 2.627; DF = 18; p = 0.0339
compared to vehicle control], while there was no difference between the two, antibiotic
treated groups (Fig. 29F).
Figure 29. Effect of chronic stress and rifaximin treatment on different stress
markers.
Body weight gain during CVS (A). Normalized adrenal gland and thymus weights (B).
Basal corticosterone level during CVS (C). Effect of single acute stress (EPM exposure)
on corticosterone level after chronic stress (D), plasma glucose level (E), plasma
triglyceride level (F). Data were analyzed by two-way ANOVA, followed by Sidak’s
multiple comparison test (n = 5–7 per group). Mean ± SEM values, *p < 0.05 vs. control
group [102].

63
4.11. Effect of rifaximin on chronic stress-induced changes on
behavior
4.11.1. Ethogram
To examine the effects of chronic stress and rifaximin on mouse behavior, we observed
and quantified four distinct elements: walking, surveying, rearing and grooming during 5
min in novel environment (Fig. 30A). Compared to no-stress controls, all mice which
have been exposed previously to MS + CVS displayed exaggerated locomotor-related
behavior. The frequencies of all four selected behavioral elements were increased
significantly in stressed mice [survey: F(1, 41) = 66.76; p < 0.0001; walk: F(1, 41) =
58.67; p < 0.0001; rear: F(1, 41) =49.28; p < 0.0001; groom: F(1, 41)=33.35; p < 0.0001]
(Fig. 30B). Similarly, total duration of walking, rearing and grooming were increased
significantly in stressed mice, however surveying decreased [surveying: F(1, 41) = 104.1;
p < 0.0001; walking: F(1, 41) = 39.18; p < 0.0001; rearing: F(1, 41) = 37.69; p < 0.0001;
grooming: F(1, 41) = 17.38; p < 0.0002] (Fig. 30C). Rifaximin treatment had no effect on
the behavioral pattern of control and MS + CVS mice.

64
Figure 30. Behavioral activity of control and chronically stressed mice with or without
rifaximin treatment in a novel environment (open field arena)
Each row represents one mouse (A). Frequency (B) and duration (C) of selected
behavioral elements. Data were analyzed by two-way ANOVA (n = 9–14 per group).
Mean ± SEM values, **p < 0.01, ***p < 0.001, ****p < 0.0001 vs. control group [102].

65
4.11.2. Open field, EPM, sucrose consumption test
Increased locomotion was detected during the open field test in MS + CVS mice.
Velocity [F(1, 41) = 24.24; p < 0.0001] and distance moved [F(1, 41)=24.29; p < 0.0001]
was higher in chronically stressed mice (Fig. 31A–B). In addition, stressed mice spent
less time in the center [F(1, 41) = 10.38; p = 0.0025] and their first latency to border was
shorter than those of controls [F(1, 41) = 12.65; p < 0.0010] (Fig. 31C–D). To reveal
anxiety-like behavior after MS + CVS, elevated plus maze test was performed. As shown
in Fig. 31F preference for the open arms of stressed mice was significantly lower
compared to control animals [F (1, 28) = 13.95; p = 0.0009]. Neophobia was assessed by
sucrose consumption tests before and after the chronic stress procedure (Fig. 31G). MS +
CVS resulted in a significant decrease of sucrose consumption (novelty) in stressed mice
[t = 4.148; DF = 19; p = 0.0022] and the same reduced sucrose consumption was seen in
CVS + antibiotic treated mice [t = 3.251; DF = 19; p = 0.0167], however, there was no
difference in control groups. In each behavior tests (novel environment, open field,
elevated plus maze and sucrose consumption based neophobia) rifaximin treatment had
no effect.

66
Figure 31. Anxiety-like behavior and neophobia after MS + CVS.
Open field results: Velocity during open field test (A), distance moved (B) center
preference (C) first latency in border (D) and exploration maps of the experimental mice
(E). Open arm preference in elevated plus maze test (F). Data were analyzed by two-way
ANOVA (n = 9–14 per group). Mean ± SEM values, **p < 0.01, ****p < 0.0001 vs.
control group. Sugar consumption of experimental mice before and after CVS procedure
(G). Data were analyzed by repeated measures two-way ANOVA followed by Sidak’s
multiple comparison test (n = 5–7 per group). Mean ± SEM values, *p < 0.05, **p < 0.01
vs. control group [102].

67
4.12. Effect of MS+CVS and rifaximin treatment on the gut and
gut-related immunity
4.12.1. Colon mucosa, tight junction protein expression and gut
permeability
MS + CVS significantly reduced the thickness of colonic mucosa compared to control
[t=3,082; DF=19; p=0.0122]. Mucosa thickness was not different in rifaximin-treated
groups (Fig. 32A-B). Colonic mRNA expression (Fig. 32C) of tight junction proteins,
occludin [F(1, 19) = 11.27; p = 0.0033] and tight junction proteins TJP1 [F(1, 19) = 6.26;
p = 0.0216] and TJP2 [F(1, 19) = 6.613; p = 0.0187] but not TJP3 was increased in both
rifaximin treated groups, but remained unchanged in response to stress. In case of MUC2
mRNA there was no significant difference between the groups [F(1, 19) = 4.012; p =
0.597]. Expression of Reg3b, a C-type lectin with antimicrobial activity, was significantly
elevated in chronically stressed mice. Rifaximin treatment restored Reg3b mRNA level
to that of the controls [t = 3.811; DF = 19; p = 0.0024 compared to control, t = 4.398; DF
= 19; p = 0.0006 compared to vehicle, interaction: F(1, 19) = 10.21; p = 0.0048].
Next, we tested gut permeability in vivo, using FITC-labelled 4 kDa dextran. Increased
gut permeability has been revealed in chronically stressed mice, while rifaximin treatment
restored the normal, non-stressed values [t = 2.72; DF = 18; p = 0.0301 compared to
control, t = 3.449; DF = 18; p = 0.0066 compared to vehicle, interaction: F(1, 18) = 6.109;
p = 0.0251] (Fig. 32D).

68
Figure 32. Effects of stress and rifaximin on colon mucosa.
Representative images of hematoxylin-eosin stained colon sections (A) (scale bar: 20
μm) and bar graphs showing mean values ± SEM of mucosa thickness (B), mRNA levels
of different permeability markers and antimicrobial defence-related genes from colon
tissue (C), changes in gut permeability as measured by serum concentration of orally
administered FITC-dextran (mean values ± SEM) (D). Data were analyzed by two-way
ANOVA, followed by Sidak’s multiple comparison test (n = 5–7 per group). Mean ± SEM
values, *p < 0.05, **p < 0.01, vs. non-stressed control group, #p < 0.05, ##p < 0.01, ###p
< 0.001, vs. corresponding vehicle-treated group [102].

69
4.12.2. Gut permeability, macrophage infiltration, local- and systemic
bacterial load
Next, we checked whether increased gut permeability results in local piling of
macrophages in the gut mucosa. In control, vehicle-treated mice immunoreactivity
corresponding to macrophage marker F4/80 was primarily confined to the submucosa.
Essentially the same distribution was revealed in non-stressed, rifaximin-treated mice
(Fig. 33A). However, in MS-CVS mice, an increase of F4/80 positive profiles and
macrophage infiltration to the lamina propria was detected. Rifaximin treatment of MS-
CVS animals restored the distribution of F4/80 positive macrophages to that seen in
control animals (Fig. 33A). Quantitative histological analysis of F4/80 positive (+) areas
revealed significant rifaximin effect in the submucosa [F(1, 19) = 6.316; p = 0.0211]. In
the lamina propria of MS-CVS animals, the area covered by F4/80+ profiles were
significantly increased in stressed mice, which was reduced to that of the controls in
response to rifaximin treatment [t = 14.69; DF = 19; p < 0.0001 compared to control, t =
14.78; DF = 19; p < 0.0001 compared to vehicle, interaction: F(1, 19) = 105.4; p <
0.0001], (Fig. 33B). Gut lymphatics are drained in mesenteric lymph nodes, which gate
intestinal bacteria and pathogen-associated molecular patterns, PAMPs. To assess
bacterial translocation in chronically stressed mice, we PCR amplified bacterial DNA
from mesenteric lymph nodes using universal 16S ribosomal primers. Compared to non-
stressed controls, chronic stress resulted in 50% elevation of bacterial load in the MLN [t
= 2.781; DF = 18; p =0.0245]. Rifaximin administration interfered with stress-induced
increase of bacterial load (Fig. 33C). To reveal if chronic stress induces systemic
endotoxemia, plasma LPS levels were measured. Higher LPS level was detected in
plasma of stressed mice than in the controls [t = 2.61; DF = 18; p = 0.0351] but the
increase of plasma LPS was not detected in antibiotic treated mice (Fig. 33D).

70
Figure 33. Macrophage infiltration to lamina propria, local- and systemic bacterial
load.
Representative images of F4/80 immunostained colon sections showing distinct
macrophage distribution (green-F4/80) in stressed and rifaximin-treated animals (on
blue-DAPI background staining). (Scale bar: 100 μm) (A). Quantitative analysis of F4/80
immunostaining in the submucosa and lamina propria (B). Bacterial load in the
mesenteric lymph node expressed as % of control-vehicle group (C). Plasma LPS
concentration in control, MS + CVS groups, with or without rifaximin treatment (D).
Data were analyzed by two-way ANOVA, followed by Sidak’s multiple comparison test
(n = 5–7 per group). Mean ± SEM values, *p < 0.05, **p < 0.01, vs. control group, #p <
0.05, ##p < 0.01, ###p < 0.001, vs. corresponding vehicle group [102].

71
4.13. Hypothesis: correlation between Parkinson’s disease
prevalence, consumption of certain antibiotics and gut microbial
dysbiosis
Systemic antibiotics significantly affect the microbiome resulting chronic dysbiosis in
the gut, which may contribute to pathogenesis of neurological diseases. For instance,
Parkinson’s disease (PD) is often associated with gastrointestinal symptoms. Gut
dysbiosis in PD favors curli-producing Enterobacteria. Curli is a bacterial α-synuclein
(αSyn) which is deposited first in the enteric nervous system and amyloid deposits are
propagated in a prion like manner to the central nervous system. In addition, antibiotics
result in a low-grade systemic inflammation, which also contributes to damage of neurons
in enteric- and central nervous system. We tested the hypothesis whether consumption of
different groups of antibiotics, belonging to four major groups (penicillin /J01C/,
cephalosporin /J01D/, quinolones /J01M/, macrolides /J01F/) is associated with the
change of Parkinson’s disease (PD) prevalence in different European countries [100].
Significant positive correlation (r=0.537, p=0.002) was found between the consumption
of narrow spectrum + penicillinase (β-lactamase) resistant penicillin (J01CE+J01CF) and
the increased prevalence of PD (Fig. 34). The geographical distribution of the correlation
is also worth of mentioning (Fig.34). While the correlation was strong in the Scandinavian
countries (Denmark, Sweden and Norway), it is also interesting to note, that PD
prevalence decreased in Holland, France, Italy, Israel, countries with low-to-average
J01CE+J01CF exposure.

72
Figure 34. Correlation between consumption of certain penicillins and prevalence of
Parkinson’s disease.
Consumption of narrow spectrum β-lactamase sensitive (J01CE) and β-lactamase
resistant penicillins is expressed in DID (DID=Defined Daily Dose (DDD)/1000
Inhabitants/Day) [103].
Figure 35. Chart indicating penicillin consumption in different European Union (EU)
countries (ESAC project).
Penicillin consumption is expressed in DID. DID is the Defined Daily Dose (DDD)/1000
Inhabitants/Day. Countries marked with green arrows consume the highest amount of
narrow spectrum penicillin (green) and β-lactamase resistant penicillin (blue) within
their respective column (total consumption) [103].

73
5. Discussion
5.1. The effect of acute stress and effect of the activation of
CRHPVN on metabolic system
The hypothalamic paraventricular nucleus harbors neurons that integrate
neurondocrine, autonomic and behavioral responses to stress. These, functionally distinct
cell types are spatially distributed in the rat hypothalamus, however are intermingled
within the pareventricular region in case of mice and human [104].
It is well established that hypophyseotropic neurons of the PVN initiate the
neuroendocrine stress cascade, while autonomic parvocellular neurons of the PVN that
project to the brain stem and spinal cord are preganglionic cells of the sympathetic
nervous system. Activation of the sympatho-medullary and sympatho-adrenal systems all
involved in recruitment of bodily resources to “fight or flight” responses. While the
neuronal circuits regulating HPA axis activity are well described, much less is known
about the means with which stress-induced metabolic and behavioral responses are
organized.
Fight or flight- either stress-coping strategies require energy. Only a few studies
addressed directly metabolic changes accompanying acute or chronic stress. Here we
have shown that acute restraint stress results in a significant elevation of energy
expenditure in the first four hours post-stress and in the light (passive) phase of the
circadian rhythm 12h later. The first 4h time window for special detailed metabolic
analysis has been selected because most of the acute stress-induced hormonal changes
and neuronal activation occur in this time frame. Our results are in agreement with
previous findings on stress-induced elevation of energy expenditure in mice exposed to
tail suspension stress [105]. By contrast, Spiers et al. did not detect significant changes in
energy expenditure of male mice restrained for 2 hours [106]. These authors however,
analyzed the whole 96h post-stress data together.
Hormonal stress mediators (adrenaline, noradrenaline and glucocorticoids) have
profound effect on energy metabolism. Adrenaline increases blood glucose concentration
via stimulation of hepatic glucose production and inhibition of glucose disposal in insulin-
dependent tissues [107]. Adrenaline boosts lipolysis in the white adipose tissue and
activates uncoupling protein UCP-1-mediated thermogenesis in the brown adipose tissue
through beta adrenergic receptors [108].

74
Stress-induced level of corticosteroids results in hyperglycaemia via increased
gluconeogenesis in the liver, and impaired glucose uptake efficiency [109]. Excess
glucocorticoids decreases of fat depots and elevates circulating fatty acid through
increased hydrolysis of circulating triglycerides by activation of lipoprotein lipase.
Furthermore, glucocorticoids also increase de novo lipid production in hepatocytes
through increased expression of fatty acid synthase [110].
Based on the complex effects of major stress-mediators on the energy metabolism, it
is very likely that the energy consumed during acute stress response originates
predominantly from fatty acid oxidation. However, this is not supported by the respiratory
exchange ratio data obtained in our study. Although RER values of acutely restrained
mice are below of that of the non-stressed controls throughout the whole circadian cycle
post-stress, the difference from the control measurement is not significant.
The acute stress-induced energy expenditure correlates with the increased activity of
mice especially in the first couple of hours after releasing mice from the restrainers. Using
an automated video and vibration behavioral analysis system („Behavioral
Spectrometer”), Brodkin et al. detected dramatic changes in behavior of stressed
mice. There were large increases in grooming of all body parts (i.e., paw, face, head,
cheek, leg, back, and genitals) accompanied by a moderate increase in scratching. By
contrast, restraint produced dramatic decreases in locomotion (walk and run) and a mild
decrease in the orienting behaviors of sniff and survey [111]. Unfortunately, TSE
Phenomaster, used in our studies, detects the sum of XYZ activities and can’t differentiate
between distinct behavior elements. Nevertheless, it has been previously revealed that
restraint and other psychogenic stressors increase grooming behavior shortly after stress
[112] and therefore it is likely that early increases in activity seen in our acutely restrained
mice might be due to grooming or rearing [113]. By contrast, activity following acute
restraint stress, was significantly decreased in the dark phase of circadian rhythm. This,
delayed and sustained reduction of locomotor activity has been reported in previous
studies [106, 111, 114].
Reduced activity following stress may serve to replenish depleted energy stores. This
is supported by increased food intake seen in the fourth hour post stress, two hours after
the peak of energy expenditure. Stress-eating is a well-known behavior and conserved
across species. Both humans and laboratory rodents have been shown to increase their
food intake following stress or negative emotions [115, 116]. Furthermore, stressed
organisms prefer comfort (high fat, high sugar) food [117]. Stress-induced

75
glucocorticoids are key factors for responding to reduced energy stores. They increase
food intake and alter food choice [118].
Corticotropin-releasing hormone, CRH plays an important role in food choice and
activity. Expression of this neuropeptide rapidly increases after stress not only in the
hypothalamic paraventricular nucleus but in other brain regions involved in stress
regulation [108]. CRH and other members of it’s family of neuropeptides (urocortin
1,2,3) have significant anorexigenic and thermogenic activities [119]. Furthermore,
centrally administered CRH increases physical locomotor activity. Eavens et al.,
demonstrated that CRH increases locomotor activity independently of pituitary hormone
secretion, since CRH induced locomotor activity was seen in hypophysectomised
following intracerebroventricular (icv) administration of in dose dependent manner rats
[120]. Coincident data was revealed by Lowry et al. reporting that CRF antagonist α-
helical CRF9–41 (ahCRF) reduced stress induced locomotor activity in dose dependent
manner [121].
To identify if CRH neurons in the hypothalamic paraventricular nucleus are involved
in stress-related metabolic and activity responses, we have used a chemogenetic
approach. Using CRH-IRES-Cre mice (on the same C57BL6 background as in metabolic
experiments), we have challenged CRHPVN neurons and recorded metabolic parameters
and physical activity. Previous studies from our laboratory confirmed that selective
activation of CRHPVN neurons results in plasma CORT elevation similar to that seen in
response to acute stress. Hormonal assessment also indicated that the effect of neuronal
activation following chemogenetic activation lasts longer (up to 4-5h) than an acute
stress, however the peak CORT levels are comparable. Chemogenetic activation of
CRHPVN neurons recapitulates some, but not all metabolic markers seen after acute
restraint. Energy expenditure is increased during the first 4 hours after CNO injection,
similar to that seen in restrained mice, however the second peak in the next day light
phase was not detected. Food intake was the other marker that showed similarities
between acutely stressed animals and following chemogenetic activation of CRHPVN
cells. In both cases, cumulative food intake was increased. There were differences,
however, in the timing. Following acute restraint stress, food intake gradually increased
post-stress and became significant by the fourth hour, while it was promptly elevated after
CNO injection and remained on a plato in chemogenetically chellenged mice. Neither
restraint, nor chemogenetic activation of CRHPVN neurons affected respiratory exchange
ratios.

76
We could not detect over changes in locomotor activity following CNO administration
to CRH-IRES-Cre mice with pAAV-hSyn-DIO-hM3D(Gq)-mCherry injection into the
PVN. These results underscore the importance of relevant control experiments and
highlight the drawback of CNO as an activator of DREADD receptors. When
CRH_IRES-Cre mice were injected with control virus construct into the PVN, we
detected decreased locomotor activity following CNO injection. Recent pharmacokinetic
analysis demonstrated CNO reverse-metabolization to its parent compound clozapine in
mice and rats, yielding plasma concentrations that may be sufficient to occupy inter alia
dopamine D2/3 and serotonin 5HT2A receptors in the brain. Clozapine is an antipsychotic
drug, which is widely used for schizophrenia treatment. The drug is an effective agonist
at GABAB receptor and the GABAB receptor deficient mice exhibit altered locomotor
behaviour [122, 123]. For these reasons, the authors of the pharmacological study of CNO
propose the use of appropriate control groups and appropriate DREADD activating drug
with which we can avoid its side effects [124].
It is very likely, that the CNO counteracts with the effects of CRHPVN on locomotion.
Indeed, optogenetic silencing of CRHPVN neurons resulted in reduced physical activity,
grooming and rearing following foot shock stress indicating a stimulatory role of CRHPVN
neurons in regulation of physical activity [125].
It should also be noted, that we could not detect over changes of EE and RER values
after CNO injected control animals, although clozapine has metabolic side effects [126].
5.2. Metabolic changes after chronic stress and during recovery
Acute stress response is a short term adaptation process to environmental stimuli. This
short term adaptation could even be beneficial and increase resilience. However,
continuous stress load may result in both physical and emotional health problems over
time. During chronic stress, the permanently increased glucocorticoid level keeps the
blood glucose level high, as we have confirmed in the two-hits protocol, and these effects
are associated with elevated insulin level leading to insulin resistance and diabetes
mellitus [127]. Fat mobilizing effects of glucocorticoids and catecholamines are also
dominant in chronic stress, that result elevated TG level and thus trigger the risk of
hypertriglyceridemia, NAFLD or atherosclerosis [64].
In our experiment, increased food intake was detected in chronically stressed mice,
during the dark (active) phase of the circadian rhythm. CVS leads to dysregulated HPA

77
axis and it consequently influences energy intake and homeostasis. Chronic stress can
impact on multiple appetite-related hormones and neuropeptids [128]. Release of
hypothalamic CRF suppresses food intake [129, 130], in contrast, glucocorticoids
stimulate appetite [131] and induce preference for consumption of palatable food [132].
However, the permanent elevated glucocorticoids suppress CRH release from PVN and
vasopressin becomes the main regulator of ACTH secretion during chronic stress [133].
Previous study indicated altered locomotor activity in mice, which were exposed to
social defeat stress for 10 days [134]. Locomotion was decreased during chronic stress
and it remained reduced for two days after stress. By contrast, increased locomotor
activity was detected in our study after CVS, however it was induced significantly only
during the resting phase. Similar to our study, Hiroshi Ito et al revealed hyper-locomotion
activity after 7 days of chronic restraint stress. These changes associated with increased
synaptic plasticity in the anterior cingulate cortex (ACC) by induced excitability because
of the disruption of the inhibitory effect of GABAA receptor signaling pathway [135].
Another study compared the effect of chronic restraint and variable stress on locomotor
behavior. Only chronic restraint stress altered locomotion, whereas chronic variable stress
has no effect [136]. To conclude, these results confirm the assumption that chronic stress
induced locomotor behavior changes probably highly influenced by the period and the
severity of chronic stress. In addition, there is might be one concrete explanation to this
result, which underlines the increased locomotion during resting state. Previous studies
indicated, glucocorticoid administration increases wakefulness and induces reduction of
REM sleep [137, 138].
The permanent presence of stressful stimuli during chronic stress is accompanied with
continuous homeostatic adaptation, which demands energy. These processes constantly
activate the sympathetic nerve system and HPA axis, thus, catabolic pathways are
activated predominantly through the effects of glucocorticoids and catecholamines [139].
In addition, UCP1 expression is stimulated by the sympathetic nervous system in brown
adipose tissue and thus, stress induces hyperthermia [140]. All these changes
consequently lead to increased energy expenditure. Therefore, not surprisingly, elevated
energy expenditure of the stressed mice was detected after CVS.
Respiratory exchange ratio was also higher in the stressed mice, which suggest that
carbohydrate utilization was rather preferred to support energy expenditure. Besides the
carbohydrate utilization, interestingly, higher lean and lower fat mass were measured by
MRI. Lean is equivalent with the muscle tissue mass, that was higher probably because

78
of the increased locomotor activity. A possible explanation of the lower fat mass is might
be the glucocorticoid effect on GLUT4 membrane protein. In a previous study, alleviated
level of GLUT4 expression was observed in fat cells but it was induced in skeletal muscle
after administration of dexamethasone or with the concomitant injection of sucrose [141].
Accordingly of this result, GLUT4 could decrease glucose transport into adipocyte and
this effect accompanied with reduced adipose tissue [142]. In contrast, glucose transport
would be increased into the enlarged skeletal muscle tissue and thus the preference for
utilization of carbohydrates would increase.
Next, we have been interested how the metabolic homeostasis recovers after chronic
stress. Although a short recovery period was selected, in a previous study indicated that
2 weeks of visible burrow system (VBS) model of chronic stress increased corticosterone
level, which returned to the control level after one week. Furthermore, the reduced body
weight of subordinate and dominant rats increased continuously during recovery but only
the body weight of dominant mice restored to the control level, whereas the body weight
of the subordinate mice reminds significantly lower even three weeks after VBS
compared to the control group. These changes were associated with increased food intake,
fat and lean mass gain during the three weeks of recovery [143]. Previous studies
indicated other restorable effects in hippocampus. Three weeks of chronic stress induced
impaired spatial working, reference memory and retracted CA3 dendrites were reversible
after 3 weeks of recovery [144]. Lin M. et al indicated restoration of behavioral
impairment and the alteration in the glutamate receptor expression to the normal level
after 35 days of recovery [145]. Within the hippocampus, another important hub of stress
regulation, Gray J. D. and colleagues identified 700 genes differentially expressed in
chronically stressed animals compared to non-stressed controls. 21 days of resting period
hippocampal gene expression was compared again and found an additional 700 genes to
be differently expressed, however only 36 genes overlapped between the stressed and
rested animals [146]. Another study revealed that recovery time of the immune system is
highly dependent from the severity of the stressor. In this study, rats were exposed to
daily restraint stress for 2, 4 and 8 weeks followed by 6 weeks of recovery and the results
showed that the longer exposure time of the stress the higher of the immune system
damage, whereas shorter exposure time shortened the recovery time [147]. In spite of
these results, glucocorticoid levels seems to be independent from the severity of the stress
during recovery. Ottenweller J. E. et al demonstrated that 10, 7, 4 and 3 days footshock
stress did not produced higher corticosterone level in rats compared to each other and the

79
exposure time has no effect on the glucocorticoid level reduction during three days of
recovery [148]. In addition, X. Mengyang and colleagues indicated the reversibility of
the microbial changes after three weeks of recovery, in spite of the restored microbiome,
the difference of the microbial metabolites was more persistent, it was still detectable
three weeks after the end of stress [149]. In our study, the most striking results were the
body composition changes. Beside increased body weight, restored fat and lean mass
level were measured after three days of recovery. In the other metabolic parameters, only
a decreasing tendency was measured, except for the energy expenditure changes during
the active phase, where significant reduction was observed after three days of recovery.
The conclusion of these data, most of the chronic stress induced changes are reversible,
however the reversibility time depends on different parameters like exposure time,
recovery time and severity of stressor, etc.
5.3. Chronic stress effect on colon microbiome and gut
There is a well-documented mutual interaction between the gut microbiome and host
stress response [150, 151]. Chronic stress is an important environmental factor, which
triggers gut dysbiosis and in turn, altered microbiome has an impact on neuroendocrine-
autonomic and behavioral aspects of the stress response. Growing evidence indicates a
link between stress and microbial dysbiosis [150, 152, 153]. Previous studies from
different laboratories revealed distinct stress-induced changes of the gut microbiome
composition depending on the stressor (water avoidance [154, 155] repeated restraint
[156], social defeat/disruption [157-159] and origin of bacterial sampling (fecal [160],
luminal [161] mucosal [162]. General conclusion of these studies is that chronic
psychological stress results in outgrowth of Bacteroidetes and decrease the abundance of
Firmicutes. Here we confirm and extend these observations to show that MS-CVS “two
hits” paradigm is also capable to increase Bacteroidetes and Proteobacteria in chronically
stressed mice, which is accompanied here with an overall decrease of total bacterial DNA
concentration in the colon content.
A number of studies have identified early life adversity as an important factor affecting
gut microbiome [163]. Studies in rats, mice and Rhesus monkeys revealed decrease of
microbial diversity following maternal separation [164] or limited nesting [165]. Here,
we have used the “two hits” model of chronic adversity by combination of early life stress,

80
maternal separation and chronic variable stress paradigm, both of which might have an
impact on gut microbiome.
Among the bacterial species studied here, the copy number of Clostridia increased
significantly as a result of MS-CVS stress paradigm. This finding is in agreement with
those of [157, 166]. Although some Clostridia are pathogenic and are responsible for
diarrhea in the elderly, we did not observe serious diarrhea or watery feces in our stressed
mice.
“Leaky gut” is generally held as a hallmark of chronic stress-related pathologies [167,
168]. In the present MS-CVS model we did not detect stress-induced changes in colonic
expression of tight junction proteins (Occludin, TJP1-3) and muc2. However, we did find
significant decrease of mucosa thickness, signs of epithelial damage. Furthermore,
increased transcellular transport was detected in the gut of chronically stressed mice by
FITC-dextran method, indicating impaired barrier function [169]. The leaky barrier
should allow various feed/microbiome related antigens to initiate local immune
responses. Such an innate immune activation has been revealed by infiltration of F4/80
positive macrophages into the lamina propria of MS-CVS exposed mice, which was
prevented by rifaximin treatment during chronic variable stress. Gut lymphatics are
drained in mesenteric lymph nodes (MLN), where a significant bacterial load has been
revealed in our chronically stressed mice. This finding is compatible with the report by
Velin et al. [170] where 30 times increased E coli passage was detected in chronically
stressed rats, ex vivo. In addition to this local bacterial translocation to MLN, significant
elevation of LPS was detected in the plasma of MS-CVS mice, indicating systemic
endotoxemia.
Another noteworthy finding of this study is the stress-induced colonic upregulation of
Reg3b. Reg3b is a C-type lectin, which belongs to antimicrobial peptide (AMP) family
and involved in gut barrier functions [171]. Further studies are required to clarify if
increased expression of Reg3b mRNA may represent an adaptive compensatory host
mechanism to impaired barrier and increased bacterial burden
Chronic stress exposure is a risk factor for psychiatric disorders, such as anxiety and
depression, subsets of which are accompanied or driven by activated immune system
[172, 173]. Parallel to stress-induced microbiome changes, chronic stress increases gut
permeability and results in a leaky gut, through which bacterial cell wall components
might reach the systemic circulation, trigger toll like receptors and result in low grade

81
systemic inflammation. LPS and related proinflammatory cytokines activate the HPA
axis [174] and promote deterioration of stress-induced anxiety [175].
In search for the causal role of microbiome in the development of stress-related
psychopathologies, Langgartner et al. showed that stress-induced psychobiological
changes can be transmitted by fecal transplantation from stressed to non-stressed mice
[158]. In contrary, our present results suggest that settlement of stress-induced changes
in the gut does not alleviate MS-CVS-induced locomotor hyperactivity, anxiety-like
symptoms in open field and elevated plus maze tests and anhedonia. One explanation for
the resistance of stress-induced behavior to improvement of gut and immune functions
would be the timing of rifaximin treatment. It is likely that behavior needs more time than
gut to recover from CVS. Another possibility would be that early life adversity i.e.
maternal separation results in permanent changes in the gut flora [163] and behavior,
which do not change after antibiotic treatment in the adulthood. Indeed, it has been shown
that early life events result in epigenetic modulation of stress/anxiety-related genes such
as hypomethylation of the Crh promoter in the PVN of maternally deprived adult rats
[176] and reduction in histone H3 acetylation at human/rat glucocorticoid receptor (GR,
NR3C1) promoter in the hippocampus [177].
5.4. Antibiotic effect on gut microbiome
Among the factors, influencing the gut microbiome, antibiotic exposure has profound
and sometimes persisting impact on the bacterial composition, diversity and function of
the intestinal flora [178]. In addition to the use antibiotics for medical reasons, the human
body is unintentionally exposed to antibiotics present in feeds and in the environment.
Animal husbandry use subtherapeutic dose of different antibiotics to increase the growth
rate and feed efficiency, as well as for disease prevention in overcrowded locations
including aquacultures [179-181]. Antibiotics decrease the microbial diversity of the gut
flora, modulate Bacteroidetes/Firmicutes ratio and result in overgrowth of opportunistic
pathogens [182, 183]. For instance, a 7-day treatment with commonly used antibiotic
groups: fluoroquinolones and β-lactams, significantly decreased microbial diversity by
25% and reduced the core phylogenetic microbiota from 29 to 12 taxa [184, 185]. Another
recent study on healthy subjects, found an immediate bloom of Enterobacteria and other
pathobionts along with significant depletion of Bifidobacteria and butyrate-producing
species in response to a meropenem, gentamicin and vancomycin cocktail. Although the
microbiome of the subjects recovered to near-baseline composition within 1.5 months,

82
some common species, which were present in all subjects before the treatment, remained
undetectable after 4 months [186].
There is a general agreement in the literature that, apart from genetic background, PD
is caused by some external effect and the primary change leading to the disease is the
modified gut flora, dysbiosis. Even the suspected toxic agents, like pesticides, operate
through the altered microbiome in the process of developing PD. Considering the fact that
antibiotics are powerful agents influencing the microbiome, it is likely that some
penicillins, as “external factors” initiate gut dysbiosis, which contribute to the
development of PD. Our study compared global antibiotic consumption to the change of
PD prevalence in different European countries in the past 25 years might provide some
clues elucidating the issue [100]. To support our hypothesis, a recent work evaluated the
impact of antibiotic exposure on the risk of PD in a register-based case- control study in
Finland. This study also found significant association between exposure to certain types
of oral antibiotics and increased risk of PD, with a delay that is consistent with the
proposed duration of a prodromal period [187]. Our findings show connection between
high consumption of narrow spectrum penicillin and the highest prevalence change of
PD. Two major mechanisms may underlie the connection between exposure of certain
antibiotics and increased prevalence of PD: First, antibiotics induce gut dysbiosis, a
microbial imbalance, in which certain curly- producing bacteria gain abundance in the
microbiome. Curly, as a functional α-synuclein (αSyn), excreted to the extracellular space
and exaggerates additional amyloid deposition. The αSyn pathology has the ability to
spread from the gastrointestinal tract to the brain and results in loss of vulnerable
dopamine synthesizing neurons in the substantia nigra. Second, these antibiotics may
promote inflammation, via translocation of live gut bacteria and inhibition of anti-
inflammatory, short chain fatty acid (SCFA) (butyrate)-producing bacteria. Systemic
inflammation in general-, and local neuroinflammation (microglia activation), in special-
, contribute to PD pathogenesis.
Rifaximin, which is a non-absorbable antibiotic, specifically targets Clostridia and
other Gram negative and positive bacteria. Therefore, we hypothesized that rifaximin
treatment of mice exposed to MS-CVS will restore microbiome related gut-brain axis and
behavioral changes to normal. Indeed, stress-induced Clostridia were significantly
attenuated by antibiotic treatment. In addition, rifaximin administration prevented stress-
induced increases of Proteobacteria, but not Bacteroidetes. These data confirm previous
findings that rifaximin do not significantly affect the overall composition of the human

83
fecal microbiome [188] and only mild changes are observed in mice [189]. More recently,
rifaximin was recommended for treatment of post-infectious irritable bowel disease (IBS)
and related abdominal discomfort [190, 191]. In search for the mechanism of rifaximin
action, increased expression of gut tight junction proteins emerged [189]. We have
confirmed increased mRNA levels of tight junction proteins occludin, tjp1 and tjp2, but
not tjp3, in colon samples of stressed and non-stressed, rifaximin treated mice. Increased
expression of tight junction proteins along with slightly increased muc2 indicates
improved gut barrier function after rifaximin administration.
Rifaximin administration during CVS prevented the increase of LPS plasma levels,
suggesting that rifaximin effects go beyond anti-pathogenic activity. The endotoxemia
reducing effects of rifaximin has already been shown in chronic liver disease [192];
however, the mechanisms of action and molecular targets remain unknown.
Finally, rifaximin reduced pathogenic bacteria and improved gut barrier, however, did
not enforce the abundance of beneficial “psychobiotic” bacteria. It has been shown that
administration of certain Lactobacilli and Bifidobacteria have anxiolytic/antidepressive
effects [193-195].
Recent studies implicate that antibiotic usage in human and farm animals results in
dysbiosis, provoke systemic inflammation, which might be responsible for long-term
metabolic- (obesity), behavioral- and mental changes. However, we did not detect any
significant behavioral changes in unstressed mice treated with antibiotic for 3 weeks.
Future work should focus on the interaction between systemic antibiotics and stress in
regulation of microbiota-gut-brain axis.
In conclusion, combination of early life adversity with adult chronic variable stress
(CVS) paradigm in mice results in gut dysbiosis and impaired gut barrier function along
with increased locomotor activity, anxiety-like behavior and neophobia. Rifaximin
treatment during CVS decreases stress-induced pathogenic bacteria, restores gut barrier
functions, reduces local and systemic bacterial load, however, does not improve stress-
induced behavioral changes.

84
6. Conclusion
The main conclusion of my dissertation are:
1. Acute psychogenic stress has profound effect on the metabolic parameters, energy
expenditure and food intake as well as on locomotor activity.
2. The hypothalamic paraventruclar nucleus is a part of a neuronal circuit, which
mediates acute stress effects on metabolism and activity.
3. Chronic stress results in lasting changes of body composition and metabolism,
with increased food intake, energy expenditure and respiratory exchange ratio.
These chronic stress-induced alterations recover differently after cessation of the
challenge.
4. Chronic stress results in gut dysbiosis, increased gut permeability and recruitment
of activated macrophages in the colonic mucosa.
5. Rifaximin -a gut specific antibiotic- restores stress-induced changes in gut
microbiome, gut permeability and bacterial load, however these positive changes
in the gut are not accompanied by restoration of normal behavior.
6. Gut dysbiosis following systemic antibiotic treatment might be a risk factor in the
development certain neurodegenerative disorders, such as Parkinson’s disease.

85
7. Summary
Stress is a non-specific adaptation reaction from the body to different environmental
changes. The response triggers various complex mechanisms in which the metabolic
system is also involved. The activation of the HPA axis demand high energy requirement.
Thus, chronic stress, which is a permanent long lasting process, can provoke various
metabolic related maladaptive diseases. In contrast, simple acute stress is rapid response,
which can be even beneficial. In addition, it is well established, chronic stress induces
“leaky gut” syndrome and dysbiosis in the gut microbiome and thus, it further aggravates
the chronic stress induced maladaptive process like neuronal or behavioral impairments.
In this current dissertation, we examined the metabolic changes after the activation of
HPA axis by acute stress or potentiation of CRH neurons in PVN. We also observed the
effect of chronic stress and recovery on metabolic system. In addition, we investigated
antibiotic effect during chronic stress on behavior and colon physiogy; and its correlation
with Parkinson’s disease (PD).
Acute stress has a short-term effect on locomotion and food intake. Whereas, energy
expenditure was affected for a long-term. These changes were accompanied with dropped
body weight and fat mass. The activation of CRHPVN neurons similarly influenced
metabolic system as acute stress, however, there were also differences. Long-term effect
of HPA activation was not seen and the food intake behavior was different in the first
four hours. Chronic stress evoked robust changes in metabolic system and slight alteration
was seen after three days of recovery. Two hits paradigm stress induced dysbiosis in gut
microbiome. In addition, we found extenuation of colonic mucosa, increased bacterial
translocation to mesenteric lymph node, elevation of plasma LPS levels and infiltration
of F4/80 positive macrophages into the colon lamina propria. Chronically stressed mice
displayed anxiety-like behavior and neophobia. Rifaximin treatment decreased
Clostridium concentration, gut permeability and LPS plasma concentration and increased
colonic expression of tight junction proteins (TJP1,TJP2) and occludin. However, these
beneficial effects of rifaximin in chronically stressed mice was not accompanied by
positive changes in behavior. Finally, significant correlation was calculated between
antibiotic consumption and PD prevalence.
These findings emphasized the role of metabolic system after stress and help to
understand the development of different stress induced metabolic related diseases and the
relation between gut microbiome and different neuronal impairments.

86
8. Összefoglalás
A stressz egy adaptációs válasz folyamat, különböző környezeti változások hatására.
A válaszreakció során különböző mechanizmusok indukálódnak, amelyek rengeteg
energiát igényelnek, ezért a metabolikus rendszernek kiemelt szerepe van a stressz során.
A stressz időbeli lefolyása alapján megkülönböztetünk akut és krónikus stresszt. Számos
tanulmány bizonyította már, hogy a folyamatos stressz jelenléte diszbiózist eredményez
a bél mikrobiomban és gerjeszti a bél átjárhatóságát, amely tovább súlyosbítja különböző
maladaptív folyamatok hatását.
Disszertációmban a stressz indukálta metabolikus változásokat vizsgáltuk akut
stressz után illetve, a CRH neuronoknak milyen szerepe van ezekben a változásokban.
Továbbá tanulmányoztuk a metabolikus változásokat krónikus stresszt követően és a
felépülés alatt is. Valamint vizsgáltuk a krónikus stressz során az antibiotikus hatást a
viselkedésre, a vastagbél fiziológiájára és az antibiotikum fogyasztás korrelációját a
Parkinson-kór prevalenciájával (PD).
Az akut stressz a lokomotoros aktivitást a táplálékfelvételt és az energia felhasználást
indukálja. A CRHPVN neuronok aktiválásával hasonló metabolikus változásokat
indukáltunk, mint az akut stressz során. Azonban különbségeket is meg lehetett figyelni.
Az emelkedett energiafelhasználás hosszú távon nem volt megfigyelhető és a
táplálékfelvétel eltérő volt az első négy órában. A krónikus stressznek jelentős hatása volt
a metabolikus rendszerre és a három napos felépülés után enyhe csökkenést lehetett csak
megfigyelni. A két csapás stressz paradigma diszbiozist idézett elő a vastagbél
mikrobiomájában. Ezenk,ívül a vastagbél nyálkahártyája elvékonyodott, megnövekedett
a bakteriálistranszlokáció a mesenteriális nyirokcsomókban, a plazma LPS szintje
szignifikánsan magasabb volt, megnövekedett az F4 / 80 pozitív makrofágok száma a
lamina propria-ban és a krónikus stressz szorongásos viselkedést és neophobiát váltott ki.
Egy nem felszívódó antibiotikum kezelés (rifaximin) hatására helyre tudtuk állítani a
mikrobiom diszbiózist és a krónikus stressz indukálta változásokat a vastagbélben.
Azonban a viselkedésbeli változásokra nem volt hatással.
Ezek az eredmények a metabolikus rendszer stresszben betöltött szerepét emelik ki, és
segítenek megérteni a metabolizmussal kapcsolatos stressz indukálta betegségek
kialakulását, valamint a bél mikrobiom és a különböző neurológiai kórképek közötti
kapcsolatot.

87
9. References
1. Cannon W.B. (1929) ORGANIZATION FOR PHYSIOLOGICAL
HOMEOSTASIS. Physiological Reviews. 9(3): 399-431.
2. Cannon W. (1929) Organization for physiological homeostasis. Physiol Rew. 9:
399-431.
3. Selye H. (1936) A syndrome produced by diverse nocious agents. Nature. 138:
32.
4. Selye H. (1950) Stress and the general adaptation syndrome. British medical
journal. 1(4667): 1383-1392.
5. Selye H. (1946) The general adaptation syndrome and the diseases of adaptation.
J Clin Endocrinol Metab. 6: 117-230.
6. McEwen B.S. (2007) Physiology and neurobiology of stress and adaptation:
central role of the brain. Physiol Rev. 87(3): 873-904.
7. Wong D.L., T.C. Tai, D.C. Wong-Faull, R. Claycomb, E.G. Meloni, K.M. Myers,
W.A. Carlezon, Jr., and R. Kvetnansky. (2012) Epinephrine: a short- and long-
term regulator of stress and development of illness : a potential new role for
epinephrine in stress. Cell Mol Neurobiol. 32(5): 737-748.
8. Tsigos C., I. Kyrou, E. Kassi, and G.P. Chrousos. Endotext. K.R. Feingold, et al.,
South Dartmouth (MA), 2000.
9. Pacak K. and M. Palkovits. (2001) Stressor specificity of central neuroendocrine
responses: implications for stress-related disorders. Endocr Rev. 22(4): 502-548.
10. Herman J.P., H. Figueiredo, N.K. Mueller, Y. Ulrich-Lai, M.M. Ostrander, D.C.
Choi, and W.E. Cullinan. (2003) Central mechanisms of stress integration:
hierarchical circuitry controlling hypothalamo-pituitary-adrenocortical
responsiveness. Front Neuroendocrinol. 24(3): 151-180.
11. Mifsud K.R. and J.M.H.M. Reul. (2016) Acute stress enhances heterodimerization
and binding of corticosteroid receptors at glucocorticoid target genes in the
hippocampus. Proceedings of the National Academy of Sciences of the United
States of America. 113(40): 11336-11341.
12. Gjerstad J.K., S.L. Lightman, and F. Spiga. (2018) Role of glucocorticoid
negative feedback in the regulation of HPA axis pulsatility. Stress. 21(5): 403-
416.
13. Reichlin S. (1967) Function of the hypothalamus. Am J Med. 43(4): 477-485.

88
14. Saper C.B. (2006) Staying awake for dinner: hypothalamic integration of sleep,
feeding, and circadian rhythms. Prog Brain Res. 153: 243-252.
15. Baskin D.G., B.J. Wilcox, D.P. Figlewicz, and D.M. Dorsa. (1988) Insulin and
insulin-like growth factors in the CNS. Trends Neurosci. 11(3): 107-111.
16. Baskin D.G., J.F. Breininger, and M.W. Schwartz. (1999) Leptin receptor mRNA
identifies a subpopulation of neuropeptide Y neurons activated by fasting in rat
hypothalamus. Diabetes. 48(4): 828-833.
17. Zigman J.M., J.E. Jones, C.E. Lee, C.B. Saper, and J.K. Elmquist. (2006)
Expression of ghrelin receptor mRNA in the rat and the mouse brain. J Comp
Neurol. 494(3): 528-548.
18. Ahima R.S. and J.S. Flier. (2000) Leptin. Annu Rev Physiol. 62: 413-437.
19. Considine R.V., M.K. Sinha, M.L. Heiman, A. Kriauciunas, T.W. Stephens, M.R.
Nyce, J.P. Ohannesian, C.C. Marco, L.J. McKee, T.L. Bauer, and et al. (1996)
Serum immunoreactive-leptin concentrations in normal-weight and obese
humans. N Engl J Med. 334(5): 292-295.
20. Hulsey M.G., H. Lu, T. Wang, R.J. Martin, and C.A. Baile. (1998)
Intracerebroventricular (i.c.v.) administration of mouse leptin in rats: behavioral
specificity and effects on meal patterns. Physiol Behav. 65(3): 445-455.
21. Elias C.F., J.F. Kelly, C.E. Lee, R.S. Ahima, D.J. Drucker, C.B. Saper, and J.K.
Elmquist. (2000) Chemical characterization of leptin-activated neurons in the rat
brain. J Comp Neurol. 423(2): 261-281.
22. Gautron L., M. Lazarus, M.M. Scott, C.B. Saper, and J.K. Elmquist. (2010)
Identifying the efferent projections of leptin-responsive neurons in the
dorsomedial hypothalamus using a novel conditional tracing approach. J Comp
Neurol. 518(11): 2090-2108.
23. Myers M.G., Jr., H. Munzberg, G.M. Leinninger, and R.L. Leshan. (2009) The
geometry of leptin action in the brain: more complicated than a simple ARC. Cell
Metab. 9(2): 117-123.
24. Fulton S., B. Woodside, and P. Shizgal. (2000) Modulation of brain reward
circuitry by leptin. Science. 287(5450): 125-128.
25. Szczypka M.S., M.A. Rainey, D.S. Kim, W.A. Alaynick, B.T. Marck, A.M.
Matsumoto, and R.D. Palmiter. (1999) Feeding behavior in dopamine-deficient
mice. Proc Natl Acad Sci U S A. 96(21): 12138-12143.

89
26. Fulton S., P. Pissios, R.P. Manchon, L. Stiles, L. Frank, E.N. Pothos, E. Maratos-
Flier, and J.S. Flier. (2006) Leptin regulation of the mesoaccumbens dopamine
pathway. Neuron. 51(6): 811-822.
27. Huo L., L. Maeng, C. Bjorbaek, and H.J. Grill. (2007) Leptin and the control of
food intake: neurons in the nucleus of the solitary tract are activated by both
gastric distension and leptin. Endocrinology. 148(5): 2189-2197.
28. Roder P.V., B. Wu, Y. Liu, and W. Han. (2016) Pancreatic regulation of glucose
homeostasis. Exp Mol Med. 48: e219.
29. Baura G.D., D.M. Foster, D. Porte, Jr., S.E. Kahn, R.N. Bergman, C. Cobelli, and
M.W. Schwartz. (1993) Saturable transport of insulin from plasma into the central
nervous system of dogs in vivo. A mechanism for regulated insulin delivery to the
brain. J Clin Invest. 92(4): 1824-1830.
30. Benoit S.C., E.L. Air, L.M. Coolen, R. Strauss, A. Jackman, D.J. Clegg, R.J.
Seeley, and S.C. Woods. (2002) The catabolic action of insulin in the brain is
mediated by melanocortins. J Neurosci. 22(20): 9048-9052.
31. Figlewicz D.P. and S.C. Benoit. (2009) Insulin, leptin, and food reward: update
2008. Am J Physiol Regul Integr Comp Physiol. 296(1): R9-R19.
32. McNay E.C., C.T. Ong, R.J. McCrimmon, J. Cresswell, J.S. Bogan, and R.S.
Sherwin. (2010) Hippocampal memory processes are modulated by insulin and
high-fat-induced insulin resistance. Neurobiol Learn Mem. 93(4): 546-553.
33. Figlewicz D.P., A.J. Sipols, R.J. Seeley, M. Chavez, S.C. Woods, and D. Porte,
Jr. (1995) Intraventricular insulin enhances the meal-suppressive efficacy of
intraventricular cholecystokinin octapeptide in the baboon. Behav Neurosci.
109(3): 567-569.
34. Bagdade J.D., E.L. Bierman, and D. Porte, Jr. (1967) The significance of basal
insulin levels in the evaluation of the insulin response to glucose in diabetic and
nondiabetic subjects. J Clin Invest. 46(10): 1549-1557.
35. Werther G.A., A. Hogg, B.J. Oldfield, M.J. McKinley, R. Figdor, A.M. Allen, and
F.A. Mendelsohn. (1987) Localization and characterization of insulin receptors in
rat brain and pituitary gland using in vitro autoradiography and computerized
densitometry. Endocrinology. 121(4): 1562-1570.
36. Williams K.W., L.O. Margatho, C.E. Lee, M. Choi, S. Lee, M.M. Scott, C.F.
Elias, and J.K. Elmquist. (2010) Segregation of acute leptin and insulin effects in

90
distinct populations of arcuate proopiomelanocortin neurons. J Neurosci. 30(7):
2472-2479.
37. Castaneda T.R., J. Tong, R. Datta, M. Culler, and M.H. Tschop. (2010) Ghrelin
in the regulation of body weight and metabolism. Front Neuroendocrinol. 31(1):
44-60.
38. Brubaker P.L. and Y. Anini. (2003) Direct and indirect mechanisms regulating
secretion of glucagon-like peptide-1 and glucagon-like peptide-2. Can J Physiol
Pharmacol. 81(11): 1005-1012.
39. Ueno H., H. Yamaguchi, M. Mizuta, and M. Nakazato. (2008) The role of PYY
in feeding regulation. Regul Pept. 145(1-3): 12-16.
40. Turton M.D., D. O'Shea, I. Gunn, S.A. Beak, C.M. Edwards, K. Meeran, S.J.
Choi, G.M. Taylor, M.M. Heath, P.D. Lambert, J.P. Wilding, D.M. Smith, M.A.
Ghatei, J. Herbert, and S.R. Bloom. (1996) A role for glucagon-like peptide-1 in
the central regulation of feeding. Nature. 379(6560): 69-72.
41. Cummings D.E. and J. Overduin. (2007) Gastrointestinal regulation of food
intake. J Clin Invest. 117(1): 13-23.
42. Meister B. (2007) Neurotransmitters in key neurons of the hypothalamus that
regulate feeding behavior and body weight. Physiol Behav. 92(1-2): 263-271.
43. Stanley B.G., S.E. Kyrkouli, S. Lampert, and S.F. Leibowitz. (1986)
Neuropeptide Y chronically injected into the hypothalamus: a powerful
neurochemical inducer of hyperphagia and obesity. Peptides. 7(6): 1189-1192.
44. Billington C.J., J.E. Briggs, M. Grace, and A.S. Levine. (1991) Effects of
intracerebroventricular injection of neuropeptide Y on energy metabolism. Am J
Physiol. 260(2 Pt 2): R321-327.
45. Erickson J.C., K.E. Clegg, and R.D. Palmiter. (1996) Sensitivity to leptin and
susceptibility to seizures of mice lacking neuropeptide Y. Nature. 381(6581): 415-
421.
46. Guyon A., G. Conductier, C. Rovere, A. Enfissi, and J.L. Nahon. (2009) Melanin-
concentrating hormone producing neurons: Activities and modulations. Peptides.
30(11): 2031-2039.
47. Tsujino N. and T. Sakurai. (2009) Orexin/hypocretin: a neuropeptide at the
interface of sleep, energy homeostasis, and reward system. Pharmacol Rev. 61(2):
162-176.

91
48. Dietrich M.O. and T.L. Horvath. (2009) Feeding signals and brain circuitry. Eur
J Neurosci. 30(9): 1688-1696.
49. Millington G.W. (2007) The role of proopiomelanocortin (POMC) neurones in
feeding behaviour. Nutr Metab (Lond). 4: 18.
50. Magni P., E. Dozio, M. Ruscica, F. Celotti, M.A. Masini, P. Prato, M. Broccoli,
A. Mambro, M. More, and F. Strollo. (2009) Feeding behavior in mammals
including humans. Ann N Y Acad Sci. 1163: 221-232.
51. Rogge G., D. Jones, G.W. Hubert, Y. Lin, and M.J. Kuhar. (2008) CART peptides:
regulators of body weight, reward and other functions. Nat Rev Neurosci. 9(10):
747-758.
52. Millington G.W.M. (2007) The role of proopiomelanocortin (POMC) neurones in
feeding behaviour. Nutrition & Metabolism. 4.
53. Lechan R.M. and C. Fekete. (2006) The TRH neuron: a hypothalamic integrator
of energy metabolism. Prog Brain Res. 153: 209-235.
54. Wittmann G., T. Fuzesi, P.S. Singru, Z. Liposits, R.M. Lechan, and C. Fekete.
(2009) Efferent projections of thyrotropin-releasing hormone-synthesizing
neurons residing in the anterior parvocellular subdivision of the hypothalamic
paraventricular nucleus. J Comp Neurol. 515(3): 313-330.
55. King B.M. (2006) The rise, fall, and resurrection of the ventromedial
hypothalamus in the regulation of feeding behavior and body weight. Physiol
Behav. 87(2): 221-244.
56. Wang C., E. Bomberg, C. Billington, A. Levine, and C.M. Kotz. (2007) Brain-
derived neurotrophic factor in the hypothalamic paraventricular nucleus reduces
energy intake. Am J Physiol Regul Integr Comp Physiol. 293(3): R1003-1012.
57. Lizarbe B. and S. Cerdan. (2013) Neuroglial metabolic compartmentation during
hypothalamic activation. Journal of Neurochemistry. 125: 88-88.
58. Moriya T., R. Aida, T. Kudo, M. Akiyama, M. Doi, N. Hayasaka, N. Nakahata,
R. Mistlberger, H. Okamura, and S. Shibata. (2009) The dorsomedial
hypothalamic nucleus is not necessary for food-anticipatory circadian rhythms of
behavior, temperature or clock gene expression in mice. European Journal of
Neuroscience. 29(7): 1447-1460.
59. Gooley J.J., A. Schomer, and C.B. Saper. (2006) The dorsomedial hypothalamic
nucleus is critical for the expression of food- entrainable circadian rhythms.
Nature Neuroscience. 9(3): 398-407.

92
60. Vardanyan R. H.V. (Chapter 11 - Adrenergic (Sympathomimetic) Drugs) in
Synthesis of Best-Seller Drugs, H.V. Vardanyan R., Editor. Academic press. p.
189-199.
61. de Kloet E.R., M. Joels, and F. Holsboer. (2005) Stress and the brain: from
adaptation to disease. Nat Rev Neurosci. 6(6): 463-475.
62. Barthel A. and D. Schmoll. (2003) Novel concepts in insulin regulation of hepatic
gluconeogenesis. Am J Physiol Endocrinol Metab. 285(4): E685-692.
63. van Donkelaar E.L., K.R. Vaessen, J.L. Pawluski, A.S. Sierksma, A. Blokland, R.
Canete, and H.W. Steinbusch. (2014) Long-term corticosterone exposure
decreases insulin sensitivity and induces depressive-like behaviour in the
C57BL/6NCrl mouse. PLoS One. 9(10): e106960.
64. Han Y., M. Lin, X. Wang, K. Guo, S. Wang, M. Sun, J. Wang, X. Han, T. Fu, Y.
Hu, and J. Fu. (2015) Basis of aggravated hepatic lipid metabolism by chronic
stress in high-fat diet-fed rat. Endocrine. 48(2): 483-492.
65. Heinrichs S.C., F. Menzaghi, E.M. Pich, R.L. Hauger, and G.F. Koob. (1993)
Corticotropin-Releasing Factor in the Paraventricular Nucleus Modulates Feeding
Induced by Neuropeptide-Y. Brain Research. 611(1): 18-24.
66. Palkovits M. (2003) Hypothalamic regulation of food intake. Ideggyogy Sz. 56(9-
10): 288-302.
67. Greenwood-Van Meerveld B., A.C. Johnson, and D. Grundy. (2017)
Gastrointestinal Physiology and Function. Handb Exp Pharmacol. 239: 1-16.
68. Konturek P.C., T. Brzozowski, and S.J. Konturek. (2011) Stress and the gut:
pathophysiology, clinical consequences, diagnostic approach and treatment
options. J Physiol Pharmacol. 62(6): 591-599.
69. Sherwin E., K.V. Sandhu, T.G. Dinan, and J.F. Cryan. (2016) May the Force Be
With You: The Light and Dark Sides of the Microbiota-Gut-Brain Axis in
Neuropsychiatry. Cns Drugs. 30(11): 1019-1041.
70. Rajilic-Stojanovic M. and W.M. de Vos. (2014) The first 1000 cultured species
of the human gastrointestinal microbiota. FEMS Microbiol Rev. 38(5): 996-1047.
71. Lloyd-Price J., G. Abu-Ali, and C. Huttenhower. (2016) The healthy human
microbiome. Genome Med. 8(1): 51.
72. Prakash S., L. Rodes, M. Coussa-Charley, and C. Tomaro-Duchesneau. (2011)
Gut microbiota: next frontier in understanding human health and development of
biotherapeutics. Biologics. 5: 71-86.

93
73. Cresci G.A. and E. Bawden. (2015) Gut Microbiome. Nutrition in Clinical
Practice. 30(6): 734-746.
74. Borre Y.E., G.W. O'Keeffe, G. Clarke, C. Stanton, T.G. Dinan, and J.F. Cryan.
(2014) Microbiota and neurodevelopmental windows: implications for brain
disorders. Trends Mol Med. 20(9): 509-518.
75. Wang Y. and L.H. Kasper. (2014) The role of microbiome in central nervous
system disorders. Brain Behav Immun. 38: 1-12.
76. Forsythe P., N. Sudo, T. Dinan, V.H. Taylor, and J. Bienenstock. (2010) Mood
and gut feelings. Brain Behav Immun. 24(1): 9-16.
77. De Vadder F., P. Kovatcheva-Datchary, D. Goncalves, J. Vinera, C. Zitoun, A.
Duchampt, F. Backhed, and G. Mithieux. (2014) Microbiota-generated
metabolites promote metabolic benefits via gut-brain neural circuits. Cell. 156(1-
2): 84-96.
78. Breton J., N. Tennoune, N. Lucas, M. Francois, R. Legrand, J. Jacquemot, A.
Goichon, C. Guerin, J. Peltier, M. Pestel-Caron, P. Chan, D. Vaudry, J.C. do
Rego, F. Lienard, L. Penicaud, X. Fioramonti, I.S. Ebenezer, T. Hokfelt, P.
Dechelotte, and S.O. Fetissov. (2016) Gut Commensal E. coli Proteins Activate
Host Satiety Pathways following Nutrient-Induced Bacterial Growth. Cell Metab.
23(2): 324-334.
79. Ridaura V.K., J.J. Faith, F.E. Rey, J. Cheng, A.E. Duncan, A.L. Kau, N.W.
Griffin, V. Lombard, B. Henrissat, J.R. Bain, M.J. Muehlbauer, O. Ilkayeva, C.F.
Semenkovich, K. Funai, D.K. Hayashi, B.J. Lyle, M.C. Martini, L.K. Ursell, J.C.
Clemente, W. Van Treuren, W.A. Walters, R. Knight, C.B. Newgard, A.C. Heath,
and J.I. Gordon. (2013) Gut microbiota from twins discordant for obesity
modulate metabolism in mice. Science. 341(6150): 1241214.
80. Wen L., R.E. Ley, P.Y. Volchkov, P.B. Stranges, L. Avanesyan, A.C.
Stonebraker, C. Hu, F.S. Wong, G.L. Szot, J.A. Bluestone, J.I. Gordon, and A.V.
Chervonsky. (2008) Innate immunity and intestinal microbiota in the development
of Type 1 diabetes. Nature. 455(7216): 1109-1113.
81. Collins S.M., M. Surette, and P. Bercik. (2012) The interplay between the
intestinal microbiota and the brain. Nature Reviews Microbiology. 10(11): 735-
742.
82. Vich Vila A., F. Imhann, V. Collij, S.A. Jankipersadsing, T. Gurry, Z. Mujagic,
A. Kurilshikov, M.J. Bonder, X. Jiang, E.F. Tigchelaar, J. Dekens, V. Peters, M.D.

94
Voskuil, M.C. Visschedijk, H.M. van Dullemen, D. Keszthelyi, M.A. Swertz, L.
Franke, R. Alberts, E.A.M. Festen, G. Dijkstra, A.A.M. Masclee, M.H. Hofker,
R.J. Xavier, E.J. Alm, J. Fu, C. Wijmenga, D. Jonkers, A. Zhernakova, and R.K.
Weersma. (2018) Gut microbiota composition and functional changes in
inflammatory bowel disease and irritable bowel syndrome. Sci Transl Med.
10(472).
83. O'Mahony S.M., G. Clarke, Y.E. Borre, T.G. Dinan, and J.F. Cryan. (2015)
Serotonin, tryptophan metabolism and the brain-gut-microbiome axis. Behav
Brain Res. 277: 32-48.
84. Aguilar-Toala J.E., R. Garcia-Varela, H.S. Garcia, V. Mata-Haro, A.F. Gonzalez-
Cordova, B. Vallejo-Cordoba, and A. Hernandez-Mendoza. (2018) Postbiotics:
An evolving term within the functional foods field. Trends in Food Science &
Technology. 75: 105-114.
85. Borody T.J. and A. Khoruts. (2012) Fecal microbiota transplantation and
emerging applications. Nature Reviews Gastroenterology & Hepatology. 9(2):
88-96.
86. van Nood E., A. Vrieze, M. Nieuwdorp, S. Fuentes, E.G. Zoetendal, W.M. de
Vos, C.E. Visser, E.J. Kuijper, J.F.W.M. Bartelsman, J.G.P. Tijssen, P. Speelman,
M.G.W. Dijkgraaf, and J.J. Keller. (2013) Duodenal Infusion of Donor Feces for
Recurrent Clostridium difficile. New England Journal of Medicine. 368(5): 407-
415.
87. Fuchsl A.M., I.D. Neumann, and S.O. Reber. (2014) Stress resilience: a low-
anxiety genotype protects male mice from the consequences of chronic
psychosocial stress. Endocrinology. 155(1): 117-126.
88. Prescott L.M., J.M. Willey, L. Sherwood, and C.J. Woolverton, Prescott's
microbiology. McGraw-Hill Education. 2014.
89. Duncko R., M. Schwendt, and D. Jezova. (2003) Altered glutamate receptor and
corticoliberin gene expression in brain regions related to hedonic behavior in rats.
Pharmacol Biochem Behav. 76(1): 9-16.
90. Zelena D., Z. Mergl, A. Foldes, K.J. Kovacs, Z. Toth, and G.B. Makara. (2003)
Role of hypothalamic inputs in maintaining pituitary-adrenal responsiveness in
repeated restraint. Am J Physiol Endocrinol Metab. 285(5): E1110-1117.
91. Andersen C.L., J.L. Jensen, and T.F. Orntoft. (2004) Normalization of real-time
quantitative reverse transcription-PCR data: a model-based variance estimation

95
approach to identify genes suited for normalization, applied to bladder and colon
cancer data sets. Cancer Res. 64(15): 5245-5250.
92. Bacchetti De Gregoris T., N. Aldred, A.S. Clare, and J.G. Burgess. (2011)
Improvement of phylum- and class-specific primers for real-time PCR
quantification of bacterial taxa. J Microbiol Methods. 86(3): 351-356.
93. Guo X., X. Xia, R. Tang, J. Zhou, H. Zhao, and K. Wang. (2008) Development of
a real-time PCR method for Firmicutes and Bacteroidetes in faeces and its
application to quantify intestinal population of obese and lean pigs. Lett Appl
Microbiol. 47(5): 367-373.
94. Mirhosseini S.Z., A. Seidavi, M. Shivazad, M. Chamani, A.A. Sadeghi, and R.
Pourseify. (2010) Detection of Clostridium sp and its Relation to Different Ages
and Gastrointestinal Segments as Measured by Molecular Analysis of 16S rRNA
Genes. Brazilian Archives of Biology and Technology. 53(1): 69-76.
95. Oh K.H., D.H. Jeong, S.H. Shin, and Y.C. Cho. (2012) Simultaneous
Quantification of Cyanobacteria and Microcystis spp. Using Real-Time PCR.
Journal of Microbiology and Biotechnology. 22(2): 248-255.
96. Larmonier C.B., D. Laubitz, F.M. Hill, K.W. Shehab, L. Lipinski, M.T. Midura-
Kiela, R.M.T. McFadden, R. Ramalingam, K.A. Hassan, M. Golebiewski, D.G.
Besselsen, F.K. Ghishan, and P.R. Kiela. (2013) Reduced colonic microbial
diversity is associated with colitis in NHE3-deficient mice. American Journal of
Physiology-Gastrointestinal and Liver Physiology. 305(10): G667-G677.
97. Dewar M.L., J.P. Arnould, L. Krause, P. Dann, and S.C. Smith. (2014)
Interspecific variations in the faecal microbiota of Procellariiform seabirds. FEMS
Microbiol Ecol. 89(1): 47-55.
98. Ranjan K., F.S. Paula, R.C. Mueller, C. Jesus Eda, K. Cenciani, B.J. Bohannan,
K. Nusslein, and J.L. Rodrigues. (2015) Forest-to-pasture conversion increases
the diversity of the phylum Verrucomicrobia in Amazon rainforest soils. Front
Microbiol. 6: 779.
99. Nadkarni M.A., F.E. Martin, N.A. Jacques, and N. Hunter. (2002) Determination
of bacterial load by real-time PCR using a broad-range (universal) probe and
primers set. Microbiology-Sgm. 148: 257-266.
100. Collaborators G.B.D.P.s.D. (2018) Global, regional, and national burden of
Parkinson's disease, 1990-2016: a systematic analysis for the Global Burden of
Disease Study 2016. Lancet Neurol. 17(11): 939-953.

96
101. Winkler Z., D. Kuti, S. Ferenczi, K. Gulyas, A. Polyak, and K.J. Kovacs. (2017)
Impaired microglia fractalkine signaling affects stress reaction and coping style
in mice. Behav Brain Res. 334: 119-128.
102. Kuti D., Z. Winkler, K. Horvath, B. Juhasz, M. Paholcsek, A. Stagel, G. Gulyas,
L. Czegledi, S. Ferenczi, and K.J. Kovacs. (2020) Gastrointestinal (non-systemic)
antibiotic rifaximin differentially affects chronic stress-induced changes in colon
microbiome and gut permeability without effect on behavior. Brain Behav
Immun. 84: 218-228.
103. Ternak G., D. Kuti, and K.J. Kovacs. (2020) Dysbiosis in Parkinson's disease
might be triggered by certain antibiotics. Medical Hypotheses. 137.
104. Kadar A., E. Sanchez, G. Wittmann, P.S. Singru, T. Fuzesi, A. Marsili, P.R.
Larsen, Z. Liposits, R.M. Lechan, and C. Fekete. (2010) Distribution of
hypophysiotropic thyrotropin-releasing hormone (TRH)-synthesizing neurons in
the hypothalamic paraventricular nucleus of the mouse. J Comp Neurol. 518(19):
3948-3961.
105. Lew P.S., D. Wong, T. Yamaguchi, A. Leckstrom, J. Schwartz, J.G. Dodd, and
T.M. Mizuno. (2009) Tail suspension increases energy expenditure independently
of the melanocortin system in mice. Can J Physiol Pharmacol. 87(10): 839-849.
106. Spiers J.G., H.C. Chen, F.J. Steyn, N.A. Lavidis, T.M. Woodruff, and J.D. Lee.
(2017) Noninvasive assessment of altered activity following restraint in mice
using an automated physiological monitoring system. Stress. 20(1): 59-67.
107. Sherwin R.S. and L. Sacca. (1984) Effect of epinephrine on glucose metabolism
in humans: contribution of the liver. Am J Physiol. 247(2 Pt 1): E157-165.
108. Sharara-Chami R.I., M. Joachim, M. Mulcahey, S. Ebert, and J.A. Majzoub.
(2010) Effect of epinephrine deficiency on cold tolerance and on brown adipose
tissue. Mol Cell Endocrinol. 328(1-2): 34-39.
109. McMahon M., J. Gerich, and R. Rizza. (1988) Effects of glucocorticoids on
carbohydrate metabolism. Diabetes Metab Rev. 4(1): 17-30.
110. Peckett A.J., D.C. Wright, and M.C. Riddell. (2011) The effects of glucocorticoids
on adipose tissue lipid metabolism. Metabolism. 60(11): 1500-1510.
111. Brodkin J., D. Frank, R. Grippo, M. Hausfater, M. Gulinello, N. Achterholt, and
C. Gutzen. (2014) Validation and implementation of a novel high-throughput
behavioral phenotyping instrument for mice. Journal of neuroscience methods.
224: 48-57.

97
112. Dunn A.J. and A.H. Swiergiel. (1999) Behavioral responses to stress are intact in
CRF-deficient mice. Brain Research. 845(1): 14-20.
113. Kalueff A.V., A.M. Stewart, C. Song, K.C. Berridge, A.M. Graybiel, and J.C.
Fentress. (2016) Neurobiology of rodent self-grooming and its value for
translational neuroscience. Nature reviews. Neuroscience. 17(1): 45-59.
114. Pertsov S.S., I.V. Alekseeva, E.V. Koplik, N.E. Sharanova, N.V. Kirbaeva, and
M.M. Gapparov. (2014) Dynamics of locomotor activity and heat production in
rats after acute stress. Bull Exp Biol Med. 157(1): 10-14.
115. Greeno C.G. and R.R. Wing. (1994) Stress-induced eating. Psychol Bull. 115(3):
444-464.
116. Tomiyama A.J., I. Schamarek, R.H. Lustig, C. Kirschbaum, E. Puterman, P.J.
Havel, and E.S. Epel. (2012) Leptin concentrations in response to acute stress
predict subsequent intake of comfort foods. Physiology & behavior. 107(1): 34-
39.
117. Dallman M.F., N.C. Pecoraro, and S.E. la Fleur. (2005) Chronic stress and
comfort foods: self-medication and abdominal obesity. Brain Behav Immun.
19(4): 275-280.
118. Dallman M.F., S.E. la Fleur, N.C. Pecoraro, F. Gomez, H. Houshyar, and S.F.
Akana. (2004) Minireview: Glucocorticoids—Food Intake, Abdominal Obesity,
and Wealthy Nations in 2004. Endocrinology. 145(6): 2633-2638.
119. Richard D., Q. Huang, and E. Timofeeva. (2000) The corticotropin-releasing
hormone system in the regulation of energy balance in obesity. Int J Obes Relat
Metab Disord. 24 Suppl 2: S36-39.
120. Eaves M., K. Thatcherbritton, J. Rivier, W. Vale, and G.F. Koob. (1985) Effects
of Corticotropin Releasing-Factor on Locomotor-Activity in Hypophysectomized
Rats. Peptides. 6(5): 923-926.
121. Lowry C.A. and F.L. Moore. (1991) Corticotropin-releasing factor (CRF)
antagonist suppresses stress-induced locomotor activity in an amphibian. Horm
Behav. 25(1): 84-96.
122. Wu Y., M. Blichowski, Z.J. Daskalakis, Z. Wu, C.C. Liu, M.A. Cortez, and O.C.
Snead, 3rd. (2011) Evidence that clozapine directly interacts on the GABAB
receptor. Neuroreport. 22(13): 637-641.
123. Vacher C.M., M. Gassmann, S. Desrayaud, E. Challet, A. Bradaia, D. Hoyer, P.
Waldmeier, K. Kaupmann, P. Pevet, and B. Bettler. (2006) Hyperdopaminergia

98
and altered locomotor activity in GABAB1-deficient mice. J Neurochem. 97(4):
979-991.
124. Manvich D.F., K.A. Webster, S.L. Foster, M.S. Farrell, J.C. Ritchie, J.H. Porter,
and D. Weinshenker. (2018) The DREADD agonist clozapine N-oxide (CNO) is
reverse-metabolized to clozapine and produces clozapine-like interoceptive
stimulus effects in rats and mice. Sci Rep. 8(1): 3840.
125. Füzesi T., N. Daviu, J.I. Wamsteeker Cusulin, R.P. Bonin, and J.S. Bains. (2016)
Hypothalamic CRH neurons orchestrate complex behaviours after stress. Nature
communications. 7: 11937-11937.
126. Yuan H.-Y., H.-X. Liang, G.-R. Liang, G.-X. Zhang, and H.-D. Li. (2008) Effects
of clozapine administration on body weight, glucose tolerance, blood glucose
concentrations, plasma lipids, and insulin in male C57BL/6 mice: A parallel
controlled study. Current therapeutic research, clinical and experimental. 69(2):
142-149.
127. Joseph J.J. and S.H. Golden. (2017) Cortisol dysregulation: the bidirectional link
between stress, depression, and type 2 diabetes mellitus. Annals of the New York
Academy of Sciences. 1391(1): 20-34.
128. Adam T.C. and E.S. Epel. (2007) Stress, eating and the reward system. Physiol
Behav. 91(4): 449-458.
129. Benoit S.C., T.E. Thiele, S.C. Heinrichs, P.A. Rushing, K.A. Blake, and R.J.
Steeley. (2000) Comparison of central administration of corticotropin-releasing
hormone and urocortin on food intake, conditioned taste aversion, and c-Fos
expression. Peptides. 21(3): 345-351.
130. Heinrichs S.C., F. Menzaghi, E.M. Pich, R.L. Hauger, and G.F. Koob. (1993)
Corticotropin-releasing factor in the paraventricular nucleus modulates feeding
induced by neuropeptide Y. Brain Res. 611(1): 18-24.
131. Shimizu H., H. Arima, M. Watanabe, M. Goto, R. Banno, I. Sato, N. Ozaki, H.
Nagasaki, and Y. Oiso. (2008) Glucocorticoids increase neuropeptide Y and
agouti-related peptide gene expression via adenosine monophosphate-activated
protein kinase signaling in the arcuate nucleus of rats. Endocrinology. 149(9):
4544-4553.
132. Warne J.P. (2009) Shaping the stress response: interplay of palatable food choices,
glucocorticoids, insulin and abdominal obesity. Mol Cell Endocrinol. 300(1-2):
137-146.

99
133. Aubry J.M., V. Bartanusz, D. Jezova, D. Belin, and J.Z. Kiss. (1999) Single stress
induces long-lasting elevations in vasopressin mRNA levels in CRF
hypophysiotrophic neurones, but repeated stress is required to modify AVP
immunoreactivity. J Neuroendocrinol. 11(5): 377-384.
134. Ota S.M., D. Suchecki, and P. Meerlo. (2018) Chronic social defeat stress
suppresses locomotor activity but does not affect the free-running circadian period
of the activity rhythm in mice. Neurobiol Sleep Circadian Rhythms. 5: 1-7.
135. Ito H., M. Nagano, H. Suzuki, and T. Murakoshi. (2010) Chronic stress enhances
synaptic plasticity due to disinhibition in the anterior cingulate cortex and induces
hyper-locomotion in mice. Neuropharmacology. 58(4-5): 746-757.
136. Marin M.T., F.C. Cruz, and C.S. Planeta. (2007) Chronic restraint or variable
stresses differently affect the behavior, corticosterone secretion and body weight
in rats. Physiol Behav. 90(1): 29-35.
137. Bradbury M.J., W.C. Dement, and D.M. Edgar. (1998) Effects of adrenalectomy
and subsequent corticosterone replacement on rat sleep state and EEG power
spectra. Am J Physiol. 275(2): R555-565.
138. Vazquez-Palacios G. and J. Velazquez-Moctezuma. (2000) Effect of electric foot
shocks, immobilization, and corticosterone administration on the sleep-wake
pattern in the rat. Physiol Behav. 71(1-2): 23-28.
139. McEwen B.S. Stress: Concepts, Cognition, Emotion, and Behavior. G. Fink,
Academic Press, San Diego, 2016: 39-55.
140. Cassard-Doulcier A.M., C. Gelly, N. Fox, J. Schrementi, S. Raimbault, S. Klaus,
C. Forest, F. Bouillaud, and D. Ricquier. (1993) Tissue-specific and beta-
adrenergic regulation of the mitochondrial uncoupling protein gene: control by
cis-acting elements in the 5'-flanking region. Mol Endocrinol. 7(4): 497-506.
141. Coderre L., G.A. Vallega, P.F. Pilch, and S.R. Chipkin. (1996) In vivo effects of
dexamethasone and sucrose on glucose transport (GLUT-4) protein tissue
distribution. Am J Physiol. 271(4 Pt 1): E643-648.
142. Katz E.B., A.E. Stenbit, K. Hatton, R. DePinho, and M.J. Charron. (1995) Cardiac
and adipose tissue abnormalities but not diabetes in mice deficient in GLUT4.
Nature. 377(6545): 151-155.
143. Melhorn S.J., E.G. Krause, K.A. Scott, M.R. Mooney, J.D. Johnson, S.C. Woods,
and R.R. Sakai. (2010) Meal patterns and hypothalamic NPY expression during

100
chronic social stress and recovery. Am J Physiol Regul Integr Comp Physiol.
299(3): R813-822.
144. Hoffman A.N., A. Krigbaum, J.B. Ortiz, A. Mika, K.M. Hutchinson, H.A.
Bimonte-Nelson, and C.D. Conrad. (2011) Recovery after chronic stress within
spatial reference and working memory domains: correspondence with
hippocampal morphology. Eur J Neurosci. 34(6): 1023-1030.
145. Lin M., G. Hou, Y. Zhao, and T.F. Yuan. (2018) Recovery of Chronic Stress-
Triggered Changes of Hippocampal Glutamatergic Transmission. Neural Plast.
2018: 9360203.
146. Gray J.D., T.G. Rubin, R.G. Hunter, and B.S. McEwen. (2014) Hippocampal gene
expression changes underlying stress sensitization and recovery. Mol Psychiatry.
19(11): 1171-1178.
147. Sarjan H.N. and H.N. Yajurvedi. (2018) Chronic stress induced duration
dependent alterations in immune system and their reversibility in rats. Immunol
Lett. 197: 31-43.
148. Ottenweller J.E., R.J. Servatius, W.N. Tapp, S.D. Drastal, M.T. Bergen, and B.H.
Natelson. (1992) A chronic stress state in rats: effects of repeated stress on basal
corticosterone and behavior. Physiol Behav. 51(4): 689-698.
149. Xu M., C. Wang, K.N. Krolick, H. Shi, and J. Zhu. (2020) Difference in post-
stress recovery of the gut microbiome and its altered metabolism after chronic
adolescent stress in rats. Sci Rep. 10(1): 3950.
150. Cryan J.F. and T.G. Dinan. (2012) Mind-altering microorganisms: the impact of
the gut microbiota on brain and behaviour. Nat Rev Neurosci. 13(10): 701-712.
151. Foster J.A., L. Rinaman, and J.F. Cryan. (2017) Stress & the gut-brain axis:
Regulation by the microbiome. Neurobiol Stress. 7: 124-136.
152. De Palma G., S.M. Collins, P. Bercik, and E.F. Verdu. (2014) The microbiota-
gut-brain axis in gastrointestinal disorders: stressed bugs, stressed brain or both?
J Physiol. 592(14): 2989-2997.
153. Watanabe Y., S. Arase, N. Nagaoka, M. Kawai, and S. Matsumoto. (2016)
Chronic Psychological Stress Disrupted the Composition of the Murine Colonic
Microbiota and Accelerated a Murine Model of Inflammatory Bowel Disease.
PLoS One. 11(3): e0150559.
154. Xu D., J. Gao, M. Gillilland, 3rd, X. Wu, I. Song, J.Y. Kao, and C. Owyang.
(2014) Rifaximin alters intestinal bacteria and prevents stress-induced gut

101
inflammation and visceral hyperalgesia in rats. Gastroenterology. 146(2): 484-
496.e484.
155. Yoshikawa K., C. Kurihara, H. Furuhashi, T. Takajo, K. Maruta, Y. Yasutake, H.
Sato, K. Narimatsu, Y. Okada, M. Higashiyama, C. Watanabe, S. Komoto, K.
Tomita, S. Nagao, S. Miura, H. Tajiri, and R. Hokari. (2017) Psychological stress
exacerbates NSAID-induced small bowel injury by inducing changes in intestinal
microbiota and permeability via glucocorticoid receptor signaling. J
Gastroenterol. 52(1): 61-71.
156. Maltz R.M., J. Keirsey, S.C. Kim, A.R. Mackos, R.Z. Gharaibeh, C.C. Moore, J.
Xu, V. Bakthavatchalu, A. Somogyi, and M.T. Bailey. (2018) Prolonged restraint
stressor exposure in outbred CD-1 mice impacts microbiota, colonic
inflammation, and short chain fatty acids. PLoS One. 13(5): e0196961.
157. Bailey M.T., S.E. Dowd, J.D. Galley, A.R. Hufnagle, R.G. Allen, and M. Lyte.
(2011) Exposure to a social stressor alters the structure of the intestinal
microbiota: implications for stressor-induced immunomodulation. Brain Behav
Immun. 25(3): 397-407.
158. Langgartner D., C.A. Vaihinger, M. Haffner-Luntzer, J.F. Kunze, A.J. Weiss, S.
Foertsch, S. Bergdolt, A. Ignatius, and S.O. Reber. (2018) The Role of the
Intestinal Microbiome in Chronic Psychosocial Stress-Induced Pathologies in
Male Mice. Front Behav Neurosci. 12: 252.
159. Werbner M., Y. Barsheshet, N. Werbner, M. Zigdon, I. Averbuch, O. Ziv, B.
Brant, E. Elliot, S. Gelberg, M. Titelbaum, O. Koren, and O. Avni. (2019) Social-
Stress-Responsive Microbiota Induces Stimulation of Self-Reactive Effector T
Helper Cells. mSystems. 4(4).
160. Gautam A., R. Kumar, N. Chakraborty, S. Muhie, A. Hoke, R. Hammamieh, and
M. Jett. (2018) Altered fecal microbiota composition in all male aggressor-
exposed rodent model simulating features of post-traumatic stress disorder. J
Neurosci Res. 96(7): 1311-1323.
161. Szyszkowicz J.K., A. Wong, H. Anisman, Z. Merali, and M.C. Audet. (2017)
Implications of the gut microbiota in vulnerability to the social avoidance effects
of chronic social defeat in male mice. Brain Behav Immun. 66: 45-55.
162. Galley J.D., Z. Yu, P. Kumar, S.E. Dowd, M. Lyte, and M.T. Bailey. (2014) The
structures of the colonic mucosa-associated and luminal microbial communities

102
are distinct and differentially affected by a prolonged murine stressor. Gut
Microbes. 5(6): 748-760.
163. Rincel M., P. Aubert, J. Chevalier, P.A. Grohard, L. Basso, C. Monchaux de
Oliveira, J.C. Helbling, E. Levy, G. Chevalier, M. Leboyer, G. Eberl, S. Laye, L.
Capuron, N. Vergnolle, M. Neunlist, H. Boudin, P. Lepage, and M. Darnaudery.
(2019) Multi-hit early life adversity affects gut microbiota, brain and behavior in
a sex-dependent manner. Brain Behav Immun. 80: 179-192.
164. Bailey M.T. and C.L. Coe. (1999) Maternal separation disrupts the integrity of the
intestinal microflora in infant rhesus monkeys. Dev Psychobiol. 35(2): 146-155.
165. Moussaoui N., M. Larauche, M. Biraud, J. Molet, M. Million, E. Mayer, and Y.
Tache. (2016) Limited Nesting Stress Alters Maternal Behavior and In Vivo
Intestinal Permeability in Male Wistar Pup Rats. PLoS One. 11(5): e0155037.
166. Pearson-Leary J., C. Zhao, K. Bittinger, D. Eacret, S. Luz, A.S. Vigderman, G.
Dayanim, and S. Bhatnagar. (2019) The gut microbiome regulates the increases
in depressive-type behaviors and in inflammatory processes in the ventral
hippocampus of stress vulnerable rats. Mol Psychiatry.
167. Camilleri M. (2019) Leaky gut: mechanisms, measurement and clinical
implications in humans. Gut. 68(8): 1516-1526.
168. Maes M., F. Coucke, and J.C. Leunis. (2007) Normalization of the increased
translocation of endotoxin from gram negative enterobacteria (leaky gut) is
accompanied by a remission of chronic fatigue syndrome. Neuro Endocrinol Lett.
28(6): 739-744.
169. Fukui H. (2016) Endotoxin and other microbial translocation markers in the
blood: a clue to understand leaky gut syndrome. Cell. Mol. Med. 2(3:24): 1-14.
170. Velin A.K., A.C. Ericson, Y. Braaf, C. Wallon, and J.D. Soderholm. (2004)
Increased antigen and bacterial uptake in follicle associated epithelium induced
by chronic psychological stress in rats. Gut. 53(4): 494-500.
171. Shin J.H. and R.J. Seeley. (2019) Reg3 Proteins as Gut Hormones?
Endocrinology. 160(6): 1506-1514.
172. Slattery D.A., N. Uschold, M. Magoni, J. Bar, M. Popoli, I.D. Neumann, and S.O.
Reber. (2012) Behavioural consequences of two chronic psychosocial stress
paradigms: anxiety without depression. Psychoneuroendocrinology. 37(5): 702-
714.

103
173. Renault J. and A. Aubert. (2006) Immunity and emotions: lipopolysaccharide
increases defensive behaviours and potentiates despair in mice. Brain Behav
Immun. 20(6): 517-526.
174. Turnbull A.V., S. Lee, and C. Rivier. (1998) Mechanisms of hypothalamic-
pituitary-adrenal axis stimulation by immune signals in the adult rat. Ann N Y
Acad Sci. 840: 434-443.
175. Anisman H., L. Kokkinidis, and Z. Merali. (2002) Further evidence for the
depressive effects of cytokines: Anhedonia and neurochemical changes. Brain,
Behavior, and Immunity. 16(5): 544-556.
176. Chen J., A.N. Evans, Y. Liu, M. Honda, J.M. Saavedra, and G. Aguilera. (2012)
Maternal deprivation in rats is associated with corticotrophin-releasing hormone
(CRH) promoter hypomethylation and enhances CRH transcriptional responses to
stress in adulthood. Journal of neuroendocrinology. 24(7): 1055-1064.
177. Suderman M., P.O. McGowan, A. Sasaki, T.C. Huang, M.T. Hallett, M.J.
Meaney, G. Turecki, and M. Szyf. (2012) Conserved epigenetic sensitivity to
early life experience in the rat and human hippocampus. Proc Natl Acad Sci U S
A. 109 Suppl 2: 17266-17272.
178. Francino M.P. (2015) Antibiotics and the Human Gut Microbiome: Dysbioses and
Accumulation of Resistances. Front Microbiol. 6: 1543.
179. Singh P., A. Karimi, K. Devendra, P.W. Waldroup, K.K. Cho, and Y.M. Kwon.
(2013) Influence of penicillin on microbial diversity of the cecal microbiota in
broiler chickens. Poult Sci. 92(1): 272-276.
180. Yu M., C. Mu, C. Zhang, Y. Yang, Y. Su, and W. Zhu. (2018) Marked Response
in Microbial Community and Metabolism in the Ileum and Cecum of Suckling
Piglets After Early Antibiotics Exposure. Front Microbiol. 9: 1166.
181. Dobrzanska D.A., M.T.F. Lamaudiere, J. Rollason, L. Acton, M. Duncan, S.
Compton, J. Simms, G.D. Weedall, and I.Y. Morozov. (2020) Preventive
antibiotic treatment of calves: emergence of dysbiosis causing propagation of
obese state-associated and mobile multidrug resistance-carrying bacteria. Microb
Biotechnol. 13(3): 669-682.
182. Dudek-Wicher R.K., A. Junka, and M. Bartoszewicz. (2018) The influence of
antibiotics and dietary components on gut microbiota. Prz Gastroenterol. 13(2):
85-92.

104
183. Zarrinpar A., A. Chaix, Z.Z. Xu, M.W. Chang, C.A. Marotz, A. Saghatelian, R.
Knight, and S. Panda. (2018) Antibiotic-induced microbiome depletion alters
metabolic homeostasis by affecting gut signaling and colonic metabolism. Nat
Commun. 9(1): 2872.
184. Panda S., I. El khader, F. Casellas, J. Lopez Vivancos, M. Garcia Cors, A.
Santiago, S. Cuenca, F. Guarner, and C. Manichanh. (2014) Short-term effect of
antibiotics on human gut microbiota. PLoS One. 9(4): e95476.
185. Jernberg C., S. Lofmark, C. Edlund, and J.K. Jansson. (2010) Long-term impacts
of antibiotic exposure on the human intestinal microbiota. Microbiology. 156(Pt
11): 3216-3223.
186. Palleja A., K.H. Mikkelsen, S.K. Forslund, A. Kashani, K.H. Allin, T. Nielsen,
T.H. Hansen, S. Liang, Q. Feng, C. Zhang, P.T. Pyl, L.P. Coelho, H. Yang, J.
Wang, A. Typas, M.F. Nielsen, H.B. Nielsen, P. Bork, J. Wang, T. Vilsboll, T.
Hansen, F.K. Knop, M. Arumugam, and O. Pedersen. (2018) Recovery of gut
microbiota of healthy adults following antibiotic exposure. Nat Microbiol. 3(11):
1255-1265.
187. Mertsalmi T.H., E. Pekkonen, and F. Scheperjans. (2020) Antibiotic exposure and
risk of Parkinson's disease in Finland: A nationwide case-control study. Mov
Disord. 35(3): 431-442.
188. Soldi S., S. Vasileiadis, F. Uggeri, M. Campanale, L. Morelli, M.V. Fogli, F.
Calanni, M. Grimaldi, and A. Gasbarrini. (2015) Modulation of the gut microbiota
composition by rifaximin in non-constipated irritable bowel syndrome patients: a
molecular approach. Clin Exp Gastroenterol. 8: 309-325.
189. Jin Y., X. Ren, G. Li, Y. Li, L. Zhang, H. Wang, W. Qian, and X. Hou. (2018)
Beneficial effects of Rifaximin in post-infectious irritable bowel syndrome mouse
model beyond gut microbiota. J Gastroenterol Hepatol. 33(2): 443-452.
190. Acosta A., M. Camilleri, A. Shin, S. Linker Nord, J. O'Neill, A.V. Gray, A.J.
Lueke, L.J. Donato, D.D. Burton, L.A. Szarka, A.R. Zinsmeister, P.L. Golden,
and A. Fodor. (2016) Effects of Rifaximin on Transit, Permeability, Fecal
Microbiome, and Organic Acid Excretion in Irritable Bowel Syndrome. Clin
Transl Gastroenterol. 7: e173.
191. Ponziani F.R., F. Scaldaferri, V. Petito, F. Paroni Sterbini, S. Pecere, L.R.
Lopetuso, A. Palladini, V. Gerardi, L. Masucci, M. Pompili, G. Cammarota, M.

105
Sanguinetti, and A. Gasbarrini. (2016) The Role of Antibiotics in Gut Microbiota
Modulation: The Eubiotic Effects of Rifaximin. Dig Dis. 34(3): 269-278.
192. Bajaj J.S., D.M. Heuman, A.J. Sanyal, P.B. Hylemon, R.K. Sterling, R.T. Stravitz,
M. Fuchs, J.M. Ridlon, K. Daita, P. Monteith, N.A. Noble, M.B. White, A. Fisher,
M. Sikaroodi, H. Rangwala, and P.M. Gillevet. (2013) Modulation of the
metabiome by rifaximin in patients with cirrhosis and minimal hepatic
encephalopathy. PLoS One. 8(4): e60042.
193. Borre Y.E., R.D. Moloney, G. Clarke, T.G. Dinan, and J.F. Cryan. (2014) The
impact of microbiota on brain and behavior: mechanisms & therapeutic potential.
Adv Exp Med Biol. 817: 373-403.
194. Bravo J.A., P. Forsythe, M.V. Chew, E. Escaravage, H.M. Savignac, T.G. Dinan,
J. Bienenstock, and J.F. Cryan. (2011) Ingestion of Lactobacillus strain regulates
emotional behavior and central GABA receptor expression in a mouse via the
vagus nerve. Proc Natl Acad Sci U S A. 108(38): 16050-16055.
195. Dinan T.G., C. Stanton, and J.F. Cryan. (2013) Psychobiotics: a novel class of
psychotropic. Biol Psychiatry. 74(10): 720-726.

106
10. Publication of the author
Publications that form the basis of the Ph.D. dissertation:
Kuti D; Winkler Z; Horvath K; Juhasz B; Paholcsek M; Stagel A; Gulyas G; Czegledi L;
Ferenczi S; Kovacs K.J.
Gastrointestinal (Non-systemic) Antibiotic Rifaximin Differentially Affects Chronic
Stress-induced Changes in Colon Microbiome and Gut Permeability without Effect on
Behavior. BRAIN BEHAVIOR AND IMMUNITY 84 pp. 218-228., 11 p. (2020)
IF: 6,17
Ternak G; Kuti D; Kovacs KJ.
Dysbiosis in Parkinson’s Disease might be Triggered by Certain Antibiotics.
MEDICAL HYPOTHESES 137 Paper: 109564, 5 p. (2020)
IF: 1,322
Winkler Z; Kuti D; Ferenczi S; Gulyas K; Polyak A; Kovacs KJ
Impaired microglia fractalkine signaling affects stress reaction and coping style in mice.
BEHAVIOURAL BRAIN RESEARCH 334 pp. 119-128., 10 p. (2017)
IF: 3,173
Other Publications:
Vas V; Hahner T; Kudlik G; Ernszt D; Kvell K; Kuti D; Kovacs KJ; Tovari J; Trexler M;
Mero BL
Analysis of Tks4 Knockout Mice Suggests a Role for Tks4 in Adipose Tissue
Homeostasis in the Context of Beigeing.
CELLS 8 : 8 Paper: 831 , 20 p. (2019)
IF: 5,656

107
Winkler Z; Kuti D; Polyak A; Juhasz B; Gulyas K; Lenart N; Denes A; Ferenczi S;
Kovacs KJ Hypoglycemia-activated Hypothalamic Microglia Impairs Glucose
Counterregulatory Responses.
SCIENTIFIC REPORTS 9:1 Paper: 6224, 14 p. (2019) 3.
IF: 4,011
Polyak A; Winkler Z; Kuti D; Ferenczi S; Kovacs KJ
Brown adipose tissue in obesity: Fractalkine-receptor dependent immune cell recruitment
affects metabolic-related gene expression.
BIOCHIMICA ET BIOPHYSICA ACTA-MOLECULAR AND CELL BIOLOGY OF
LIPIDS 1861:11 pp. 1614-1622., 9 p. (2016)
IF: 5,547
Kriszt R; Winkler Z; Polyak A; Kuti D; Molnar C; Hrabovszky E; Kallo I; Szoke Z;
Ferenczi S; Kovacs KJ
Xenoestrogens Ethinyl Estradiol and Zearalenone Cause Precocious Puberty in Female
Rats via Central Kisspeptin Signaling.
ENDOCRINOLOGY 156 : 11 pp. 3996-4007., 12 p. (2015)
IF: 4,159

108
11. Acknowledgement
First and foremost, I am very grateful to my supervisor Krisztina Kovács for applied
me and hiring in her research group. I have learned a lot over the years under her hands.
Therefore, I would like to thank to guiding and supporting me, and that she promoted my
scientific progress.
I am thankful to my all the past and present colleagues of the Laboratory of Molecular
Neuroendocrinology: Szilamér Ferenczi, Winkler Zsuzsanna, Polyák Ágnes, Krisztina
Horváth, Dóra Kővári, and Juhász Balázs, for their help. I am very pleased for all co-
workers to assist in my work and help to extend my technical background, particularly to
Levente Czeglédi, Gabriella Gulyás, Csaba Fekete, Anett Stiftné Szilvásy-Szabó, Dóra
Zelena, Virág Vass and Gábor Ternák. Last, but not least, I would like to express my
thanks to my family and friends for their support and encouragement during my studies
and the preparation of my PhD dissertation. Finally, thanks to God for helping me along
the way.