
Stress Concentration Produced by Holes and Notchescybra.p.lodz.pl/Content/6368/APM_56_10.pdf ·...
9
APM-56-11 Stress Concentration Produced by Holes and Notches By A. M. WAHL1 and R. BEEUWKES, Jr.,2 EAST PITTSBURGH, PA. The problem of stress-concentration effects, produced by holes and notches in bars under tension is, of interest to machine designers. The present paper describes photo- elastic tests and strain measurements to determine these effects more accurately than has been done heretofore, a more accurate extrapolation method being employed in connection with fringe photographs. Stress-concentra- tion factors thus determined were, in general, higher than those obtained by previous investigators. In cases where mathematical calculations were available, the tests checked these. Empirical equations for use in calculation are also given. B ECAUSE of the importance in machine design of tension members having holes, notches, or other discontinuities, the problem of the stress-concentration effects produced by them is of practical interest. This is especially true where fatigue conditions are involved, since as is well known in such cases the en- durance strength is markedly lowered by such “stress raisers” even though the ma- terial be quite ductile. The problem has there- fore been receiving con- siderable attention in recent years.3 Such fundamental cases as those repre- sented in Fig. 1 are of importance in connec- tion with fatigue tests on grooved specimens or specimens having holes. A review of the literature, however, F ig . 1 B ars U nder T ension 1 Westinghouse Research Laboratories, East Pittsburgh, Pa. Mem. A.S.M.E. Dr. Wahl received his education at Grinnell College and Iowa State College, being graduated from the mechanical engineering course of the latter in 1925. He then entered the employ of the Westinghouse Electric & Manufacturing Company as a graduate student. In 1927 he received his M.S. and in 1932 his Ph.D. degrees from the University of Pittsburgh. Since 1926 he has been engaged at the Research Laboratories of the Company on problems of applied mechanics, particularly in the field of stress analysis. He was the recipient of the 1929 A.S.M.E. Junior Award. 2 Westinghouse Research Laboratories, East Pittsburgh. Mr. Beeuwkes was graduated from the University of Washington in elec- trical engineering in 1930 and then took the mechanical design school course of the Westinghouse Electric & Manufacturing Company. He has since been working on questions of applied mechanics and the creep of metals in the Research Laboratories. 3 “Stress-Concentration Phenomena in Fatigue of Metals,” by R. E. Peterson, A.S.M.E. Trans., 1933, APM-55-19. “Die Kerbe,” by F. Laszlo, Zeit. V.D.I., June 16, 1928, p. 851. "Die Kerbwirkung,” by A. Wewerka, Maschinenbau, vol. 8, p. 33. Contributed by the Applied Mechanics Division and presented at the Annual Meeting, New York, N. Y., December 4 to 8, 1933, of T he A merican S ociety of M echanical E ngineers . failed to reveal accurate data on theoretical stress concentration factors for the complete range of variation of the ratio of the diameter, d, of the hole or notch to the width, w, of the bar, or d/w. An analytical solution for the case shown in Pig. 1(a) for values of the ratio d/w less than 0.5 was obtained by Howland4 but no accurate experiments were cited to confirm the results of the calculations. A very rough agreement was obtained with some tests made by Coker6 who also tested both cases of Fig. 1 F ig . 2 S hapes of S pecimen T ested using celluloid specimens. However, as Coker himself states, at the edge of the hole or notch where the maximum stress occurs the accuracy of his tests was not great. This was due to the fact 4 “On the Stresses in the Neighborhood of a Circular Hole in a Strip Under Tension,” by R. C. J. Howland, Phil. Trans. Royal Soc. of London, A 229 (1929), p. 49. 6 “The Effects of Holes and Semi-Circular Notches on the Distribu - tion of Stress in Tension Members,” by E. G. Coker, Proc. Phys. Soc., 1912-1913, p. 95. “Photoelastic and Strain Measurements of the Effects of Circular Holes on the Distribution of Stress in Tension Members,” by E. G. Coker, K. C. Chakko, and Y. Satake, Proc. Instn. of Engrs. and Shipbuilders in Scotland, 1919-1920, p. 34. “Stress Distributions in Notched Beams and Their Application,” by E. G. Coker and G. P. Coleman, Trans. Instn. Naval Arch., 72 (1930), p. 141. “Stress Concentrations Due to Notches and Like Discontinuities,” by E. G. Coker and P. Heymans, Annual Rept. Brit. Assn. Advance- ment of Science, 1921, p. 291. N ote : Statements and opinions advanced in papers are to be understood as individual expressions of their authors, and not those of the Society. 617
Transcript of Stress Concentration Produced by Holes and Notchescybra.p.lodz.pl/Content/6368/APM_56_10.pdf ·...

APM -56-11
Stress C oncentration P roduced by Holes and N otches
By A. M. WAHL1 a n d R. BEEUWKES, J r . , 2 EAST PITTSBURGH, PA.
The problem o f stress-con cen tration effects, produced by holes and n otch es in bars under ten sio n is, o f in terest to m ach ine designers. T he present paper describes p h o to elastic tests and strain m easu rem en ts to determ in e th ese effects m ore accurately th a n has been done heretofore, a m ore accurate extrapolation m eth od being em ployed in conn ection w ith fringe photographs. S tress-concentra- tion factors th u s determ ined were, in general, h igher th a n those obtained by previous investigators. In cases where m ath em atica l ca lcu lation s were available, th e tests checked th ese. Em pirical eq u ation s for use in ca lcu lation are also given.
BECAUSE of the importance in machine design of tension members having holes, notches, or other discontinuities, the problem of the stress-concentration effects produced by them is of practical interest. This is especially true where fatigue
conditions are involved, since as is well known in such cases the endurance strength is markedly lowered by such “stress raisers” even though the material be quite ductile. The problem has therefore been receiving considerable attention in recent years.3
Such fundamental cases as those represented in Fig. 1 are of importance in connection with fatigue tests on grooved specimens or specimens having holes. A review of the literature, h o w e v e r,F i g . 1 B a r s U n d e r T e n s i o n
1 W estinghouse Research Laboratories, E as t P ittsb u rgh , Pa. Mem. A .S.M .E. Dr. W ahl received his education a t Grinnell College and Iowa S ta te College, being g raduated from the m echanical engineering course of the la tte r in 1925. H e then entered th e employ of th e W estinghouse E lectric & M anufacturing C om pany as a graduate student. In 1927 he received his M.S. and in 1932 his Ph.D . degrees from the U niversity of P ittsbu rgh . Since 1926 he has been engaged a t th e Research Laboratories of th e C om pany on problems of applied mechanics, particularly in th e field of stress analysis. He was the recipient of the 1929 A .S.M .E. Jun ior Award.
2 W estinghouse Research Laboratories, E as t P ittsbu rgh . Mr. Beeuwkes was graduated from th e U niversity of W ashington in electrical engineering in 1930 and then took th e m echanical design school course of the W estinghouse E lectric & M anufacturing Com pany. He has since been working on questions of applied m echanics and the creep of m etals in the Research Laboratories.
3 “Stress-C oncentration Phenom ena in Fatigue of M etals,” by R. E. Peterson, A.S.M .E. T rans., 1933, APM-55-19.
“ Die K erbe,” by F. Laszlo, Zeit. V .D .I., June 16, 1928, p . 851."D ie K erbw irkung,” by A. W ewerka, Maschinenbau, vol. 8, p. 33.C ontributed by th e Applied Mechanics Division and presented a t
the Annual M eeting, New York, N. Y., Decem ber 4 to 8, 1933, of T h e A m e r ic a n S o c i e t y o f M e c h a n i c a l E n g i n e e r s .
failed to reveal accurate data on theoretical stress concentration factors for the complete range of variation of the ratio of the diameter, d, of the hole or notch to the width, w, of the bar, or d /w . An analytical solution for the case shown in Pig. 1(a) for values of the ratio d /w less than 0.5 was obtained by Howland4 but no accurate experiments were cited to confirm the results of the calculations. A very rough agreement was obtained with some tests made by Coker6 who also tested both cases of Fig. 1
F i g . 2 S h a p e s o f S p e c i m e n T e s t e d
using celluloid specimens. However, as Coker himself states, a t the edge of the hole or notch where the maximum stress occurs the accuracy of his tests was not great. This was due to the fact
4 “On th e Stresses in th e Neighborhood of a C ircular Hole in a S trip U nder T ension,” by R. C. J . Howland, Phil. T rans. Royal Soc. of London, A 229 (1929), p. 49.
6 “T he Effects of Holes and Sem i-Circular N otches on th e D istribution of Stress in Tension M em bers,” by E . G. Coker, Proc. Phys. Soc., 1912-1913, p. 95.
“ Photoelastic and S tra in M easurem ents of th e Effects of C ircular Holes on th e D istribu tion of Stress in Tension M em bers,” by E. G. Coker, K. C. C hakko, and Y. Satake, Proc. In stn . of Engrs. and Shipbuilders in Scotland, 1919-1920, p. 34.
“Stress D istributions in N otched Beam s and T heir A pplication,” by E . G. Coker and G. P . Coleman, T rans. In stn . N aval Arch., 72 (1930), p . 141.
“Stress C oncentrations D ue to N otches and Like D iscontinuities,” by E . G. Coker and P. H eym ans, A nnual R ep t. B rit. Assn. Advancem en t of Science, 1921, p. 291.
N o t e : S tatem ents and opinions advanced in papers are to be understood as individual expressions of th e ir authors, and not those of th e Society.
617
618 TRANSACTIONS OF TH E AMERICAN SOCIETY OF MECHANICAL ENGINEERS
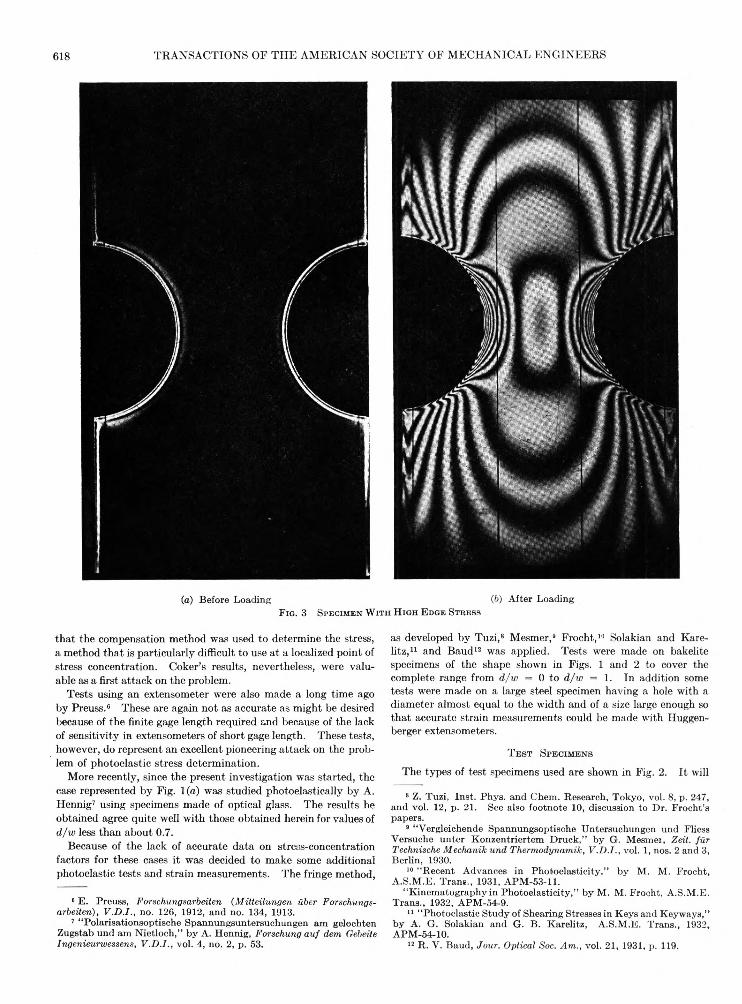
(a) Before Loading (b) A fter LoadingF i g . 3 S p e c i m e n W i t h H i g h E d g e S t r e s s
tha t the compensation method was used to determine the stress, a method tha t is particularly difficult to use at a localized point of stress concentration. Coker’s results, nevertheless, were valuable as a first attack on the problem.
Tests using an extensometer were also made a long time ago by Preuss.6 These are again not as accurate as might be desired because of the finite gage length required and because of the lack of sensitivity in extensometers of short gage length. These tests, however, do represent an excellent pioneering attack on the problem of photoelastic stress determination.
More recently, since the present investigation was started, the case represented by Fig. 1 (a) was studied photoelastically by A. Hennig7 using specimens made of optical glass. The results he obtained agree quite well with those obtained herein for values of d / w less than about 0.7.
Because of the lack of accurate data on stress-concentration factors for these cases it was decided to make some additional photoelastic tests and strain measurements. The fringe method,
6 E . Preuss, Forschungsarbeiten (M itteilungen ilber Forschungs- arbeiten), V .D .I., no. 126, 1912, and no. 134, 1913.
7 “ Polarisationsoptische Spannungsuntersuehungen am gelochtenZugstab und am N ietloch,” b y A. Hennig, Forschung a u f dem GebeiteIngenieurwessens, V .D .I., vol. 4, no. 2, p. 53.
as developed by Tuzi,8 Mesmer,9 Frocht,10 Solakian and Kare- litz,11 and Baud12 was applied. Tests were made on bakelite specimens of the shape shown in Figs. 1 and 2 to cover the complete range from d/ w = 0 to d / w = 1. In addition some tests were made on a large steel specimen having a hole with a diameter almost equal to the width and of a size large enough so tha t accurate strain measurements could be made with Huggen- berger extensometers.
T e s t S p e c i m e n s The types of test specimens used are shown in Fig. 2. I t will8 Z. Tuzi, In st. Phys. and Chem. Research, Tokyo, vol. 8, p. 247,
and vol. 12, p. 21. See also footnote 10, discussion to Dr. F roch t’s papers.
9 “Vergleichende Spannungsoptische Untersuchungen und Fliess Versuche u n te r K onzentriertem D ruck ,” by G. M esmei, Zeit. fu r Technische Mechanik und Thermodynamik, V .D .I., vol. 1, nos. 2 and 3, Berlin, 1930.
10 “R ecent Advances in P hotoelastic ity ,” by M. M. Frocht, A .S.M .E. T rans., 1931, APM-53-11.
“K inem atography in P hotoelastic ity ,” by M. M. Frocht, A .S.M .E. T rans., 1932, APM-54-9.
11 “ Photoelastic S tudy of Shearing Stresses in Keys and Keyways,” b y A. G. Solakian and G. B. K arelitz, A .S.M .E. T rans., 1932, APM-54-10.
12 R. V . B aud, Jour. Optical Soc. A m ., vol. 21, 1931, p. 119.

APPLIED MECHANICS APM-56-11 619
be noted that in each case the test piece was designed so tha t the stress was substantially uniform along a considerable portion of the specimen. By plotting the loads on the specimen against fringe order in the uniformly stressed portion, a calibration curve could be obtained thus permitting the determination of the stress per fringe for the material. In some cases a calibration bar in bending, such as employed by other investigators, was used but the results obtained in this manner were practically the same as those obtained by using the aforementioned method which was easier to apply in this case and which in our opinion was fully as accurate. The specimen shown in Fig. 2(c) permits the calibration to be made at a higher stress in the straight portion without producing an excessive stress in the minimum section at the notch.
On each of the test specimens fine scratches were made parallel to the axis of the specimen and in close proximity to the hole or notch. The purpose of these scratches was to permit the exact determination of the true edge of the hole or notch on the photograph. This was done by measuring the distance from the scratch to the edge of the hole or notch on the actual specimen using a microscope or a comparator. Then, knowing this distance and the actual magnification, the location of the true edge could be accurately determined on the photograph. I t was necessary to know this location accurately since in most cases the stress gradient near the edge was fairly steep and in consequence a slight error in the location of the edge would make a relatively
great difference in the magnitude of the measured stress. In all cases, as will be discussed later, it was found necessary to extrapolate the stress difference curve to the true edge, which in each case was found to be slightly inside the apparent edge as shown by the photographs. (See Figs. 6 to 8.)
The test specimens were prepared from specimens of bakelite annealed by a process similar to tha t used by Mesmer,9 Frocht,10 and Solakian and Karelitz.11 I t was necessary to select certain of the best pieces of bakelite for use in preparing specimens, since it was found tha t some of the samples retained residual stresses of considerable magnitude even after repeated annealing. This is in agreement with results obtained by Tuzi8 and indicates tha t it is of importance to get material suitable for annealing in order to obtain satisfactory results, particularly when high accuracy is desired.
The test specimens were prepared by first annealing them and then machining them to size, care being taken to see tha t the final machining cuts were very light so as to introduce as little residual stress near the edge as possible. Precautions were taken also to carry out the photoelastic tests as soon as possible after completion of the machining operation since it was found tha t in a short time, the specimens would develop an edge stress which makes the determination of the maximum stress very difficult, if not impossible. This is illustrated by Fig. 3 which shows two photographs of a specimen, in the loaded and unloaded condition, and having the edge effect in both. The edge effect was produced by
(a) Before Loading (b) A fter LoadingF i g . 4 S p e c i m e n W i t h P r a c t i c a l l y N o E d g e S t r e s s
620 TRANSACTIONS OF TH E AM ERICAN SOCIETY OF MECHANICAL ENGINEERS
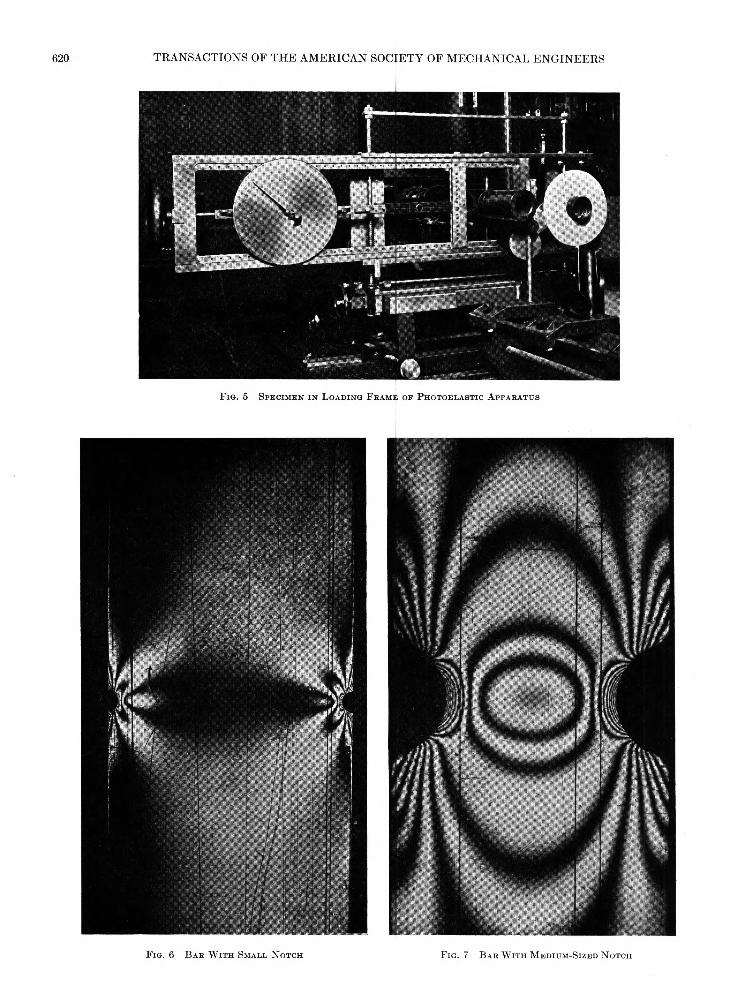
F i g . 6 B a r W i t h S m a l l N o t c h F i g . 7 B a r W i t h M e d i u m - S i z e d N o t c h

APPLIED MECHANICS APM-56-U 621
rather heavy machining cuts and by allowing the specimen to stand a few days before testing. I t may be readily seen tha t a sudden discontinuity in the stress near the edge such as exists in this particular specimen would make an accurate extrapolation of the stress curve to the true edge almost impossible.
Fig. 4 shows two pictures of a specimen machined and tested with these precautions in mind. I t may be seen tha t by careful attention to these details such edge effects may be practically eliminated. The scratches mentioned previously are plainly visible both in these two pictures and the two shown in Fig. 3.P r o c e d u r e i n M a k in g T e s t s a n d D e t e r m i n i n g R e s u l t s
In carrying out the tests monochromatic light was employed, a jnercury vapor lamp with an appropriate filter being used. The specimens were stressed a t 3000 to 3500 lb per sq in. in the most highly stressed portions. This is approximately the proportional limit for the material. Photographs were then taken of the fringes. A view of one of the specimens mounted in the photoelastic apparatus is shown in Fig. 5. Typical photographs of various specimens tested are shown on Figs. 6, 7, and 8. At the time of making the photographic exposures, a calibration curve to find the stress per fringe was taken by loading the specimen and observing the fringe order of a uniformly stressed portion of the specimen as mentioned previously. This curve in all cases was found to be practically a straight line.
In working up the results the mean stress at the minimum
F i g . 1 C u r v e s o f F r i n g e O r d e r V s .M a r k s
D i s t a n c e F r o m S c r a t c h
F i g . 1 0 S t r e s s C o n c e n t r a t i o n F a c t o r V s . d / w f o r F l a t B a r W i t h H o l e
F i g . 8 B a r W i t h L a r g e H o l iF i g . 11 S t r e s s C o n c e n t r a t i o n F a c t o r V s . d / w f o r F l a t B a r
W i t h N o t c h

622 TRANSACTIONS OF TH E AM ERICAN SOCIETY OF MECHANICAL ENGINEERS
section was determined from the known load and the dimensions of the test piece. The maximum stress was determined by plotting the fringe order against the distance from one of the scratch marks a t the minimum section and extrapolating this curve to the true edge. Two typical curves showing these extrapolations are given in Fig. 9. In many cases, as for example in the case of Fig. 6, it was necessary to use a microscope since the fringes were very fine and close together. I t was always found that one side of the specimen was stressed slightly higher than the other due to small eccentricities of loading, etc. To eliminate this effect in working up the results an average value for the two opposite sides was taken.
R e s u l t s o f T e s t s
For the case of the test specimens with holes, the test points obtained in this manner are shown by the small circles in Fig. 10
F i g . 1 2 B a r W i t h L a r g e H o l e
where the stress concentration factor, or ratio of maximum stress a t the minimum section to the mean stress a t this section, is plotted against the ratio d/w. The full line represents the mean of the test values. For comparison the calculated results obtained by Howland4 are shown by the dotted curve, the experimental results of Hennig7 by the dot and dash curve and small triangles, those of Preuss6 by the half-filled circles, and those calculated from tests made by Coker5 by the heavy dots. I t will be seen tha t the present test results closely check the mathematical results of Howland for values of the ratio d/ w less than 0.5. This is a confirmation of the relative accuracy of the method. They also check the experimental results of Hennig for values d / w less than about 0.7. The values calculated from the experimental results by Coker are, in general, considerably below the present results. This is due probably to the fact tha t he used the compensation method which is very difficult to apply right a t the edge of a specimen and which tends to give an average value of stress near a localized point of stress concentration rather than the peak value. For this reason it would be expected tha t the test results thus obtained should be lower than the true values as is, indeed, the case. The fact tha t extensometer measurements require a definite gage length, and are not as accurate for small gage lengths, probably accounts for the discrepancy between the results of Preuss and the present results.
The single point in Fig. 10 for a value of d/ w = 0.97 represents a test on a steel model which will be described and discussed more fully later.
A similar curve for the case of a notched bar is shown in Fig. 11, the half-filled circles and heavy dots representing values calculated from tests by Preuss6 and Coker.6 Again it may be seen tha t for reasons mentioned previously, the present test curve for the most part lies considerably above the points obtained by Coker or Preuss. I t will be noted that this curve tends to intersect the zero value of d/ w at some distance below the value 3, namely 2.75. A value between 2 and 3 would be expected from theoretical considerations. I t also approaches unity for ratios d/ w near to 1, which also would be expected.
The following empirical equations for the stress concentration factor K give results agreeing approximately with the test results. For a bar with a hole, under tension:
F i g . 1 3 T e s t o n S t e e l M o d e l
In all cases d/ w is the ratio of the hole or notch diameter to the width of the bar.
T e s t s o n S t e e l B a r W i t h L a r g e H o l e
In the case of a bar having a large hole with a. diameter almost equal to its width, such as shown in Fig. 12, it would naturally be thought tha t very little stress concentration would exist. For example, the curve shown by Hennig7 is drawn so as to approach unity for d/ w = 1. To check this and at the same time to avoid
For a bar with a notch, under tension:

APPLIED MECHANICS APM-56-11 623the difficulty of making optical tests on such a specimen, it was decided to make measurements on a steel model as shown on Fig. 13, using an extensometer with a gage length of 0.3 in. and a hole of 4-in. diameter in a 4Vs-in. wide plate (d/w = 0.97). It was found possible to place the extensometer points on the inside of the hole as indicated in Fig. 12, which shows the relative size of the hole as compared to the gage length. Since it is known that for such a thin section the stress distribution must be linear, the stress concentration factor may be found by dividing the stress readings on the inside of the hole by the average value between the stress obtained on the outside (see Fig. 13) and that obtained on the inside (see Fig. 12). The stress on the inside was found to be 28,100 lb per sq in. and that on the outside only 1400 lb per sq in., giving K = 1.91 for a load of 450 lb. As a check, the mean stress across the minimum section could be found from the known loads. The maximum stress measured on the inside at points, d, divided by this mean stress then gives the stress-con- centration factor. The two methods gave results agreeing within 1 per cent, the average value of K being 1.92. In O rd e r to eliminate inaccuracies due to a slight eccentricity of loading average values on opposite sides of the specimen were used. This value of K is roughly in agreement with results obtained by Coker and Filon,13 who mention that the stress on the outside of the bar seems to approach zero as d/w approaches unity, which would correspond to K — 2.
Curves between load and stress on the inside of the hole (points d, Fig. 12) were found to be linear. The corresponding curves for points a and b were found to be roughly linear, although the exact shape of the curve at these points was very hard to determine because of the very small stresses involved. Measurements of the distance between points a and b (Fig. 12) indicate that these points approach each other during loading, the relation between load and deflection being again roughly linear. It may be seen that during loading the inward movement of these points is such as to increase the stresses on the outside (at points a and 6), thereby reducing the stress concentration factor K below that which would be obtained for very small deformations, such as are assumed in elastic theory. It is possible that this is the reason for the value of K being 1.92, as obtained, rather than a higher value. In case the hole diameter so closely approaches the width of the bar that the minimum section becomes an infinitely thin filament, then for any finite deformation, this filament may move inward sufficiently to allow of a uniform stress distribution, thus giving i f = 1. For infinitely small deformations relative to the thickness of this filament, however, K may still be equal to 2.
The tests nevertheless indicate that, for a value of d/w = 0.97, K = 1.92 with stresses on the order of those possible in engineering materials such as steel. They also indicate that the curve does not drop down to unity as fast as would appear from the curve given by Hennig (see Fig. 10).
C o n c l u s i o n s
The present tests on bars with holes agree closely with the mathematical results obtained by Howland. This agreement also suggests that the photoelastic method described, if precautions to avoid undesirable edge effects are taken, offers an accurate means to determine stress concentration factors for various machine parts.
The results indicate that for large holes having a diameter nearly equal to the width of the bar the stress concentration factor is not far from 2 in cases where the lateral displacements of the minimum section of the bar are small compared to the thickness of this section.
11 “Photoelasticity,” by Coker and Filon, Cambridge Univ. Press, 1931, p. 486.
The results obtained on bars with semi-circular notches indicate in general higher stress-concentration factors than those obtained by using the results obtained by previous investigators. This is to be expected, considering the difficulty of using the photoelastic compensation method right at the edge of a specimen or of applying extensometers with short gage lengths. The fact that the compensation method tends to give an average value near a localized point of stress concentration, rather than the peak value, also tends to explain this difference.
Empirical equations are given for calculating the stress-concentration factors both for tension bars with holes and for bars with semi-circular notches.
A c k n o w l e d g m e n t
The authors are indebted to R. E. Peterson, at whose suggestion the investigation was made, and to Drs. Nadai and Timoshenko for valuable advice and suggestions.
DiscussionO. J. H o r g e r . 14 The authors have presented the stress-con
centration factors over a complete range in a satisfactory manner. The test procedure is accepted as giving accurate results which explain the deviation from previous data and in this respect the authors should be commended.
While these concentration factors are of importance to the design engineer the presentation of this data is only the beginning of a study which should be pursued. Design problems often involve two stress-concentration factors, one due to shape and the other due to material. The present tendency toward reduced weights and costs of machine parts requires accurate knowledge of the factor of safety and demands consideration of these two factors separately. “Dauerfestigkeit and Konstruktion,” in 1932, by Dr. A. Thum and W. Buchmann discusses this phase and give some data.
The extrapolation method employed is a worthy step in photoelastic analysis. After reading a preliminary report of this paper extrapolation was followed in an experiment made by the writer. Contrary to the findings of the authors the true edge was not always found inside the apparent edge. In one case the distance from the scratch to the edge on the model was 0.115 cm while the apparent edge measured 0.253 cm and in the same photograph directly opposite, the true position on the model measured 0.482 cm against 0.443 cm on the photograph. Measurements were made with a comparator.
M. M. F r o c h t . 15 The paper by Messrs. Wahl and Beeuwkes may, for the purpose of discussion, be divided into two parts: one part dealing with a reexamination of factors of stress concentration for two important engineering cases, and the other part dealing with suggestions for the determination of vague boundaries and the more accurate evaluation of boundary fringe- orders.
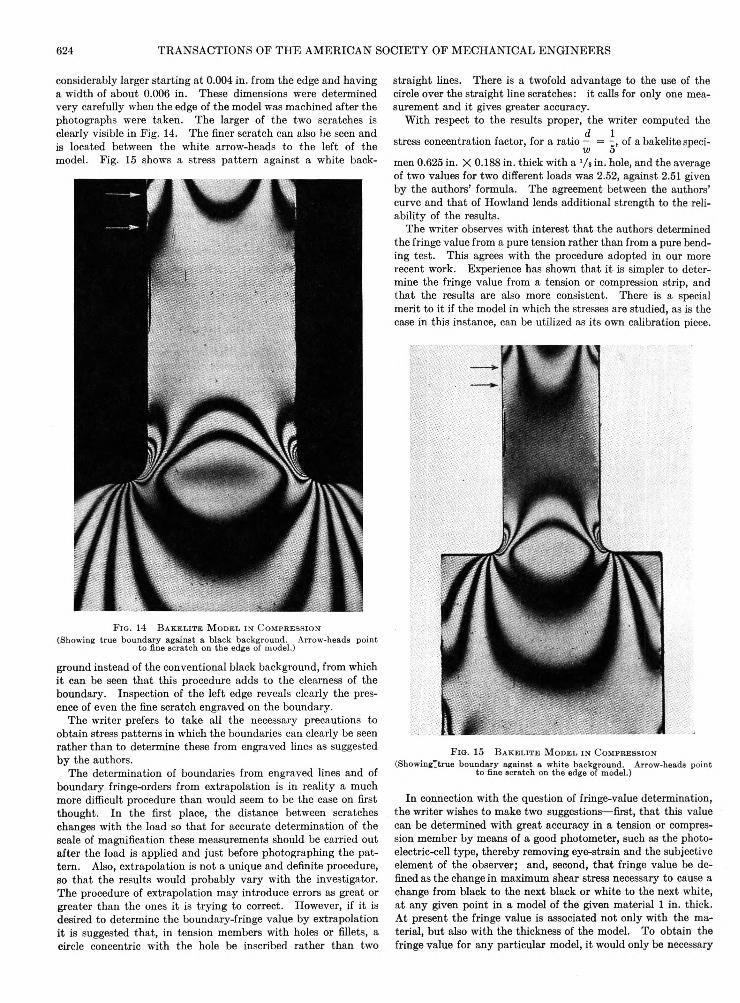
The writer has had difficulties in determining the true boundary similar to those experienced by the authors but he has found it possible to eliminate these difficulties and to obtain stress patterns in which the true boundary is clearly visible. Such a stress pattern is shown in Fig. 14. In order to determine the accuracy with which the boundary can be shown, two scratches were drawn on the model. One of these scratches was very fine and was subsequently determined to be in an interval of no more than 0.0025 in. from the edge, the other scratch was
14 Ann Arbor, Mich.16 Photoelastic Laboratory, Dept, of Mechanics, Carnegie Institute of Technology, Pittsburgh, Pa.
624 TRANSACTIONS OF TH E AM ERICAN SOCIETY OF MECHANICAL ENGIN EERS
considerably larger starting at 0.004 in. from the edge and having a width of about 0.006 in. These dimensions were determined very carefully when the edge of the model was machined after the photographs were taken. The larger of the two scratches is clearly visible in Fig. 14. The finer scratch can also be seen and is located between the w'hite arrow-heads to the left of the model. Fig. 15 shows a stress pattern against a white back-
F ig . 1 4 B a k e l i t e M o d e l i n C o m p r e s s i o n (Showing true boundary against a black background. Arrow-heads point to fine scratch on the edge of model.)ground instead of the conventional black background, from which it can be seen tha t this procedure adds to the clearness of the boundary. Inspection of the left edge reveals clearly the presence of even the fine scratch engraved on the boundary.
The writer prefers to take all the necessary precautions to obtain stress patterns in which the boundaries can clearly be seen rather than to determine these from engraved lines as suggested by the authors.
The determination of boundaries from engraved lines and of boundary fringe-orders from extrapolation is in reality a much more difficult procedure than would seem to be the case on first thought. In the first place, the distance between scratches changes with the load so tha t for accurate determination of the scale of magnification these measurements should be carried out after the load is applied and just before photographing the pattern. Also, extrapolation is not a unique and definite procedure, so tha t the results would probably vary with the investigator. The procedure of extrapolation may introduce errors as great or greater than the ones it is trying to correct. However, if it is desired to determine the boundary-fringe value by extrapolation it is suggested that, in tension members with holes or fillets, a circle concentric with the hole be inscribed rather than two
straight lines. There is a twofold advantage to the use of the circle over the straight line scratches: it calls for only one measurement and it gives greater accuracy.
W ith respect to the results proper, the writer computed thed 1stress concentration factor, for a ratio — = - , of a bakelite speci-w 5
men 0.625 in. X 0.188 in. thick with a 1/s in. hole, and the average of two values for two different loads was 2.52, against 2.51 given by the authors’ formula. The agreement between the authors’ curve and tha t of Howland lends additional strength to the reliability of the results.
The writer observes with interest tha t the authors determined the fringe value from a pure tension rather than from a pure bending test. This agrees with the procedure adopted in our more recent work. Experience has shown tha t it is simpler to determine the fringe value from a tension or compression strip, and tha t the results are also more consistent. There is a special merit to it if the model in which the stresses are studied, as is the case in this instance, can be utilized as its own calibration piece.
F i g . 15 B a k e l i t e M o d e i . i n C o m p r e s s i o n (Show ing'true boundary against a white background. Arrow-heads point to fine scratch on the edge of model.)
In connection with the question of fringe-value determination, the writer wishes to make two suggestions—first, tha t this value can be determined with great accuracy in a tension or compression member by means of a good photometer, such as the photoelectric-cell type, thereby removing eye-strain and the subjective element of the observer; and, second, tha t fringe value be defined as the change in maximum shear stress necessary to cause a change from black to the next black or white to the next white, at any given point in a model of the given material 1 in. thick. At present the fringe value is associated not only with the material, but also with the thickness of the model. To obtain the fringe value for any particular model, it would only be necessary

APPLIED MECHANICS APM-56-11 625to divide the fringe value for that material by the thickness of the model. This would simplify matters considerably and permit of easy comparison of relative optical sensitivities of different materials.
A u t h o r s ’ C l o s u r eDr. Frocht suggests that, by taking necessary precautions,
the boundary of the test specimen may be made clearly visible on the photograph and that it is preferable to determine the true edge from such a photograph rather than by means of the extrapolation procedure used by the authors. In addition, as evidence of cases where the boundary is defined with sufficient clearness, he submits the photographs of Figs. 14 and 15. After examining these photographs, however, the authors do not feel that the edges were defined with greater clearness near the fillets than was the case in most of the tests made by them; it is also their opinion that the use of the extrapolation method would increase the accuracy of the determination of the peak stresses in the fillets of the models shown on Figs. 14 and 15.
In connection with the use of the extrapolation procedure, Dr. Frocht mentions that the distance between the engraved lines on the specimen would change when the load is applied, and this would involve an error in determining the scale of magnification. However, it can be shown that this error is negligible for such stresses as are practicable with bakelite. For example, in most of the specimens used by the authors, the scratches employed to determine the magnification ratio were about 1 in. apart while the contraction due to the applied stress amounted to about 0.001 in. as computed from the known values of stress and elastic constants. This would correspond to an error of 0.1 per cent, a negligible value. Even if the stresses used were doubled, the percentage error would still be only 0.2 per cent. Since the distance between the scratch and the edge is measured in the unstressed condition, there is a further error in locating the boundary on the extrapolation curves, due to the contraction of the stressed material between the scratch and the boundary. The error in fringe order due to this cause may also be shown to be of negligible importance. Calculating the contraction from the known stresses and multiplying by the magnification ratio, the amount of error in locating the boundary on the extrapolation curves is obtained. From this, by reference to actual test curves, the error in fringe order may be found. Several tests were checked by the authors and in no case was the error due to this cause over 0.2 per cent. Hence, it may be concluded that errors
in the extrapolation procedure due to lateral contraction of the stressed material are negligible, at least for engineering purposes.
It is true, as Dr. Frocht says, that extrapolation is not a definite and unique procedure, and that there will be some variation with different investigators. The authors have found, however, that such variations are relatively small, particularly when compared to the possible errors resulting when the peak fringe values are determined merely by inspection. This checks with the experience of Dr. Weibel16 of the University of Michigan who found that much more consistent results could be obtained by the use of the extrapolation method than had been possible without it. For these reasons, the authors believe that a considerable improvement in the accuracy of stress concentration determination is made possible by the use of this method.
With regard to the use of circular lines engraved on the specimen, as suggested by Dr. Frocht, the authors believe this would be of advantage in the case of fillets in tension or bending where the peak stress is at an unknown location along the fillet. In the cases tested by the authors, where the peak stress is always at the minimum section, the use of a straight line proved to be very satisfactory. It should be noted that it is rather difficult to make a fine circular scratch concentric with the fillet or hole, unless a special tool is used, while it is very easy to inscribe a straight line. The authors found that, for best results, an extremely fine scratch was desirable since if a coarse one were used a further error in estimating the center of the black line on the photographs was introduced.
With regard to Mr. Horger’s statement that design problems involve two stress concentration factors, one due to shape and the other due to material, it may be of interest to note that in certain cases, particularly as regards large specimens of high strength alloy steels, there appears to be some tendency for the fatigue stress concentration factors to approach those found by photoelastic or mathematical methods.17 In such cases, then, these two stress-concentration factors mentioned by Mr. Horger may be considered as identical. The photoelastic test values, in these instances, would then give information of direct value to designers. The authors agree, however, that considerable additional work is desirable on these and similar questions.
16 E. E. Weibel, “Studies in Photoelastic Stress Determination,” A.S.M.E. Trans., vol. 56, 1934, paper APM-56-13.17 Note especially the discussion by Mr. R. E. Peterson of Dr. Weibel’s paper, A.S.M.E. Trans., vol. 56, 1934, APM-56-13.


![Back-to-Back Black Holes decay Signature at Neutrino ... · The back-to-back decay signature for quantum black holes produced in cosmic ray events was rst proposed in [29]. The authors](https://static.fdocuments.us/doc/165x107/6069efdca5d5202c1c20aa20/back-to-back-black-holes-decay-signature-at-neutrino-the-back-to-back-decay.jpg)
