Ströer SE & Co. KGaA Deutsche Bank Field Tripir.stroeer.com/stroeer/pdf/pdf_id/473099.pdfStröer SE...
48
Ströer SE & Co. KGaA Deutsche Bank Field Trip 13th January 2017 | Frankfurt
-
Upload
vuonghuong -
Category
Documents
-
view
225 -
download
1
Transcript of Ströer SE & Co. KGaA Deutsche Bank Field Tripir.stroeer.com/stroeer/pdf/pdf_id/473099.pdfStröer SE...

Ströer SE & Co. KGaA Deutsche Bank Field Trip 13th January 2017 | Frankfurt

Agenda
01 Key Developments Key Financials Key Strategies
Udo Müller
02 Operational Highlights M&A Integration Five Development Areas
Christian Schmalzl
03 Financials Overview Financials Segment Growth Rates Segment Perspective Transactional in more detail Free Cash Flow Leverage
Dr. Bernd Metzner
04 Summary Summary 9M 2016 Guidance 2016 & 2017
Udo Müller
2

Ströer SE & Co. KGaA: 9M 2016 Results
€MM 9M 2016 9M 2015 ▲
Revenues Reported (1) 765.7 553.2 +38%
Organic (2) 7.4% 9.1% -1.7%pts
Operational EBITDA 177.5 121.8 +46%
Operational EBITDA margin 22.9% 21.6% +1.3%pts
EBIT (adjusted) (3) 112.6 70.4 +60%
Net income (adjusted) (4) 88.9 53.0 +68%
Operating Cash Flow 124.1 86.8 +43%
Investments (before M&A) 71.7 49.5 +45%
30 September 2016 30 September 2015
Net Debt (5) / Leverage Ratio 405.3 / 1.5x 304.3 / 1.7x
3
(1) According to IFRS 11 (2) Organic growth = excluding exchange rate effects and effects from the (de)consolidation and discontinuation of operations (3) EBIT adjusted for exceptional items, amortization of acquired advertising concessions and impairment losses on intangible assets (Joint ventures are consolidated proportional) (4) EBIT (adjusted) net of the financial result adjusted for exceptional items and the normalized tax expense (15.8% tax rate) (5) Net debt = financial liabilities less cash (excl. hedge liabilities)

Outlook 2017: Media Agencies expect strong Growth for our Segments
5
25
75
85
95
5
10
60
10
15
5
95
90
95
10
15
0% 10% 20% 30% 40% 50% 60% 70% 80% 90% 100%
Directories
Magazines
Newspapers
Radio
Television
Out of Home
Online & Mobile
growing stable decliningExpected Net Revenue Development by Media for 2017
Source: OMG Preview 2017 (Association of German Media Agencies; Forecast from October 2016 for 2017; numbers rounded to 100%) 4
Ströer operating in THE two structurally fastest growing segments: market context fully intact!

Our strategic Focus for the next 15 Months
5
1. Out of Home: focus on organic growth via on-going digitization
2. Digital Content: organic growth by leveraging further synergy potentials
3. National Sales: driving market consolidation to the next level
4. Local Sales: further build-up of sales force & cross-media strategy
5. Transaction Business Models: optimizing inventory monetization in a waterfall approach

Out of Home: Digitization entering the 2nd Phase
6
Optimizing outstanding market leader position and portfolio at “market places”
Further extension of indoor Public Video Network and inventory capacities
Massive roll-out of roadside screens: up to 1,000 screens within 4 years, up to 2,000 screens within 7 years
Focus on fully incremental client budgets
Growing Digital OoH inventory allows continuously more cross-media solutions
Building Data Management Platform across OoH (Beacons, Mass Mobility Data) and Digital Media (existing DMP-setup)
Cross-Media-Adserving-Solutions for Digital “All-Screen End-Game“
Mid- & longterm Plan for further digital Rollout on Track
Example Full Digital Public Transport Station
Example Roadside Screens
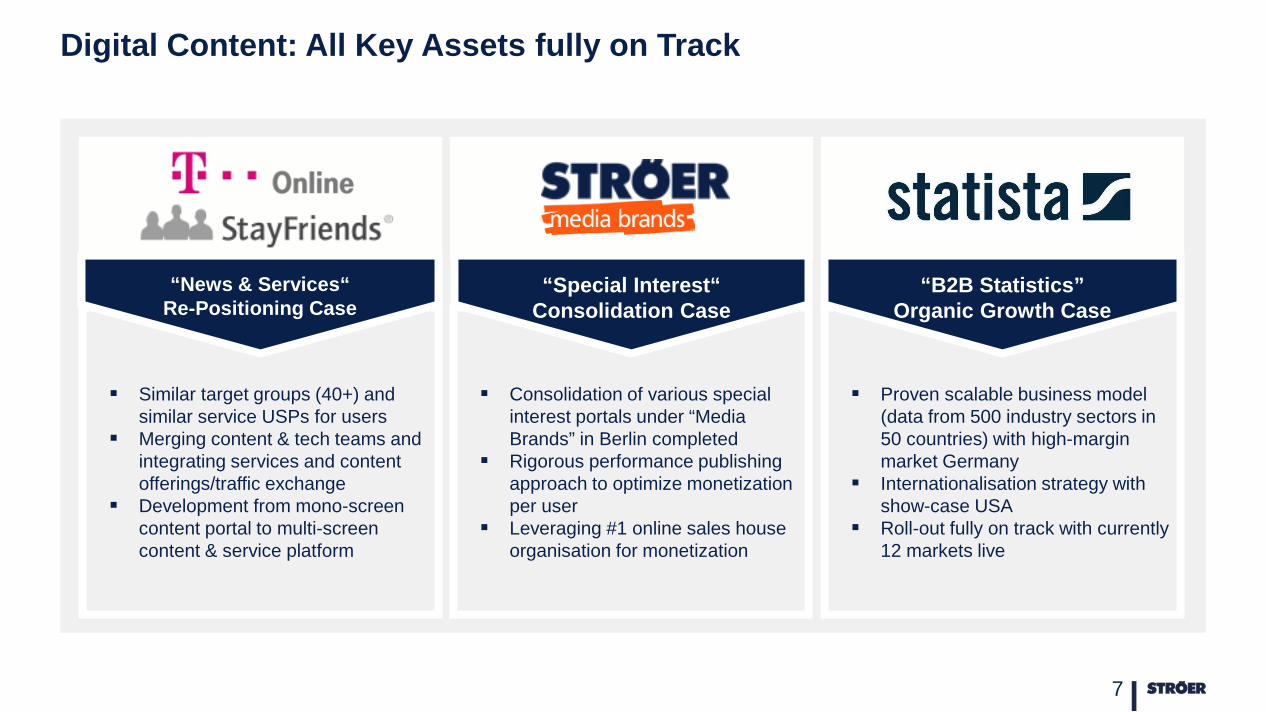
Digital Content: All Key Assets fully on Track
7
Consolidation of various special interest portals under “Media Brands” in Berlin completed
Rigorous performance publishing approach to optimize monetization per user
Leveraging #1 online sales house organisation for monetization
Similar target groups (40+) and similar service USPs for users
Merging content & tech teams and integrating services and content offerings/traffic exchange
Development from mono-screen content portal to multi-screen content & service platform
Proven scalable business model (data from 500 industry sectors in 50 countries) with high-margin market Germany
Internationalisation strategy with show-case USA
Roll-out fully on track with currently 12 markets live
“Special Interest“ Consolidation Case
“News & Services“ Re-Positioning Case
“B2B Statistics” Organic Growth Case
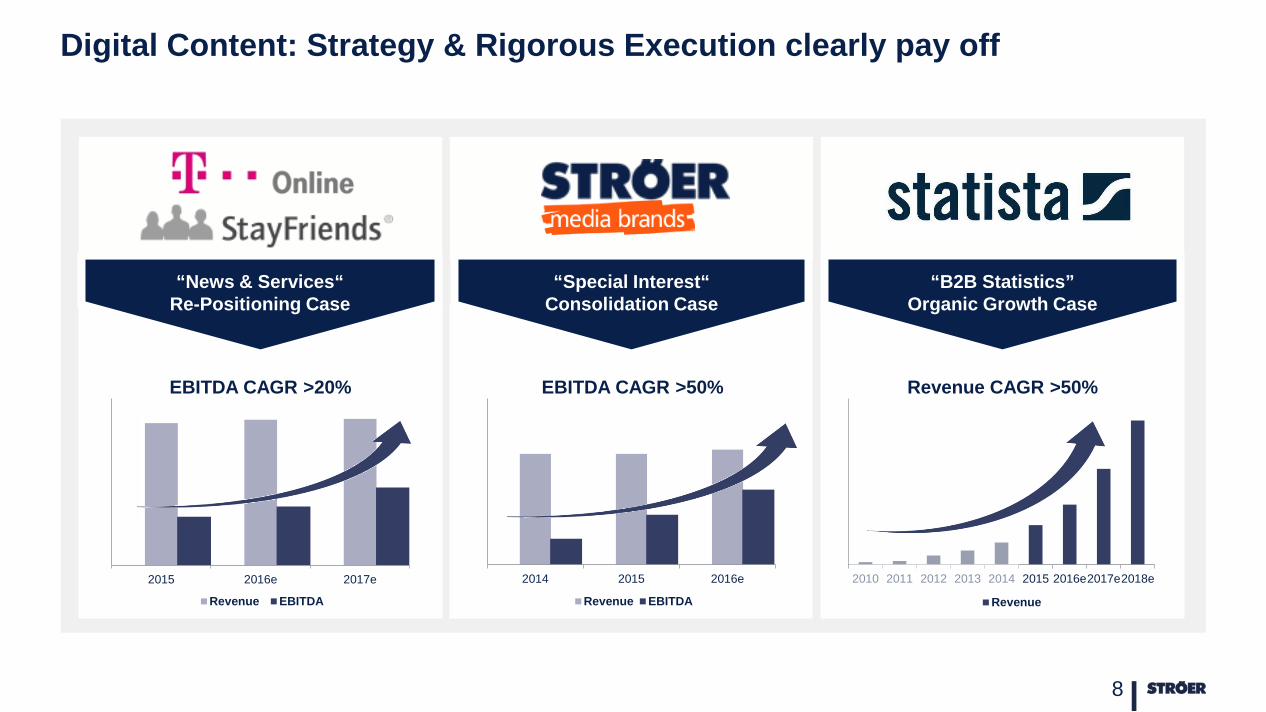
Digital Content: Strategy & Rigorous Execution clearly pay off
8
“Special Interest“ Consolidation Case
“News & Services“ Re-Positioning Case
“B2B Statistics” Organic Growth Case
0
50
100
150
1
10
100
2015 2016e 2017e
Revenue EBITDA
02468101214161820
1
10
2014 2015 2016e
Revenue EBITDA
EBITDA CAGR >20% EBITDA CAGR >50%
0
10
20
30
40
50
60
2010 2011 2012 2013 2014 2015 2016e2017e2018e
Revenue
Revenue CAGR >50%

National Ad Sales: German Top 3 Position across all Media
Source: Nielsen Gross 9M1 2016; OoH Germany + all digital saleshouses of the Group 9
437.617.000
465.928.000
587.155.000
697.113.000
899.042.000
1.546.145.000
1.749.363.000
3.527.986.000
4.685.875.000
Gruner und Jahr
Burda Verlag
ARD-Werbung,Sales & Service
El Cartel Media
RMS
Axel Springer
Ströer SE & CO KGaA
IP Deutschland
SevenOne Media 9M/16
From No. 9 (2012) to No. 3 (2016) within 4
Years!

Local Ad Sales: Massive Development Opportunities
10
On-Going growth of local salesforce from <50 (2012) to >400 (2016
Ahead of mid-term plan of ~800 FTEs by end of 2018
Optimized recruitment and training funnel for teams fully scalable
Extending Local Salesforce
Continuous rollout of local sales strategy since 4 years now
Continuous and sustainable revenue growth in combination with extended product portfolio
Shrinking local print market as massive source of business
Long-term Strategy
Investing in incremental cross-media teams to work more intensively with clients and win over-proportional market shares
Technological and data development support synergistic sales approach
Integrated Offering

Unsold Inventory
Transaction Business Models: Optimizing our Monetization Waterfall
11
National Sales
Local Sales
Total Inventory
Monetized Inventory
Marketing Toolkit >35 million unique users on
owned and operated platforms
>1 billion unsold OoH inventory
>65 billion digital consumer data touchpoints per month
Marketing & advertising KPIs via >50,000 national and local clients
Owned and operated tech stack including DMP to optimize performance marketing
Cross-marketing opportunities

Our Strategy pays off: Significant KPI Improvements YoY
12
Adjusted EPS increased ~ 4 times since 2013 Free Cash Flow (before M&A) increased > 3 times since 2013
39.3
79.6
116.4
135.0 ~ 145
0
40
80
120
160
2013 2014 2015 2016e 2017e(in EURm)
0.77 1.11
1.93
2.78 ~ 3.00
0
0,5
1
1,5
2
2,5
3
3,5
2013 2014 2015 2016e 2017e
EPS
(in EUR)
Summary of where we stand and what we focus on in 2017
13
1. Strong & unparalleled momentum across all business units
2. Focus on organic growth and significant reduction of M&A
3. On-going integration of new assets fully on track – with strong further potential
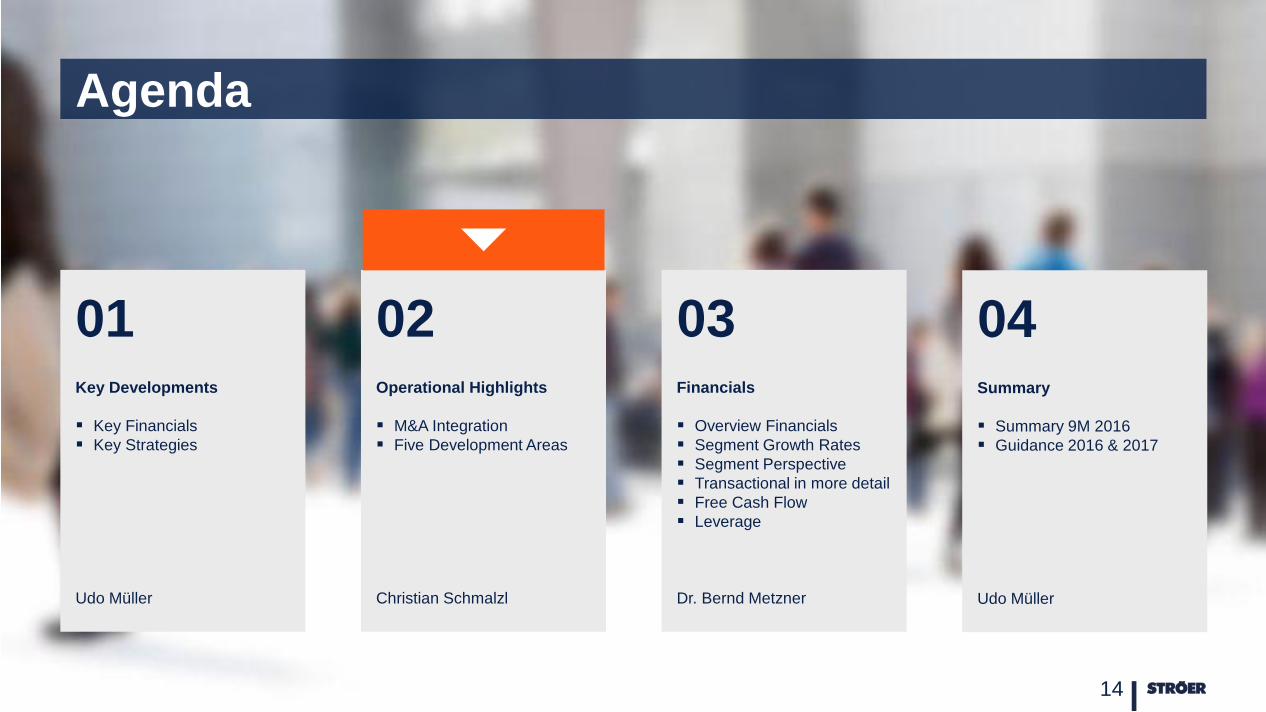
Agenda
01 Key Developments Key Financials Key Strategies
Udo Müller
02 Operational Highlights M&A Integration Five Development Areas
Christian Schmalzl
03 Financials Overview Financials Segment Growth Rates Segment Perspective Transactional in more detail Free Cash Flow Leverage
Dr. Bernd Metzner
04 Summary Summary 9M 2016 Guidance 2016 & 2017
Udo Müller
14

Unsold Inventory
Monetization Waterfall for Platform Traffic: Success Cases from Q3/9M 2016
15
National Sales
Local Sales
Total Inventory
Monetized Inventory
Playbook & Use Cases for further Revenue Growth 1. Cross-media offerings and
servicing of top 100 clients
2. Linking research & ROI-tracking to media packages
3. Establishing OoH as refreshment, complimentary and lead medium
4. Leveraging leading German online-player role via growing number of plug&play-products
5. Harnessing growing local sales force via structured cross media packages and digital products
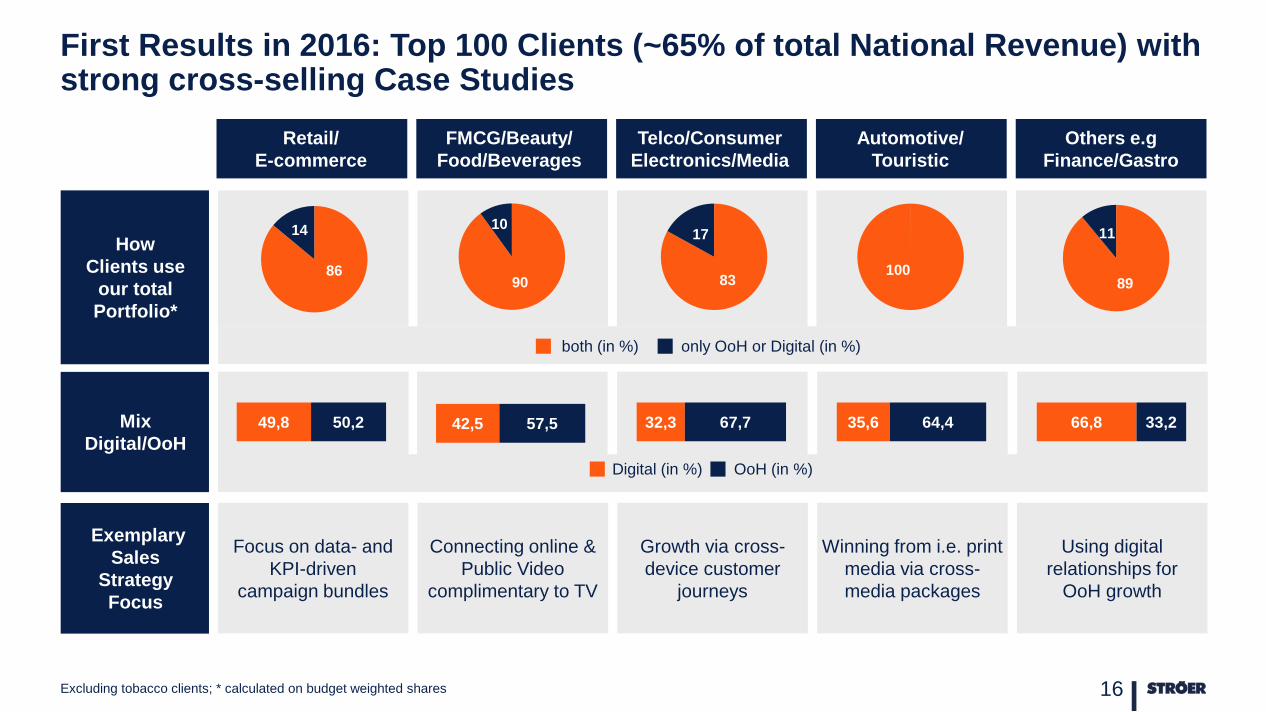
First Results in 2016: Top 100 Clients (~65% of total National Revenue) with strong cross-selling Case Studies
Excluding tobacco clients; * calculated on budget weighted shares 16
Retail/ E-commerce
FMCG/Beauty/ Food/Beverages
Telco/Consumer Electronics/Media
Automotive/ Touristic
Others e.g Finance/Gastro
49,8 50,2
both (in %) only OoH or Digital (in %)
Focus on data- and KPI-driven
campaign bundles
Connecting online & Public Video
complimentary to TV
Growth via cross-device customer
journeys
Winning from i.e. print media via cross-media packages
Using digital relationships for
OoH growth
100
35,6 64,4 42,5 57,5 32,3 67,7 66,8 33,2
90
10
86
14
83
17
89
11
Digital (in %) OoH (in %)
Mix Digital/OoH
Exemplary Sales
Strategy Focus
How Clients use
our total Portfolio*

17
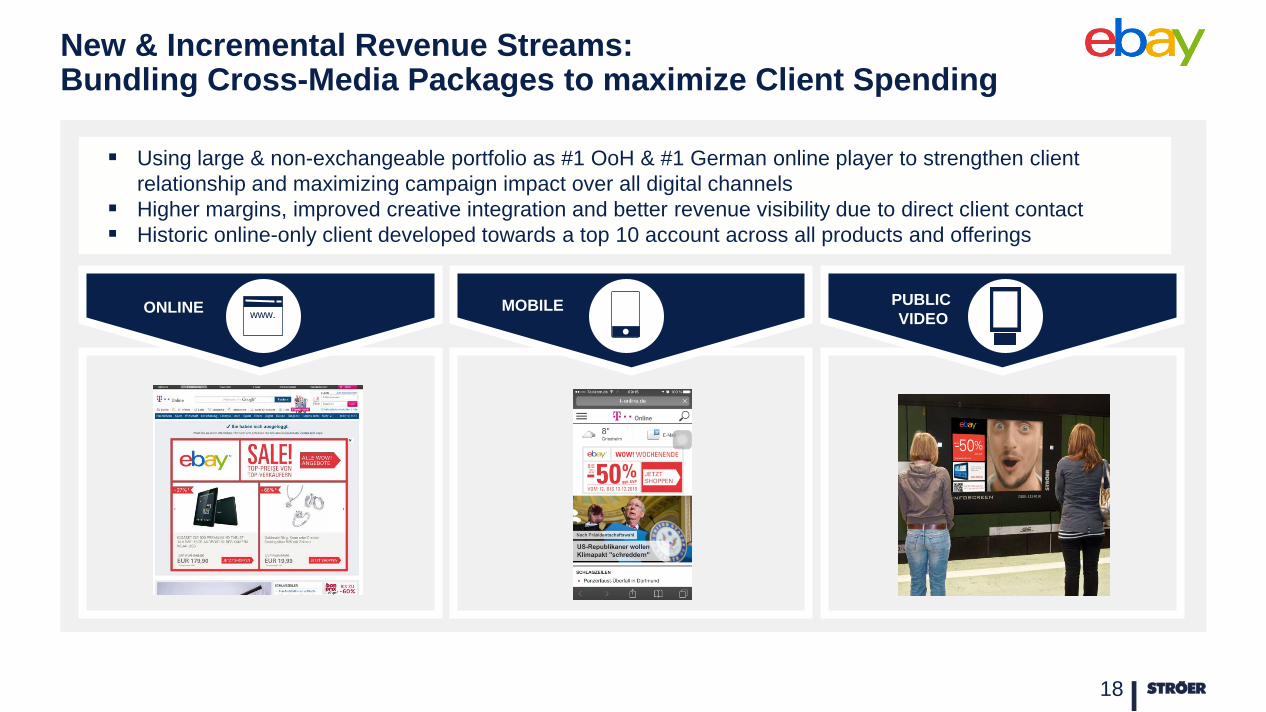
New & Incremental Revenue Streams: Bundling Cross-Media Packages to maximize Client Spending
18
…
…
…
Using large & non-exchangeable portfolio as #1 OoH & #1 German online player to strengthen client relationship and maximizing campaign impact over all digital channels
Higher margins, improved creative integration and better revenue visibility due to direct client contact Historic online-only client developed towards a top 10 account across all products and offerings
ONLINE www. MOBILE PUBLIC
VIDEO

19
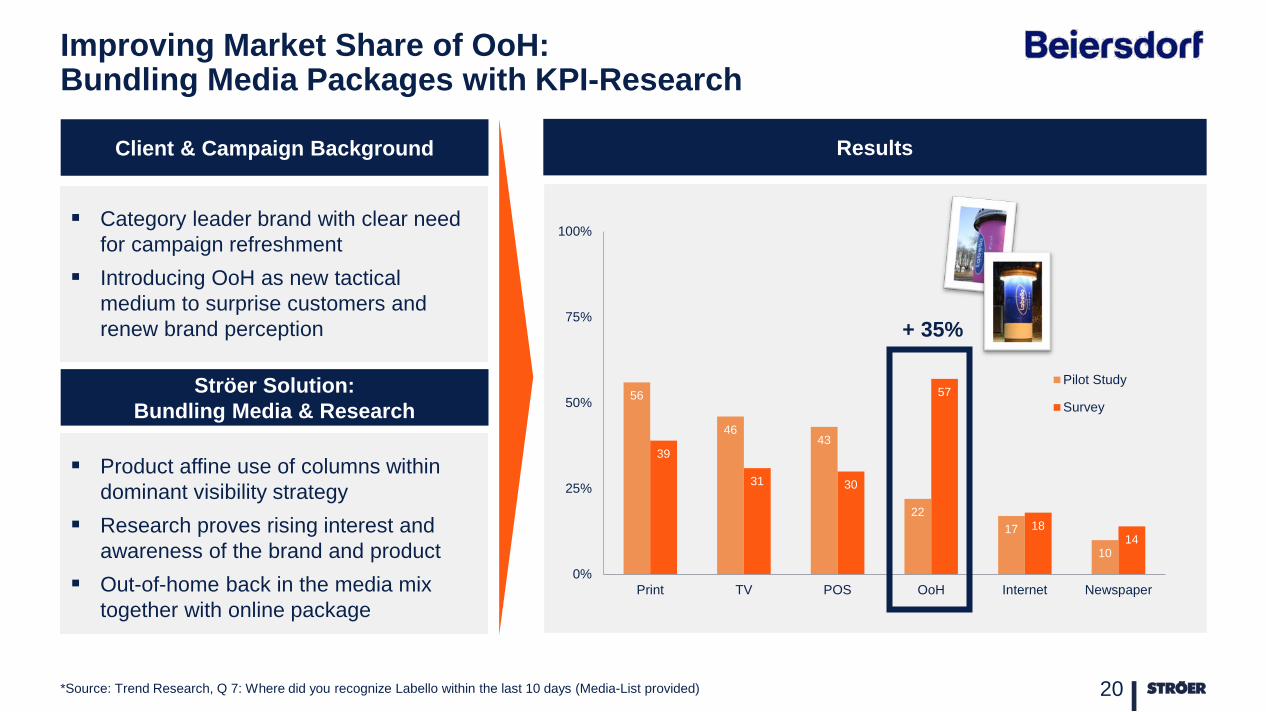
Improving Market Share of OoH: Bundling Media Packages with KPI-Research
20 *Source: Trend Research, Q 7: Where did you recognize Labello within the last 10 days (Media-List provided)
Category leader brand with clear need for campaign refreshment
Introducing OoH as new tactical medium to surprise customers and renew brand perception
Client & Campaign Background Results
Ströer Solution: Bundling Media & Research
Product affine use of columns within dominant visibility strategy
Research proves rising interest and awareness of the brand and product
Out-of-home back in the media mix together with online package
56
46 43
22 17
10
39
31 30
57
18 14
0%
25%
50%
75%
100%
Print TV POS OoH Internet Newspaper
Pilot Study
Survey
+ 35%

21

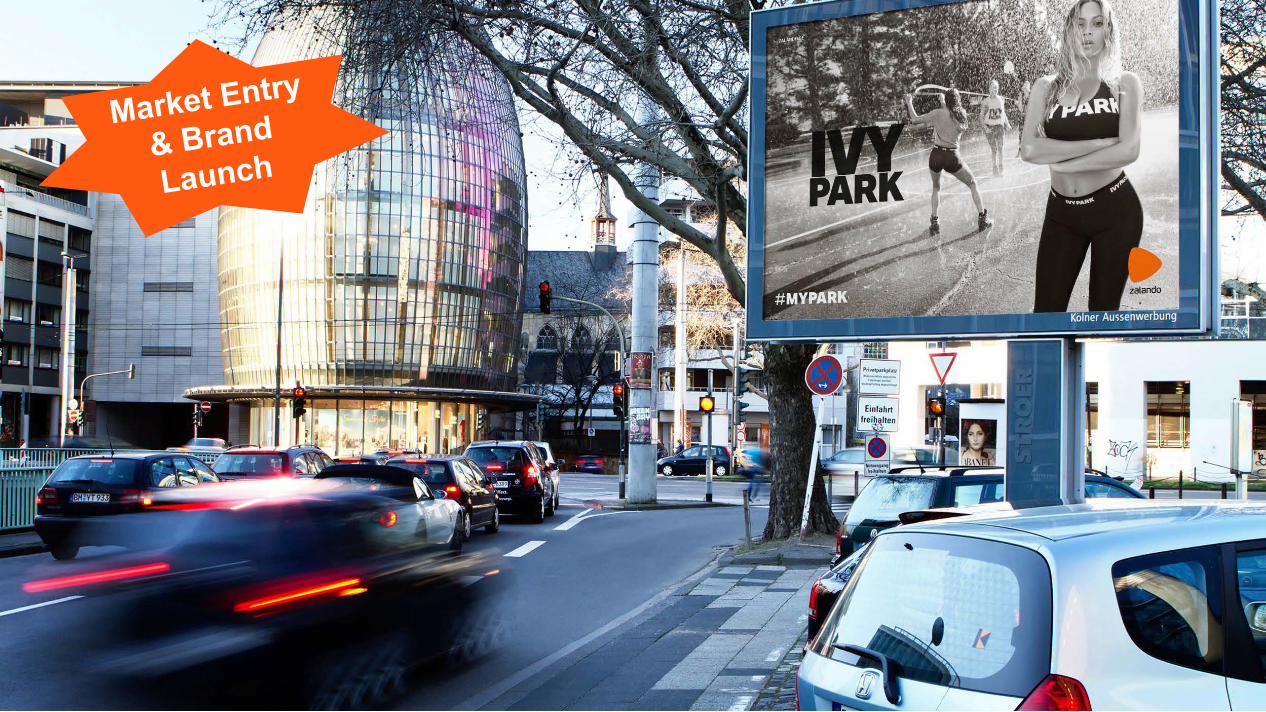
Improving Market Share of OoH: Creating Unique Visibility Success Cases
22
Launch of new product ”Big taste” Strategic role of OoH within media mix:
Pushing awareness & creating dominant visibility as well as ”talk of town”
Client & Campaign Background Campaign Impressions
Ströer Solution: Station Domination
Full blown station marketing tool kit with massive stair branding, columns and special ads (walls)
Digital campaign extension via Infoscreen and Public Video – connected to online video strategy
23

Improving Market Share of OoH: OoH pushing Search and Conversion
24
Launch of new sports collection by Beyoncé in Germany
OoH as key medium to push visibility in combination with Google search requests
Client & Campaign Background Results
Ströer Solution: Raising Interest and pushing Search with large Formats
Google trends as unbribable measurement tool to prove conversion impact
Search requests multiplied tenfold at the start of the broad and nationwide OoH campaign
Number 100 stands for the highest search interests, all others in relation to it
20
40
60
100
80
Out-of-Home Start
Source: https://www.google.de/trends/explore#q=Ivy%20Park&geo=DE&date=3%2F2016%202m&cmpt=q&tz=Etc%2FGMT-2

25
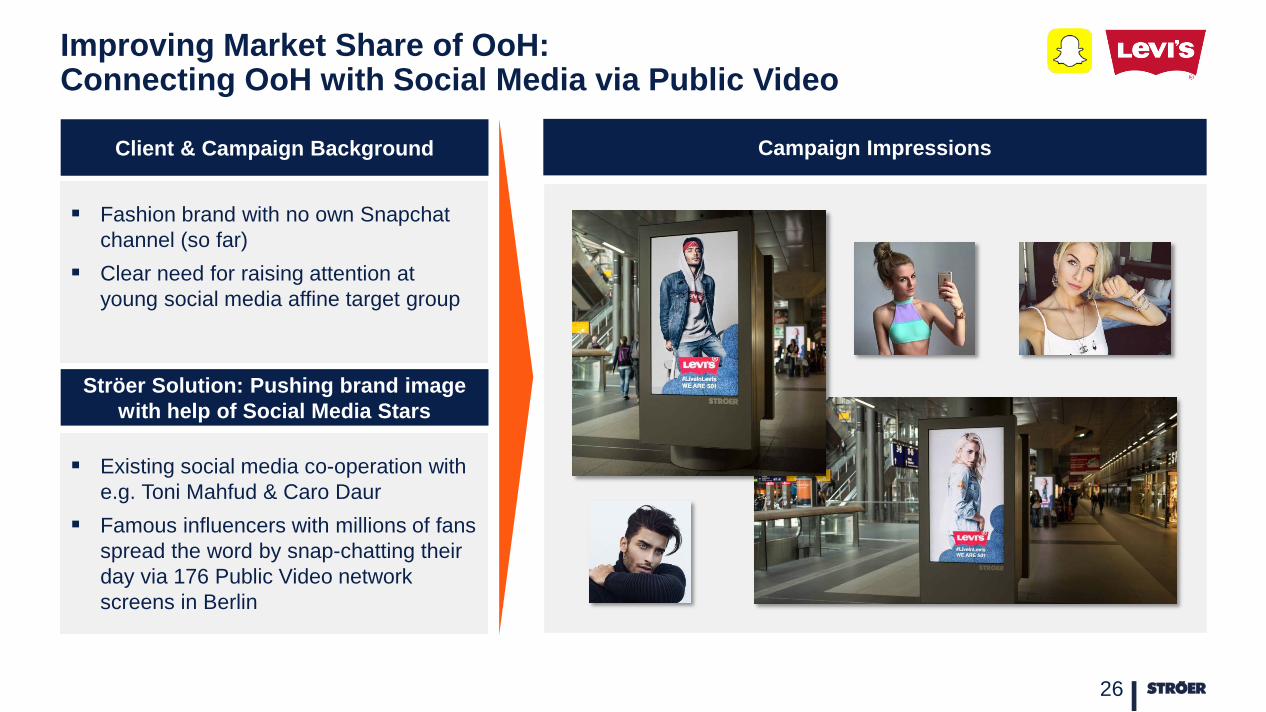
Improving Market Share of OoH: Connecting OoH with Social Media via Public Video
26
Fashion brand with no own Snapchat channel (so far)
Clear need for raising attention at young social media affine target group
Client & Campaign Background Campaign Impressions
Ströer Solution: Pushing brand image with help of Social Media Stars
Existing social media co-operation with e.g. Toni Mahfud & Caro Daur
Famous influencers with millions of fans spread the word by snap-chatting their day via 176 Public Video network screens in Berlin

27 Source: http://de.123rf.com/profile_iqoncept'>iqoncept

New Revenue Streams: Plug & Play Product “Homepage Roadblock”
Exemplary Cases for RWE/Innogy & ING Bank
Need for high reach campaign elements (comparable to Facebook and Google Display Network)
Easy to book, out of one hand, high quality standards
Ideal use cases and occasions: Season Kick off, image campaigns, short term offers
Client & Campaign Background
Highest impact with daily fixed special ad placements
Aggregating top websites from Ströer network
Ströer Solution: Ströer Homepage Roadblock
RWE/innogy: Display Roadblock
ING: Multiscreen Roadblock
28
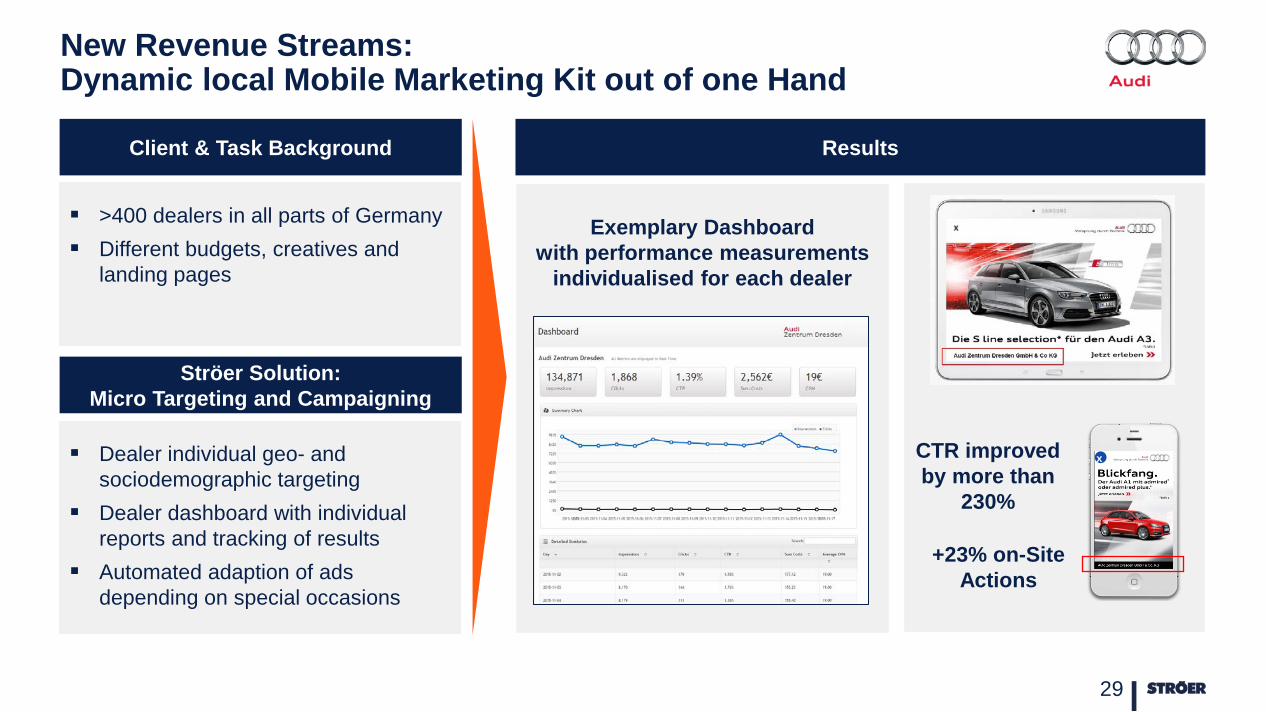
New Revenue Streams: Dynamic local Mobile Marketing Kit out of one Hand
29
>400 dealers in all parts of Germany Different budgets, creatives and
landing pages
Client & Task Background Results
Exemplary Dashboard
with performance measurements individualised for each dealer
Ströer Solution: Micro Targeting and Campaigning
Dealer individual geo- and sociodemographic targeting
Dealer dashboard with individual reports and tracking of results
Automated adaption of ads depending on special occasions
x CTR improved by more than
230%
+23% on-Site Actions

30

Cross-Media-Teams on Top of OoH & Digital Sales Teams: Growing Number of Success Cases
31
Wolfsburg case now allows rollout across all regions for theatres and shows
Currently 350 active OoH clients in that sector Total market potential: over 1,200 theatres in
Germany with over 125,000 shows per year
Structured Sales-Rollout for Product Bundles per Industry
Case “Stadt-Theater Wolfsburg”
Local campaign bundle with columns, city light posters and targeted online display advertising
Test-campaign in September and extended follow-up booking November/December

Roadside Screens with promising SMB Approach: Sales KPIs and Rollout Plan beyond Expectations
33
Test City 1: Wuppertal
6 screens, start of sales-rollout:
November 2015
current fill-rate (w42) for “Branchenfenster”:
87%
Test City 2: Cologne
27 screens, start of sales-rollout:
April 2016
current fill-rate (w42) for “Branchenfenster”:
63%
Typical SMB local retail client Switching small advertising budget from
yellow pages to roadside screens
Typical local craftsman Growing importance of online; excellent
results of roadside screens & search
Client Case 1: Metzgerei Kremer
Client Case 2: Stonegate

34

Agenda
01 Key Developments Key Financials Key Strategies
Udo Müller
02 Operational Highlights M&A Integration Five Development Areas
Christian Schmalzl
03 Financials Overview Financials Segment Growth Rates Segment Perspective Transactional in more detail Free Cash Flow Leverage
Dr. Bernd Metzner
04 Summary Summary 9M 2016 Guidance 2016 & 2017
Udo Müller
35

EURm 1-9 2016 1-9 2015 ▲ % Analysis
Revenues (reported) (1) 765.7 553.2 +38% Expansion driven by 7.4% organic growth and M&A
Adjustments (IFRS 11) 9.8 10.3 -4%
Revenues (Management View) 775.5 563.5 +38%
Operational EBITDA 177.5 121.8 +46% On track to deliver > 280 EURm for the FY 2016
Exceptionals -16.3 -12.2 -33% Higher Exceptionals from M&A and Integrations
IFRS 11 adjustment -3.1 -3.1 -2%
EBITDA 158.1 106.4 +49%
Depreciation & Amortization -103.4 -74.6 -39% Increase in D&A base on larger consolidation scope
EBIT 54.8 31.8 +72%
Financial result -7.5 -7.5 -1% Further optimization of financing structure
Tax result -6.5 0.5 n.d.
Net Income 40.8 24.8 +64%
Adjustment(2) 48.1 28.2 +71%
Net income (adjusted) 88.9 53.0 +68% On track to deliver > 150 EURm for the FY 2016
Profit and Loss Statement 1-9 2016
36 (1) According to IFRS (2) Adjustment for exceptional items (+17.3 EURm) including adjustments of the financial result, amortization of acquired advertising concessions & impairment losses on
intangible assets (+ 39.9 EURm), Tax Adjustment (-8.8 EURm)

37
Overview on Growth Rates 1-9 2016
Group Digital OoH Germany OoH International
YTD Reported Growth 38.4% >100% 8.6% -7.1%
YTD Organic Growth including organic growth of 12M M&A
7.4% 9.6% 8.6% -1.4%
YTD Organic Growth w/o revenues of 12M M&A
6.9% 9.8% 8.6% -1.3%

563.5
-5.3
172.3 730.5
-9.0 54.0 775.5
450
500
550
600
650
700
750
800
850
1 2 3 4 5 6 7
Organic Growth of 7.4 % in 1-9 2016
*Revenues correspond to management accounting pre IFRS11 38
In EURm
9M 2016* Organic FX 9M 2015 adjusted
Acquisitions Discontinued Operations / Disposals
9M 2015*
e.g. Digital Partners
e.g. T-Online, Interactive Media, RegioHelden
~ 28 OoH Germany ~ 29 Digital ~ -1 OoH Int. ~ -2 Consol.

Revenues Operational EBITDA € MM € MM
2015
2016
Organic Growth Rate
Marge
Digital: Strong Profitable Growth
39
Strong digital growth, both organically – video, transactional – and as well major scope effects
Op. EBITDA in line with revenues; investments in growth business models like Statista or Regiohelden / Omnea
Ongoing integration efforts and enforced restructuring activities
51.7
139.9 123.1
333.4
Q3 9M
13.8
37.8 35.9
89.7
Q3 9M
+9.0% +9.6% +29.2% +26.9%

Display Video Transactional
2016 2015 Growth rate
€ MM € MM € MM
62.6 59.1
18.2
169.5
65.9
97.9
9M 9M 9M
Digital Segment Revenues: Product Group Development 1-9 2016
40
>100% +11.6% >100% € MM € MM € MM

√
Digital Commerce Performance Ad & Subscription
Digital local services
Integrated shopping offerings
E-Commerce for especially Health & Beauty products
Integrated search models
Subscription based business models
Product Segment Transactional in more Detail (FY 2016e)
Transactional
41
Trade with products in specific verticals (such as Asam Beauty, Bodychange and T-Online Shop)
Lead generation Affiliate Marketing Performance Marketing (CPX) Local Digital Services Subscription
> 150 EURm 2016e 75% 25%

Revenues Operational EBITDA € MM € MM
2015
2016
Organic Growth Rate
Marge
OoH Germany: Strong Overachievement
42
Continued market outperformance based on sustainingly strong national and regional sales performance
Operational EBITDA margin improvement supported by cost containment
Continued investments in further expansion of local sales force
110.7
324.8
118.3
352.8
Q3 9M
28.6
78.7
31.5
90.6
Q3 9M
+6.8% +8.6% +26.7% +25.7% +6.8% +8.6%

Revenues Operational EBITDA € MM € MM
Organic Growth Rate
Marge
2015
2016
OoH International: One Time Dip in Q3, but back on Track in Q4 …
43
Q3 suffering from strong dip in Turkish economy and ad market after coup attempt in July
Negative fx effects (TRY, PLN) and soft OoH market dynamics in Poland
Active cost management not sufficient to compensate revenue development
32.6
105.7
28.3
98.1
Q3 9M
3.7
15.3
0.6
11.9
Q3 9M
-10.8% -1.4% +2.2% +12.1%

Free Cash Flow Perspective 1-9 2016
44
Free Cash Flow 9M 2016 EURm
9M 2015 EURm
Op. EBITDA 177.5 121.8
- Interest (paid) -4.9 -7.5
- Tax (paid) -8.2 -5.5
-/+ WC -7.9 -2.3
- Others -32.4 -19.7
Operating Cash Flow 124.1 86.8
Investments (before M&A) -71.7 -49.5
Free Cash Flow (before M&A) 52.4 37.3
Strong operational cash generation in line with increased operational performance
Further reduced interest payments after successful refinancing in 2014 and 2015
Higher exceptionals due to M&A, restructuring and
Integration efforts
High investment level due to further digitalization in OoH, IT-infrastructure and various other projects
Analysis

304 304 405
2.2
1.7 1.5
0
0,5
1
1,5
2
2,5
200
250
300
350
400
450
9M 2014 9M 2015 9M 2016
Net debt Leverage Ratio
Financial Status and Outlook
Leverage Ratio could be reduced vs PY from 1.7 to 1.5 in the last 12M due to strong Free Cash Flow of 131 mEUR
Free Cashflow before M&A of more than 135 mEUR in 2016 expected
Financial Status & Outlook
Maintaining a solid financial profile with a target leverage ratio of 2.0 – 2.5 is a key element of our growth strategy
Dividend pay-out ratio: 25 – 50%
Long Term Financial Outlook
Development Leverage Ratio
45

Agenda
01 Key Developments Key Financials Key Strategies
Udo Müller
02 Operational Highlights M&A Integration Five Development Areas
Christian Schmalzl
03 Financials Overview Financials Segment Growth Rates Segment Perspective Transactional in more detail Free Cash Flow Leverage
Dr. Bernd Metzner
04 Summary Summary 9M 2016 Guidance 2016 & 2017
Udo Müller
46

Summary: Excellent 9M 2016
47
47
Total revenue growth by 38% to 765.7 EURm
Operational EBITDA expanded by 46% to 177.5 EURm
Operating Cash Flow expanded by 43% to 124.1 EURm
Leverage Ratio at 1.5 times operational EBITDA
Net Income (adjusted) increased by 68% to 88.9 EURm
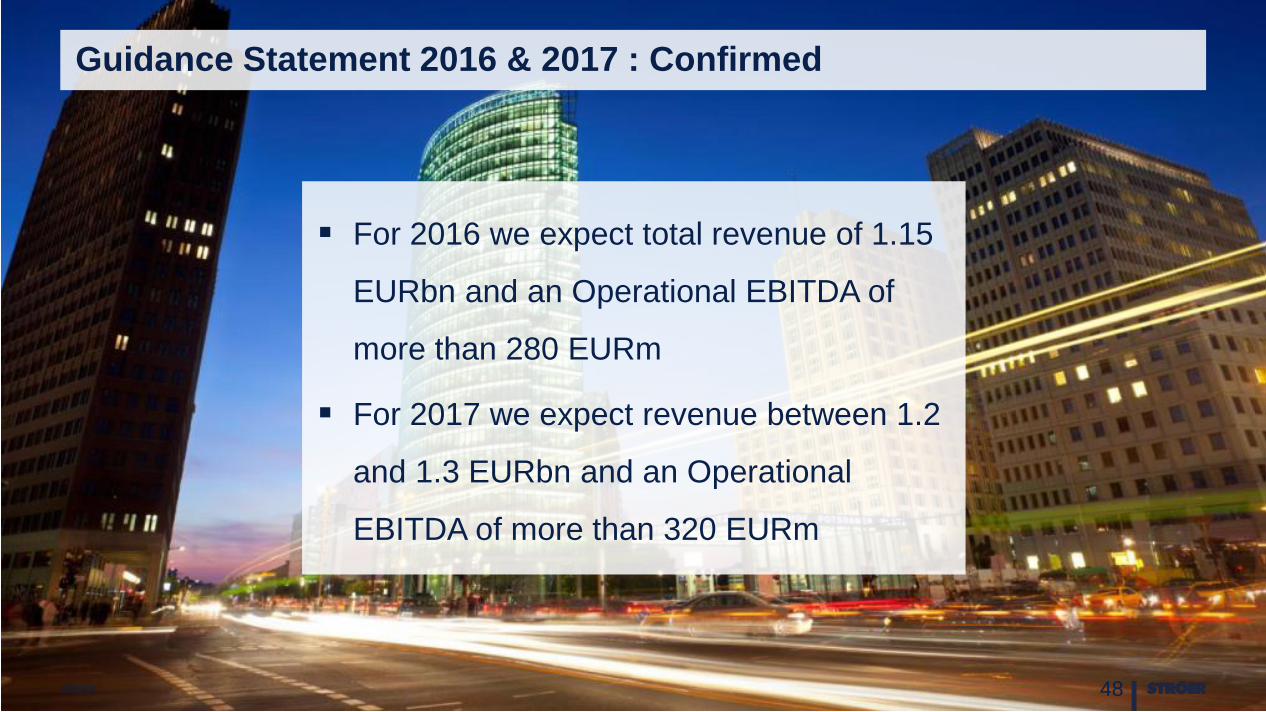
Guidance Statement 2016 & 2017 : Confirmed
iStock 48
For 2016 we expect total revenue of 1.15
EURbn and an Operational EBITDA of
more than 280 EURm
For 2017 we expect revenue between 1.2
and 1.3 EURbn and an Operational
EBITDA of more than 320 EURm