Strengths and limitations of computer assisted telephone ...
20
RESEARCH ARTICLE Strengths and limitations of computer assisted telephone interviews (CATI) for nutrition data collection in rural Kenya Christine Lamanna ID 1 *, Kusum Hachhethu 2,3 , Sabrina Chesterman 1,4 , Gaurav Singhal 2 , Beatrice Mwongela 5 , Mary Ng’endo 1 , Silvia Passeri 2,3 , Arghanoon Farhikhtah 3 , Suneetha Kadiyala 4 , Jean-Martin Bauer 2,6 , Todd S. Rosenstock 7,8 1 World Agroforestry Centre, Nairobi, Kenya, 2 Vulnerability, Analysis, and Mapping Unit, United Nations World Food Programme, Rome, Italy, 3 Nutrition Division, United Nations World Food Programme, Rome, Italy, 4 Department of Population Health, London School of Hygiene and Tropical Medicine, London, United Kingdom, 5 Kenya Country Office, United Nations World Food Programme, Nairobi, Kenya, 6 United Nations World Food Programme, Brazzaville, Republic of the Congo, 7 CGIAR Research Program on Climate Change, Agriculture, and Food Security, Kinshasa, Democratic Republic of the Congo, 8 World Agroforestry Centre, Kinshasa, Democratic Republic of the Congo * [email protected] Abstract Despite progress in fighting undernutrition, Africa has the highest rates of undernutrition globally, exacerbated by drought and conflict. Mobile phones are emerging as a tool for rapid, cost effective data collection at scale in Africa, as mobile phone subscriptions and phone ownership increase at the highest rates globally. To assess the feasibility and biases of collecting nutrition data via computer assisted telephone interviews (CATI) to mobile phones, we measured Minimum Dietary Diversity for Women (MDD-W) and Minimum Acceptable Diet for Infants and Young Children (MAD) using a one-week test-retest study on 1,821 households in Kenya. Accuracy and bias were assessed by comparing individual scores and population prevalence of undernutrition collected via CATI with data collected via traditional face-to-face (F2F) surveys. We were able to reach 75% (n = 1366) of study participants via CATI. Women’s reported nutrition scores did not change with mode for MDD-W, but children’s nutrition scores were significantly higher when measured via CATI for both the dietary diversity (mean increase of 0.45 food groups, 95% confidence interval 0.34–0.56) and meal frequency (mean increase of 0.75 meals per day, 95% confidence interval 0.53–0.96) components of MAD. This resulted in a 17% higher inferred prevalence of adequate diets for infants and young children via CATI. Women without mobile-phone access were younger and had fewer assets than women with access, but only marginally lower dietary diversity, resulting in a small non-coverage bias of 1–7% due to exclusion of participants without mobile phones. Thus, collecting nutrition data from rural women in Africa with mobile phones may result in 0% (no change) to as much as 25% higher nutrition estimates than collecting that information in face-to-face interviews. PLOS ONE | https://doi.org/10.1371/journal.pone.0210050 January 30, 2019 1 / 20 a1111111111 a1111111111 a1111111111 a1111111111 a1111111111 OPEN ACCESS Citation: Lamanna C, Hachhethu K, Chesterman S, Singhal G, Mwongela B, Ng’endo M, et al. (2019) Strengths and limitations of computer assisted telephone interviews (CATI) for nutrition data collection in rural Kenya. PLoS ONE 14(1): e0210050. https://doi.org/10.1371/journal. pone.0210050 Editor: Brady T. West, University of Michigan, UNITED STATES Received: July 5, 2017 Accepted: December 17, 2018 Published: January 30, 2019 Copyright: © 2019 Lamanna et al. This is an open access article distributed under the terms of the Creative Commons Attribution License, which permits unrestricted use, distribution, and reproduction in any medium, provided the original author and source are credited. Data Availability Statement: Data generated in this study are freely available in the ICRAF Dataverse repository at doi:10.7910/DVN/ZYW1Q0 and doi:10.7910/DVN/XGMQDG. Funding: This work was supported by UKAID funded Innovative Methods and Metrics for Agriculture and Nutrition Actions IMMANA (http:// immana.lcirah.ac.uk/) grant #1.99 to the World Agroforestry Centre (TS Rosenstock) and the London School of Hygiene and Tropical Medicine
Transcript of Strengths and limitations of computer assisted telephone ...

RESEARCH ARTICLE
Strengths and limitations of computer
assisted telephone interviews (CATI) for
nutrition data collection in rural Kenya
Christine LamannaID1*, Kusum Hachhethu2,3, Sabrina Chesterman1,4, Gaurav Singhal2,
Beatrice Mwongela5, Mary Ng’endo1, Silvia Passeri2,3, Arghanoon Farhikhtah3,
Suneetha Kadiyala4, Jean-Martin Bauer2,6, Todd S. Rosenstock7,8
1 World Agroforestry Centre, Nairobi, Kenya, 2 Vulnerability, Analysis, and Mapping Unit, United Nations
World Food Programme, Rome, Italy, 3 Nutrition Division, United Nations World Food Programme, Rome,
Italy, 4 Department of Population Health, London School of Hygiene and Tropical Medicine, London, United
Kingdom, 5 Kenya Country Office, United Nations World Food Programme, Nairobi, Kenya, 6 United Nations
World Food Programme, Brazzaville, Republic of the Congo, 7 CGIAR Research Program on Climate
Change, Agriculture, and Food Security, Kinshasa, Democratic Republic of the Congo, 8 World Agroforestry
Centre, Kinshasa, Democratic Republic of the Congo
Abstract
Despite progress in fighting undernutrition, Africa has the highest rates of undernutrition
globally, exacerbated by drought and conflict. Mobile phones are emerging as a tool for
rapid, cost effective data collection at scale in Africa, as mobile phone subscriptions and
phone ownership increase at the highest rates globally. To assess the feasibility and biases
of collecting nutrition data via computer assisted telephone interviews (CATI) to mobile
phones, we measured Minimum Dietary Diversity for Women (MDD-W) and Minimum
Acceptable Diet for Infants and Young Children (MAD) using a one-week test-retest study
on 1,821 households in Kenya. Accuracy and bias were assessed by comparing individual
scores and population prevalence of undernutrition collected via CATI with data collected
via traditional face-to-face (F2F) surveys. We were able to reach 75% (n = 1366) of study
participants via CATI. Women’s reported nutrition scores did not change with mode for
MDD-W, but children’s nutrition scores were significantly higher when measured via CATI
for both the dietary diversity (mean increase of 0.45 food groups, 95% confidence interval
0.34–0.56) and meal frequency (mean increase of 0.75 meals per day, 95% confidence
interval 0.53–0.96) components of MAD. This resulted in a 17% higher inferred prevalence
of adequate diets for infants and young children via CATI. Women without mobile-phone
access were younger and had fewer assets than women with access, but only marginally
lower dietary diversity, resulting in a small non-coverage bias of 1–7% due to exclusion of
participants without mobile phones. Thus, collecting nutrition data from rural women in
Africa with mobile phones may result in 0% (no change) to as much as 25% higher nutrition
estimates than collecting that information in face-to-face interviews.
PLOS ONE | https://doi.org/10.1371/journal.pone.0210050 January 30, 2019 1 / 20
a1111111111
a1111111111
a1111111111
a1111111111
a1111111111
OPEN ACCESS
Citation: Lamanna C, Hachhethu K, Chesterman S,
Singhal G, Mwongela B, Ng’endo M, et al. (2019)
Strengths and limitations of computer assisted
telephone interviews (CATI) for nutrition data
collection in rural Kenya. PLoS ONE 14(1):
e0210050. https://doi.org/10.1371/journal.
pone.0210050
Editor: Brady T. West, University of Michigan,
UNITED STATES
Received: July 5, 2017
Accepted: December 17, 2018
Published: January 30, 2019
Copyright: © 2019 Lamanna et al. This is an open
access article distributed under the terms of the
Creative Commons Attribution License, which
permits unrestricted use, distribution, and
reproduction in any medium, provided the original
author and source are credited.
Data Availability Statement: Data generated in
this study are freely available in the ICRAF
Dataverse repository at doi:10.7910/DVN/ZYW1Q0
and doi:10.7910/DVN/XGMQDG.
Funding: This work was supported by UKAID
funded Innovative Methods and Metrics for
Agriculture and Nutrition Actions IMMANA (http://
immana.lcirah.ac.uk/) grant #1.99 to the World
Agroforestry Centre (TS Rosenstock) and the
London School of Hygiene and Tropical Medicine

Introduction
Undernutrition among mothers is one of the leading causes of neonatal death globally [1] and
is responsible for the death of an estimated 3.5 million children under the age of five per year
[2], as well as reduced educational attainment and economic productivity among adults [3].
Diet, and dietary diversity in particular, are closely linked with undernutrition among both
women and young children [4], and has been identified as a key area for research [5] and pro-
gramming [6] to combat malnutrition. In recognition of the global impact of malnutrition, the
United Nations General Assembly declared a Decade of Action on Nutrition (2016–2026), and
the Sustainable Development Goals have set the ambitious target of ending hunger and under-
nutrition by 2030 [7].
Advances in reducing undernutrition depend on the ability to monitor nutritional status of
at-risk populations in order to respond rapidly to crises and scale-up successful programming.
Both require systematic data collection at a high spatial resolution and temporal frequency
[8,9]; however, current approaches used to collect nutrition data do not meet the requisite
demand [10]. Nutrition data is typically obtained by physically visiting the study location and
conducting face-to-face (F2F) household surveys at relatively high cost and with variable data
quality [11, 12]. Consequently, nutrition data collection is limited in scope and frequency, and
disproportionately rare in areas of insecurity, disease outbreak, or poor infrastructure [11, 13].
New approaches that can generate information at the right time and places are critical to scale
effective and efficient programming and to meet global goals on undernutrition [7].
Mobile phones are increasingly used to conduct surveys at scale in low- and middle-income
countries (LMICs) [14]. This is in part possible because subscriptions to mobile services are
increasing rapidly, including in Sub-Saharan Africa where approximately 46% of the popula-
tion was connected in 2015 [15]. Despite these gains in mobile penetration, many at risk and
vulnerable populations (target beneficiaries) may be missed due to lack of connectivity. For
example, poor, rural women remain the most under-represented group in terms of both
mobile phone ownership and usage [16]. Regardless, the proliferation of mobile devices and
data collection platforms has catalyzed their use in monitoring efforts in health, food security,
household characterization, disaster response, and other fields [17–20].
Data collection on nutrition via mobile phones may present novel challenges compared
with traditional F2F surveys. There are four primary methods of mobile-phone based data col-
lection: short messaging service (SMS); interactive voice response (IVR) either via telephone
keypad or speech recognition; unstructured supplementary service data (USSD); and com-
puter-assisted telephone interviewing (CATI) either with a human or computer operator.
Each mode has inherent strengths and limitations for use in the developing world [14, 21, 22].
While SMS is perhaps the most cost-effective data collection mode, it requires literate partici-
pants, preventing its widespread use, particularly in Africa [15]. IVR provides greater flexibility
in the types of questions that can be asked and ability to reach low-literacy users compared to
SMS and may have similar reliability to SMS in LMIC contexts [22, 23] (but see [24] for con-
trast). However, IVR with speech recognition can be challenging to implement in local lan-
guages due to the need to create word banks with many speakers [25], and generally, IVR
suffers from both lower response and completion rates than other modes when used in survey
contexts [14, 22, 26]. USSD requires close collaboration with telecom companies, which may
not be available in all locations [27], and does not directly address monitoring or research
questions. In contrast, CATI offers the flexibility to adapt questions and survey administration
to local languages and phone usage patterns and does not require literate participants. In addi-
tion to mobile money applications, voice calling is the most common use of mobile phones in
Collecting nutrition data via mobile phones in Kenya
PLOS ONE | https://doi.org/10.1371/journal.pone.0210050 January 30, 2019 2 / 20
(S Kadiyala). The United Nations World Food
Programme mVAM and Nutrition units were
supported in part by funding from the USAID Office
of Food for Peace (www.usaid.gov) (JM Bauer).
The CGIAR Research Program on Climate Change,
Agriculture and Food Security research project
Partnerships for Scaling Climate-Smart Agriculture
(P4S) (TS Rosenstock) provided additional
support. CCAFS is supported by the CGIAR Trust
Fund and through bilateral funding agreements. For
details please visit https://ccafs.cgiar.org/donors.
The views expressed in this document cannot be
taken to reflect the official opinions of these
organizations.
Competing interests: The authors have declared
that no competing interests exist.

LMICs [28], making CATI a promising mode of mobile data collection for food security and
nutrition applications.
Changes in data collection mode may introduce bias and thereby alter the measures and
inferences generated from the data [29]. These biases mainly arise from two sources: sampling
biases and the interaction between the enumerator and respondent. When surveys are con-
ducted via mobile phones, those without access to mobile devices or networks are necessarily
excluded from the survey, potentially creating a non-coverage bias in estimates of population
level metrics. Although the digital divide is shrinking [30], cost is still a large barrier to mobile
phone ownership in the developing world [28], and mobile phone ownership often correlates
with wealth, particularly among poor or rural households [16, 31, 32]. As wealth is also gener-
ally correlated with better nutrition and food security [33, 34], this may bias estimates of popu-
lation level nutrition indicators measured with mobile phones. Survey mode may also alter the
non-response bias in the data, which results from differences in those who chose to participate
in mobile phone surveys or not. For example, women tend to be less trusting of calls from
unknown numbers than men [35], potentially limiting their participation in call-based
surveys.
A second source of bias results from the interactions between the respondent and the sur-
vey administrator (or lack thereof). During F2F interviews enumerators are able to observe the
local context of the respondent and possibly able to elicit accurate answers to survey questions
via informed interrogation. Alternatively, the degree of sociality or anonymity of the interview
process can also introduce bias in survey data [36]. In particular, respondents may be more
reluctant to give responses that they find socially undesirable the more social the survey pro-
cess is, due to physical or verbal presence of the survey administrator [37, 38]. Therefore, sur-
veys conducted via mobile phones, including via CATI, may be less subject to social-
desirability bias than those conducted via F2F interviews.
Here, we tested the accuracy and potential bias of using CATI to collect nutrition data
through a test-retest survey on two nutrition indicators in households in rural Kenya. While
Kenya has high rates of undernutrition, typical within sub-Saharan Africa (26% of children
under five are stunted, and 11% are underweight [39]), it also has the highest rates of mobile
penetration in East Africa (81 mobile subscriptions per 100 people compared to a regional
average of 53 [40]) and the lowest gender gap in phone ownership (7% compared to 13% for
Sub-Saharan Africa [35]), making Kenya an ideal country to evaluate the accuracy of data col-
lection with mobile phones. We hypothesized that CATI would generate (a) individual dietary
diversity scores equivalent to F2F, (b) equivalent population-level prevalence of dietary diver-
sity to F2F, but (c) a non-coverage bias resulting in higher estimates of dietary diversity among
phone users compared to non-phone users.
Materials and methods
Study sites
We selected Baringo and Kitui Counties in Kenya as study sites, as these counties differ in
socioeconomic and environmental conditions, mobile phone access and network coverage (S1
Table). Baringo County (0˚ 28’ N, 35˚ 59’ E) is characterized by mixed crop-livestock farming
systems in the highlands and pastoralism in the lowlands, and generally receives adequate rain-
fall for agriculture throughout the county [41]. In Baringo, approximately 52% of the popula-
tion is below poverty line [42], 30% of children are stunted [43], and 50% of the population
owns a mobile phone [16]. Kitui County (1˚ 22’ S, 38˚ 23’ E) is generally at lower elevation
than Baringo and is dominated by agro-pastoralism with sorghum, millet, and small livestock.
There is inadequate rainfall for agriculture in the easternmost parts of the county. Kitui has
Collecting nutrition data via mobile phones in Kenya
PLOS ONE | https://doi.org/10.1371/journal.pone.0210050 January 30, 2019 3 / 20

higher rates of poverty (60%), child stunting (46%), and lower mobile phone ownership (25%),
than Baringo (see above references).
Study locations within each county were selected through a combination of purposeful and
random sampling of administrative units. We included all districts within each county (Kitui
has two districts and Baringo four). Within each district in Kitui, we purposefully selected the
divisions with the highest and lowest number of households. From the two districts in Baringo
with the highest population, we purposefully selected the divisions with the lowest number of
households, while from the two districts with the lowest population, we selected the divisions
with the highest number of households, for a total of four divisions in each county. Within
each division, we randomly chose two sublocations, for a total of 32 sublocations representing
the economic and geographic variation within each county.
Indicators
We tested data collection mode with two internationally-validated nutrition indicators: Mini-
mum Dietary Diversity for Women (MDD-W) [44] and Minimum Acceptable Diet (MAD)
for infants and young children [45] (Table 1). MDD-W accesses the micronutrient adequacy
in the diet of women of reproductive age, a critical predictor of both maternal and child nutri-
tion. MAD assesses the adequacy of Infant and Young Child Feeding (IYCF) based on both
dietary diversity (MDD) and meal frequency (MMF). We also included a sociodemographic
indicator, the Kenya Progress Out of Poverty Index (PPI) [46] as a wealth proxy to assess dif-
ferences in mode effect on MDD-W and MAD by wealth. The indicators can be collected in
short surveys of approximately five minutes, do not rely on pictorial demonstrations of food
groups, and are calculated on a scorecard methodology based on respondents’ answers to sev-
eral questions. The indicators differ in target population, type of data generated in question
response, and conversion of scores to population prevalence (Table 1). To meet the threshold
for adequate dietary diversity, participants must have consumed at least five food groups out
of ten in the past 24 hours for MDD-W and four out of seven for MDD. Recommended MMF
is satisfied when either (a) breastfed infants less than nine months old eat at least twice a day,
Table 1. Summary of indicators.
Indicator Measures Target Population No.
Qs
Data Types Score Prevalence Conversion to
Prevalence
MDD-W: Minimum
Dietary Diversity for
Women
Micronutrient deficiency in
women of reproductive age
Women aged 15–49
years
10 Binary 0–10 Proportion of women
consuming at least 5 out of
10 food groups
Step function
MAD: Minimum
Acceptable Diet
IYCF, children’s
undernutrition
Caretakers of
children aged 6–23.99
months
15 Binary
Continuous
P/F Proportion of children
consuming a minimum
acceptable diet
Compound step
function
MDD: Minimum
Dietary Diversity
IYCF, micronutrient
deficiency, stunting
Caretakers of
children aged 6–23.99
months
8 Binary 0–7 Proportion of IYC
consuming at least 4 out of 7
food groups
Step function
MMF: Minimum Meal
Frequency
IYCF, caloric deficiency,
wasting
Caretakers of
children aged 6–23.99
months
7 Continuous 0-1 Proportion of IYC
consuming an adequate
number of meals
Conditional1 step
function
PPI: Progress Out of
Poverty Index
Below Poverty line Adults 10 Binary
Continuous
Categorical
0–100 Likelihood of being below
poverty line
Logistic or
Exponential
function2
Sector, target population, survey length, data type, and conversion of score to prevalence for indicators in this study.1 MMF is considered a conditional step function because the inflection point of the function depends on the age and breastfeeding status of the child.2 The type of function used to convert PPI score to poverty likelihood depends on the definition of poverty used (e.g. national poverty line, $1.25/day, etc.).
https://doi.org/10.1371/journal.pone.0210050.t001
Collecting nutrition data via mobile phones in Kenya
PLOS ONE | https://doi.org/10.1371/journal.pone.0210050 January 30, 2019 4 / 20

(b) breastfed infants older than nine months eat at least three times per day, or (c) non-
breastfed infants regardless of age consume milk at least twice per day and other foods at least
four times per day. Both MDD and MMF criteria must be satisfied for MAD. Finally, PPI raw
scores are converted into below poverty-line (defined as $1.25/day) likelihoods using nonlin-
ear conversion tables [46]. Thus, we were able to examine the equivalence between modes at
three levels: population prevalence, individual indicator score, and responses to indicator
subquestions.
Experimental design
Two separate surveys were used concurrently for different target populations: MDD-W, PPI,
and basic demography for women of reproductive age, and MAD, PPI and basic demography
for adult caretakers of children aged 6–23.99 months. We used a test-retest design with four
treatment arms (T1-T4) to evaluate the effect of data collection mode on nutrition indicators
(Fig 1). In the main treatment arms T1 and T2, participants were interviewed with both CATI
and F2F modes. We included two control arms to the experimental design. For the first control
arm (T3), participants were interviewed via F2F mode in both rounds to understand potential
learning and/or temporal effects. A fourth arm (T4) of F2F interviews for respondents with no
phone access was included for MDD-W, to better understand non-coverage bias in conducting
studies via CATI. Phone access was defined as owning a mobile phone or having access to one
via intrahousehold sharing and was determined by asking potential participants.
Participants were systematically assigned to treatment arms during the test round, whereby
participants meeting the inclusion criteria for the indicators were alternately assigned to T1
and T2, and every sixth house visited per day was assigned to T3. For participants in T1 (CATI
first), phone numbers were collected and participants were called the next day. For partici-
pants in T2 and T3, F2F interviews were conducted immediately. In the retest round respon-
dents were re-interviewed using the other mode, e.g. participants in T1 were relocated and
Fig 1. Experimental design. Test-retest mode experiment on two nutrition indicators, MDD-W and MAD. Survey consisted of four treatment
arms: two main treatment arms testing for mode differences, arm 3 controlling for temporal effects and arm 4 controlling for non-coverage bias.
Target sample sizes are indicated.
https://doi.org/10.1371/journal.pone.0210050.g001
Collecting nutrition data via mobile phones in Kenya
PLOS ONE | https://doi.org/10.1371/journal.pone.0210050 January 30, 2019 5 / 20

interviewed F2F, while T2 participants were called via CATI. Participants in T3 were reinter-
viewed using F2F (Fig 1). The retest round occurred approximately nine days (8.7 ± 4.4 days)
following the first survey, accounting for activities such as market days that may have altered
diet choices when possible. G�Power [47] was used to calculate sample sizes to detect a mode
bias of 1.5 in population prevalence using McNemar’s Exact Test for paired nominal data,
assuming 25% of participants would switch indicator status (above or below threshold)
between rounds. Although attrition rates in mobile surveys can vary dramatically with mode
and location, for the sample size calculations we assumed a 15% attrition rate as CATI and F2F
have low attrition rates, and studies with only two rounds have lower attrition rates than panel
surveys [14]. For the power analyses, we used alpha = 0.2 and beta = 0.05 to minimize the rate
of false equivalences. The resulting target sample size was 1000 participants, which we split
evenly into the T1 and T2 arms. Control group sizes were chosen as 12.5% or 125 respondents
for F2F controls, and 20% or 200 respondents for no-phone controls.
Data collection
Thirty-two field enumerators (16 men and 16 women) and eight phone (3 men and 5 women)
operators were recruited from local populations in Baringo and Kitui Counties to ensure
familiarity with local languages, diets, and context. Enumerators and operators were trained
together for two days to standardize survey methodology and interpretation of responses. To
collect phone numbers and conduct F2F interviews, enumerator teams working simulta-
neously in Kitui and Baringo visited each identified sublocation in sequence. In each subloca-
tion, enumerators sampled households semi-randomly, as enumerators traveled between
households on foot, but were located in different parts of the sublocation, and did not sample
adjacent households. Household sampling continued until 70 suitable households were
identified for participation in the experiment. Only one participant was interviewed per
household.
Both enumerators and operators used the same survey instrument, Enketo (Ona, Nairobi,
Kenya and Washington, DC, USA), based on the Open Data Kit platform [48], to collect sur-
vey data. Operators used Enketo’s web form on desktops in United Nations World Food Pro-
gramme’s in-house call center in Nairobi to conduct CATI interviews, while enumerators used
a similar offline platform on tablets for the face-to-face surveys in the field. All data were
uploaded daily to a centralized ODK server from where raw data was then extracted and
analyzed.
Data analysis
We use F2F results as the “control” scores and CATI scores as the “treatment”, as F2F is the
standard mode of nutrition data collection. We evaluated effect of data collection mode in sev-
eral ways. First, paired t-tests evaluated mean score as a function of mode for participants that
received both CATI and F2F modes. At the population level, Kolmogorov-Smirnov tests com-
pared distributional differences (mean, variance, skew and kurtosis) of indicator scores
between modes. Equivalence Tests [49] against varying levels of difference assessed if differ-
ences by mode were clinically significant (large enough in magnitude to alter a nutritionist’s
interpretation of the resultant data). Linear mixed-effects models were used to examine survey
methodology effects on nutrition scores, such as mode bias, enumerator bias [50], or temporal
effects. Using a top-down approach [51], we first used the most complex fixed effects of inter-
est (a three-way interaction between survey mode, round and enumerator gender) and found
the optimal structure for the random effects (such as county and enumerator). Then, using the
Collecting nutrition data via mobile phones in Kenya
PLOS ONE | https://doi.org/10.1371/journal.pone.0210050 January 30, 2019 6 / 20

resulting random effects, we determined the optimal fixed-effects structure. For model selec-
tion we computed both Akaike’s Information Criterion (AIC) and the Bayesian Information
Criterion (BIC). Both AIC and BIC reward model explanatory power and penalize model com-
plexity, but BIC also accounts for the number of observations in the dataset [51]. Where AIC
and BIC disagreed on the best-fit model, we chose the model with the lowest AIC, in order to
guard against false negatives (e.g. declaring there in no effect of survey mode when there may
be). Differences in responses to indicator component questions at the individual level were
examined via McNemar’s Exact Test and paired t-tests for categorical and continuous data
respectively. Resulting p values were corrected for multiple testing using the false discovery
rate method [52].
Non-coverage bias was assessed by comparing dietary diversity, PPI, and demographic data
between the phone access and no phone access groups in the retest round for MDD-W. The
magnitude of the non-coverage bias, or the relative change in population-level estimates of die-
tary diversity by only surveying women with mobile phones, was estimated as
Relative Bias ¼N2
N1
�Y 1 ��Y 2ð Þ
�Y 1
Where �Y 1 and �Y 2 are the mean MDD-W scores for women with and without phone access,
respectively, andN2
N1
� �is the proportion of women without access to mobile phones [53]. We
estimated mobile phone access in our population from published sources [16, 35]. All data
analyses were conducted in R [54].
Ethical considerations
The study protocol received research clearance and ethical approval from Kenya’s National
Commission for Science, Technology and Innovation (NACOSTI), as well as the London
School of Hygiene and Tropical Medicine (LSHTM). All methods were performed in accor-
dance with NACOSTI and LSHTM guidelines. For all participants, oral informed consent was
obtained by the enumerator and/or operator before beginning each survey. All efforts were
made to ensure confidentiality of the participants. The data were stored in a password-pro-
tected computer and made accessible only to the core study team members. The analyses are
presented in an aggregate format, phone numbers have been deleted, and all data has been
anonymized. No incentives or remunerations were given for participation in this study.
Results
Survey completion
A total of 1,466 and 953 respondents for MDD-W and MAD, respectively, completed at least
one round of the study (S2 Table). Twenty-four percent of participants did not participate in
both survey rounds. Failure to reach participants twice was principally the result of unsuccess-
ful phone interviews (65% of failures), rather than inability to relocate participants for F2F
interviews (32% of failures). Inability to complete interviews via CATI, due to unanswered
calls, poor network connectivity, unavailable interviewees, or wrong numbers was 20.1%
across all indicators and locations (S2 Table). Subsequently, total sample sizes for MDD-W
were 788 respondents in the main treatment arms (T1 & T2), 191 respondents in the F2F-F2F
control arm (T3), and 210 in the no-phone control (T4). For MAD, 578 respondents were in
the main treatment arms (T1 & T2) and 126 in the F2F-F2F control arm (T3).
Collecting nutrition data via mobile phones in Kenya
PLOS ONE | https://doi.org/10.1371/journal.pone.0210050 January 30, 2019 7 / 20
Prevalence of adequate diet with mode
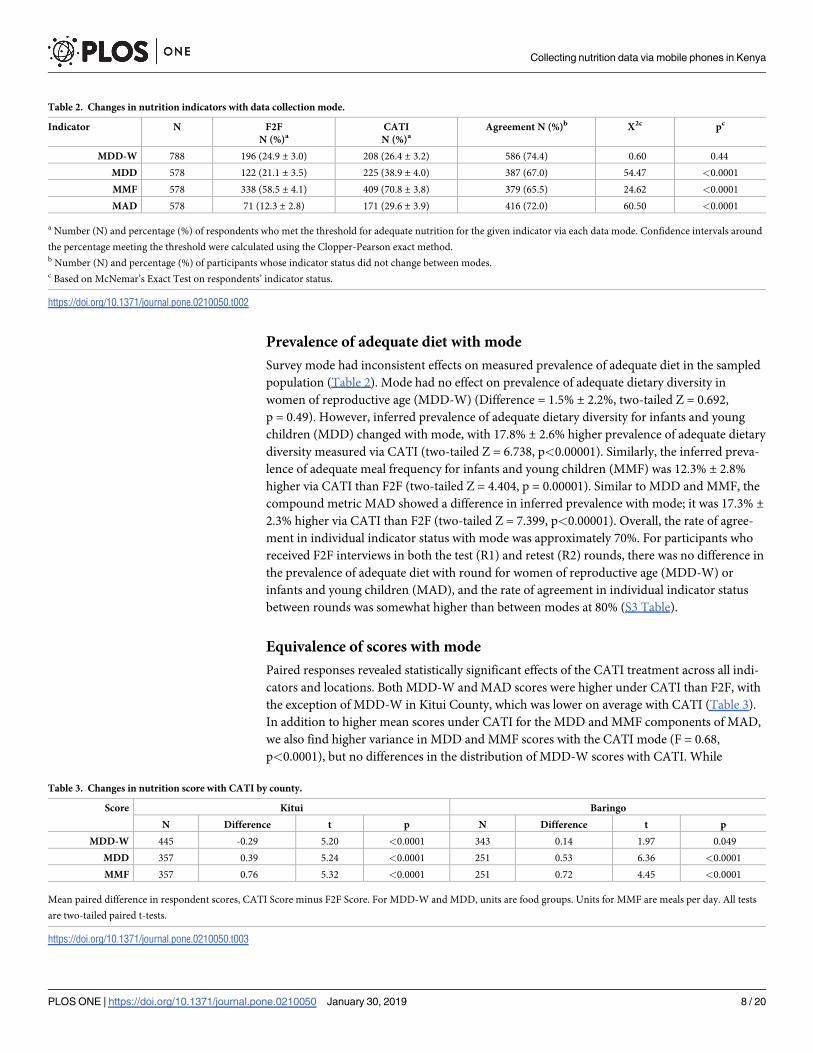
Survey mode had inconsistent effects on measured prevalence of adequate diet in the sampled
population (Table 2). Mode had no effect on prevalence of adequate dietary diversity in
women of reproductive age (MDD-W) (Difference = 1.5% ± 2.2%, two-tailed Z = 0.692,
p = 0.49). However, inferred prevalence of adequate dietary diversity for infants and young
children (MDD) changed with mode, with 17.8% ± 2.6% higher prevalence of adequate dietary
diversity measured via CATI (two-tailed Z = 6.738, p<0.00001). Similarly, the inferred preva-
lence of adequate meal frequency for infants and young children (MMF) was 12.3% ± 2.8%
higher via CATI than F2F (two-tailed Z = 4.404, p = 0.00001). Similar to MDD and MMF, the
compound metric MAD showed a difference in inferred prevalence with mode; it was 17.3% ±2.3% higher via CATI than F2F (two-tailed Z = 7.399, p<0.00001). Overall, the rate of agree-
ment in individual indicator status with mode was approximately 70%. For participants who
received F2F interviews in both the test (R1) and retest (R2) rounds, there was no difference in
the prevalence of adequate diet with round for women of reproductive age (MDD-W) or
infants and young children (MAD), and the rate of agreement in individual indicator status
between rounds was somewhat higher than between modes at 80% (S3 Table).
Equivalence of scores with mode
Paired responses revealed statistically significant effects of the CATI treatment across all indi-
cators and locations. Both MDD-W and MAD scores were higher under CATI than F2F, with
the exception of MDD-W in Kitui County, which was lower on average with CATI (Table 3).
In addition to higher mean scores under CATI for the MDD and MMF components of MAD,
we also find higher variance in MDD and MMF scores with the CATI mode (F = 0.68,
p<0.0001), but no differences in the distribution of MDD-W scores with CATI. While
Table 2. Changes in nutrition indicators with data collection mode.
Indicator N F2F
N (%)aCATI
N (%)aAgreement N (%)b X2c pc
MDD-W 788 196 (24.9 ± 3.0) 208 (26.4 ± 3.2) 586 (74.4) 0.60 0.44
MDD 578 122 (21.1 ± 3.5) 225 (38.9 ± 4.0) 387 (67.0) 54.47 <0.0001
MMF 578 338 (58.5 ± 4.1) 409 (70.8 ± 3.8) 379 (65.5) 24.62 <0.0001
MAD 578 71 (12.3 ± 2.8) 171 (29.6 ± 3.9) 416 (72.0) 60.50 <0.0001
a Number (N) and percentage (%) of respondents who met the threshold for adequate nutrition for the given indicator via each data mode. Confidence intervals around
the percentage meeting the threshold were calculated using the Clopper-Pearson exact method.b Number (N) and percentage (%) of participants whose indicator status did not change between modes.c Based on McNemar’s Exact Test on respondents’ indicator status.
https://doi.org/10.1371/journal.pone.0210050.t002
Table 3. Changes in nutrition score with CATI by county.
Score Kitui Baringo
N Difference t p N Difference t p
MDD-W 445 -0.29 5.20 <0.0001 343 0.14 1.97 0.049
MDD 357 0.39 5.24 <0.0001 251 0.53 6.36 <0.0001
MMF 357 0.76 5.32 <0.0001 251 0.72 4.45 <0.0001
Mean paired difference in respondent scores, CATI Score minus F2F Score. For MDD-W and MDD, units are food groups. Units for MMF are meals per day. All tests
are two-tailed paired t-tests.
https://doi.org/10.1371/journal.pone.0210050.t003
Collecting nutrition data via mobile phones in Kenya
PLOS ONE | https://doi.org/10.1371/journal.pone.0210050 January 30, 2019 8 / 20

differences in scores were numerically significant for all indicators and locations, the magni-
tude of the mode effect differed between MDD-W and MAD. For MDD-W, the mean differ-
ence between modes was 0.1 food groups (on a scale from 0–10). When converted into
percentage differences, the modes give equivalent scores for MDD-W at the level of 2% differ-
ence, but yield non-equivalent scores at the 1% level (Fig 2). The magnitude of differences in
score with mode was larger for the MAD components than with MDD-W. Overall, caregivers
reported that children consumed an average of 0.45 more food groups per day (on a scale of
0–7 food groups) and ate an average of 0.75 more meals per day (average number of meals per
day in this study was five, with 95% of scores falling at 10 or fewer meals per day) via CATI as
compared to F2F; therefore, scores for MDD and MMF are only equivalent between modes at
the 9% level (Fig 2).
Scores for all nutrition indicators were lower in the retest round than in the test round (S3
Table). On average, MDD-W scores were reduced by 0.1 food groups (paired t = 3.10,
p = 0.002), MDD by 0.22 food groups (paired t = 4.4, p<0.0001), and MMF by 0.2 meals per
day (t = 2.18, p = 0.029). This effect was seen regardless of data collection mode. When
accounting for differences in scores using linear mixed effects models, we found significant
conditional effects of enumerators and locations across all three nutrition indicator scores (S4
and S5 Tables), which explained more than 50% of the variance in each indicator (S6 Table).
Marginal effects of survey methodology explained a small but significant amount of residual
variation in nutrition indicator scores, however, the influence of survey mode, round, and
Fig 2. Equivalence of CATI and F2F scores for all nutrition indicators. While CATI and F2F give equivalent metric scores at the 2% for
MDD-W, scores for MAD components MDD and MMF were only equivalent at the 9% level.
https://doi.org/10.1371/journal.pone.0210050.g002
Collecting nutrition data via mobile phones in Kenya
PLOS ONE | https://doi.org/10.1371/journal.pone.0210050 January 30, 2019 9 / 20

enumerator gender differed between indicators. For MDD-W, only enumerator gender had a
significant impact on dietary diversity score, with males tending to give lower scores by
0.6 ± 0.1 (t = -3.95) food groups regardless of survey mode or round (S6 Table). For MAD
components MDD and MMF, we found evidence for three-way interactions between survey
mode, round, and enumerator gender (Fig 3). In particular, we found that male enumerators
gave lower MDD and MMF scores in the retest survey round when conducting interviews
using CATI by 0.9 ± 0.3 food groups (t = -3.03) and 1.8 ± 0.6 meals per day (t = -3.22),
respectively.
Food group mode effects
The mode of survey collection affected answers to 40% of questions related to specific food
groups. Consumption of pulses was consistently reported more frequently via CATI than F2F
across both dietary diversity indicators (MDD-W in Table 4 and MDD in Table 5). In contrast,
reported dairy consumption was consistently higher in F2F interviews, except for consump-
tion of milk by infants in Kitui County. The effect of mode on reporting consumption of
locally uncommon food groups (those reported by less than 20% of the respondents, such as
eggs, fruit, and vitamin-A rich foods, see S7 and S8 Tables) differed between the two indica-
tors. In MDD-W, women tended to report more consumption of uncommon food groups
under F2F (e.g. meat consumption is consistently higher via F2F). However, consumption of
uncommon food groups was reported more frequently via CATI for the MDD module of
MAD. Notably, caregivers reported significantly more consumption of fruits and vegetables by
infants via CATI than F2F in both Kitui and Baringo Counties.
Non-response bias
In both the MDD-W and MAD surveys, respondents who did not participate in both rounds
were significantly younger and less likely to own a mobile phone than those who completed
both rounds of the survey (S9 Table). They were also less likely to live in a household where
Fig 3. Interactions between survey mode, round and enumerator gender on nutrition indicator scores. Predicted nutrition indicator scores
based on linear mixed-effects models for a) MDD-W in number of food groups, b) MAD MDD in number of food groups, and c) MAD MMF
in number of meals per day. While only enumerator gender had an effect on MDD-W score, there were significant three-way interactions
between enumerator gender, survey round and survey mode on MAD components MDD and MMF.
https://doi.org/10.1371/journal.pone.0210050.g003
Collecting nutrition data via mobile phones in Kenya
PLOS ONE | https://doi.org/10.1371/journal.pone.0210050 January 30, 2019 10 / 20

the male head was formally employed; however, they did not differ in their likelihood of pov-
erty as measured by PPI score, or in their education level. While non-respondents in the
MDD-W survey did not differ from respondents in their MDD-W scores, in the MAD survey,
non-respondents had lower MDD and MMF scores than those who completed both rounds of
the survey.
Non-coverage bias
Across all of the treatment arms, rounds and locations, dietary diversity and adequacy scores
were correlated with measures of wealth such as the progress out of poverty (PPI) score (S10
and S11 Tables). PPI was also correlated with the number of phones owned by a household.
When we look at participants in the T4 “no phone” control arm, we find that women without
Table 4. Comparison of MDD-W food group reporting via CATI in Kitui and Baringo counties.
Kitui (n = 445) Baringo (n = 343)
Food Group Agreement (%)a Δ Nb X2c pc Agreement (%)a Δ Nb X2c pc
Grains 98 -5 3.13 0.139 100 0 0 1.00
Pulses 76 +25 5.38 0.045 66 +46 18.1 <0.001
Dairy 67 -72 35.75 <0.001 74 -52 28.9 <0.001
Dark Greens 73 -15 1.65 0.257 80 +4 0.06 0.911
Vegetables 56 -4 0.12 0.821 51 +68 50.7 <0.001
Fruits 85 -14 2.56 0.165 79 -8 0.51 0.617
Meat 91 -21 11.61 0.003 89 -23 12.4 0.001
Eggs 98 0 0 1.00 91 -5 0.52 0.617
Vitamin A 90 -20 8.56 0.010 87 -8 1.07 0.540
Nuts & Seeds 100 0 NA NA 98 -1 0 1
a Percentage of respondents who reported the same consumption (either yes or no) of the food group under CATI and F2F.b The number of respondents who reported consuming that food group under CATI minus the number under F2F.c Based on McNemar’s Exact Test on respondents’ reporting under CATI vs. F2F and corrected for multiple testing with the false discovery rate method.
https://doi.org/10.1371/journal.pone.0210050.t004
Table 5. Comparison of MDD food group reporting via CATI in Kitui and Baringo counties.
Kitui (n = 357) Baringo (n = 251)
Food Group Agreement (%)a Δ Nb X2c pc Agreement (%)a Δ Nb X2c pc
Grains 90 -7 0.28 0.825 94 +4 2.4 0.330
Pulses 66 +22 4.01 0.083 62 +5 0.26 0.959
Milk 64 +37 12.34 0.001 87 -22 9.8 0.007
Other Dairy 98 0 0 1 99.6 +1 0 1
Meat 93 +2 0.042 0.924 94 -2 0.06 1
Eggs 94 +2 0.056 0.924 92 +2 0.05 1
Vitamin A 71 -10 0.52 0.739 64 +39 16.2 <0.0001
Fruits & Vegs 59 +73 41.2 <0.0001 48 +98 72.4 <0.0001
Fortified Foods 80 +37 19.34 <0.0001 94 +6 1.56 0.462
Breastfed Ever 97 +5 4.9 0.059 96 +2 0.9 0.623
Breastfed Yesterday 88 -21 7.23 0.019 90 -3 0 1
a Percentage of respondents who reported the same consumption (either yes or no) of the food group under CATI and F2F.b The number of respondents who reported consuming that food group under CATI minus the number under F2F.c Based on McNemar’s Exact Test on respondents’ reporting under CATI vs. F2F and corrected for multiple testing with the false discovery rate method.
https://doi.org/10.1371/journal.pone.0210050.t005
Collecting nutrition data via mobile phones in Kenya
PLOS ONE | https://doi.org/10.1371/journal.pone.0210050 January 30, 2019 11 / 20

mobile phone access differed significantly from women with access (personal or household) in
terms of their age, education level, and household characteristics (Table 6). Women without
mobile phone access tended to be younger (-2 years, t = 2.73, pcor = 0.025) and were more
likely to have not completed any level of schooling (X2 = 5.89, pcor = 0.039). They were also
more likely to live in households without a male head (X2 = 15.23, pcor<0.0001), and more
likely to fall below the poverty line (+10% more likely, t = -4.86, pcor<0.0001). Despite these
differences, however, lack of phone access was not correlated with a difference in MDD-W
score (t = 1.85, pcor = 0.108). Given national mobile phone ownership rates for women in
Kenya of 42.5% and weighting scores only based on phone ownership, the estimated relative
bias for conducting nutrition surveys over mobile phones is 6.8% (overestimation of total pop-
ulation MDD-W score by 6.8% or 0.24 food groups). However, reported rates of phone owner-
ship among women in our sample were much higher than the published national data for
Kenya (S9 Table). If instead we calculate relative bias using the reported rate of phone owner-
ship in our MDD-W survey of 85%, conducting nutrition surveys over mobile phones would
only overestimate population level MDD-W by 0.9%.
Discussion
In this study, we tested the utility of using computer assisted telephone interviewing (CATI)
for cost effective, large scale nutrition data collection amongst women in rural Africa. We
Table 6. Differences between target women with and without access to a mobile phone.
Phone Access No Phone Access t/X2 pcor
N 790 205
Age group15–19 6% (4%-8%) 11% (7%-16%) 5.05 0.050
20–29 35% (32%-39%) 39% (32%-46%) 0.94 0.397
30–39 35% (32%-39%) 30% (24%-37%) 1.79 0.272
40–49 24% (21%-27%) 20% (15%-27%) 0.83 0.437
Mean Age (years) 32.1 ± 8.6 30.2 ± 9.2 2.73 0.025
Education LevelNo school completed 11% (9%-14%) 18% (13%-24%) 5.89 0.039
Completed primary 65% (62%-69%) 61% (54%-68%) 0.96 0.420
Completed secondary 17% (15%-20%) 18% (13%-24%) 0.03 0.910
Post-secondary 6% (4%-8%) 2% (0%-6%) 3.37 0.108
Male EmploymentNo male head 13% (11%-16%) 25% (19%-31%) 15.23 0.0006
Not formally employed 62% (59%-66%) 64% (57%-70%) 0.12 0.819
Labor employment 9% (7%-11%) 4% (2%-8%) 5.08 0.050
Non-labor employment 11% (9%-13%) 5% (2%-9%) 6.28 0.036
Other 4% (3%-6%) 2% (0%-6%) 1.05 0.420
Household CharacteristicsHousehold Size 6.6 ± 2.4 6.1 ± 2.2 2.93 0.018
PPI Score 36.9 ± 14.9 31.6 ± 13.7 4.79 <0.0001
Poverty Likelihood 48.2% ± 28.3% 58.5% ± 26.7% -4.86 <0.0001
Nutrition IndicatorsMDD-W 3.57 ± 1.24 3.39 ± 1.21 1.85 0.108
Data are proportions plus 95% confidence intervals unless otherwise noted. Differences were tested with X2 or t-tests for proportion or continuous data, respectively. All
p values were corrected for multiple comparisons using false discovery rate methods.
https://doi.org/10.1371/journal.pone.0210050.t006
Collecting nutrition data via mobile phones in Kenya
PLOS ONE | https://doi.org/10.1371/journal.pone.0210050 January 30, 2019 12 / 20

found that changing the data collection mode from traditional face-to-face (F2F) interviews to
CATI resulted in higher nutrition indicator scores, but not for all indicators tested among
rural women in Kenya. Dietary diversity scores did not differ in a clinically significant way
(mean difference of less than 2%) with the mode of data collection when women were asked
about their own diet, meaning that the inferenced population prevalence of adequate dietary
diversity for women of reproductive age would have been the same regardless of the mode of
data collection. In contrast, when women were asked about the diet of infants and young chil-
dren in their care, the scores for MDD and MMF generated via CATI were 11–14% higher
than those generated for the same child when the survey was administered F2F. This large dif-
ference in score between modes raised the inferred population prevalence of adequate dietary
diversity (MDD, 18%), meal frequency (MMF, 12%), and overall diet (MAD, 17%) for infants
and young children in our study populations. This mode effect also interacted with other sur-
vey methodology parameters, including survey round and the gender of the enumerator.
Thus, we detected a significant, but inconsistent mode effect for nutrition data collection from
rural women with mobile phones.
The observed difference in mode effect between MDD-W and MAD indicators could arise
from several sources including: the types of data generated, the conversion between responses
and indicator, the sensitivity of the indicator to the given local conditions, or the social percep-
tion of the questions asked. Both MDD-W and MAD ask participants to recall what they
(or children within their care) ate in the previous 24 hours, and enumerators convert the
responses into binary yes/no food group consumption scores, making it unlikely that differ-
ences in the types of data generated could lead to observed mode effects. Indeed, mode effects
were observed for infant dietary diversity scores (MDD) but not for women’s dietary diversity
scores (MDD-W). In contrast to MDD-W, MAD is a compound indicator that relies on meet-
ing thresholds in two sub-indicators (MMF and MDD). MMF relies on participants giving a
free, numeric response to questions on the frequency of consumption of milk, other milk
products, semi-solid food and infant formula in the past 24 hours. Although, a mode effect
in just one module of MAD would generate a mode effect in the compound indicator, we
observed similar magnitude and direction of mode effects for both MDD and MMF compo-
nents towards higher dietary diversity and more frequent meals reported via CATI. Therefore,
it is unlikely that the observed differences in mode effect between MDD-W and MAD arose
from differences in data type or conversion between score and prevalence.
Alternatively, the difference may be the consequence of the type of information asked with
MAD. Questions that are considered sensitive, because they may reveal embarrassing or unde-
sirable information about the respondent have been shown to show strong social-desirability
bias, and the magnitude of this bias can change with survey mode [36–38]. In general, respon-
dents tend to give more socially-desirable answers the more social the survey process is. For
example, in Zimbabwe, youth were more likely to respond to sensitive questions about sexual
health in both self-administered questionnaires with no interviewer and audio computer-assis-
ted calls than in face-to-face interviews [55]. While social desirability may strongly affect self-
reported responses in terms of dietary intake [56], asking a caregiver about the diet of infants
in their care and their breastfeeding practices may be much more sensitive, and thus subject to
stronger social-desirability bias than questions about their own eating habits or household
assets. If infant care is more socially-sensitive than personal diet, this may explain why we see a
mode effect of CATI with the MAD indicator, but not MDD-W.
Although we find evidence of a mode bias in potentially sensitive survey questions, the
directionality of the bias is opposite to that predicted by social-desirability. We found that the
less-social survey methodology of CATI actually resulted in higher nutrition indicator scores
compared to F2F. While both F2F and CATI involve social interactions with an administrator
Collecting nutrition data via mobile phones in Kenya
PLOS ONE | https://doi.org/10.1371/journal.pone.0210050 January 30, 2019 13 / 20

in the same local language, we suspect that discomfort with receiving calls on mobile phones
might have led to respondents giving more socially-desirable answers via CATI compared to
F2F. Security concerns (including calls from unknown numbers, harassment, fraud, and
spam) are the third largest barrier to women’s mobile phone use in Kenya after cost and net-
work access [35]. Therefore, conducting nutrition interviews via CATI calls to mobile phones
may have made the respondents less comfortable and thus more susceptible to the social-desir-
ability bias than F2F interviews, resulting in the observed higher scores on MAD via CATI.
We also found evidence of enumerator gender effects on nutrition indicator scores. Male
enumerators tended to record lower scores by more than half of a food group than female enu-
merators for MDD-W. For both components of MAD, enumerator gender interacted with
survey mode and round. Men also tended to record lower nutrition indicator scores in the
retest round of the survey when using CATI for MDD and MMF. Biases due to enumerator
gender have been increasingly documented in the developing world [50] and are most com-
mon when survey questions deal with gender-sensitive topics [57]. MDD-W and MAD both
rely on 24-hour recall methods and require enumerators to be familiar with the components
of dishes and to probe respondents about aspects of their diet. Meal preparation is still largely
the responsibility of women in Kenyan societies, which may mean that men are less familiar
with the components of common dishes, and thus the food groups consumed. While gender
biases in data recording have been well documented, how those biases interact with data col-
lection mode and technology is less well known and deserves further study.
Collecting data via different survey modes can create sampling biases, when the reachable
population via said mode differs from the general population (non-coverage bias), or when the
participating population differs from the population that does not participate (non-response
bias). A non-coverage bias is particularly important when data are intended to give informa-
tion on aggregate level conditions. For example, in countries such as the United States and
Australia, surveys conducted via landline telephones may generate substantial non-coverage
bias as younger people are less likely to have landline telephones, skewing national estimates of
demographic characteristics, health status [58], alcohol use [59], or election results [60]. In
Sub-Saharan Africa, where mobile phone ownership is largely correlated with wealth and the
majority of mobile phones are owned by men, conducting surveys via mobile phones may gen-
erate a non-coverage bias by disproportionately excluding the less wealthy and women. In this
study, we also found that women of reproductive age who do not have personal or household
mobile phones were significantly younger and less wealthy (as measured by PPI) than women
who did have access to mobile phone. They also had marginally lower dietary diversity than
women with mobile phone access, resulting in an estimated bias of 1–7% in MDD-W score
from surveying only women with mobile phones. This magnitude of bias (0.03–0.25 food
groups out of a mean score of 3.6 food groups) would not have changed the inferred popula-
tion prevalence of adequately diverse diet among women of reproductive age. However, stud-
ies that intend to measure or monitor nutrition status with mobile calling among a broader
population segment (e.g. including men and women, a larger age range, or both rural and
urban populations) should weight survey results not only by the relative mode bias [53] but
also by the demographics of the sampled population relative to the overall population [59].
While mobile phone surveys in rural Africa are likely to only select certain subpopulations,
whether this bias will affect population level estimates of nutrition will depend on the
proportion of the population that can be reached by mobile and the nutrition status of the
population.
Even within the reachable population for a given mode, there may be differences between
those who choose to participate in a survey, and those who choose not to. We found significant
differences in mobile phone ownership, network access, and age between women who
Collecting nutrition data via mobile phones in Kenya
PLOS ONE | https://doi.org/10.1371/journal.pone.0210050 January 30, 2019 14 / 20

participated in both rounds of the nutrition survey and those who did not, either due to a
missed or incomplete CATI call or a missed F2F interview. While these differences did not
result in any differences in MDD-W among women of reproductive age, non-respondent care-
takers of young children did report lower dietary diversity and lower meal frequency than
those who participated in both rounds of the MAD survey. This likely reflects a nonrandom
bias, whereby the likelihood of participating in the survey (via mobile phone ownership) is
also correlated with the nutrition indicators of interest (higher infant nutrition indicators
when measured by mobile interviews) [61]. This may explain why we see lower MAD scores
but not lower MDD-W scores among non-responders, despite lower phone ownership and
younger age for non-responders in both surveys.
Although we found substantial evidence for both a bias in data collected via CATI, a non-
coverage bias among women who could not be reached via mobile phones, and a non-response
bias among women who did not complete the survey, evidence of bias with survey mode does
not necessarily invalidate the mode. Consistent bias may actually increase the utility of the
mode [62], particularly when results can be calibrated (due to bias in score) or weighed to be
representative (due to non-coverage bias) [53, 59]. We find that across indicators and loca-
tions, there was a consistent tendency for participants to report a better diet (higher dietary
diversity, more frequent meals for infants and young children) via CATI. Although we only
find marginal evidence of a non-coverage bias in terms of women’s dietary diversity, we did
find that women without mobile phones in our study area had fewer assets, and that fewer
assets was correlated with lower dietary adequacy. Based on our data, we estimate that con-
ducting nutrition surveys via CATI could increase measured dietary scores by as little as 0%
(no change) to as much as 25% (18% maximum mode effect + 7% maximum non-coverage
bias), with concomitant effects on population prevalence of dietary adequacy. The exact mag-
nitude of the bias will depend on the sensitivity of the survey questions to mode and the pro-
portion and demographics of the population with access to mobile phones.
Despite the potential biases in using mobile phones to collect household survey data, there
were numerous advantages to the mode. The cost of implementing the nutrition surveys was
substantially lower using CATI compared to conducting traditional face to face surveys in the
field. CATI costed US$ 5 per successful survey as compared to US$ 16 per successful survey
via F2F. Furthermore, the CATI mode allowed us to reach participants despite an outbreak of
insecurity in two of our sub-locations during the study. We also found high participation rates
in the mobile phone administered surveys (approximately 75% participation), which is higher
than mobile participation experienced in other CATI surveys in LMICs that do not provide
phones to participants [14]. Early sensitization of communities in partnership with trusted
local agencies, as well as multiple call attempts may have helped to increase participation in
this study. Thus, mobile phones could be an important tool for monitoring vulnerable popula-
tions in places of high insecurity and geographical inaccessibility, as well as in situations where
resources are limited.
In summary, our findings suggest that CATI can be used to successfully and cost-effectively
collect MDD-W and MAD nutrition data among rural women in Kenya. Although dietary
data collected via CATI is biased towards higher dietary diversity and more adequate diets for
infants and young children as measured by MAD, this bias is consistent across locations and
indicators, and may be corrected for if data collected via CATI must be compared to data col-
lected via traditional F2F surveys. No mode effect of CATI was detected for women’s dietary
diversity (MDD-W). Additionally, where mobile penetration rates are high, and the mobile
accessible population does not differ from the population of interest, the non-coverage from
excluding participants without mobile phones can be negligible. If nutrition data do not need
to be benchmarked against F2F data and mobile penetration is high, then CATI can provide a
Collecting nutrition data via mobile phones in Kenya
PLOS ONE | https://doi.org/10.1371/journal.pone.0210050 January 30, 2019 15 / 20

particularly cost-effective method of collecting longitudinal nutrition data, even in rural com-
munities and in areas of insecurity.
Supporting information
S1 Table. Study site characteristics.
(DOCX)
S2 Table. Survey success rates by mode and indicator.
(DOCX)
S3 Table. Changes in nutrition indicators with round. Changes in nutrition indicators with
round for participants who received F2F interviews in both rounds (T3).
(DOCX)
S4 Table. Mixed effects model selection.
(DOCX)
S5 Table. Mixed effects model variance components.
(DOCX)
S6 Table. Mixed effects model results. Fixed effect results from best-fit models of nutrition
indicators as a function of survey mode, round, and enumerator gender.
(DOCX)
S7 Table. Frequency of food group reporting. Frequency of food group reporting via CATI
and F2F in Baringo and Kitui Counties for MDD-W.
(DOCX)
S8 Table. Frequency of food group reporting. Frequency of food group reporting via CATI
and F2F in Baringo and Kitui Counties for the MDD component of MAD.
(DOCX)
S9 Table. Differences between responders and non-responders. Demographic, mobile
access, and dietary adequacy differences between respondents who completed both rounds of
the test-retest survey, and those who did not.
(DOCX)
S10 Table. Correlations among MDD-W and demographic indicators.
(DOCX)
S11 Table. Correlations among MAD and demographic indicators.
(DOCX)
Acknowledgments
We thank the WFP Kenya Country Office for their logistical and technical support for the
study, particularly D. Wanambwa, P. Akwanyi, F. Nyamai, H. Rutto, A. Karissa, C. Ntoburi
and M. Abukar. K. Ogden, N. Aburto, and other members of the WFP HQ Nutrition Division
and the Vulnerability and Analysis Mapping Unit provided valuable guidance on study design
and feedback on the manuscript. We thank the team of enumerators and operators who assis-
ted with data collection, as well as N. Namoi and N. M. El Sobky who assisted with data analy-
sis. Local partners including the National Drought Management Authority (NDMA) and
Caritas in Kitui County, and World Vision in Baringo County were instrumental in facilitating
Collecting nutrition data via mobile phones in Kenya
PLOS ONE | https://doi.org/10.1371/journal.pone.0210050 January 30, 2019 16 / 20

the study. We also thank Peter Steward (U. Leeds), Editor Brady T. West, and four anonymous
reviewers for comments and guidance which greatly improved the manuscript.
Author Contributions
Conceptualization: Christine Lamanna, Kusum Hachhethu, Sabrina Chesterman, Beatrice
Mwongela, Mary Ng’endo, Suneetha Kadiyala, Jean-Martin Bauer, Todd S. Rosenstock.
Data curation: Christine Lamanna, Kusum Hachhethu.
Formal analysis: Christine Lamanna, Gaurav Singhal.
Funding acquisition: Suneetha Kadiyala, Jean-Martin Bauer, Todd S. Rosenstock.
Methodology: Christine Lamanna, Kusum Hachhethu, Sabrina Chesterman, Gaurav Singhal,
Beatrice Mwongela, Mary Ng’endo, Silvia Passeri, Arghanoon Farhikhtah, Suneetha
Kadiyala, Jean-Martin Bauer, Todd S. Rosenstock.
Project administration: Kusum Hachhethu, Sabrina Chesterman, Todd S. Rosenstock.
Resources: Kusum Hachhethu, Todd S. Rosenstock.
Supervision: Christine Lamanna, Kusum Hachhethu, Sabrina Chesterman, Beatrice Mwon-
gela, Mary Ng’endo, Silvia Passeri, Arghanoon Farhikhtah, Todd S. Rosenstock.
Visualization: Christine Lamanna.
Writing – original draft: Christine Lamanna.
Writing – review & editing: Christine Lamanna, Kusum Hachhethu, Sabrina Chesterman,
Gaurav Singhal, Beatrice Mwongela, Mary Ng’endo, Silvia Passeri, Arghanoon Farhikhtah,
Suneetha Kadiyala, Jean-Martin Bauer, Todd S. Rosenstock.
References1. Bhutta ZA, Das Jk, Rizvi A, Gaffey MF, Walker N, Horton S, et al. Evidence-based interventions for
improvement of maternal and child nutrition: what can be done and at what cost? Lancet. 2013;
382:452–477. https://doi.org/10.1016/S0140-6736(13)60996-4 PMID: 23746776
2. Black RE, Allen LH, Bhutta ZA, Caulfield LE, de Onis M, Ezzati M, et al. Maternal and child undernutri-
tion: global and regional exposures and health consequences. Lancet. 2008; 371:243–260. https://doi.
org/10.1016/S0140-6736(07)61690-0 PMID: 18207566
3. Victora CG, Adair L, Fall C, Hallal PC, Martorell R, Richter L, et al. Maternal and child undernutrition:
consequences for adult health and human capital. Lancet. 2008; 371:340–357. https://doi.org/10.1016/
S0140-6736(07)61692-4 PMID: 18206223
4. Arimond M, Ruel MT. Dietary diversity is associated with child nutritional status: Evidence from 11
demographic and health surveys. J Nutr. 2004; 134:2579–2585. https://doi.org/10.1093/jn/134.10.2579
PMID: 15465751
5. Haddad L, Hawkes C, Webb P, Thomas S, Beddington J, Waage J, et al. A new global research agenda
for food. Nature. 2016; 540:30–32. https://doi.org/10.1038/540030a PMID: 27905456
6. Ruel MT, Alderman H, the Maternal and Child Nutrition Study Group. Nutrition-sensitive interventions
and programmes: how can they help to accelerate progress in improving maternal and child nutrition?
Lancet. 2013; 382:536–551. https://doi.org/10.1016/S0140-6736(13)60843-0 PMID: 23746780
7. Osgood-Zimmerman A, Millear AI, Stubbs RW, Shields C, Pickering BV, Earl L, et al. Mapping child
growth failure in Africa between 2000 and 2015. Nature. 2018; 555:41–47. https://doi.org/10.1038/
nature25760 PMID: 29493591
8. Rosenstock TS, Lamanna C, Chesterman S, Hammond J, Kadiyala S, Luedeling E, et al. When less
is more: Innovations for tracking progress toward global targets. Curr Opin Environ Sustain. 2017;
26:54–61.
9. Shepherd K, Hubbard D, Fenton NE, Claxton K, Luedeling E, de Leeuw J. Development goals should
enable decision-making. Nature. 2015; 532:152–154.
Collecting nutrition data via mobile phones in Kenya
PLOS ONE | https://doi.org/10.1371/journal.pone.0210050 January 30, 2019 17 / 20

10. Panel Global. Improved metrics and data are needed for effective food system policies in the post-2015
era. London: Global Panel on Agriculture and Food Systems for Nutrition; 2015.
11. Dabalen A, Etang A, Hoogeveen J, Mushi E, Schipper Y, von Engelhardt J. Mobile phone panel surveys
in developing countries: a practical guide for micro data collection. Washington, DC: The World Bank;
2016.
12. Hammond J, Fraval S, van Etten J, Suchini JG, Mercado L, Pagella T, et al. The Rural Household Multi-
Indicator Survey (RHoMIS) for rapid charaterisation of households to inform climate smart agriculture
interventions: Description and applications in East Africa and Central America. Agric Syst. 2017;
151:225–233.
13. Morrow N, Mock N, Bauer J-M, Browning J. Knowing just in time: Use cases for mobile surveys in the
humanitarian world. Proc Engin. 2016; 159:210–216.
14. Gibson DG, Pereira A, Farrenkopf BA, Labrique AB, Pariyo G, Hyder AA. Mobile Phone Surveys for
Collecting Population-Level Estimates in Low-and Middle-Income Countries: A Literature Review. J
Med Internet Res. 2017; 19(5):e139. https://doi.org/10.2196/jmir.7428 PMID: 28476725
15. GSMA Intelligence. The Mobile Economy Africa 2016. London: GSM Association; 2016.
16. Wesolowski A, Eagle N, Noor AM, Snow RW, Buckee CO. Heterogeneous mobile phone ownership
and usage patterns in Kenya. PLoS ONE. 2012; 7(4):e35319. https://doi.org/10.1371/journal.pone.
0035319 PMID: 22558140
17. Aranda-Jan CB, Mohutsiwa-Dibe N, Loukanova S. Systematic review on what works what does not
work and why of implementation of mobile health (mHealth) projects in Africa. BMC Public Health.
2014; 14:188. https://doi.org/10.1186/1471-2458-14-188 PMID: 24555733
18. Rosskam E, Hyder AA. Using mHealth to Predict Noncommunicable Diseases: A Public Health Oppor-
tunity for Low- and Middle-Income Countries. J Med Internet Res. 2017; 19(5):e129 https://doi.org/10.
2196/jmir.7593 PMID: 28476727
19. Hoogeveen J, Croke K, Dabalen A, Demombynes G, Giugale M. Collecting high frequency panel data
in Africa using mobile phone interviews. Rev Can Etudes Dev. 2014; 35(1):186–207.
20. Mock N, Singhal G, Olander W, Pasquier JB, Morrow N. mVAM: A new contribution to the information
ecology of humanitarian work. Proc Engin. 2016; 159:217–221.
21. Toninelli D, Pinter R, de Pedraza R (eds). Mobile Research Methods: Opportunities and challenges of
mobile research methodologies. London: Ubiquity Press; 2015.
22. Greenleaf AR, Gibson DG, Khattar C, Labrique AB, Pariyo GW. Building the Evidence Base for Remote
Data Collectio in Low- and Middle-Income Countries: Comparing Reliability and Accuracy Across Sur-
vey Modalities. J Med Internet Res. 2017; 19(5):e140. https://doi.org/10.2196/jmir.7331 PMID:
28476728
23. Janevic MR, Aruquipa Yujra AC, Marinec N, Aguilar J, Aikens JE, Tarrazona R, Piette JD. Feasibility of
an interactive voice response system for monitoring depressive symptoms in a lower-middle income
Latin American country. J Ment Health Sys. 2016; 10:59.
24. Chakraborty D, Medhi I, Cutrell E, Thies W. Man vs Machine: Evaluating IVR versus a live operator for
phone surveys in India. Proceedings of the 3rd ACM Symposium on Computing for Development; 2013.
25. Sharma Grover A, Stewart O, Lubensky D. Designing Interactive Voice Response (IVR) interfaces:
Localisation for low literacy users. Proceedings of Computers and Advanced Technology in Education;
2009.
26. Ballivian A, Azevedo J, Durbin W, Rios J, Godoy J, Borisova C. Using mobile phones for high-frequency
data collection. In: Tonninelli D, Pinter R, de Pedraza P, (eds). Mobile Research Methods: Opportunities
and Challenges of Mobile Research Methodologies. London: Ubiquity Press; 2015:21–39.
27. Perrier T, DeRenzi B, Anderson R. USSD: The third universal app. Proceedings of the 2015 Annual
Symposium on Computing for Development. 2015; 13–21.
28. GSMA Intelligence. The Mobile Economy 2017. London: GSM Association; 2017.
29. Bowling A. Mode of questionnaire administration can have serious effects on data quality. J Public
Health (Oxf). 2005; 27(3):281–291.
30. Tran MC, Labrique AB, Mehra S, Ali H, Shaikh S, Mitra M, Christian P, West K Jr. Analyzing the Mobile
“Digital Divide”: Changing Determinants of Household Phone Ownership Over Time in Rural Bangla-
desh. J Med Internet Res mHealth uHealth. 2015; 3(1):e24.
31. Aker JC, Mbiti IM. Mobile phones and economic development in Africa. J Econ Perspect. 2010; 24:207–
232.
32. Blumenstock J, Cadamuro G, On R. Predicting poverty and wealth from mobile phone metadata. Sci-
ence. 2015; 350:1073–1076. https://doi.org/10.1126/science.aac4420 PMID: 26612950
Collecting nutrition data via mobile phones in Kenya
PLOS ONE | https://doi.org/10.1371/journal.pone.0210050 January 30, 2019 18 / 20

33. Wagstaff A. Poverty and health sector inequalities. Bull World Health Org. 2002; 80:97–105. PMID:
11953787
34. Van de Poel E, Hosseinpoor AR, Speybroeck N, Van Ourti T, Vega J. Socioeconomic inquality in malnu-
trition in developing countries. Bull World Health Org. 2008; 86:282–291. https://doi.org/10.2471/BLT.
07.044800 PMID: 18438517
35. GSMA. Bridging the gender gap: mobile access and usage in low- and middle-income countries. Lon-
don: GSM Association; 2015.
36. Kreuter F, Presser S, Tourangeau R. Social desirability bias in CATI, IVR, and web surveys. Public
Opin Q. 2008; 72(5):847–865.
37. Tourangeau R, Yan T. Sensitive Questions in Surveys. Psychol Bull. 2007; 133:859–883. https://doi.
org/10.1037/0033-2909.133.5.859 PMID: 17723033
38. Pascoe SJS, Hargreaves JR, Langhaug LF, Hayes RJ, Cowan FM. “How Poor Are You?”–A Compari-
son of Four Questionnaire Delivery Modes for Assessing Socio-Economic Position in Rural Zimbabwe.
PLOS ONE. 2013; 8(9):e74977. https://doi.org/10.1371/journal.pone.0074977 PMID: 24073230
39. UNICEF, World Health Organization, World Bank Group; 2016 [cited 2017 Mar 6]. Database: Child mal-
nutrition estimates. http://data.unicef.org.
40. ITU; 2016 [cited 2017 Feb 20]. Data: Mobile-cellular telephone subscriptions 2000–2015. http://www.
itu.int/en/ITU-D/Statistics/Pages/stat/default.aspx.
41. Jaetzold R, Hornetz B, Shisanya CA, Schmidt H. Farm management handbook of Kenya Vol I-IV (West-
ern Central Eastern Nyzana Southern Rift Valley Northern Rift Valley Coast). Nairobi: Government
Printers; 2005–2012.
42. Kenya National Bureau of Statistics. Economic Survey 2014. Nairobi: Kenya National Bureau of Statis-
tics; 2014.
43. Kenya National Bureau of Statistics, Ministry of Health, National AIDS Control Council, Kenya Medical
Research Institute, National Council for Population and Development, The DHS Program, et al. Kenya
Demographic and Health Survey 2014. Nairobi: Kenya National Bureau of Statistics; 2015.
44. Food and Agricultural Organization of the United Nations, FHI 360. Minimum Dietary Diversity for
Women: A Guide for Measurement. Rome: Food and Agricultural Organization of the United Nations;
2016.
45. World Health Organization. Indicators for assessing infant and young child feed practices. Geneva:
World Health Organization; 2010.
46. Schreiner M. Kenya Progress Out of Poverty Index. New Haven, CT: Innovations for Poverty Action;
2011.
47. Faul F, Erdfelder E, Lang AG, Buchner A. G*Power: A flexible statistical power analysis program for the
social, behavioral and biomedical sciences. Behavior Res Meth. 2007; 39:175–191.
48. Brunette W, Sundt M, Dell N, Chaudhri R, Breit N, Borriello G. Open Data Kit 2.0: Expanding and refin-
ing information services for developing regions. Proceedings of the 14th Workshop on Mobile Comput-
ing Systems and Applications. 2013; 10.
49. Wellek S. Testing statistical hypotheses of equivalence and noninferiority. Boca Raton, FL: CRC
Press; 2010.
50. West BT, Blom AG. Explaining interviewer effects: A research synthesis. J Surv Stat Meth. 2017;
5:175–211.
51. Zuur AF, Ieno EN, Walker NJ, Saveliev AA, Smith GM. Mixed Effects Models and Extensions in Ecology
with R. New York, NY: Springer; 2009.
52. Benjamini Y, Hochberg Y. Controlling the false discovery rate: A practical and powerful approach to mul-
tiple testing. J R Stat Soc Ser B. 1995; 57(1):289–300.
53. Hu SS, Balluz L, Battaglia MP, Frankel MR. Improving public health surveillance using a dual-frame sur-
vey of landline and cell phone numbers. Am J Epidemiol. 2011; 173(6):703–711. https://doi.org/10.
1093/aje/kwq442 PMID: 21343246
54. R Core Team. R: A language and environment for statistical computing. R Foundation for Statistical
Computing. 2015. https://www.R-project.org/.
55. Langhaug LF, Cheung YB, Pascoe SJS, Chirawu P, Woelk G, Hayes RJ, Cowan FM. How you ask
really matters: randomized comparison of four sexual behavior questionnaire delivery modes in Zimba-
bwean youth. Sex Transm Infect. 2011; 87:165–173. https://doi.org/10.1136/sti.2009.037374 PMID:
20943824
56. Herbert JR, Clemow L, Pbert L, Ockene IS, Ockene JK. Social desirability bias in dietary self-report
may compromise the validity of dietary intake measures. Int J Epidemiol. 1995; 24(2):389–398. PMID:
7635601
Collecting nutrition data via mobile phones in Kenya
PLOS ONE | https://doi.org/10.1371/journal.pone.0210050 January 30, 2019 19 / 20

57. Lupu N, Michelitch K. Advances in survey methods for the developing world. An Rev Pol Sci. 2018;
21:195–214.
58. Link MW, Battaglia MP, Frankel MR, Osborn L, Mokdad AH. Reaching the US cell phone generation:
Comparison of cell phone survey results with an ongoing landline telephone survey. Public Opin Q.
2007; 71(5):814–839.
59. Livingston M, Dietze P, Ferris J, Pennay D, Hayes L, Lenton S. Surveying alcohol and other drug use
through telephone sampling: a comparison of landline and mobile phone samples. BMC Med Res Meth.
2013; 13:41.
60. Keeter S. The impact of cell phone noncoverage bias on polling in the 2004 presidential election. Public
Opin Q. 2006; 70(1):88–98.
61. Groves RM, Peytcheva E. The impact of nonresponse rates on nonresponse bias: A meta-analysis.
Public Opin Q. 2008; 72(2):167–189.
62. Fisher RJ, Katz JE. Social-desirability bias and the validity of self-reported values. Psychol Mark. 2000;
17(2):105–120.
Collecting nutrition data via mobile phones in Kenya
PLOS ONE | https://doi.org/10.1371/journal.pone.0210050 January 30, 2019 20 / 20