Strengthening textiles and clothing sector in South Asia ...
61
Strengthening textiles and clothing sector in South Asia: Nepal report By Paras Kharel* and Prawol Bhattarai South Asia Watch on Trade, Economics and Environment (SAWTEE), Kathmandu Revised version, December 2012 *Research Coordinator, SAWTEE (email: [email protected])
Transcript of Strengthening textiles and clothing sector in South Asia ...

Strengthening textiles and clothing sector in South Asia: Nepal report
By Paras Kharel* and Prawol Bhattarai South Asia Watch on Trade, Economics and Environment (SAWTEE), Kathmandu
Revised version, December 2012 *Research Coordinator, SAWTEE (email: [email protected])

Contents 1. Introduction ....................................................................................................................................................... 3
1.1 Objective ..................................................................................................................................................... 3
1.2 Methodology ............................................................................................................................................... 3
1.3 Limitations .................................................................................................................................................. 4
2. Production and export trends ............................................................................................................................ 4 3. Imports: Trends and sources, and South Asia’s supply potential ................................................................... 12
3.1 Trends and sources.................................................................................................................................... 13
3.2 Supply potential of South Asia ................................................................................................................. 20
4. Apparel export destinations ............................................................................................................................ 23 5. Foreign investment ......................................................................................................................................... 29 6. Regulatory regime........................................................................................................................................... 30
6.1 Trade policy .............................................................................................................................................. 30
6.2 Foreign investment policy ........................................................................................................................ 31
6.3 Fiscal policy: Tax regime and incentives.................................................................................................. 32
6.4 External regime: Preferential treatment .................................................................................................... 33
7. Value chain analysis ....................................................................................................................................... 35 7.1 Design and raw material sourcing decisions ............................................................................................. 36
7.2 Sources of competitive advantage ............................................................................................................ 37
7.3 Inputs sources ........................................................................................................................................... 37
7.4 Who are the buyers? ................................................................................................................................. 39
7.5 Order cycle and lead time ......................................................................................................................... 40
7.6 Value addition, unit value, mark-ups in the importing country, and moving up the value chain ............. 45
8. Conclusion ...................................................................................................................................................... 50 9. Recommendations ........................................................................................................................................... 54
9.1 Domestic level .......................................................................................................................................... 54
9.2 Regional level ........................................................................................................................................... 56
Annex I: Firm characteristics .............................................................................................................................. 57 References ........................................................................................................................................................... 60
1. Introduction Nepal’s readymade garments (RMG) industry experienced rapid export growth post 1980s due to the
quota facility provided by industrialized countries such as the United States. There was a gradual
phase out of this quota facility on all textiles and garments items, fully implemented by December
2004 by the World Trade Organization (WTO). This had a marked negative effect on developing
countries like Nepal, which were benefitting from the added security provided by the quota system
(ActionAid and SAWTEE 2007). As a result of the phase out, Nepal was suddenly exposed to the
fiercely competitive textiles and garments global market and struggled to efficiently compete with
competitors such as India, China, Vietnam and Bangladesh. After the abolishment of the quota system,
Nepal has lost a major share of its market, especially in the United States. After the phase out, entry
barriers have increased by virtue of higher global standards expected by buyers from supplier
countries like Nepal (World Bank 2011).
1.1 Objective
This is the Nepal study component of a regional study on strengthening the textiles and clothing sector
in South Asia. It analyses the challenges and opportunities facing Nepal’s export-oriented textiles and
clothing sector, with a focus on the readymade garment (RMG) sector. In doing so, it explores Nepal’s
apparel sector’s place in the global value chain and the extent of its integration with other South Asian
countries. It also makes recommendations for strengthening Nepal’s RMG sector.
1.2 Methodology
Both secondary and primary data have been utilized in this study. The primary data was collected by
interviewing owners/managers of eight major clothing exporting firms as well as the president of the
Garment Association of Nepal. A semi-structured questionnaire was used in the interviews. Secondary
data were drawn from literature review, and database of Nepal Rastra Bank (NRB), Trade and Export

Promotion Centre (TEPC) of Nepal, UNCOMTRADE, Eurostat and USITC. Annex I shows some
firm characteristics.
1.3 Limitations
With regard to the collection of primary data, the garment exporters who were interviewed can be
considered as members of a resilient group who have survived the deteriorating business conditions in
the country in addition to the global quota phase out for textiles and garments. Interviews have not
been conducted with exporters who were driven out of business because of the adverse domestic and
external conditions. All of the interviewed exporters have manufacturing units in Kathmandu valley.
Also, the primary sample size is small in absolute number due to the strict time constraints of the
active exporters of garments. However, the sample accounts for at least 20 percent of garment
exporters of Nepal. Furthermore, responses to questions demanding definite quantitative answers were
low. This problem was largely addressed by extracting approximations and qualitative information
from the respondents.
2. Production and export trends Thanks to the Multi-fiber Arrangement (MFA), Nepal’s garment industry initially took off with the
help of quota-hopping Indian investors investing in or diverting orders to Nepal. Furthermore, owing
to the labor intensive nature and low initial investment requirement, export-oriented RMG units grew
at an impressive rate until the quota phase out under the ATC came into effect. As Table 1 shows, in
1991/92 the units totaled 234 while the number decreased to about 36 in 2006/07. In this same time
frame, the number of Nepali workers employed in the RMG industry plummeted from 17,260 to
4,797, although the average number of workers per unit increased from 74 to 133. During 2001/02-
2006/07, output decreased by 70 percent.

Table 1: Number of RMG establishments and employees by year
Fiscal Year
No. of establishments
No. of employees
Average No. Of employees
per establishments
Output (in 1000 NRs.)
Wages and salaries (in 1000 Rs.)
Average wage and
salaries (in 1000
Rs.)
Gross fixed assets
(Rs. 1000)
1986/87 86 8,518 99 391,303 79,291 9.30 n/a 1991/92 234 17,260 74 2,528,233 409,160 23.70 n/a 1996/97 136 14,848 109 3,801,673 374,818 25.24 n/a 2001/02 115 18,134 158 5,771,802 795,932 43.89 1,278,226 2006/07 36 4,797 133 1,746,408 136,446 28.44 725,873
Source: CBS, Census of Manufacturing Establishments (various issues) Figure 1 shows the manufacturing production indices of various textiles and clothing categories. RMG
production has recorded the sharpest decline.
Figure 1: Production indices of textiles and clothing (base year=2003/04)
Source: Economic survey (various years)
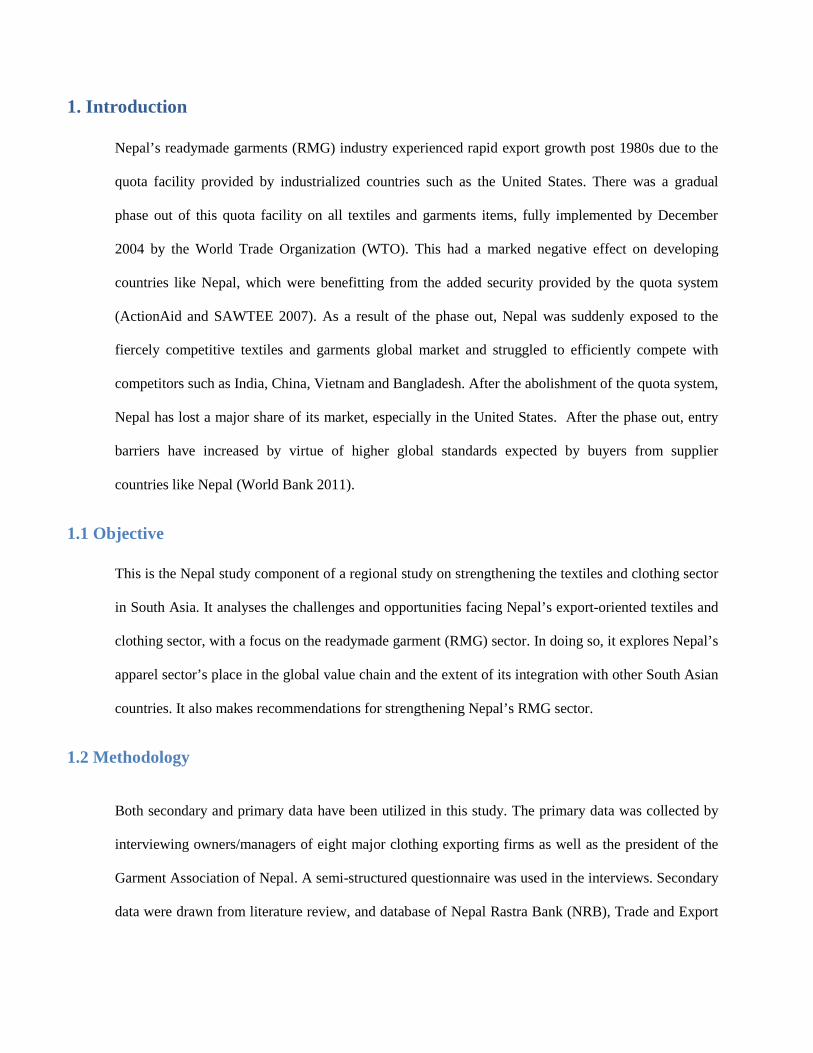
The export trend of the readymade garments match the production trend as production is
predominantly export-oriented. With respect to exports, Figure 2 shows an increasing trend up until
2000 and a steady decline after 2003. The decline continued with the global quota phase out beginning
2005. In contrast, other categories such as polyester yarn, textiles, and thread have not been adversely
0
20
40
60
80
100
120
140
2003/04 2004/05 2005/06 2006/07 2007/08 2008/09
Yarn Cotton clothes (textile)
Synthetic clothes (textile) Pashmina
Garment Woolen carpet
Jute goods
affected by the global quota phase out. Exports of pashmina products, which are part of apparel
exports but which are not counted as ready-made garment, exhibit a high degree of volatility and have
sharply decreased from 2000 onwards until 2008, after which they exhibit an upward trend. Overall,
the RMG export trend is a testimony to the adverse effect of the global quota phase out on Nepali
exporters after 2005.
Figure 2: Nepal’s textiles and garments exports before and after the quota phase out
Source: NRB
After the complete quota phase-out in 2005, Nepali exporters who sold products in high volume in the
United States and Europe have been affected in terms of increased price pressure. Before 2005, it was
not necessary for Nepali RMG exporters to maintain their pricing in line with their competitors due to
the quota protection. However, after the phase out, the price pressure has increased due to direct
competition with the low prices offered by countries like China and India. Barring two exporters, all
the exporters interviewed for this study—both high-volume and low-volume exporters—have recorded
an increasing trend in their exports. Of the two exceptions, one reported a constant trend while the
other reported a decline. The latter had switched from exporting to the US to exporting to India after
the quota phase-out, and had seen its export value plunge by as much as 90 percent. None of the other
0
2,000
4,000
6,000
8,000
10,000
12,000
14,000
16,000
0
1,000
2,000
3,000
4,000
5,000
6,000
7,000
8,000
(RM
G) N
PR m
illio
n
NPR
mill
ion
RMG
Polyster Yarn
Textiles
Thread
Pashmina

exporters reported any significant changes in either their export composition or their export
destinations after the quota phase out1.
Figure 3: Nepal’s export trend of HS categories 61 and 62
Source: TEPC and NRB
As shown in Figure 3, the apparel category consisting of HS codes 61 and 62 clearly display a sharp
downward trend from 2002/03 until 2007/08. The exports of these categories have moderately picked
up after 2007/08, with its share of volatility. Table 2 displays the top 15 apparel products exported
from Nepal in 2011. It shows a sharp churning in the rankings of top exported products during 2003-
2011, and an increasing product concentration. While 176 products (HS 2002, 6 digit level) were
exported in 2003, 136 were exported in 2011. Top 15 items in 2003 covered 69 percent of exports in
Chapters 61-62 for the same year while these items only occupied only 57 percent of total exports in
2011. Furthermore, top 15 items in 2011 covered 86 percent of exports in Chapters 61-62 for the same
year while these items had only occupied 47 percent of exports in 2003. Table 3 lists 10 additional
product categories with the highest rates of growth between 2003 and 2011, which are not included in
1 Information obtained from primary survey
0
2,000
4,000
6,000
8,000
10,000
12,000
14,000
16,000
NPR
mill
ion
Year
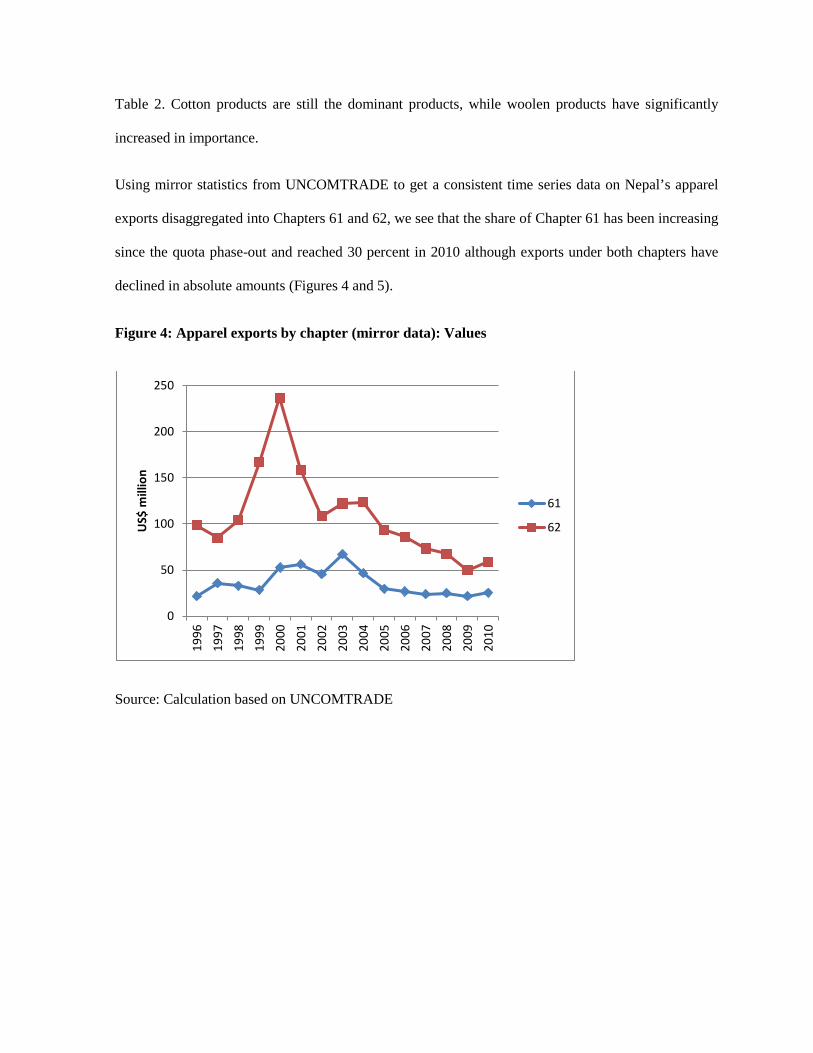
Table 2. Cotton products are still the dominant products, while woolen products have significantly
increased in importance.
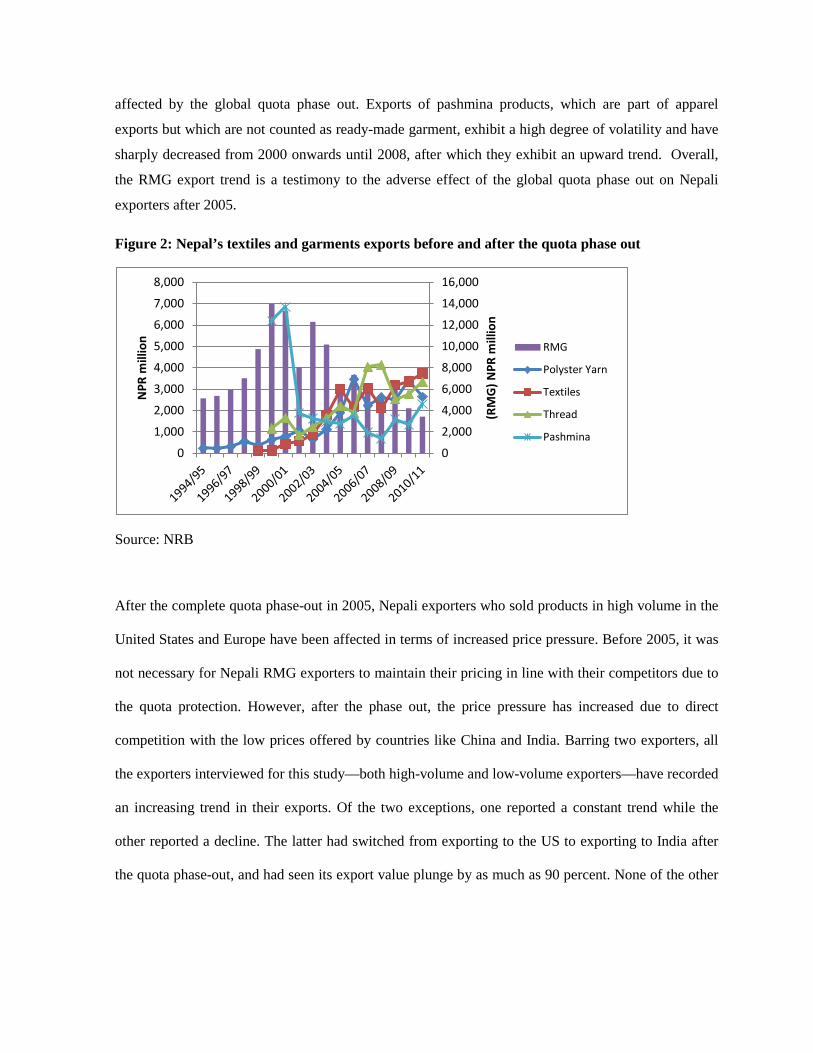
Using mirror statistics from UNCOMTRADE to get a consistent time series data on Nepal’s apparel
exports disaggregated into Chapters 61 and 62, we see that the share of Chapter 61 has been increasing
since the quota phase-out and reached 30 percent in 2010 although exports under both chapters have
declined in absolute amounts (Figures 4 and 5).
Figure 4: Apparel exports by chapter (mirror data): Values
Source: Calculation based on UNCOMTRADE
0
50
100
150
200
250
1996
1997
1998
1999
2000
2001
2002
2003
2004
2005
2006
2007
2008
2009
2010
US$
mill
ion
61
62

Figure 5: Apparel exports by chapter (mirror data): Shares (%)
Source: Calculation based on UNCOMTRADE
Table 2: Top 15 product-wise exports in 2011 (HS 61-62)
0%10%20%30%40%50%60%70%80%90%
100%
62
61
Code Product Description Value 2011
(US$'000)
Share2011
Rank2011
Value 2003
(US$'000)
Share2003
Rank2003 Growth
621420 Woolen shawls, scarves, mufflers, mantillas, veils and the like
22,693 28.6 1 12,833 5.8 4 76.8
620432 W&G cotton jacket, not knitted 10,115 12.8 2 2,142 1.0 24 372.2
620442 W&G cotton dresses, not knitted 7,500 9.5 3 6,141 2.8 10 22.1
620520 M&B cotton shirt, not knitted 4,663 5.9 4 28,508 12.8 1 -83.6 620332 M&B cotton jacket, not knitted 3,528 4.5 5 494 0.2 52 613.7
620462 W&G cotton trousers, bibs and brace overalls, breeches and short
3,086 3.9 6 18,241 8.2 3 -83.1
611011 Woollen jersey, pullover, cardigans, sweater, waistcoat, knitted
2,906 3.7 7 386 0.2 62 653.7
620342 M&B cotton trousers, not knitted 2,657 3.4 8 21,480 9.7 2 -87.6
611691 Woolen gloves, knitted 2,601 3.3 9 173 0.1 87 1400.1
620331 M&B jacket and blazers of wool or fine animal hair 1,979 2.5 10 495 0.2 51 299.9
610442 W&G Cotton dresses knitted 1,619 2.0 11 144 0.1 95 1025.6
611012 Jerseys, pullovers, cardigans, waistcoats and similar articles of kashmir (Cashmere) goats
1,425 1.8 12 0 n/a n/a n/a

Source: TEPC and UNCOMTRADE for 2003. Note: NPR figures for 2011 (Fiscal Year 2010/11) converted into NPR figures with the average exchange rate for the year 2010/11 as reported by NRB. Table 3: Top growing apparel products not in top 15 apparel exports in 2011
Code Product Description Value 2011
(US$'000)
Share 2011
Rank2011
Value 2003 (US$ ‘000)
Share2003
Rank2003 Growth
611012 Jerseys, pullovers, cardigans, waistcoats and similar articles of kashmir (Cashmere) goats
1,425 1.79 12 0 n/a n/a n/a
610413 W&G suits of synthetic fibers 26 0.03 66 0.01 0.00 175 199,771
610230
W&G man-made fibres overcoat, carcoat, capes, cloaks, anoraks, wind-cheaters, wind-jackets and similar articles, knitted or crocheted
29 0.04 63 1.22 0.00 169 2,243
611790 Parts of clothing accessories, knitted or crocheted 10 0.01 95 0.53 0.00 172 1,732
611420 Cotton garments knitted or crocheted 85 0.11 49 8.01 0.00 158 961
610422 W&G ensembles of cotton 42 0.05 56 4.16 0.00 161 901
620339 M&B jacket and blazers 376 0.48 25 44.01 0.02 132 755
611490 Garments, knitted and crocheted of texile materials 9 0.01 97 1.13 0.00 170 656
620444 W&G dresses of artificial fibres, not knitted 68 0.09 51 11.55 0.01 155 488
611692 Cotton gloves 14 0.02 84 2.87 0.00 165 385 Source: TEPC for 2011 and UNCOMTRADE for 2003
Note: NPR figures for 2011 (Fiscal Year 2010/11) converted into NPR figures with the average exchange rate for the year 2010/11 as reported by NRB.
In Tables 4 and 5, we see that while exports of apparel under Chapters 61 and 62 have been hard-hit,
declining by 75 percent and 64 percent respectively during 2003-2011, exports of textiles and carpets
and floor coverings have mostly increased, some robustly. Because of the absolute decline in the
620630 W&G cotton blouses, shirt, not knitted 1,425 1.8 13 9,017 4.1 6 -84.2
620431 W&G woolen jackets 1,354 1.7 14 87 0.0 110 1450.1
620721 M&B cotton nightshirt and pyjama, not knitted 1,137 1.4 15 3,846 1.7 15 -70.4
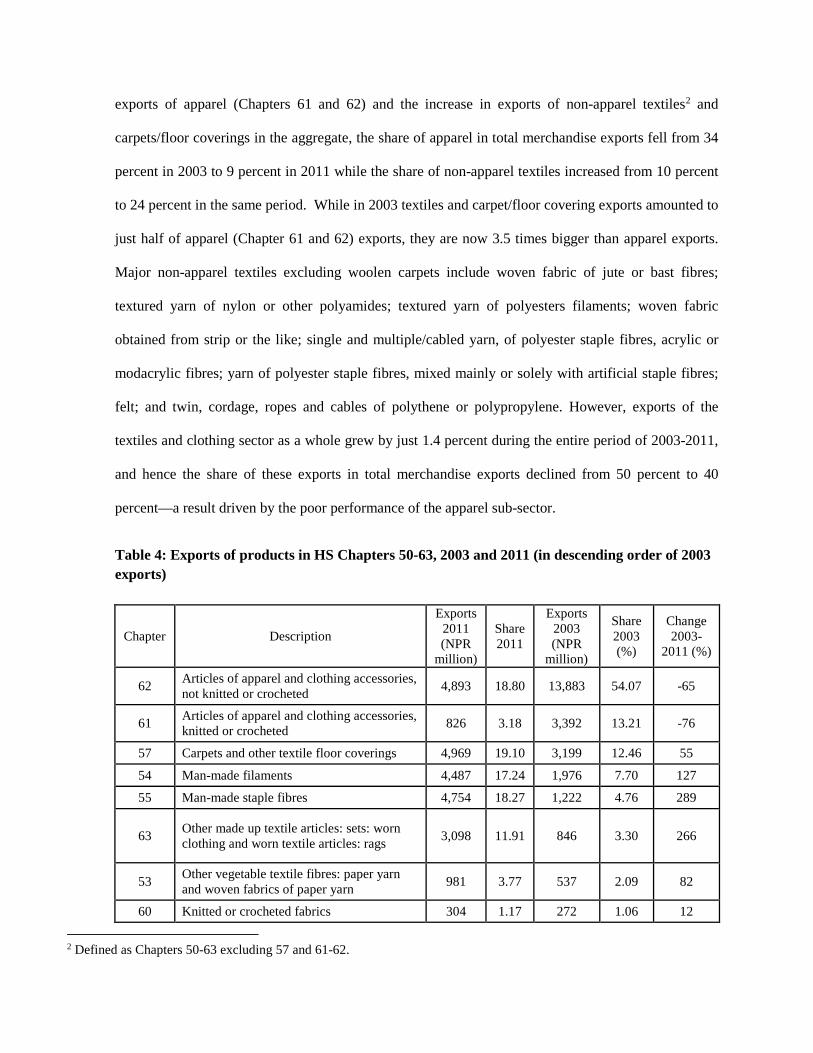
exports of apparel (Chapters 61 and 62) and the increase in exports of non-apparel textiles2 and
carpets/floor coverings in the aggregate, the share of apparel in total merchandise exports fell from 34
percent in 2003 to 9 percent in 2011 while the share of non-apparel textiles increased from 10 percent
to 24 percent in the same period. While in 2003 textiles and carpet/floor covering exports amounted to
just half of apparel (Chapter 61 and 62) exports, they are now 3.5 times bigger than apparel exports.
Major non-apparel textiles excluding woolen carpets include woven fabric of jute or bast fibres;
textured yarn of nylon or other polyamides; textured yarn of polyesters filaments; woven fabric
obtained from strip or the like; single and multiple/cabled yarn, of polyester staple fibres, acrylic or
modacrylic fibres; yarn of polyester staple fibres, mixed mainly or solely with artificial staple fibres;
felt; and twin, cordage, ropes and cables of polythene or polypropylene. However, exports of the
textiles and clothing sector as a whole grew by just 1.4 percent during the entire period of 2003-2011,
and hence the share of these exports in total merchandise exports declined from 50 percent to 40
percent—a result driven by the poor performance of the apparel sub-sector.
Table 4: Exports of products in HS Chapters 50-63, 2003 and 2011 (in descending order of 2003 exports)
Chapter Description
Exports 2011 (NPR
million)
Share 2011
Exports 2003 (NPR
million)
Share 2003 (%)
Change 2003-
2011 (%)
62 Articles of apparel and clothing accessories, not knitted or crocheted 4,893 18.80 13,883 54.07 -65
61 Articles of apparel and clothing accessories, knitted or crocheted 826 3.18 3,392 13.21 -76
57 Carpets and other textile floor coverings 4,969 19.10 3,199 12.46 55
54 Man-made filaments 4,487 17.24 1,976 7.70 127
55 Man-made staple fibres 4,754 18.27 1,222 4.76 289
63 Other made up textile articles: sets: worn clothing and worn textile articles: rags 3,098 11.91 846 3.30 266
53 Other vegetable textile fibres: paper yarn and woven fabrics of paper yarn 981 3.77 537 2.09 82
60 Knitted or crocheted fabrics 304 1.17 272 1.06 12
2 Defined as Chapters 50-63 excluding 57 and 61-62.
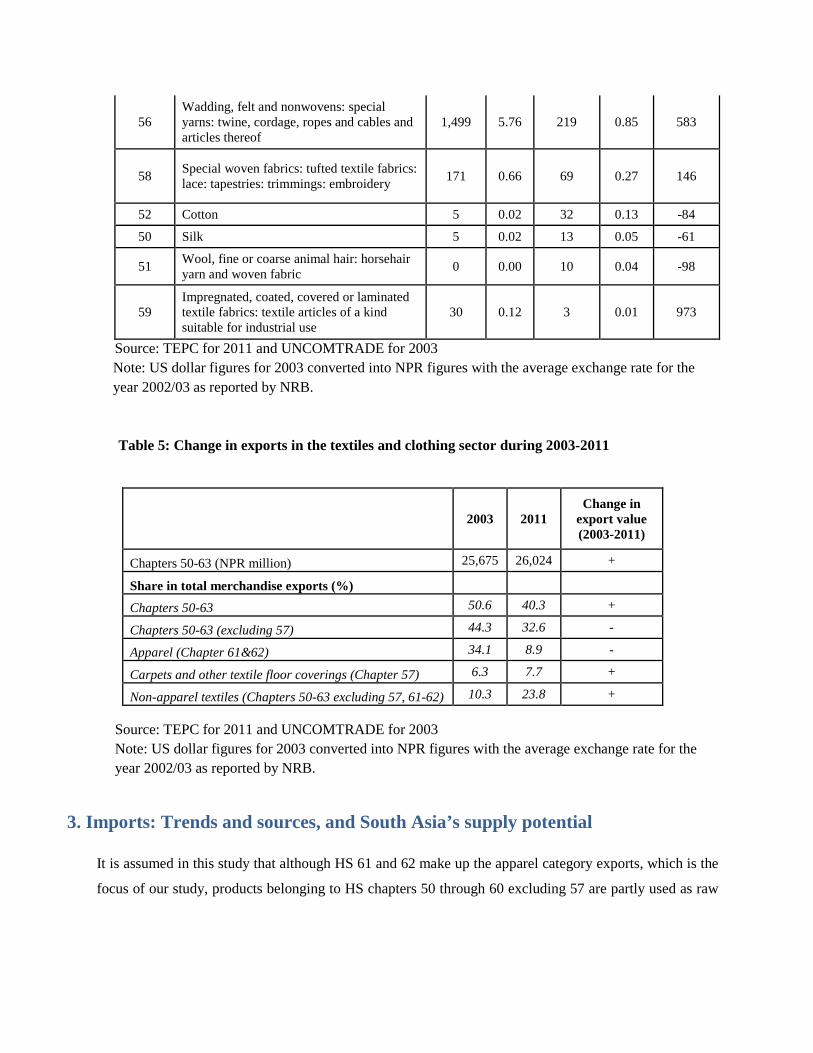
56 Wadding, felt and nonwovens: special yarns: twine, cordage, ropes and cables and articles thereof
1,499 5.76 219 0.85 583
58 Special woven fabrics: tufted textile fabrics: lace: tapestries: trimmings: embroidery 171 0.66 69 0.27 146
52 Cotton 5 0.02 32 0.13 -84
50 Silk 5 0.02 13 0.05 -61
51 Wool, fine or coarse animal hair: horsehair yarn and woven fabric 0 0.00 10 0.04 -98
59 Impregnated, coated, covered or laminated textile fabrics: textile articles of a kind suitable for industrial use
30 0.12 3 0.01 973
Source: TEPC for 2011 and UNCOMTRADE for 2003 Note: US dollar figures for 2003 converted into NPR figures with the average exchange rate for the year 2002/03 as reported by NRB.
Table 5: Change in exports in the textiles and clothing sector during 2003-2011
Source: TEPC for 2011 and UNCOMTRADE for 2003 Note: US dollar figures for 2003 converted into NPR figures with the average exchange rate for the year 2002/03 as reported by NRB.
3. Imports: Trends and sources, and South Asia’s supply potential
It is assumed in this study that although HS 61 and 62 make up the apparel category exports, which is the
focus of our study, products belonging to HS chapters 50 through 60 excluding 57 are partly used as raw
2003 2011 Change in
export value (2003-2011)
Chapters 50-63 (NPR million) 25,675 26,024 +
Share in total merchandise exports (%)
Chapters 50-63 50.6 40.3 +
Chapters 50-63 (excluding 57) 44.3 32.6 -
Apparel (Chapter 61&62) 34.1 8.9 -
Carpets and other textile floor coverings (Chapter 57) 6.3 7.7 +
Non-apparel textiles (Chapters 50-63 excluding 57, 61-62) 10.3 23.8 +
materials to manufacture the end apparels in Nepal.3 Hence, by studying the pattern of imports of textiles,
we are gaining an insight into the trend of quantity and source of different raw materials that go into
making the apparels that we eventually export internationally.
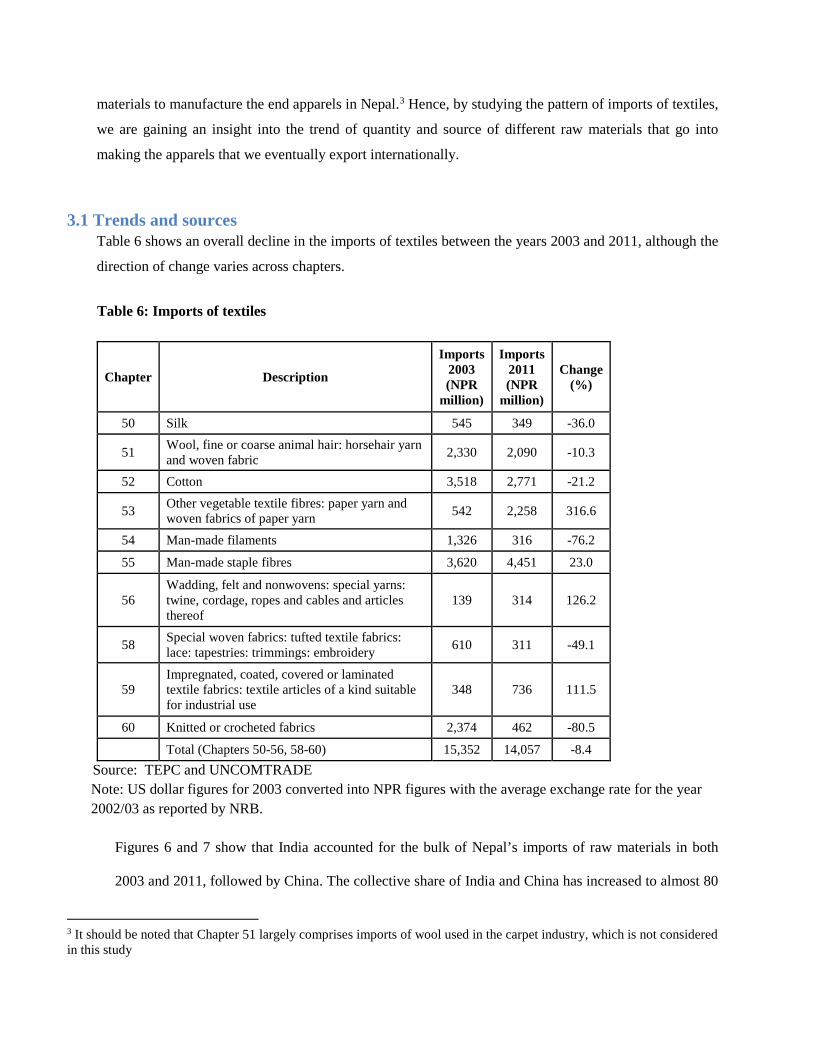
3.1 Trends and sources Table 6 shows an overall decline in the imports of textiles between the years 2003 and 2011, although the
direction of change varies across chapters.
Table 6: Imports of textiles
Chapter Description
Imports 2003 (NPR
million)
Imports 2011 (NPR
million)
Change (%)
50 Silk 545 349 -36.0
51 Wool, fine or coarse animal hair: horsehair yarn and woven fabric 2,330 2,090 -10.3
52 Cotton 3,518 2,771 -21.2
53 Other vegetable textile fibres: paper yarn and woven fabrics of paper yarn 542 2,258 316.6
54 Man-made filaments 1,326 316 -76.2
55 Man-made staple fibres 3,620 4,451 23.0
56 Wadding, felt and nonwovens: special yarns: twine, cordage, ropes and cables and articles thereof
139 314 126.2
58 Special woven fabrics: tufted textile fabrics: lace: tapestries: trimmings: embroidery 610 311 -49.1
59 Impregnated, coated, covered or laminated textile fabrics: textile articles of a kind suitable for industrial use
348 736 111.5
60 Knitted or crocheted fabrics 2,374 462 -80.5
Total (Chapters 50-56, 58-60) 15,352 14,057 -8.4 Source: TEPC and UNCOMTRADE
Note: US dollar figures for 2003 converted into NPR figures with the average exchange rate for the year 2002/03 as reported by NRB.
Figures 6 and 7 show that India accounted for the bulk of Nepal’s imports of raw materials in both
2003 and 2011, followed by China. The collective share of India and China has increased to almost 80
3 It should be noted that Chapter 51 largely comprises imports of wool used in the carpet industry, which is not considered in this study
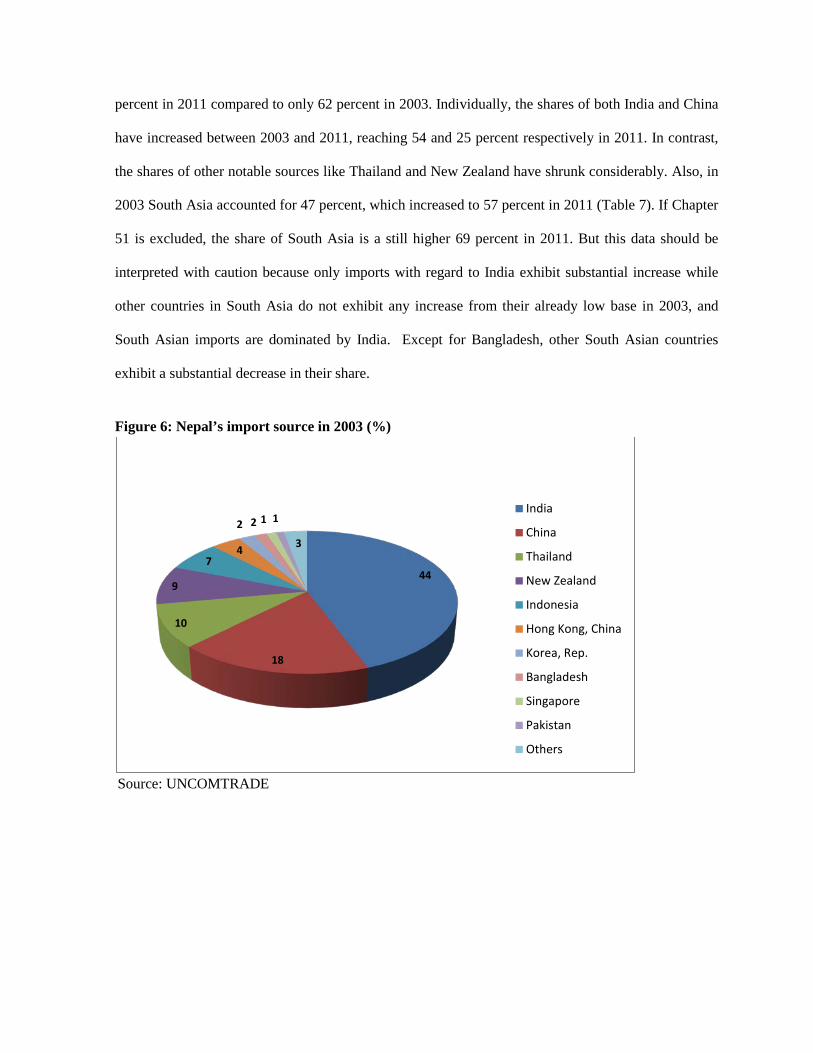
percent in 2011 compared to only 62 percent in 2003. Individually, the shares of both India and China
have increased between 2003 and 2011, reaching 54 and 25 percent respectively in 2011. In contrast,
the shares of other notable sources like Thailand and New Zealand have shrunk considerably. Also, in
2003 South Asia accounted for 47 percent, which increased to 57 percent in 2011 (Table 7). If Chapter
51 is excluded, the share of South Asia is a still higher 69 percent in 2011. But this data should be
interpreted with caution because only imports with regard to India exhibit substantial increase while
other countries in South Asia do not exhibit any increase from their already low base in 2003, and
South Asian imports are dominated by India. Except for Bangladesh, other South Asian countries
exhibit a substantial decrease in their share.
Figure 6: Nepal’s import source in 2003 (%)
Source: UNCOMTRADE
44
18
10
9
74
2 2 1 1
3
India
China
Thailand
New Zealand
Indonesia
Hong Kong, China
Korea, Rep.
Bangladesh
Singapore
Pakistan
Others

Figure 7: Nepal’s import source in 2011 (%)
Source: TEPC
The survey respondents reported that the majority of important raw materials, especially cotton and
polyester fabric, for the production of readymade garments in Nepal are sourced from India and
China—in line with secondary data—and, partly, locally (mostly threads, pockets, cartoons, boxes,
polybags, buttons). Cotton fabric is mostly sourced from India and polyester fabric from China. It
appears that at least 90 percent of raw materials used in production are imported. Even when materials
are sourced locally, they could have been imported by the supplier (e.g., threads imported in big spools
by local suppliers who then supply them in required quantities to garment manufacturers). However,
Pakistan (canvasses), Bangladesh (hangars, some knitted cotton hosiery fabric), Thailand (jacket
fleeces), and Australia and New Zealand (wool) also serve as sources. Some exporters also import
cotton fabrics from Bangladesh and Pakistan in small amounts. Interestingly, none of the interviewed
exporters indicated any significant change in their import source of important raw materials after the
quota phase out. Instead of adding more countries and regions to their supplier base, they are instead
54
25
66 3
14
India
China P. R.
Thailand
New Zealand
Bangladesh
U.S.A.
Others

focusing their effort towards diversifying their supplier base in the existing countries in order to gain
access to the best prices and values4. However, a sampled firm that has been exporting to the US (and
also Europe) since the early 1980s and specializes in sports and adventure wear used to have India as
its main source of raw material imports until 1990, whenceforth it started sourcing materials from
elsewhere, and now it hardly imports anything from India, with 90 percent of its imports coming from
China and Japan. The reason being that India cannot supply raw materials (fabric (polyester, nylon,
spandex) as well as accessories (zippers)) with the quality and design/style required and there is little
or no demand for Indian material in the US and European markets. In general, China is posing stiff
competition to India, even with regard to cotton fabric. For example, Alina Garments, which exports
mostly men’s wear (shorts, trousers and shirts) to India, sources most of its fabric (cotton) from China.
Table 8 highlights the top import sources of textiles (HS codes 50 to 60 excluding 57) and it is evident
that India and China features in the top 4 import sources for all these categories. Bangladesh also
features among the top 4 import sources in Chapters 52, 53, 58 and 60. Pakistan is among the top 4
import sources in Chapter 52, but with a share of just 0.4 percent. Figures 8 through 10 portray
Nepal’s major import sources of buttons, fasteners, and clothing accessories. It is observed that India
is the most significant source of Nepal’s button imports with a share of 61.4 percent. Likewise, China
dominates the fasteners category while Korea is Nepal’s major import source for clothing accessories.
4 Information obtained from primary survey

Table 7: Textiles imports from SAARC countries
Source: TEPC for 2011 and UNCOMTRADE for 2003 Note: US dollar figures for 2003 converted into NPR figures with the average exchange rate for the year 2002/03 as reported by NRB.
Table 8: Top four sources of textile imports in 2011 Chapter Description Source country Share (%)
50 Silk China P. R. 99.74
India 0.25
51 Wool, fine or coarse animal hair: horsehair yarn and woven fabric
China P. R. 54.12
New Zealand 37.36
India 6.18
Italy 0.49
52 Cotton
India 76.74
China P. R. 18.66
Bangladesh 3.31
Pakistan 0.43
53 Other vegetable textile fibres: paper yarn and woven fabrics of paper yarn
India 88.25
Bangladesh 11.09
China P. R. 0.42
Nicaragua 0.16
54 Man-made filaments India 43.93
Imports 2003 (NPR million)
Share (%) 2003
Imports 2011 (NPR
million)
Share (%) 2011
India 6,797 44.28 7,600 54.06 Bangladesh 239 1.56 469 3.34 Pakistan 153 0.99 12 0.09 Sri Lanka 8 0.05 1 0 South Asia 7,197 46.88 8,082 57.50

Chapter Description Source country Share (%)
China P. R. 26.61
Japan 10.05
Thailand 8.41
55 Man-made staple fibres
India 60.71
Thailand 18.86
China P. R. 10.84
U.S.A. 4.11
56 Wadding, felt and nonwovens: special yarns: twine, cordage, ropes and cables and articles thereof
India 57.17
China P. R. 30.69
Philippines 4.31
Indonesia 1.97
58 Special woven fabrics: tufted textile fabrics: lace: tapestries: trimmings: embroidery
China P. R. 56.57
India 31.95
Bangladesh 9.45
U.K. 1.35
59 Impregnated, coated, covered or laminated textile fabrics: textile articles of a kind suitable for industrial use
China P. R. 71.28
India 15.24
Japan 6.94
Taiwan 4.79
60 Knitted or crocheted fabrics
China P. R. 34.82
India 24.87
Bangladesh 21.22
Thailand 7.38
Source: TEPC

Figure 8 Nepal’s import source of buttons in 2011 (%)
Source: TEPC Figure 9: Nepal’s import source of fasteners in 2011 (%)
Source: TEPC
61.423.2
11.7
1.3
1.20.4
0.4
0.4India
China P. R.
Hongkong
Taiwan
Japan
Thailand
Bangladesh
Others
85.0
10.2
3.0
1.2 0.4 0.1
0.1China P. R.
India
Hongkong
Taiwan
Thailand
Kuwait
Others

Figure 10: Nepal’s import source of clothing accessories in 2011 (%)
Source: TEPC
3.2 Supply potential of South Asia
Here, we estimate the capacity of South Asia (SA) to theoretically supply the textiles that Nepal has been
importing from the rest of the world (ROW). First we consider all textiles at HS 6-digit sub-heading in
Chapters 50-60 excluding Chapter 57. Then we also exclude Chapter 51. Trade flows-based theoretical
supply capacity of SA to potentially replace Nepal’s imports from the ROW is defined as existing in a
product at HS 6-digit level if SA’s exports of that product to the whole world (including SA but excluding
Nepal) are positive in both the years 2009-2010. Exports and imports of two years 2009 and 2010 are
summed for the analysis to account for year-to-year fluctuations. Data are from UNCOMTRADE, accessed
via WITS. Mirror data are used for Bangladesh’s exports in 2009-2010.
Where SA exports are equal to or greater than Nepal’s imports from ROW, it is assumed that the entire
imports from ROW can be potentially replaced by imports from SA. Where SA exports are less than Nepal’s
56.129.7
11.6
1.10.60.2
0.1 0.4 Korea R
China P. R.
India
Thailand
Indonesia
U.K.
Saudi Arabia
Others

imports from ROW but greater than zero, the value equal to SA exports is considered possible for
replacement of imports from ROW. This method yields 351 HS subheadings in which SA fully or partially
meets Nepal’s imports from ROW. The value of imports from ROW that can potentially be so replaced by
imports from SA amounts to 29.32 percent of Nepal’s total textile imports (Table 9).
Out of the 446 textiles-related products (HS6 digit Chapters 50-60 excl 57) that Nepal imported in 2009-
2010, 57% of the import value was accounted for by imports from SA. In 37 products, imports were from
ROW only; in 86 products, from SA only; and in 323 products, imports were from both ROW and SA. SA
has supply capacity to potentially replace, fully or partially, Nepal’s imports from the ROW in 351 products,
out of 360 products with at least some imports from ROW. Imports from ROW amount to 41% of Nepal’s
total imports of textiles. If these are replaced by imports from SA, then the share of SA in imports of Nepal
in the textiles category may increase from the current 57% to 86% (by 29 percentage points). SA can
replace up to 71.5 percent of ROW imports in value terms. The potential supply capacity declines
substantially, however, if constraints are imposed on the extent to which SA’s exports in these products can
possibly be diverted to Nepal. For example, the additional imports from SA will account for less than or
equal to 15% of SA's exports in 314 products, and the resulting replacement potential in the 314 products is
just over 52 percent of the total replacement potential, although the median percentage across the 351
products is only 0.4 percent. When 10 percent of SA’s exports is taken as a cut-off, the number of products
falls to 299 whose contribution to total replacement potential also declines to under 33 percent. If 1 percent
is taken as a cut-off, the number of products falls further to 237 and the contribution to replacement potential
declines to just 16.7 percent.
Supply capacity is likely to be less than what this measure suggests if SA’s exports to SA are also excluded.
Differences in product quality and prices are not considered in this analysis; the implicit assumption,
therefore, is substitutability between SA-supplied products and ROW-supplied products.
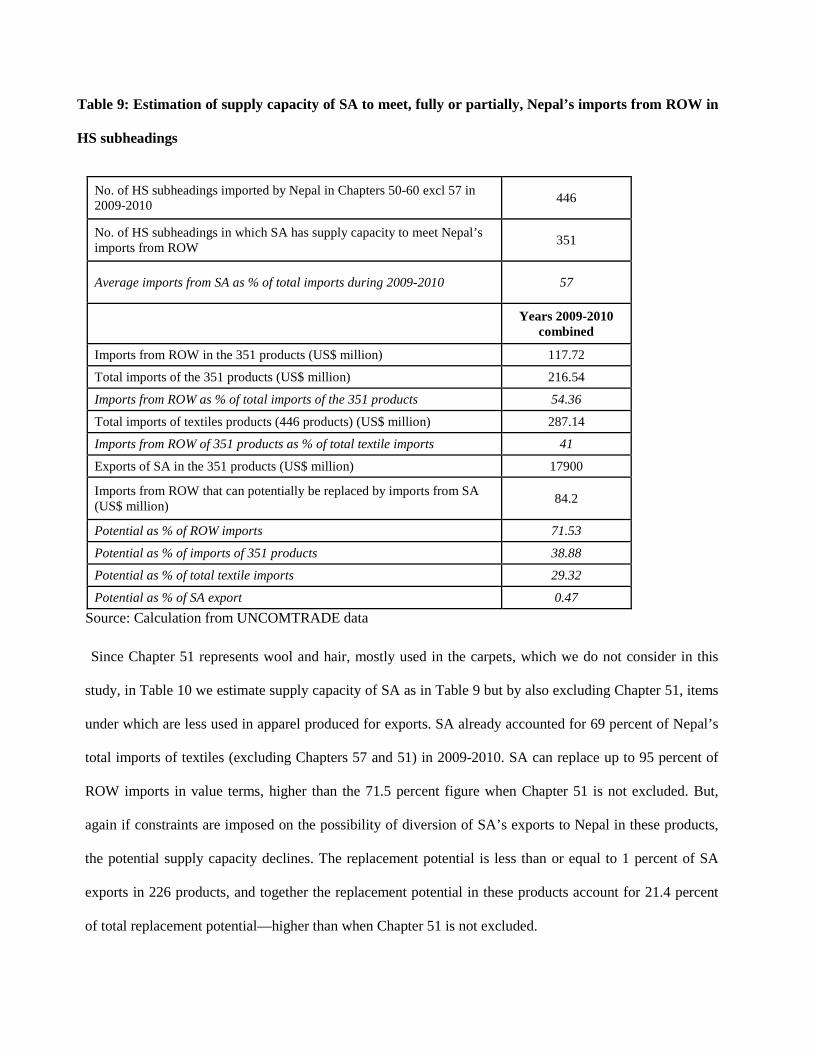
Table 9: Estimation of supply capacity of SA to meet, fully or partially, Nepal’s imports from ROW in
HS subheadings
No. of HS subheadings imported by Nepal in Chapters 50-60 excl 57 in 2009-2010 446
No. of HS subheadings in which SA has supply capacity to meet Nepal’s imports from ROW 351
Average imports from SA as % of total imports during 2009-2010 57
Years 2009-2010 combined
Imports from ROW in the 351 products (US$ million) 117.72
Total imports of the 351 products (US$ million) 216.54
Imports from ROW as % of total imports of the 351 products 54.36
Total imports of textiles products (446 products) (US$ million) 287.14
Imports from ROW of 351 products as % of total textile imports 41
Exports of SA in the 351 products (US$ million) 17900
Imports from ROW that can potentially be replaced by imports from SA (US$ million) 84.2
Potential as % of ROW imports 71.53
Potential as % of imports of 351 products 38.88
Potential as % of total textile imports 29.32
Potential as % of SA export 0.47 Source: Calculation from UNCOMTRADE data
Since Chapter 51 represents wool and hair, mostly used in the carpets, which we do not consider in this
study, in Table 10 we estimate supply capacity of SA as in Table 9 but by also excluding Chapter 51, items
under which are less used in apparel produced for exports. SA already accounted for 69 percent of Nepal’s
total imports of textiles (excluding Chapters 57 and 51) in 2009-2010. SA can replace up to 95 percent of
ROW imports in value terms, higher than the 71.5 percent figure when Chapter 51 is not excluded. But,
again if constraints are imposed on the possibility of diversion of SA’s exports to Nepal in these products,
the potential supply capacity declines. The replacement potential is less than or equal to 1 percent of SA
exports in 226 products, and together the replacement potential in these products account for 21.4 percent
of total replacement potential—higher than when Chapter 51 is not excluded.

Table 10: Estimation of supply capacity of SA to meet, fully or partially, Nepal’s imports from ROW in HS subheadings (also excluding Chapter 51)
No. of HS subheadings imported by Nepal in Chapters 50-60 excl 57 in 2009-2010
408
No. of HS subheadings in which SA has supply capacity to meet Nepal’s imports from ROW
324
Average imports from SA as % of total imports during 2009-2010 69
Years 2009-2010
combined
Imports from ROW in the 324 products (US$ million) 68.68
Total imports of the 324 products (US$ million) 165.2
Imports from ROW as % of total imports of the 324 products 41.57
Total imports of 27 Chapter 51 products (US$ million) 51.3
Total imports of textiles products excl Ch 51 (US$ million) 235.04
Imports from ROW of 324 products as % of total textile imports 29.22
Exports of SA in the 324 products (US$ million) 17600
Imports from ROW that can potentially be replaced by imports from SA (US$ million)
65.38
Potential as % of ROW imports 95.2
Potential as % of imports of 324 products 39.58
Potential as % of total textile imports 27.81
Potential as % of SA export 0.37 Source: Calculation from UNCOMTRADE data
Despite the limitations of this approach, it does indicate the potential of SA to replace Nepal’s imports from
the ROW, at least partly. While product quality and fine levels of product differentiation are not captured
by HS 6-digit codes, the reasons cited by the surveyed exporters for not sourcing all their inputs from South
Asia, as discussed above, are instructive.
4. Apparel export destinations
Prior to the global quota phase out in 2005, United States was Nepal’s major export destination for
apparels. But, after the phase out Nepal has been unable to compete in that market and as a result, exports
have decreased dramatically. In contrast, European Union’s share has steadily increased in the same
timeframe between 2001/02 and 2010/11 (Figures 11 and 12). For example, the share of the US in Nepal’s
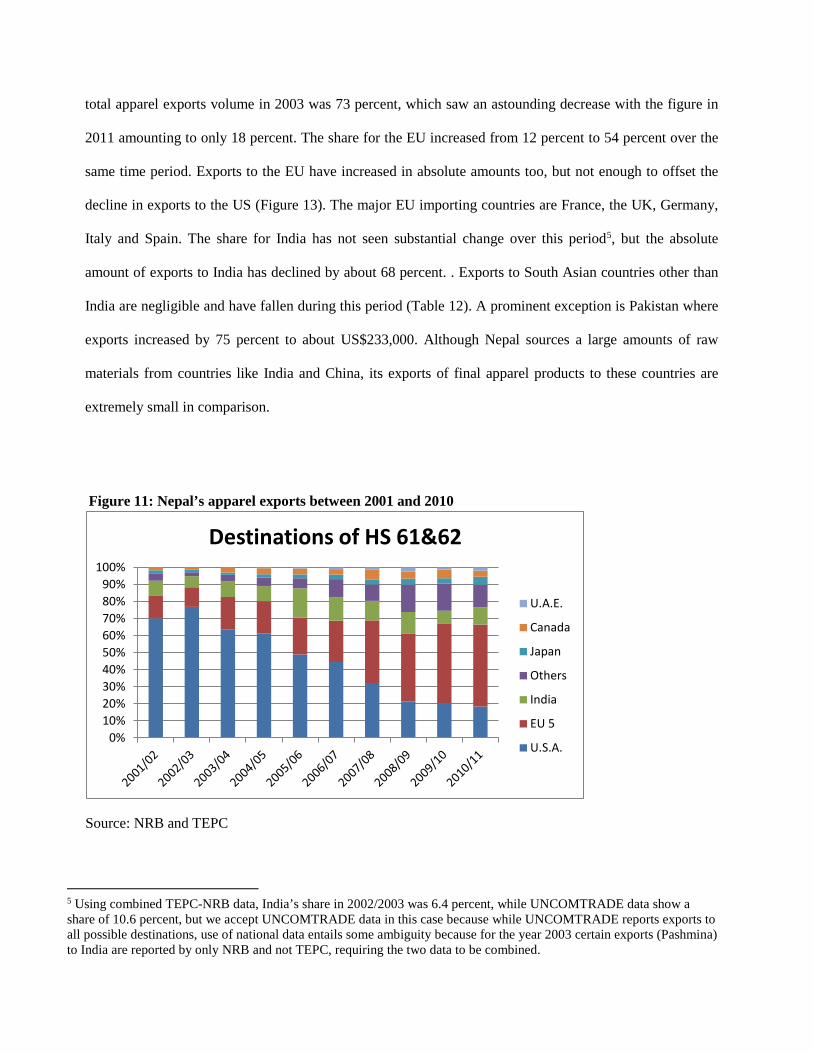
total apparel exports volume in 2003 was 73 percent, which saw an astounding decrease with the figure in
2011 amounting to only 18 percent. The share for the EU increased from 12 percent to 54 percent over the
same time period. Exports to the EU have increased in absolute amounts too, but not enough to offset the
decline in exports to the US (Figure 13). The major EU importing countries are France, the UK, Germany,
Italy and Spain. The share for India has not seen substantial change over this period5, but the absolute
amount of exports to India has declined by about 68 percent. . Exports to South Asian countries other than
India are negligible and have fallen during this period (Table 12). A prominent exception is Pakistan where
exports increased by 75 percent to about US$233,000. Although Nepal sources a large amounts of raw
materials from countries like India and China, its exports of final apparel products to these countries are
extremely small in comparison.
Figure 11: Nepal’s apparel exports between 2001 and 2010
Source: NRB and TEPC
5 Using combined TEPC-NRB data, India’s share in 2002/2003 was 6.4 percent, while UNCOMTRADE data show a share of 10.6 percent, but we accept UNCOMTRADE data in this case because while UNCOMTRADE reports exports to all possible destinations, use of national data entails some ambiguity because for the year 2003 certain exports (Pashmina) to India are reported by only NRB and not TEPC, requiring the two data to be combined.
0%10%20%30%40%50%60%70%80%90%
100%
Destinations of HS 61&62
U.A.E.
Canada
Japan
Others
India
EU 5
U.S.A.

Figure 12: Change in destinations (2003 and 2011) of apparel exports (HS 61 and 62)
Nepal’s apparel export destinations in 2003 (%)
Source: UNCOMTRADE
Nepal’s apparel export destinations in 2011 (%)
Source: TEPC
73
12
11
1 1
2United States
EU 15
India
Canada
Japan
Others
54
18
10
54 2 2 1
4
EU (15)
U.S.A.
India
Japan
Canada
U.A.E.
Switzerland
Australia
Others
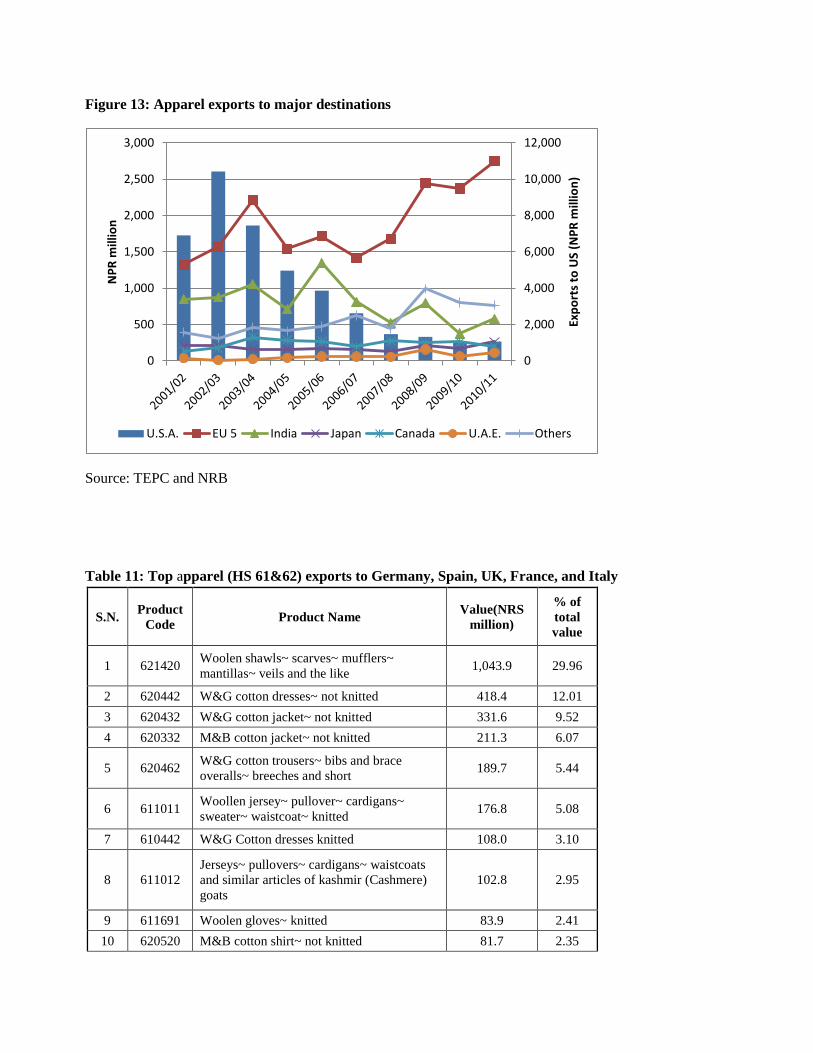
Figure 13: Apparel exports to major destinations
Source: TEPC and NRB
Table 11: Top apparel (HS 61&62) exports to Germany, Spain, UK, France, and Italy
S.N. Product Code Product Name Value(NRS
million)
% of total value
1 621420 Woolen shawls~ scarves~ mufflers~ mantillas~ veils and the like 1,043.9 29.96
2 620442 W&G cotton dresses~ not knitted 418.4 12.01 3 620432 W&G cotton jacket~ not knitted 331.6 9.52 4 620332 M&B cotton jacket~ not knitted 211.3 6.07
5 620462 W&G cotton trousers~ bibs and brace overalls~ breeches and short 189.7 5.44
6 611011 Woollen jersey~ pullover~ cardigans~ sweater~ waistcoat~ knitted 176.8 5.08
7 610442 W&G Cotton dresses knitted 108.0 3.10
8 611012 Jerseys~ pullovers~ cardigans~ waistcoats and similar articles of kashmir (Cashmere) goats
102.8 2.95
9 611691 Woolen gloves~ knitted 83.9 2.41 10 620520 M&B cotton shirt~ not knitted 81.7 2.35
0
2,000
4,000
6,000
8,000
10,000
12,000
0
500
1,000
1,500
2,000
2,500
3,000
Expo
rts t
o U
S (N
PR m
illio
n)
NPR
mill
ion
U.S.A. EU 5 India Japan Canada U.A.E. Others

11 620331 M&B jacket and blazers of wool or fine animal hair 77.4 2.22
12 620610 W&G blouses~ shirts and shirt-blouse of silk or silk waste 75.8 2.17
13 620721 M&B cotton nightshirt and pyjama~ not knitted 74.6 2.14
14 620630 W&G cotton blouses~ shirt~ not knitted 52.9 1.52 15 620431 W&G woolen jackets 52.1 1.49 16 n/a Others 403.1 11.57
Source: TEPC
As Europe constitutes the bulk of Nepali apparel exports in terms of destination in recent times, Table 11
further zooms into five top buyers in that particular region (Germany, Spain, UK, France, and Italy). The
table filters out the major apparel products exported to the region in 2011. It is notable to find that the top
15 product categories encompassing HS codes 61 and 62 comprised of a staggering 88.43 percent of the
total value exported to the above mentioned five countries in 2011. Among these 15 products, “woolen
shawls, scarves, mufflers, mantillas, veils and the like” (621420) constitutes the giant share of exports to
these countries, with the figure amounting to 29.96 percent. Women’s and girl’s cotton dresses are also
notable products exported to these countries in high amounts, as depicted clearly by table 11 above. By
comparison, men’s and boy’s cotton products feature less prominently. Furthermore, within these 15
notable product categories, cotton products that are not knitted seem to be more popular in these countries
compared to cotton products that are knitted.
Table 12: Apparel (HS 61&62) exports to SAARC countries and China 2002/03 2010/11 NPR
million Share NPR million Share
India 1835.92 10.63 578.70 10.12 Pakistan 9.76 0.06 16.84 0.29 Bhutan 42.74 0.25 4.68 0.08 Bangladesh 24.81 0.14 0.13 0.00 Sri Lanka 0.00 0.00 0.01 0.00
China, PR 15.67 0.08 17.79 0.31
Source: TEPC for 2011 and UNCOMTRADE for 2003 Note: US dollar figures for 2003 converted into NPR figures with the average exchange rate for the year 2002/03 as reported by NRB.
We saw that the shifts in apparel destinations are mainly driven by the plunge in exports to the US and the
rising exports to the EU. Figures 14-15 show trends in values of apparel exports to the two main markets
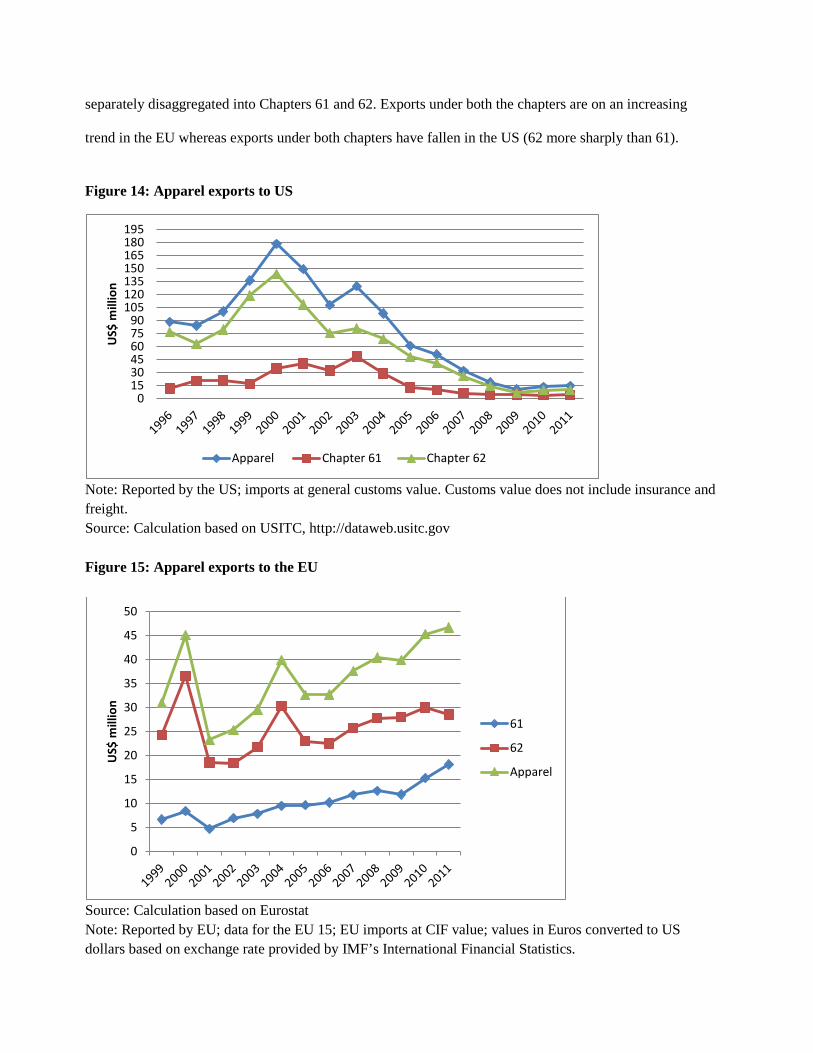
separately disaggregated into Chapters 61 and 62. Exports under both the chapters are on an increasing
trend in the EU whereas exports under both chapters have fallen in the US (62 more sharply than 61).
Figure 14: Apparel exports to US
Note: Reported by the US; imports at general customs value. Customs value does not include insurance and freight. Source: Calculation based on USITC, http://dataweb.usitc.gov
Figure 15: Apparel exports to the EU
Source: Calculation based on Eurostat Note: Reported by EU; data for the EU 15; EU imports at CIF value; values in Euros converted to US dollars based on exchange rate provided by IMF’s International Financial Statistics.
0153045607590
105120135150165180195
US$
mill
ion
Apparel Chapter 61 Chapter 62
0
5
10
15
20
25
30
35
40
45
50
US$
mill
ion
61
62
Apparel
5. Foreign investment
Nepal’s export-oriented RMG firms are predominantly fully domestically owned. In the early days of the
country’s RMG industry, Indian investment played a key role, but in the course of time Nepali
industrialists took over. While recent data are not available, as per the periodic Census of Manufacturing
Establishments, only four of the 115 firms in 2001/02 and only one of the 36 firms in 2006/07 had foreign
investment. The deterioration in industrial relations and the general business climate after 2006 could have
warded off prospective foreign investors further. Surya Nepal Pvt. Ltd, a leading joint-venture company in
Nepal (with a stake of India’s ITC group), shut down its garment factory permanently in August 2011 due
to labour problems, among other factors.6 The company was Nepal’s leading garment exporter, producing
brands such as John Players and Springwoods and exporting to India, the US and Europe. It had
established its garment factory in 2004; the garment unit employed about 600 workers.
Despite the apparent deterioration in business climate and the woes of the RMG sector in Nepal, records of
the Department of Industry (DoI) show that foreign investment worth NPR 1.7 billion in 33 firms in the
RMG sector received approval from the DoI from 2004/05 through 2010/11. During 2007/08-2010/11,
6 “Surya Nepal shuts down garment factory”, http://www.ekantipur.com/the-kathmandu-post/2011/08/17/money/surya-nepal-shuts-down-garment-factory/225302.html ; “Surya Nepal shuts garment unit”, http://www.thehimalayantimes.com/fullNews.php?headline=Surya+Nepal+shuts+garment+unit&NewsID=299701; “Surya Nepal was keen to shut down its garment unit”, http://www.nepalnews.com/archive/2011/nov/nov07/news09.php ; “Case study: Closure of Surya Nepal Textile”, http://visitloma.blogspot.com/2012/03/case-study-closure-of-surya-nepal.html

nearly 55 percent of the proposed investment was from India, followed by China (11 percent), South
Korea (8 percent) and Denmark and Egypt (7 percent each), Japan (6 percent) and the UK (4 percent),
among others (Figure 16). Note that these are just proposed and approved investment; data on their actual
realization are not available.
Figure 16: Source of cumulative approved FDI in RMG sector in Nepal (2007/08-2010/11)
Source: Department of Industry (Government of Nepal), Industrial Statistics, various issues.
6. Regulatory regime
6.1 Trade policy
The new Trade Policy introduced in 2009 by the Government of Nepal (GON), replacing the Trade Policy
of 1992, outlines two major focus groups for commodity development programme. Readymade garments
(RMG) are included in the first group of commodities—the so-called “special focus area”—as a “labor-
intensive good.” Special emphasis is given on the development of Nepali RMGs by considering the new
scenario of expiry of the quota under the Multi Fiber Arrangement. The building of longer-term policies
for RMGs will be complemented by the construction of Garment Processing Zones (GPZs) which would
54.79
10.67
7.64
6.77
6.77
5.723.38 4.26
India
China
South Korea
Denmark
Egypt
Japan
UK
Others
further increase the competitiveness of Nepalese readymade garments. Special emphasis would be
rendered to market diversification while taking initiatives to gain duty-free entry into the most important
international markets where the effect of the quota phase out has been the most adverse. The policy
document also mentions that the government of Nepal would support the private sector in the creation of a
“fashion technology institute”, which would produce able human resources competent with regards to the
value-added RMG production (MOCS 2010). The Trade Policy also aims to support spinning and textiles
industries to cater to the input demand of the RMG industry. Implementation of provisions in the Trade
Policy remains poor. A bill for the Special Economic Zone (SEZ) Act—which if passed would pave the
way for the creation of special economic zones, including export processing zones, with special fiscal and
non-fiscal incentives to firms located there—is still pending in parliament. A fashion technology institute,
as envisioned in the Trade Policy, has not been established.
The government adopted the Nepal Trade Integration Strategy (NTIS) 2010, which identified 12 goods
and 7 services sectors for priority export development and promotion, and charted out short- to medium-
term (upto 2015) strategies towards that end. Readymade garment was not one of the identified products
when NTIS was launched because it did not meet the criteria used to identify products with “export
potential”—one of them being export growth—although it was and still is among the top four broad export
items.7 However, NTIS did list pashmina and woolen wear as among the priority products, and in practice
there is some overlap between these and RMG. After pressure from the Garment Association of Nepal, the
government in September 2012 decided to include RMG in the NTIS list of priority products.8
6.2 Foreign investment policy
Nepal’s foreign investment regime, as provided for in the Foreign Investment and Technology Transfer
Act (FITTA) 1992—as amended—allows 100 percent foreign investment in all but 21 sectors, where no 7 In 2010/11, RMG was the fourth largest export category after iron and steel articles, yarns and woolen carpet. 8 “Govt to include garment in NTIS,” Republica, 8 September 2012, http://www.myrepublica.com/portal/index.php?action=news_details&news_id=41317
foreign investment is allowed, including cottage industries. Foreign investment is allowed fully in the
textiles and clothing sector, except in cottage industries. With effect from 7 September 2012, the
Government of Nepal raised the minimum amount of investment that foreign investors should make to
NPR 5 million from US$20,000.9
6.3 Fiscal policy: Tax regime and incentives
Several provisions have been implemented by the Government of Nepal with a view to promote exports.
Export manufacturing industries enjoy refunds of customs and VAT duties on material imports.
Furthermore, Nepal Rastra Bank (NRB) has been exercising the facility of providing foreign exchange
service to exporters visiting abroad to attend trade missions. The duty drawback scheme allows Nepali
exporters to get refunded for specific duties or taxes on imported raw materials, auxiliary raw materials
that are necessary for the production of their goods. The amount of duty refund is also dependent on the
quantity that they eventually export. Furthermore, the bonded warehouse facility enables the exporters to
import raw materials by merely making an entry into a passbook. The payment of custom or sales taxes
can be bypassed in this instance (MOICS 2005). All the exporters interviewed said they were utilizing
and benefiting from the bonded warehouse facility, and they did not face any major problems in availing
themselves of this facility.
A cash incentive programme for exports was introduced in 2010/11 and continued in 2011/12, with a
budget of NPR 300 million (about US$4 million). The budget for the export cash incentive scheme, under
which exporters are entitled to 2 percent to 4 percent of their convertible currency export earnings based
on the rate of value addition10 remains mostly unspent due to, among other things, procedural rigmarole.
The programme is not confined to NTIS/Trade Policy-identified products only, but exports to India (which
9 Rijal, Krishna. 2012. “Lower limit for foreign investment now Rs 5 million,” Arthik Abhiyan, 7 September 2012, p 1. 10 It covers only exports to countries other than India. The cash incentive is 2 percent, 3 percent or 4 percent depending on whether the rate of value addition is 30-50 percent, 50-80 percent or above 80 percent.

do not earn convertible currency) are not eligible. In 2011/12, the Government provided cash incentives
amounting to NPR 100 million in total (a third of the allocated budget) to 57 export-oriented firms, out of
111 firms that had filed applications. While the firms that were awarded cash included four thread/yarn
exporters, three textiles exporters, one pashmina product exporters, and 11 carpet exporters, none of the
RMG exporters that had filed applications were found eligible.11
The garment exporters who were interviewed contended that they are yet to benefit from the cash incentive
scheme announced by the Nepal government for the exporters. Most exporters were in the process of
applying for the scheme or had already done so, but confirmed that the procedures were full of
unnecessary hassles and lengthy. Informal compensation sought by processing officials was also cited as a
major roadblock to both obtaining and benefitting from the scheme. One exporter actually pointed out that
while they would technically obtain 2 percent cash incentive after completing the cash incentive
procedure, the lengthy procedure would actually add to their cost by about 4 percent, mainly due to the
informal compensation sought by the officials12. Exporters to India complained that the scheme excluded
exports to India and wanted it to be extended to them as well. Overall, the interviewed exporters, whether
exporting to India or overseas, were of the view that a flat rate of cash incentive should be provided to
exporters on their value of exports, irrespective of value addition, arguing that determination of value
addition entails procedural hassles and delays.
6.4 External regime: Preferential treatment
Nepal’s apparel exports enjoy preferential treatment under the Generalised System of Preferences (GSP)
schemes in quad countries with the exception of the United States. The Everything but Arms (EBA)
scheme allows Nepalese exporters duty- and quota-free access in the EU. Also, the revised GSP scheme of
Japan allows duty-free entry of Nepalese apparels. Nepal also enjoys access to approximately 15 GSP 11 Rijal, Krishna. 2012. “Cash incentives to 57 export-oriented firms,” Arthik Abhiyan, 2 August, p 1 and 5.
12 Information obtained from primary survey
schemes in countries like Switzerland, Australia, Norway, New Zealand, Russia, and some notable East
European countries. As US was Nepal’s major market prior to the quota phase out, unavailability of a
preferential arrangement with the US has hurt Nepali apparel exporters, particularly in the wake of price
pressure created by fierce competition triggered by ATC expiry. Lack of preferential arrangement with the
United States in the form of tariff concession puts Nepal at a disadvantage compared to other developing
countries which do enjoy preferential access to the US (ActionAid and SAWTEE 2007).
Nepal received derogation from standard EU rules of origin (ROO) since at least as far back as the early
2000s, even before the derogation—requiring just a single-stage transformation (manufacturing apparel
from fabric, imported or otherwise)—was extended to all LDCs in 2011. Regional cumulation involving
materials imported from SAARC and ASEAN is also allowed. Canada’s ROO ROO are also quite relaxed,
with just a single criterion of at least 20 percent domestic value addition. However, the ROO under other
GSP schemes are quite stringent (ActionAid and SAWTEE 2007).
Nepal’s preference utilization in the EU market is quite high, rising from 77 percent in 2000 to an average
of 94 percent during 2005-2010 (Figure 17). Whereas a decade ago, there was a substantial gap between
the utilization rates in Chapters 61 and 62, they had almost converged by 2010, with utilization rate in
Chapter 62 increasing more rapidly.

Figure 17: Preference utilization by Nepal in the EU (%)
Source: Calculation based on Eurostat
Note: Preference utilization is the ratio of imports into the EU (as it has evolved over time) duty-free to the
imports into the EU under a known import regime, expressed in percentage terms. All imports of apparel
into the EU from Nepal are eligible for duty-free treatment provided the ROO are met. 99 percent of the
imports of apparel from Nepal into the EU, as recorded at Eurostat, are under a known import regime.
7. Value chain analysis In the post-quota period, whether or not Nepalese apparel exporters can compete globally depends heavily
on their ability to efficiently manage sourcing and supply chains. This is so because the apparel business
has transformed more into a service business form where the exporters have to efficiently handle the
50
55
60
65
70
75
80
85
90
95
100
2000 2001 2002 2003 2004 2005 2006 2007 2008 2009 2010
Chapter 61
Chapter 62
All apparel

whole process from marketing to raw materials sourcing to supply logistics (ActionAid and SAWTEE
2007).
7.1 Design and raw material sourcing decisions
In terms of product design, most surveyed exporters confirmed that the designs for approximately 80-90
percent of the exports were primarily at their own discretion while for the remaining 10-20 percent of the
exports, the designs was pre-specified in detail by the buyers. Only two surveyed exporters stood as an
exception to this rule. For instance, Heritage Exports, which exports its apparels to United States (50%),
European Union (40%), and India (10%) and is one of the top three RMG exporters of Nepal, contends
that for all its exports the buyers send the preliminary sketches of the designs to be produced and
exported, although the rest of the product development is done at the company. Furthermore, Alina
Garments, which exports exclusively to India, follows the same modality. The designs of this company
are pre-specified by Indian retail outlet called Big Bazaar. It used to follow the same procedures while
exporting in bulk to the giant US retailer Walmart. The company was forced to discontinue its business
with the American giant due to the emergence of the unfavorable business climate (including labour
problems) in Nepal which rendered it difficult for it to meet the specified lead times. As an intermediary,
and interesting, case stood Trans Trip Garment, a leading exporter to the European market, which has an
in-house team of designers and its exports consist of items designed in-house, designed by buyers and
jointly designed. Likewise, Nepal Fashion, one of the top three RMG exporters of Nepal, uses designs
provided by European wholesalers as well as its own designs. Exporters mostly selling in European
markets tend to have a greater control over designing; they tend to sell a variety of items, of different
styles and designs, usually of artistic and fusion type, and in small quantities (sometimes as low as 100
pieces per style). Another interesting case is Sherpa Adventure Gear, specializing in high-end adventure
and sports wear, whose head office in the US develops the initial design and it is finalized in the Nepal
office.

All the exporters interviewed contended that they select and purchase the raw materials themselves,
besides also deciding on the import sources. As an exception, Heritage Exports contended that even
though it decides on the raw materials and the sources, customer approval is required first. Furthermore,
lab testing is performed in India for the raw materials by the Bureau Veritas. Exports to India are of
broadly two types in terms of raw material requirements: orders from stores pre-specify the materials,
quality, design etc while other orders in general do not detail these aspects.
As an emerging pattern during the primary data collection process, generally products exported to Europe
were designed completely by the Nepali exporters besides deciding the type and source of inputs for
production. Alternatively, exporters selling exclusively to retailers in United States and India usually have
to meet pre-specified design requirements, besides specifications for input type and source13.
7.2 Sources of competitive advantage
As sources of their competitive advantage exporters mainly cited quality fabric sourcing, relatively cheap
labour (compared to developed countries), evolving designs, and product’s uniqueness in terms of design
and style (as in artistic fusion-type designs, which are in high demand especially in the European market).
According to one exporter to India, which mostly exports men’s wear made of Chinese cotton fabric, the
main source of competitive advantage for exports to India is cheap and quality fabrics sourced from
China, which Indian RMG manufacturers find it costly to access due to taxes and regulations.
7.3 Inputs sources
The majority of exporters interviewed for the purpose of this study contended that they mainly sourced
fabric from India and China. Other sources of raw materials included Taiwan (fabric) and South Korea
(fabric) and Japan (zippers). The most important raw material is fabric. The very few that did source raw
13 Information obtained from primary survey

materials from Nepal mainly sourced items like threads, wool and trims, and, as noted above, items
sourced locally may also have been imported by the suppliers (e.g., threads, wool) Overall, India and
China were the major raw materials import source for cotton fabrics, with China further dominant in the
polyester category. It was observed as a general trend that smaller exporting firms which specialized in
“artistic fusion” type garments tended to source significant amounts of raw materials domestically.
Furthermore, these exporters generally tended to export a high share of their products to the EU market.
Some small-scale producers targeting the European market are involved in multiple vertical stages of
production: producing yarn, turning yarn into fabric and making apparel from fabric.14 On the contrary,
exporters selling to big retailers and wholesalers in the United States and India tended to source their
inputs predominantly from China and India. They contended that raw material quality was the main
sourcing materials from China and India, besides the fact that it was much quicker to obtain orders from
these countries also. For exports to India, in general China is the main source of fabric—the reason being
a combination of competitive price and consistent quality. China is the most important source of polyster
fabric, whether for exports to India or the US. The kinds of fabrics used in RMG exported to India are
expensive in India (e.g., linen, corduroy, nylon, jogging suit fabric); hence they are sourced from China
and Taiwan. One major exporter to the United States also noted that imported cotton fabrics from China,
for instance, would be extremely consistent in terms of their quality and subtle details, which was not the
case if these same raw materials were imported from South Asia, including India. For exporters that did
source raw materials from RSA (rest of South Asia), Bangladesh and Pakistan were the most prominent
source for inputs like canvas (Pakistan), hangars (Bangladesh), and cotton knitting materials
(Bangladesh), among others. Furthermore, in the case of a major exporter to the US specializing in sports
and adventure wear, sourcing of raw materials has shifted over the years away from India due to lack of
capacity of Indian industry (and also industries in other SAARC countries) to supply materials in the
required quality and specification (color, style et al.). For that firm, from 1985 to 1990, India was the
main source of raw material (including fabric) imports, but it hardly imports anything from India because 14 As per information from Garment Association of Nepal.

the latter cannot supply the materials with the quality required, and there is not much demand for fabric
and accessories (eg zippers) made in India in the US and European markets. Similarly, a leading exporter
that only caters to the European market also cited a shift in sourcing of materials away from India over
the last two decades although it still imports from India (mostly cotton knitted hosiery fabric). Exporters
contended that SAARC countries in general cannot meet the quality requirements besides ensuring
quality consistency and meeting the changing tastes in fabric, and provide timely delivery. For instance,
YKK zippers, which are mainly imported from Japan also has factory in India but it does not produce the
quality water-proof zippers sought by Nepali garments exporters. Hence, Nepali exporters have no other
choice than to import such zippers from Japan. Trade facilitation-related problems also appear to have
dissuaded some exporters from sourcing materials from Bangladesh—for example, a firm exclusively
exporting to Europe imported a couple of shipments of knitted cotton hosiery from Bangladesh but
imports from Bangladesh could not be sustained due to, among others, the problem in availing itself of
bonded warehouse facility when importing from that country through Mechi customs. Relative ease of
doing business with India, trade facilitation issues and proximity to India, resulting in lower costs and
time, largely explain continuing imports from India. Some of the respondents also argued that when
production capacity is low, the bargaining power of exporters with suppliers is low, which constrains
diversification of suppliers. If production is to increase, exporters will find it feasible to shop for
suppliers, including those in other SAARC countries.
7.4 Who are the buyers?
From the survey, it emerged that Nepali exporters tend to sell their products to wholesalers in the
destination markets, barring some huge exporters selling in the US market who sell directly to department
stores such as Bon-Ton and some small-scale exporters who sell to intermediaries/agents. Exporters
selling to European customers generally produce on a smaller scale and the orders from Europe are
typically of smaller size. A leading RMG exporter15, which sells to Bon-Ton in the US and whose total
sales (to the US, Europe and India) were 800,000 pieces in 2011, said that it is not selling to Walmart
because entertaining orders from Walmart requires a greater scale of production, which is currently not
possible due to labour problems. A special case is Sherpa Adventure Gear, which sells mostly to the US
market and partly to European markets, and has its head office in the US. The head office distributes the
exported products to clients in different states. Exporters selling in India sell either to stores or to
wholesalers and traders. Interestingly, an exporter who used to export exclusively to the US through
Walmart with annual exports of about NPR 300-400 million until about seven years ago switched its
destination entirely to the Indian market about four years ago but with sales of just NPR 40-50 million.
This firm sells indirectly to Big Bazaar via individuals who have contacts with the hypermarket.
7.5 Order cycle and lead time
Nepali garment exporters selling to overseas markets (markets other than India)—mainly Europe and the
US—predominantly use sea transportation. Kolkata port in India is used for sea transportation. There are
three different modes of transportation for shipping export consignments: land-sea (from factory to
Koklata port, and thenceforth by ship—which takes 35-40 days); air-sea (Kathmandu to Singapore by air
and thenceforth by sea—21 days); and air (from Kathmandu to destination—2 days at the minimum to 5-
6 days, depending upon the service used, whether express service or otherwise). The air-sea and air
modes of transport are relatively expensive compared to the land-sea mode, but are nevertheless used as
an emergency measure in response to events like strikes and shutdowns, which are a common delay
inducing phenomenon in Nepal. The extra cost that comes with the air-sea and air modes is borne by the
exporting company itself. If the land-sea mode costs 25 cents per piece, the air mode costs US$1.5 per
piece. Interestingly, Nepal Fashion, which sells in the European market, exports its products by air only.
The air route is more frequently used by exporters when selling to European markets for two reasons: a)
the items sold in Europe fetch relatively high value, and b) orders from Europe are in relatively small 15 Heritage Fashion.

quantities (some as low as 100 pieces of bottoms) such that a consignment is not big enough to fill up a
20-foot or 40-foot container, and paying for a full container for such consignments increases the unit
cost—which causes delays.
Export times can be reduced if there is access to Indian ports through which there is direct shipping to the
US and Europe instead of detouring via Singapore or Colombo due to the need for transshipment which is
the case when using Kolkata port as it cannot accept mother vessels. Besides, inefficiency and
congestion—resulting in delays, higher turnaround time, detention and demurrage—define Kolkata and
Haldia ports, the gateway ports for Nepal’s third-country trade. India agreed in August 2009 to provide
Nepal an alternative port (besides Kolkata/Haldiya ports) for its third-country trade, namely the
Visakhapatnam port, which is has spare capacity and draft conditions permitting berthing of mother
vessels of up to 100,000 deadweight tonnage and is also much more efficient than Kolkata port in
handling containers (Kharel 2011). However, the agreement is yet to be operationalized. Furthermore,
using Jawaharlal Nehru Port (JNP) in Mumbai, for instance, is estimated to reduce transit cost by US$400
per 20-foot container by, inter alia, avoiding transshipment, thereby improving the competitiveness of
Nepal’s West-bound exports (CIC 2001). India agreed in principle in 1995 to allow Nepal to use JNP and
Kandla port on the western coast of India for its third-country trade, but the pledge was not implemented
(Kharel 2011).
The lead time is high. For selling to the US and European market, it is 120-135 days in general. For
example, to produce 20,000 pieces of corduroy trousers, it takes 30 days for a Chinese company to ready
the fabric upon receiving the order, 30 days to bring the fabric to Nepal by sea, 30 days to produce the
apparel in Nepal, and 45 days to deliver the final product to the US by sea. In the case of basic fabric
which is already in the stock of the Chinese company, it takes about 7 days to be dyed and readied, but
the transportation time to reach Kathmandu remains 30 days. It takes one and a half months to bring
canvasses from Karachi to Kathmandu by sea, the only possible route, after placing the order. It takes 20
days from placing of order for and receipt of hangars from Dhaka by road, through the Fulbari-
Banglabandh route. Importing from India generally entails the least cost and time in terms of
transportation (e.g., one week from cotton fabric factory in Ludhiana to Kathmandu), but the time taken
by Indian suppliers to ready the materials is also high (e.g., up to 45 days for cotton fabric). Still,
importing fabric from India is the most time-effective option, provided it can supply materials of required
type, quality and style, which is not always the case (e.g., linen, corduroy, polyester, nylon). A significant
factor behind the high lead time is the transshipment that West-bound export consignments dispatched
from Kolkata port have to undergo at Colombo or Singapore ports. Another factor is the waiting time at
Kolkata port: it could take as much as 7-10 days to get a vessel. Furthermore, it takes 7-8 days for goods
to reach Kolkata from Kathmandu (about 1,323 km). Transshipment at the Nepal-India border is one
factor that increases the time to transport goods from Kathmandu, where most RMG manufacturing units
are located, to Kolkata; another factor is poor road conditions, particularly on the Indian side. The
absence of through bills of lading (TBLs) was an crucial factor that prevented the realization of full
benefits of the operationalization of the inland container depot (dry port) at Nepal’s main border point
(Birgunj), which is connected by a rail link to Kolkata port through a bilateral rail services agreement
with India signed in May 2004, and was expected to reduce transit costs from 12−15 percent of CIF to
8−10 percent and the journey time between Kolkata and Birgunj from 10 days to 3 days (CIC 2001).
Even if all documents are in order, cargoes have to spend three to five days at the port, which could be
reduced if TBLs were issued and received at the dry port. The situation might change now that Interstate
Multimodal Transport, a Nepali company, in association with TLPL Shipping and Logistics, a subsidiary
of Transworld Group Company, has been started offering TBL service for both import and export (the
latter since August 201216. A few RMG exporters have started using this service, which is a private-sector
initiative and has not been institutionalized at the official level. However, RMG exporters have not been
16 While import service covers sources such as China, Thailand, the UAE and Malaysia, and the Netherlands and Italy, export service covers destinations such as Japan, the US, the UK, Italy, Germany and South Africa (Khadka, Gunj Bahadur. 2012a. “Now a single bill of landing for exports too,” Arthik Abhiyan, 11 September, p 1; Khadka, Gunj Bahadur. 2012b. “Interstate aims to transport 400 containers of cargo per month,” Arthik Abhiyan, 12 October, p 1).
using rail transport to ferry their ware from Nepal to Kolkota port intensively, preferring to rely instead
on trucks, because of the risk of delay due to a shift from diesel mode to electric mode in Barauni and
gauge changes along the way (with preference accorded to passenger trains).
In the stage of manufacturing, the time taken depends upon the quantity and design/style ordered. Artistic
wear, requiring considerable embroidery and decorative work and fabrics of different colours—especially
in demand in Europe—requires a longer manufacturing time than normal wear, mostly sold in the US and
Indian markets. It is noteworthy that one of the interviewed exporters—Nepal Fashion—which is one of
the top three RMG exporters of Nepal and sells only to Europe, exports all its consignments by air, thus
substantially reducing its lead time, by 40-45 days. Long hours of load shedding, partly mitigated by
factories installing diesel-powered generators which raises cost of production, disruptions to in-factory
production by within-factory strikes and shutdowns by trade unions, and shutdowns and strikes in the
country were identified by respondents as contributing to high lead time in the manufacturing stage and
also jacking up the cost of production.
A quite unique case that is worth noting is Sherpa Adventure Gear, which receives orders a year in
advance after its head office in the US holds a show in Las Vegas twice a year. Orders are received for
summer wear and winter wear a year in advance, and about six months each is devoted to the production
of the two types of wear. Exports of summer wear begin around March and end in July-end, whereas
exports of winter wear end in December-end. Because its receives orders a year in advance, this firm has
greater flexibility in managing different stages of production than other firms. The firm exported some
120,000 pieces in total in a recent year.
For exporting to India, a significant portion of the lead time is taken by importing fabrics from sources
outside of India, mostly from China, which takes 30 days to reach Kathmandu by ocean after being
readied. Basic fabrics, which are in the inventory of Chinese manufacturers, get readied in seven days. An
exporter only catering to the Indian market—Alina Garments—said that although lead time varies
according to quantity and quality of products ordered, it takes 2-3 months to deliver an order size of 5,000
pieces. It exports FOB and its delivers its products by truck only up to the Nepal-India border, from
where the importing party takes over.
As all the interviewed exporters produce to order, and this seems to be the case for Nepal’s RMG industry
as a whole17, maintaining an inventory of raw materials does not appear to be a viable option to reduce
lead times.
With regard to the benefits and possibility of relocating production facilities close to the border with India
the interviewed exporters, all of whose manufacturing units are in Kathmandu valley, had widely varying
opinions. A leading exporter, which exports to the US, Europe and India, said that relocating to the border
can be seriously considered once the proposed garment export processing zones in Birgunj and
Bhairahawa—two bordering towns—come on stream. A firm only exporting to India said that border
relocation would reduce its lead time by up to seven days due to savings on transport time between the
border and Kathmandu, but also argued that absence of easy availability of required labour and security
concerns in the southern plains were deterrents besides the fact that the owner/manager was a local of
Kathmandu An exporter shipping its products exclusively by air—to Europe—cited no possible benefits
from relocation. One exporter who exclusively sourced inputs locally within Nepal—and exported to
Europe—also did not see any advantage of relocating to border areas. In general, the advantage of
staying in Kathmandu rather than relocating to the border appears to be the better security situation of
Kathmandu, availability of a wider pool of labour of all skill categories (including for home production of
accessories and handwork, which can be outsourced), ease for interested foreign buyers to visit the firm,
and proximity to Nepal’s only international airport as goods have to be air freighted on occasions to
ensure timely delivery.
17 Information provided by Garment Association of Nepal.
7.6 Value addition, unit value, mark-ups in the importing country, and moving up the value chain
Almost all the surveyed exporters stated that they mainly exported with the Free-on-Board (FOB)
modality. Since imported fabric costs accounted for the bulk of the overall cost of production, the
domestic value addition percentage value typically hovered around 25-35 percent for the Nepali RMG
exporters interviewed for the purpose of this study. As a general trend, products sold to Europe tend to
have a higher domestic value addition figure compared to products sold in the US, for instance. Exporters
selling predominantly in the EU market tend to produce artistic fusion type products not designed
elsewhere and which are relatively more labor intensive and hence not suitable for mass production.
Besides the longer production process for such products requiring higher labor costs, exporters were more
likely to source more of their raw materials domestically for products sold in Europe. A high domestic
value addition of over 50-60 percent is not unusual for small-scale firms catering to the European market.
In the course of the survey, we also remarkably ran into an exporter selling exclusively to the EU who
sourced most of their inputs, including fabric, domestically from Nepal and therefore could boast a
domestic value addition of over 80 percent. If a firm exports to multiple destinations (India, the US and
Europe), its domestic value addition is about the same for exports India and the US but higher for exports
to Europe. Generally, even for exporters selling exclusively to bigger retailer in the US, for example, the
domestic value addition figure tended to increase substantially with the nature and quality of products
produced and exported. Relatively stylish products requiring more hand stitching, for instance, would
have a much higher figure compared to its generic or less stylish variety.
Calculations based on secondary data show that unit values (a rough proxy for prices) of Nepal’s exports
are increasing in both US and EU markets and both Chapters 61 and 62 (Figures 18-20). While unit
values for Chapter 62 were higher than for Chapter 61 in the US, they have converged over the years. The
trend is similar in the EU, but the increase in unit values are less rapid than in the US. In Figure 21, we
see that the gap between unit values of exports (expressed in US$ per kg) in the EU and the US (in both
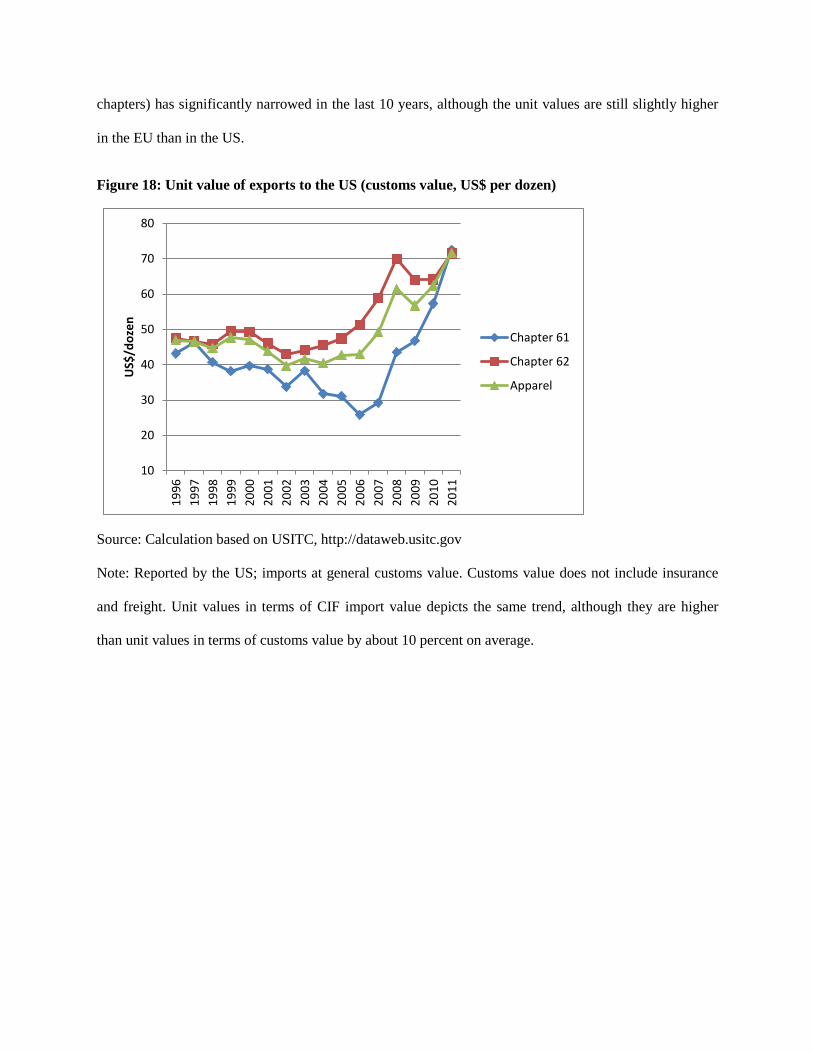
chapters) has significantly narrowed in the last 10 years, although the unit values are still slightly higher
in the EU than in the US.
Figure 18: Unit value of exports to the US (customs value, US$ per dozen)
Source: Calculation based on USITC, http://dataweb.usitc.gov
Note: Reported by the US; imports at general customs value. Customs value does not include insurance
and freight. Unit values in terms of CIF import value depicts the same trend, although they are higher
than unit values in terms of customs value by about 10 percent on average.
10
20
30
40
50
60
70
80
1996
1997
1998
1999
2000
2001
2002
2003
2004
2005
2006
2007
2008
2009
2010
2011
US$
/doz
en
Chapter 61
Chapter 62
Apparel

Figure 19: Unit value of exports to US (customs value, US$ per kg)
Source: Calculation based on USITC, http://dataweb.usitc.gov
Note: US imports at general customs value. Customs value does not include insurance and freight. Unit
values in terms of CIF import value depicts the same trend, although they are higher than unit values in
terms of customs value by about 10 percent on average.
5
7
9
11
13
15
17
19
21
23
2519
96
1997
1998
1999
2000
2001
2002
2003
2004
2005
2006
2007
2008
2009
2010
2011
US$
/kg 61
62
Apparel
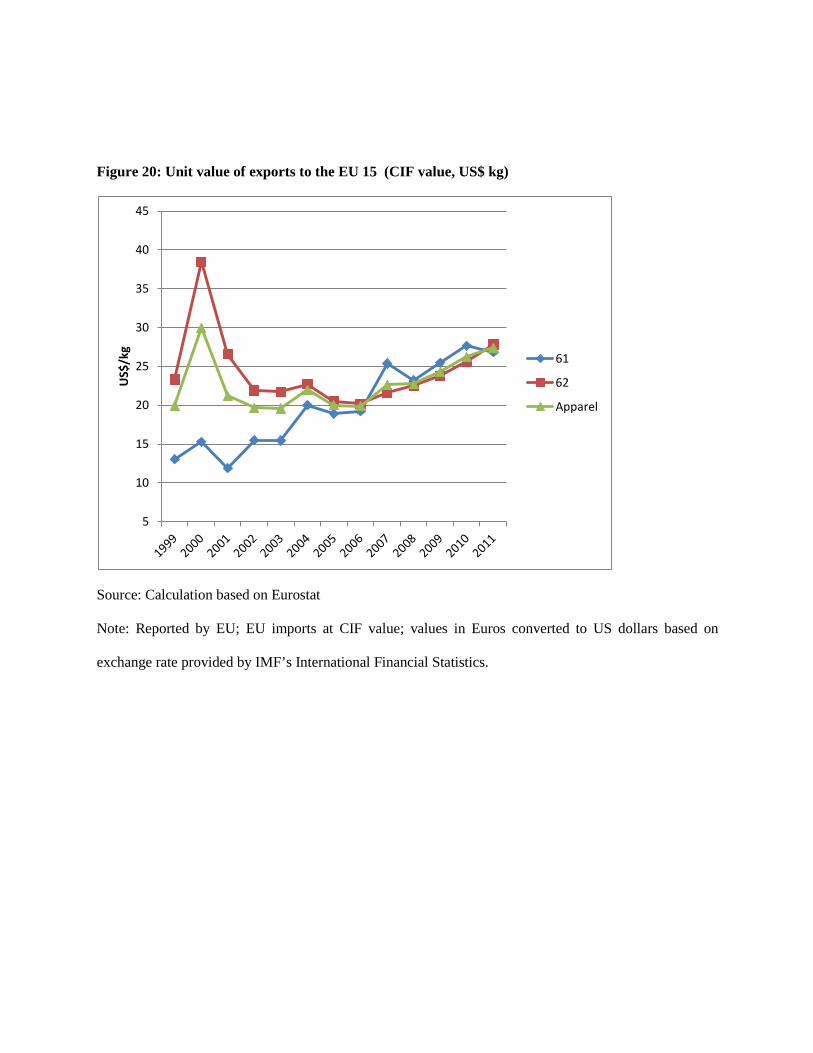
Figure 20: Unit value of exports to the EU 15 (CIF value, US$ kg)
Source: Calculation based on Eurostat
Note: Reported by EU; EU imports at CIF value; values in Euros converted to US dollars based on
exchange rate provided by IMF’s International Financial Statistics.
5
10
15
20
25
30
35
40
45
US$
/kg
61
62
Apparel

Figure 21: Comparison of unit values of exports to US and EU 15 (US$ per kg)
Source: Calculation based on USITC, http://dataweb.usitc.gov , and Eurostat
Note: Reported by the US and the EU; US and EU imports at CIF value. Values in Euros converted to US
dollars based on exchange rate provided by IMF’s International Financial Statistics
With regard to product diversification, none of the surveyed exporters expressed interest or future plan
towards products diversification. Their main emphasis was on market diversification whereby they
wanted to diversify their export markets by specializing in the same products in which they have
competitive advantage. They are exploring the possibility of entering into or further expanding in the
European market, which has become particularly attractive after the quota phase-out, although the
Eurozone crisis is taking its toll on demand. Furthermore, due to the political instability and poor
business climate in Nepal at present, some exporters contended that they were at a “full potential
utilization” phase and that product diversification was not a feasible step at this stage. Any further
5
10
15
20
25
30
35
40
45
US$
/kg
Chapter 61 (US)
Chapter 62 (US)
Apparel (US)
Chapter 61 (EU 15)
Chapter 62 (EU15)
Apparel (EU 15)
expansion of production base or innovation required that the political and business climate of the country
improve dramatically as in availability of power, reduction in diesel costs, reduction in strikes and
shutdowns, among other things. Load shedding, strikes by trade unions and shortage of workers,
including skilled hands, were identified as the most critical constraints to business expansion.
As noted earlier, exporters generally sell to wholesalers in destination markets. Information obtained from
the interviews indicates Nepali firms are price takers. The interviewed exporters reported that the mark-
up over their export price when the product is sold in the retail market in destination countries is at least
100 percent. In an extreme case, a firm selling to Europe mainly artistic, fusion-type unique products
reported that the mark-up could be as high as 14 times in Europe. The exporters appear reconciled to the
substantial mark-ups in destination markets over their export prices. They argue that they do not have the
bargaining power to negotiate a higher price for their ware. They do not have a strategy to capture a
higher value along the value chain.
8. Conclusion
Nepal’s textiles and clothing sector depicts contrasting trends in exports. While the non-carpet textiles
segment has recorded rapid growth in exports, predominantly destined for India, the clothing sector’s
exports have been devastated by the global quota phase-out. Even as apparel exports to the US, Nepal’s
major apparel market until the quota phase-out, have plunged, those to the EU are on a rising trend,
although not enough to offset the decline in exports to the US. The EU absorbed 54 percent of Nepal’s
clothing exports in 2010/11. Apparel exports to India are stable at around 10 percent of total apparel
exports, but are also on a declining trend. Apparel exports to other SAARC countries are negligible. A
substantial proportion of RMG firms reliant on the US market have been driven out of business altogether.
Those still in business were either not overly reliant on the US market in the first place, or have
demonstrated their resilience by diversifying to the European or Indian markets, or, even if still mainly
catering to the US market, were able to maintain their quality and timely delivery credentials and/or had
their own brand (e.g., in adventure wear). Overall, besides concentration in a few destinations, there is also
a heavy product-wise concentration.
Besides the ATC expiry, worsening domestic business and supply conditions—notably crippling power
cuts, deterioration in industrial relations, and skilled labour shortage—have also contributed to the poor
performance of this sector. The EU is an attractive market where Nepali products enjoy duty-free access
with relaxed rules of origin by virtue of Nepal’s LDC status. Products in high demand in the EU and in
which Nepali manufacturers have exhibited some degree of competitive advantage are relatively high-
value products fashioned through a fusion of designs and styles, having a higher potential of sourcing raw
materials domestically, boasting a higher domestic value addition than the average RMG product exported
elsewhere, demanded for the uniqueness of their designs, styles, patterns and handwork, and relatively less
affected by competitive price pressure. Exports to India are eligible for duty-free access provided there is a
minimum of 30 percent domestic value addition and a change in tariff heading at HS four-digit level. The
rules of origin in accessing the Indian market are less of a problem than para-tariff barriers (such as
countervailing duties) and technical barriers to trade (e.g., lab test for fabrics).
The readymade garment sector, the largest component of Nepal’s apparel sector, is predominantly
dependent upon imports for fabrics and accessories. The materials are either not produced domestically or
even if produced domestically do not meet the required quality and are not cost competitive—the
exceptions being some small-scale exporters catering to the EU market which use only or mostly domestic
materials (from yarn to fabric) and specialize in clothes with a lot of handwork. India and China are the
top two import sources overall, followed by Southeast and East Asian countries. Imports from other South
Asian countries are negligible, and are mostly accessories.
Firms generally have the freedom to decide where to source from. Their sourcing patterns are determined
by quality, price and timely delivery. On all these parameters, exporters find the rest of South Asia to be

not up to the mark. Even India is not found competitive (in terms of quality and price) in several types of
materials, prompting Nepali RMG exporters to source the materials from outside the region although the
cost and time of transporting the materials are lower if imported from India. The reason given is that India
cannot supply fabrics such as polyester, nylon, spandex, corduroy and jogging suit fabric as well as
accessories (e.g., zippers) with the quality and design/style required and there is little or no demand for
clothing made of such Indian materials in the US and European markets. In general, China is posing stiff
competition to India, even in cotton fabric. As regards clothing exports to India, the kinds of fabrics used
are expensive (e.g., linen, polyester, cotton), and hence the materials are sourced from China and Taiwan,
among others. Transport and transit constraints are adding to the cost and time of import of raw materials
and export of final goods. They are also impeding possible diversification of import sources, even within
South Asia.
The lead of exporting to western markets is 120-135 days, with ocean transport taking a third of the time
(35-40 days). Air transport substantially increases cost but is used generally as an emergency measure in
order to deliver on time in response to adverse developments such as strikes and shutdowns inside or
outside the factory. Air transport is oftentimes the only option when the consignment is too small to secure
a standard full container. The generally higher prices received in the European market make air transport
comparatively viable when exporting there than elsewhere. The complete dependence on Kolkata port as a
gateway for export/import to/from third countries is significantly adding to trading time and cost because
of the compulsion of transshipment of cargo in Singapore or Colombo.
Most RMG manufacturers are located in Kathmandu valley, with factories in border areas closing down
due to, among others, security problem. Exporters that mostly cater to western markets generally do not
see any significant net advantage of relocating to the border at the moment, although the transport cost and
time of import would be lower—an important reason being the need to ship their exports by air from time
to time while the country’s only international airport is located in Kathmandu. Exporters mostly selling in
the India market, however, see some advantage in relocating to the border areas as they would be closer to
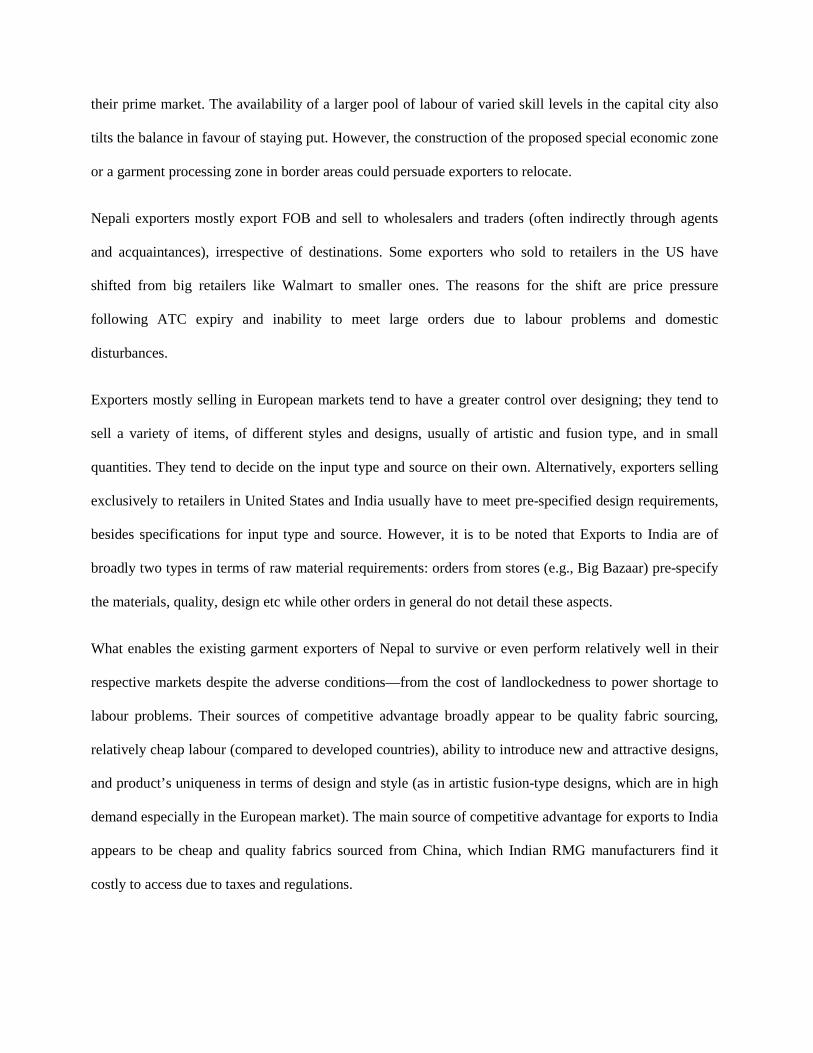
their prime market. The availability of a larger pool of labour of varied skill levels in the capital city also
tilts the balance in favour of staying put. However, the construction of the proposed special economic zone
or a garment processing zone in border areas could persuade exporters to relocate.
Nepali exporters mostly export FOB and sell to wholesalers and traders (often indirectly through agents
and acquaintances), irrespective of destinations. Some exporters who sold to retailers in the US have
shifted from big retailers like Walmart to smaller ones. The reasons for the shift are price pressure
following ATC expiry and inability to meet large orders due to labour problems and domestic
disturbances.
Exporters mostly selling in European markets tend to have a greater control over designing; they tend to
sell a variety of items, of different styles and designs, usually of artistic and fusion type, and in small
quantities. They tend to decide on the input type and source on their own. Alternatively, exporters selling
exclusively to retailers in United States and India usually have to meet pre-specified design requirements,
besides specifications for input type and source. However, it is to be noted that Exports to India are of
broadly two types in terms of raw material requirements: orders from stores (e.g., Big Bazaar) pre-specify
the materials, quality, design etc while other orders in general do not detail these aspects.
What enables the existing garment exporters of Nepal to survive or even perform relatively well in their
respective markets despite the adverse conditions—from the cost of landlockedness to power shortage to
labour problems. Their sources of competitive advantage broadly appear to be quality fabric sourcing,
relatively cheap labour (compared to developed countries), ability to introduce new and attractive designs,
and product’s uniqueness in terms of design and style (as in artistic fusion-type designs, which are in high
demand especially in the European market). The main source of competitive advantage for exports to India
appears to be cheap and quality fabrics sourced from China, which Indian RMG manufacturers find it
costly to access due to taxes and regulations.

Nepali exporters are price takers; they have to sell their products at the price (in foreign currency unit)
specified by the buyers. The prices for which their products sell ultimately in retail outlets in the US and
the EU are at least twice and as high as 15 times the price they receive. They seem to be reconciled to this
huge mark-up and have no strategy to move up the value chain and capture more value in the process.
Exporters to the US and India tend to produce a narrower range of products, sticking to a fixed design and
style, whereas exporters to the EU tend to differentiate their products along their vertical dimension,
exploring a variety of designs and styles. Overall, exporters, cutting across destinations, do not appear to
be inclined towards expanding their exports through product diversification, their focus being instead on
expanding along the intensive margin, where they see considerable untapped potential. However, the
relative attraction of the EU market is inducing exporters currently selling to other markets to consider
breaking into that market.
9. Recommendations
9.1 Domestic level
• Speed up the creation of special economic zones, including a garment processing zone (which would
help address several supply-side constraints, including inadequate power supply, and
strikes/disturbances).
• Establish a fashion technology institute in a public-private partnership mode for the production of
quality human resources for the apparel manufacturing sector, as envisioned in the Trade Policy 2009.
This would give domestic firms greater control over design, and hence capture a higher value in the
value chain.
• Facilitate (by Government of Nepal) the creation and promotion of brands by Nepali exporters (for
example, in artistic and stylish women’s and girls’ wear in the European market).

• Also introduce vocational training programmes to address the skill deficit in the workforce as per the
needs of the apparel industry, as well as training for developing managerial skills. These will help
increase productivity.
• Conduct (by Trade and Export Promotion Centre in collaboration with Garment Association of Nepal)
period market research and constant market monitoring to keep the industry abreast of changing
consumer tastes and preferences, market access conditions and competition situation (which would
help exporters diversify geographically as well as product-wise). Provide market information (on both
export destination and import source) to entrepreneurs.
• Prepare a strategy (by Garment Association of Nepal in coordination with Government of Nepal) to
increase apparel exports to India with an assessment of the possible preference erosion for Nepali
apparel in the Indian market arising from India’s granting in 2011 of duty-free market access to most
products, including apparel, produced in South Asian LDCs.
• Simplify (by Government of Nepal) the procedures under the cash incentive scheme.
• Provide facilities to exporters to conduct promotional activities.
• Provide incentives to manufacturers to invest in designing.
• Identify the potential for building domestic capacity to supply inputs to the apparel industry, and
prepare a feasible strategic action plan (by Government of Nepal in partnership with the textiles and
clothing industry) to build such capacity. Among others, explore how the existing domestic spinning
and textiles industry, which has shown robust export performance, can be integrated with the export-
oriented apparel industry.
• Step up economic diplomacy to effectively secure and operationalize agreed-upon alternative transit
routes and gateway ports (in India and Bangladesh), which will help improve cost competitiveness as
well as reduce lead times. Alternative transit routes and gateway ports (e.g., Vishakhapatnam port in
India, Mongla port in Bangladesh, the Rohanpur-Singhabad route) will help exports destined for extra-

regional markets, reduce time and cost of imports from extra-regional sources as well as make
sourcing raw materials from within the region more efficient and attractive.
• Take measures, including economic diplomacy (by Government of Nepal), to make possible the
issuance of through bills of lading for cargo to and from the rail-linked inland container depot in
Birgunj.
• Improve the overall business and investment climate (by improving the security situation, particularly
in border areas, reining in politically motivated trade unionism, and introducing and implementing a
credible plan to reduce load shedding (by, among others, ending the pro-export bias of hydropower
policy in practice). This is essential for Nepali exporters to be able to cater to bulk orders placed by
retailers.
9.2 Regional level
• Create an effective mechanism under SAFTA for addressing para-tariff and non-tariff barriers.
• Establish a South Asian transit-transport arrangement and improve the regional transport infrastructure
and customs facilities. Implement the recommendations of the SAARC Multi-modal Transport Study.
• Enhance capacity to produce specific raw materials and inputs being imported by Nepal’s apparel
industry from outside the region (from fabrics to accessories).
• Encourage exchange of information and ideas among entrepreneurs of the South Asian textiles and
clothing industry to explore avenues of collaboration.
• Introduce a South Asian Investment Agreement to promote intra-regional investment.
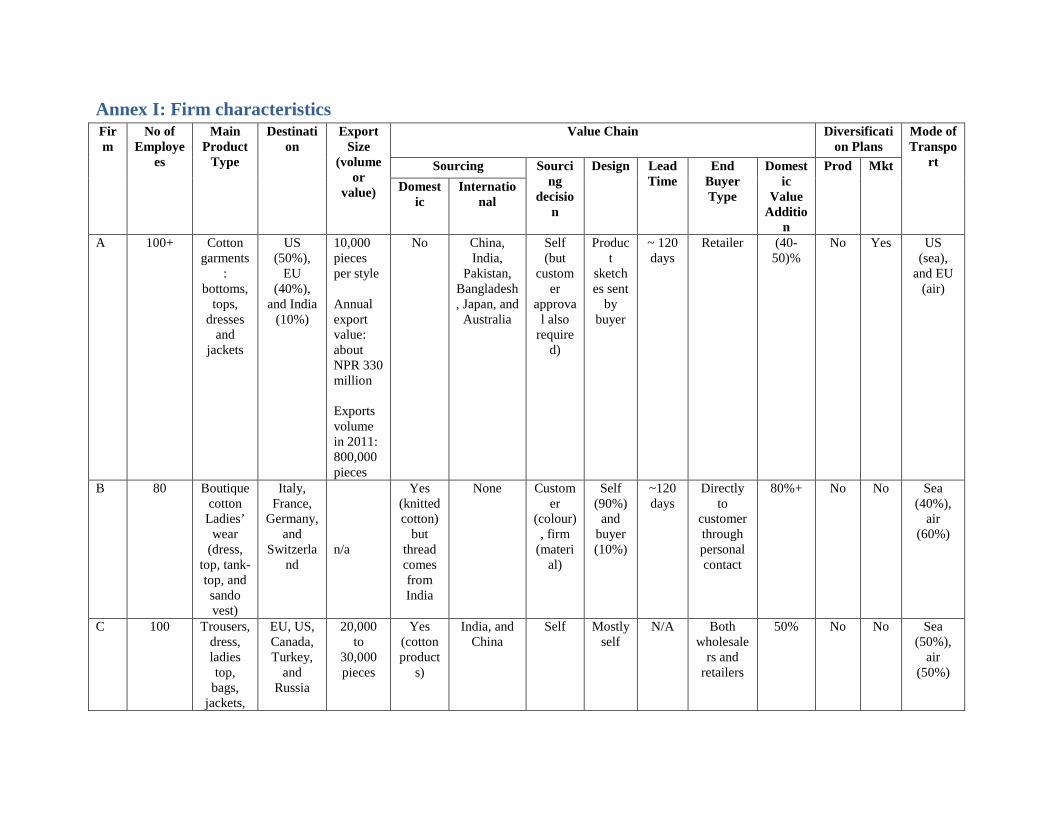
Annex I: Firm characteristics Firm
No of Employe
es
Main Product
Type
Destination
Export Size
(volume or
value)
Value Chain Diversification Plans
Mode of Transpo
rt Sourcing Sourcing
decision
Design Lead Time
End Buyer Type
Domestic
Value Additio
n
Prod Mkt Domest
ic Internatio
nal
A 100+ Cotton garments
: bottoms,
tops, dresses
and jackets
US (50%),
EU (40%),
and India (10%)
10,000 pieces per style Annual export value: about NPR 330 million Exports volume in 2011: 800,000 pieces
No China, India,
Pakistan, Bangladesh, Japan, and
Australia
Self (but
customer
approval also
required)
Product
sketches sent
by buyer
~ 120 days
Retailer (40-50)%
No Yes US (sea),
and EU (air)
B 80 Boutique cotton
Ladies’ wear
(dress, top, tank-top, and sando vest)
Italy, France,
Germany, and
Switzerland
n/a
Yes (knitted cotton)
but thread comes from India
None Customer
(colour), firm
(material)
Self (90%)
and buyer (10%)
~120 days
Directly to
customer through personal contact
80%+ No No Sea (40%),
air (60%)
C 100 Trousers, dress, ladies top,
bags, jackets,
EU, US, Canada, Turkey,
and Russia
20,000 to
30,000 pieces
Yes (cotton product
s)
India, and China
Self Mostly self
N/A Both wholesale
rs and retailers
50% No No Sea (50%),
air (50%)
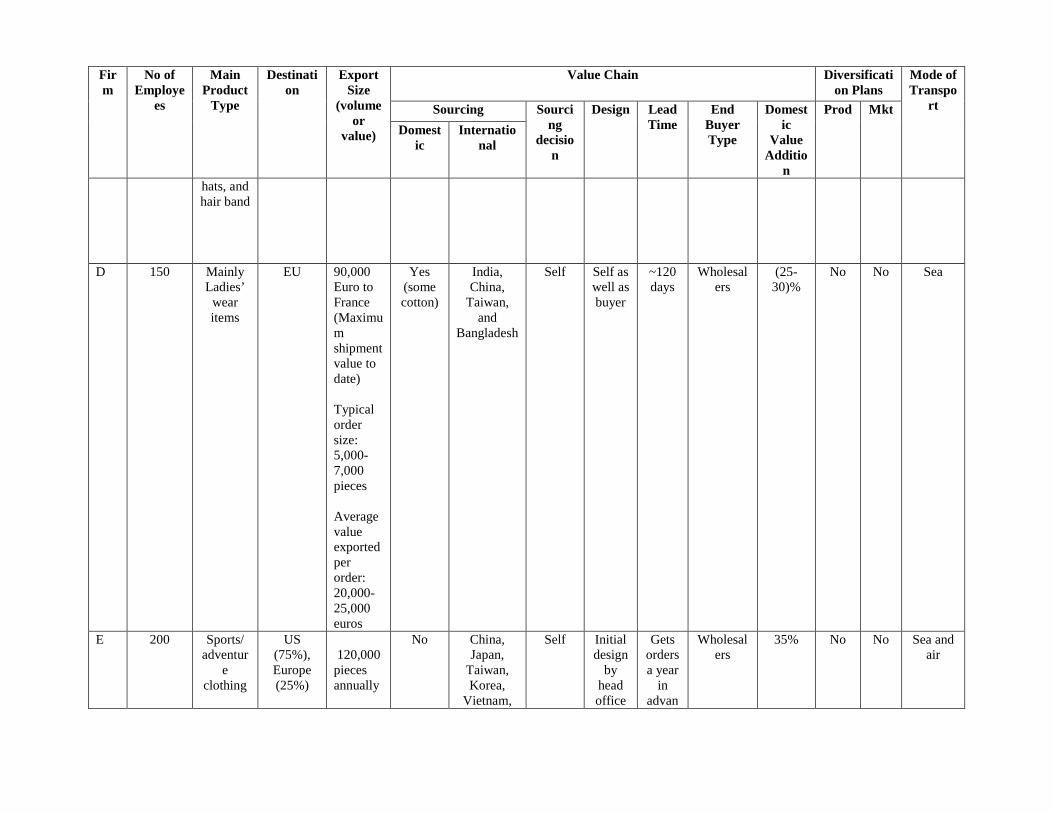
Firm
No of Employe
es
Main Product
Type
Destination
Export Size
(volume or
value)
Value Chain Diversification Plans
Mode of Transpo
rt Sourcing Sourcing
decision
Design Lead Time
End Buyer Type
Domestic
Value Additio
n
Prod Mkt Domest
ic Internatio
nal
hats, and hair band
D 150 Mainly Ladies’
wear items
EU 90,000 Euro to France (Maximum shipment value to date) Typical order size: 5,000-7,000 pieces Average value exported per order: 20,000-25,000 euros
Yes (some cotton)
India, China,
Taiwan, and
Bangladesh
Self Self as well as buyer
~120 days
Wholesalers
(25-30)%
No No Sea
E 200 Sports/ adventur
e clothing
US (75%), Europe (25%)
120,000 pieces annually
No China, Japan,
Taiwan, Korea,
Vietnam,
Self Initial design
by head office
Gets orders a year
in advan
Wholesalers
35% No No Sea and air

Firm
No of Employe
es
Main Product
Type
Destination
Export Size
(volume or
value)
Value Chain Diversification Plans
Mode of Transpo
rt Sourcing Sourcing
decision
Design Lead Time
End Buyer Type
Domestic
Value Additio
n
Prod Mkt Domest
ic Internatio
nal
US in US and
finalized by Nepal office
ce
F 110 Variety of
tourist/ fashionable items of cotton
and polyester
US, Spain, France,
and Germany
50,000 piece (maximum order to date)
No India and China
Self Self as well as buyer
N/A Both Wholesalers and retailers
(25-30)%
No No N/A
G 100 Cotton shorts, pants
(men's)
India Annual exports: NPR 40-50 million Average order size: 5,000 pieces
No India and China
Self Design set by Big
Bazaar
~90 days
Retailer (40-50)%
No Yes N/A
H 27 Cotton jackets,
tops, trousers, dresses
US, Germany,
UK 2,000 to 15,000 pieces
Yes (zippers
)
China Self Mostly self
N/A Traders and
wholesalers
N/A No No Sea (10%) and air (90%)

References Action Aid and SAWTEE. 2007. “Impact of textiles and clothing quota phase out on Nepal: A study from human development perspective.” Kathmandu, Nepal.
CBS. 2012. National Accounts Statistics for 2011/12, Central Bureau of Statistics, Government of Nepal, Kathmandu, Nepal.
Chakra Infrastructure Consultants (CIC). 2001. Review of Progress in the Development of Transit Transport Systems in the India, Nepal and Bhutan Subregion. Available at: www.unctad.org
DOI. 2005. Industrial statistics, fiscal year 2061/062 (2004/2005), Ministry of Industry, Department of Industry Planning, Monitoring, and Evaluation division, Kathmandu, Nepal.
DOI. 2006. Industrial statistics, fiscal year 2062/063 (2005/2006), Ministry of Industry, Department of Industry Planning, Monitoring, and Evaluation division, Kathmandu, Nepal.
DOI. 2007. Industrial statistics, fiscal year 2063/064 (2006/2007), Ministry of Industry, Department of Industry Planning, Monitoring, and Evaluation division, Kathmandu, Nepal.
DOI. 2008. Industrial statistics, fiscal year 2064/065 (2007/2008), Ministry of Industry, Department of Industry Planning, Monitoring, and Evaluation division, Kathmandu, Nepal.
DOI. 2009. Industrial statistics, fiscal year 2065/066 (2008/2009), Ministry of Industry, Department of Industry Planning, Monitoring, and Evaluation division, Kathmandu, Nepal.
DOI. 2010. Industrial statistics, fiscal year 2066/067 (2009/2010), Ministry of Industry, Department of Industry Planning, Monitoring, and Evaluation division, Kathmandu, Nepal.
DOI. 2011. Industrial statistics, fiscal year 2067/068 (2010/2011), Ministry of Industry, Department of Industry Planning, Monitoring, and Evaluation division, Kathmandu, Nepal.
EUROSTAT <http:// epp.eurostat.ec.europa.eu/portal/page/portal/eurostat/home>
Kharel, Paras. 2011. “Nepal: Trapped in transit travails”, in South Asian Journal 34, October-December 2011.
MOCS. 2010. Trade policy, 2009, Ministry of Commerce and Supplies, Kathmandu, Nepal.
MOICS. 2005. Procedural manual for foreign investment in Nepal, Ministry of Industry, Commerce and Supplies, Department of Industries, Kathmandu, Nepal.
Nepal Rastra Bank (http://www.nrb.org.np)
Staritz, Cornelia. 2011. “Making the cut: Low-income countries and the global clothing value chain in a post-quota and post-crisis world.” The World Bank, Washington, D.C.
TEPC. 2011. Nepal Foreign Trade Statistics, Trade and Export Promotion Center, Pulchowk, Lalitpur, Nepal http://www.tepc.gov.np

United States International Trade Commission <http://dataweb.esitc.gov>
WITS (World Integrated Trade Solution) UN COMTRADE < http://wits.worldbank.org/wits>